Abstract
Chronic neuroinflammation is a pathogenic component of Alzheimer’s disease (AD) that may limit the ability of the brain to clear amyloid deposits and cellular debris. Tight control of the immune system is therefore key to sustain the ability of the brain to repair itself during homeostasis and disease. The immune‐cell checkpoint receptor/ligand pair PD‐1/PD‐L1, known for their inhibitory immune function, is expressed also in the brain. Here, we report upregulated expression of PD‐L1 and PD‐1 in astrocytes and microglia, respectively, surrounding amyloid plaques in AD patients and in the APP/PS1 AD mouse model. We observed juxtamembrane shedding of PD‐L1 from astrocytes, which may mediate ectodomain signaling to PD‐1‐expressing microglia. Deletion of microglial PD‐1 evoked an inflammatory response and compromised amyloid‐β peptide (Aβ) uptake. APP/PS1 mice deficient for PD‐1 exhibited increased deposition of Aβ, reduced microglial Aβ uptake, and decreased expression of the Aβ receptor CD36 on microglia. Therefore, ineffective immune regulation by the PD‐1/PD‐L1 axis contributes to Aβ plaque deposition during chronic neuroinflammation in AD.
Keywords: APP, innate immune system, microglia, PD‐1 knockout mice, PS1 mice
Subject Categories: Immunology, Neuroscience
The immune‐checkpoint receptor/ligand pair PD‐1/PD‐L1 sustains phagocytic function of microglia to prevent Aβ plaque deposition in APP/PS mouse models and patient tissues.

Introduction
Microglia, the resident immune cells of the central nervous system, control immune functions, modulate synaptic plasticity, and are supposed to remove cellular debris in the brain (Hanisch & Kettenmann, 2007). In Alzheimer's disease (AD), they react on an endogenous molecular pattern, the amyloid‐β (Aβ) peptide, that deposits in senile plaques (Heneka et al, 2015). The resulting chronic activation of the innate immune system in the brain is considered to be an integral part of the disease (Heneka et al, 2015). Acute inflammation is normally resolved by the activation of immune checkpoints that maintain immune homeostasis and tolerance (Francisco et al, 2010). A candidate immune checkpoint is the receptor programmed cell death‐1 (PD‐1; gene name Pdcd1) from the CD28 family of receptors, known for its inhibitory function during autoimmune diseases and T‐cell activation (Nishimura et al, 1999), whose expression has been reported in microglia (Ren et al, 2011; Yao et al, 2014; Holtman et al, 2015). PD‐1 is a type I transmembrane protein with an intracellular domain containing an immunoreceptor tyrosine‐based inhibitory motif and an immunoreceptor tyrosine‐based switch motif. Engagement of PD‐1 by the ligands PD‐L1 (gene name Cd274) or PD‐L2, also type I transmembrane proteins, results in the recruitment of the tyrosine phosphatases SHP‐1 and SHP‐2 to one of the intracellular motifs, which dephosphorylates and inactivates effector proteins (Okazaki et al, 2001; Chemnitz et al, 2004). The PD‐1/PD‐L1 pathway received a lot of attention in cancer research as several tumors including gliomas can upregulate PD‐L1 expression and thereby evade immune surveillance by engaging PD‐1 on T cells (Wang et al, 2016). The complexity and importance of this pathway is also illustrated by the presence of soluble PD‐L1 (sPD‐L1) not only in cancer patients but also in patients with autoimmune and chronic inflammatory disorders, as well as pulmonary diseases. To date, the exact biological function of sPD‐L1 remains unknown, but it is predicted to act as a negative regulatory signal in most cases (Bailly et al, 2021). Loss of PD‐1 was shown to promote the development of autoimmune diseases (Nishimura et al, 2001; Wang et al, 2005), but little is known about its function in the brain. The PD‐1 ligand PD‐L1 is expressed on microglia and on astrocytes (Lipp et al, 2007; Schachtele et al, 2014), and the PD‐L1/PD‐1 inhibitory pathway plays a role in the inflammatory reaction of microglia (Ren et al, 2011; Yao et al, 2014). Induction of inflammation by systemic administration of LPS resulted in increased levels of PD‐L1 in the brain (Abellanas et al, 2019), but the expression in AD has not been reported.
Here, we show increased levels of PD‐L1 in the CSF of AD patients. Our analysis reveals PD‐L1 expression in astrocytes and PD‐1 expression in microglia close to amyloid plaques in AD patients and APP/PS1 mice. Moreover, we identify PD‐1/PD‐L1 signaling as an important factor in Aβ phagocytosis with PD‐1 knockout resulting in increased Aβ levels, amyloid plaques, and cognitive deficits in APP/PS1 mice together with an inflammatory response in PD‐1‐deficient microglia. In short, we identified the PD‐1/PD‐L1 inhibitory pathway as an important modulator of disease pathology in AD.
Results
Expression of PD‐L1 in the brain
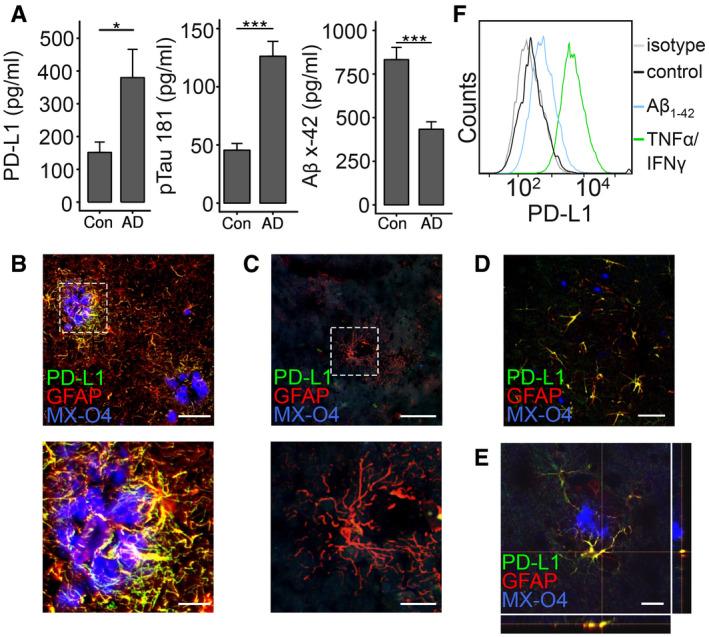
Testing whether PD‐L1 is changed under chronic inflammatory conditions during AD in the cerebrospinal fluid (CSF), we observed increased levels in AD patients (P = 0.0296, t = −2.486, df = 11.378) versus control patients (Fig 1A). Following up on the source of PD‐ L1 in brain tissue, PD‐L1 expression was detected in astrocytes in particular in the vicinity of amyloid plaques in AD (Fig 1B, Appendix Fig S1), but not in control patients even so GFAP‐positive cells were observed (Fig 1C, Appendix Fig S1). This finding was confirmed in the APP/PS1 mouse model of AD as astrocytic expression of PD‐L1 around amyloid plaques was observed not only at 9 months of age (Fig 1D, Appendix Fig S1) but also at early time points (4 months of age) when very few amyloid plaques are present (Fig 1E, Appendix Fig S1), implying that upregulation of PD‐L1 is an early phenomenon. Astrocytes did not show detectable amounts of PD‐L1 under basal conditions but stimulation with aggregated, synthetic Aβ1‐42 or a mixture of the inflammatory mediators interferon‐γ and tumor necrosis factor‐α (TNF‐α) increased the expression of PD‐L1 on the cell surface (Fig 1F). Aβ may therefore be able to directly induce the expression of PD‐L1 in astrocytes and explain the increase in PD‐L1 in the CSF of AD patients.
Figure 1. Expression of PD‐L1 in AD and in APP/PS1 transgenic mice.
-
AELISA quantification of PD‐L1, pTau 181, and Aβx‐42 in the CSF of control and AD patients (n = 10 ± SEM, Student's t‐test, *P < 0.05 and ***P < 0.001, PD‐L1: t = 2.47 df = 18, Aβx‐42: t = 4.83 df = 18, pTau 181: t = 5,768 df = 18).
-
B, C(B) Colocalization of PD‐L1 and GFAP in AD and (C) in control patients (MX‐O4 = amyloid deposits, upper picture: bar = 100 µm, lower picture: bar = 30 µm).
-
DImmunohistochemical detection of PD‐L1 and GFAP in 9‐month‐old female APP/PS1 mice (bar = 50 µm).
-
EImmunohistochemical detection of PD‐L1 and GFAP in 4‐month‐old female APP/PS1 mice (bar = 20 µm).
-
FInduction of PD‐L1 on astrocytes using 1 μM aggregated Aβ1‐42 or 10 μg/ml TNF‐α/100 U/μl IFN‐γ analyzed by flow cytometry.
Shedding of PD‐L1 from astrocytes
Since PD‐L1 was found in the CSF, one might speculate that a soluble form of PD‐L1 exists that is released from the plasma membrane by a membrane‐localized protease (Reiss & Saftig, 2009). Those shedding events are commonly succeeded by an intramembrane cleavage of the membrane‐associated stub by the γ‐secretase complex (Edwards et al, 2008). Treatment of C6 astrocytoma cells expressing C‐terminally myc‐tagged PD‐L1 (PD‐L1‐myc) with the γ‐secretase inhibitor DAPT resulted in the formation of a C‐terminal fragment of PD‐L1 (PD‐L1‐CTF) (Fig 2A). Similar results were obtained in transfected HEK293 cells (Appendix Fig S2). Further, PD‐L1‐CTF accumulated in HEK293 cells transfected with PD‐L1‐myc expressing a dominant negative mutant form of human PS1 (hPS1D257A), the catalytical center of the γ‐secretase complex (Wolfe et al, 1999), in comparison with cells overexpressing wild‐type human PS1 (Fig 2B and C). These results suggest that a luminal, juxtamembrane cleavage of PD‐L1 occurred, generating the γ‐secretase substrate PD‐L1‐CTF. PD‐1‐myc did not form any C‐terminal fragments in HEK293 cells (Appendix Fig S3), suggesting that the extracellular domain of PD‐1 is not secreted in these cells.
Figure 2. Secretion of soluble PD‐L1 from astrocytes.
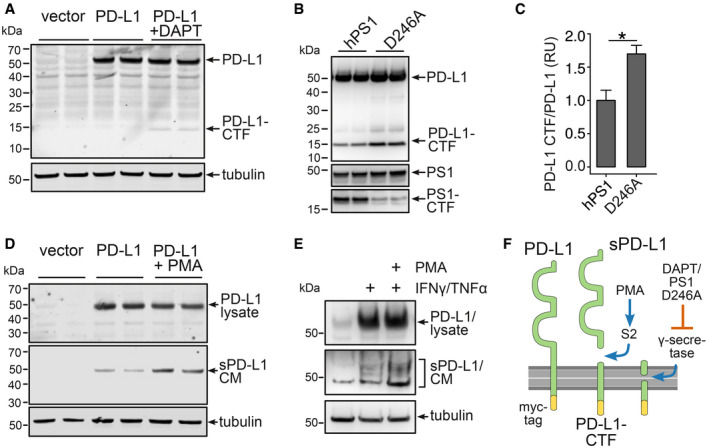
- C6 cells expressing PD‐L1‐myc treated with the γ‐secretase inhibitor DAPT for 18 h. PD‐L1 was detected using a myc antibody.
- Immunoblot of HEK293 cells expressing PD‐L1‐myc and presenilin 1 (hPS1) or a presenilin 1 dominant negative mutant (hPS1 D246A).
- Evaluation of three independent experiments of B (n = 3, mean + SEM, Student's t‐test, *P = 0.012, t = 3.4803, df = 4).
- 18 h 1 μM PMA treatment of C6 cells expressing PD‐L1‐myc. Secretion of PD‐L1 in the conditioned medium (CM) was detected using antibody AF1019.
- Mouse astrocytes were incubated for 48 h with 1 μM PMA and 10 μg/ml TNF‐α/100 U/μl IFN‐γ. Lysates and the CM were immunoblotted using antibody AF1019.
- Scheme of PD‐L1 secretion: PMA‐induced S2 cleavage results in the formation of sPD‐L1 and a C‐terminal fragment (PD‐L1‐CTF), that is cleaved by γ‐secretase.
Increased secretion of PD‐L1 (sPD‐L1) into the conditioned medium (CM) could be achieved by incubating C6 cells expressing PD‐L1‐myc with the protein kinase C activator PMA (Fig 2D) and in mouse astrocytes after induction of PD‐L1 using a combination of interferon‐γ and TNF‐α with or without PMA (Fig 2E). Further, we were able to reduce the sPD‐L1‐to‐PD‐L1 ratio by introducing either deletions or a point mutation in the luminal, juxtamembrane region of PD‐L1 in HeLa cells (Appendix Fig S4A–C) underlining the importance of this region for PD‐L1 cleavage. Immunocytochemical detection of these mutants in transfected HeLa cells revealed an accumulation of the D1 and D2 mutant at the cell surface (Appendix Fig S4D), suggesting inefficient cleavage and release from the plasma membrane. Narrowing down potential proteases, we observed reduced secretion of PD‐L1 after knockdown of BACE1 and ADAM17 in HEK293 cells (Appendix Fig S5). These results demonstrate that PD‐L1 is released from the cell surface by juxtamembrane cleavage of a PMA‐inducible protease and the remaining C‐terminal stub is further processed by the γ‐secretase complex presumably leading to the generation of a PD‐L1 intracellular fragment (Fig 2F). Similar S2 cleavages are mediated by members of the metalloproteinase family (Reiss & Saftig, 2009) and have been implicated in a variety of inflammatory processes (Edwards et al, 2008).
Expression of PD‐1 in microglia
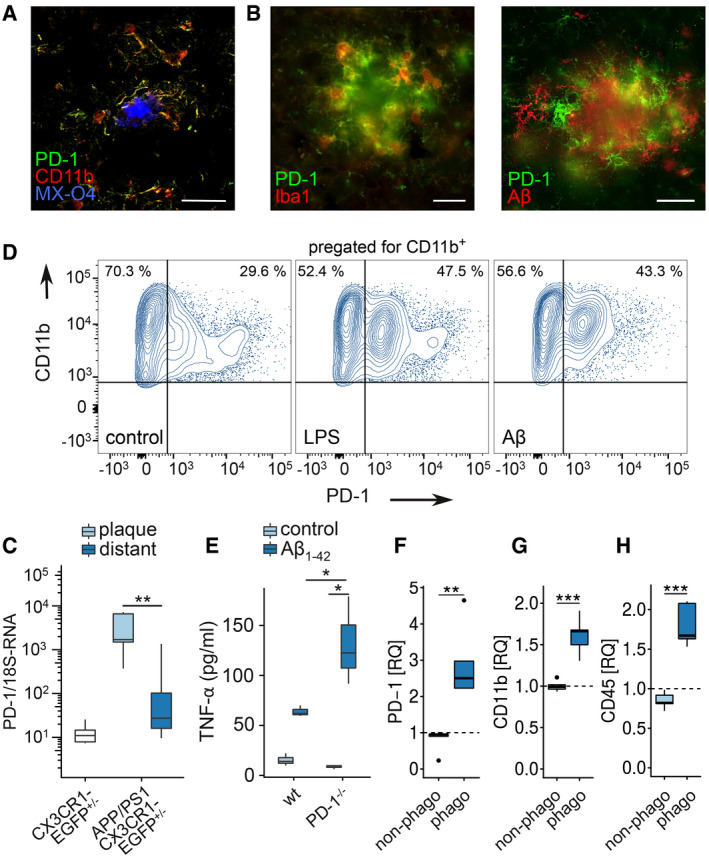
Determination of PD‐1 expression in the brain revealed upregulation in AD and in 9‐month‐old APP/PS1 mice in plaque‐associated microglia (Fig 3A and B). In support, increased transcription of PD‐1 mRNA was attributed to laser micro‐dissected cells that were close (< 100 µm) to amyloid plaques compared with plaque‐distant cells (Fig 3C), suggesting that the interaction with Aβ deposits causes PD‐1 induction. In agreement with this, disease‐associated molecular patterns such as LPS and aggregated, synthetic Aβ1‐42 induced PD‐1 expression in microglia in vitro (Fig 3D). Further, treatment of PD‐1‐deficient microglia with aggregated, synthetic Aβ1‐42 increased the secretion of the pro‐inflammatory cytokine TNF‐α as compared to wild‐type cells in vitro (Fig 3E), suggesting that PD‐1 limits the inflammatory reaction. Finally, APP/PS1 mice injected with the amyloid dye methoxy‐XO4 (MX‐O4) showed increased expression of PD‐1 in phagocytically active microglia (MX‐O4+) in comparison with MX‐O4− cells (Fig 3F) along with the cell surface markers CD11b (Fig 3G) and CD45 (Fig 3H) at 8 months of age in vivo.
Figure 3. PD‐1 expression in APP/PS1 and AD.
-
AColocalization of PD‐1 and CD11b (MX‐04 = methoxy‐XO4, stains amyloid deposits) in AD by immunohistochemistry (bar = 50 µm).
-
BColocalization of PD‐1 and Iba1 or PD‐1 and Aβ in a female APP/PS1 mouse at 9 months of age by immunohistochemistry (bar = 20 µm).
-
CPD‐1 mRNA quantification in laser‐dissected microglia from CX3CR1‐EGFP+/− mice (wt) or plaque‐associated (plaque) and plaque‐distant (distant) microglia from APP/PS1 CX3CR1‐EGFP+/− mice (n = 6, Mann–Whitney test, **P = 0.0043, W = 35).
-
DInduction of PD‐1 on CD11b+ microglia in vitro using 1 μM Aβ or 100 ng/ml LPS, analyzed by flow cytometry.
-
EELISA analysis of TNF‐α secretion by wild‐type (wt) and PD‐1−/− microglia induced by 0.5 µM Aβ1‐42 for 6 h in vitro (n = 3 biological replicates, one‐way ANOVA (df = 1, F = 8.29, P = 0.021), Tukey's HSD, *P < 0.05).
-
F–HMicroglia from methoxy‐XO4‐injected, 8‐month‐old female, wild‐type (wt), and APP/PS1 mice were analyzed (F) for PD‐1 (n = 5 biological replicates per group, one‐way ANOVA (df = 2, F = 13.99, P = 0.0013), Tukey's HSD, **P < 0.01), (G) for CD11b (n = 5 biological replicates per group, one‐way ANOVA (df = 2, F = 30.06, P = 5.47 × 10⁻⁵), Tukey's HSD, ***P < 0.001), and (H) for CD45 by flow cytometry (n = 5 biological replicates per group, one‐way ANOVA (df = 1, F = 24.96, P = 0.00013), Tukey's HSD, ***P < 0.001) and normalized to the expression of wild‐type mice (represented by dashed lines).
Data information: (C, E–H) Central bands represent median, boxes show interquartile range (IQR), and whiskers define the ± 1.5xIQR.
PD‐1‐deficient APP/PS1 mice show increased plaque pathology
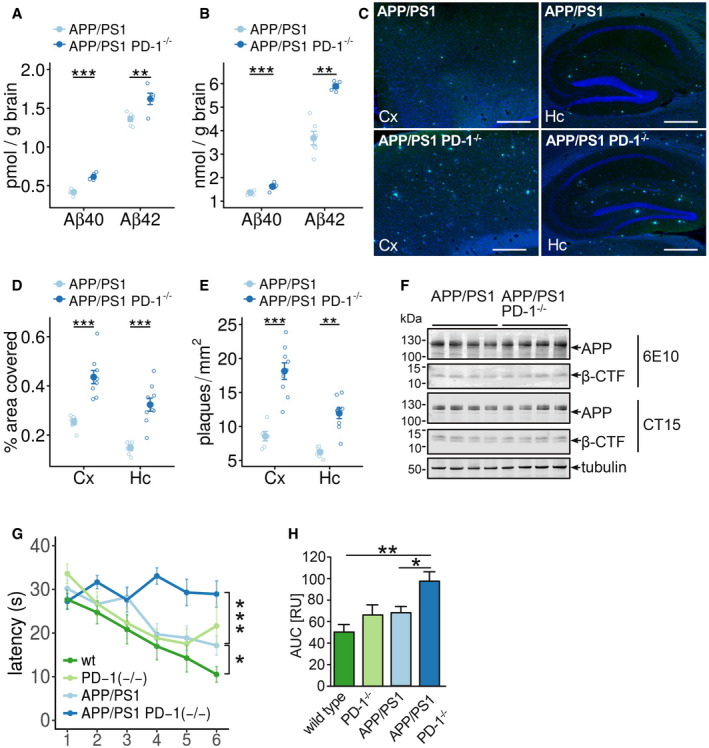
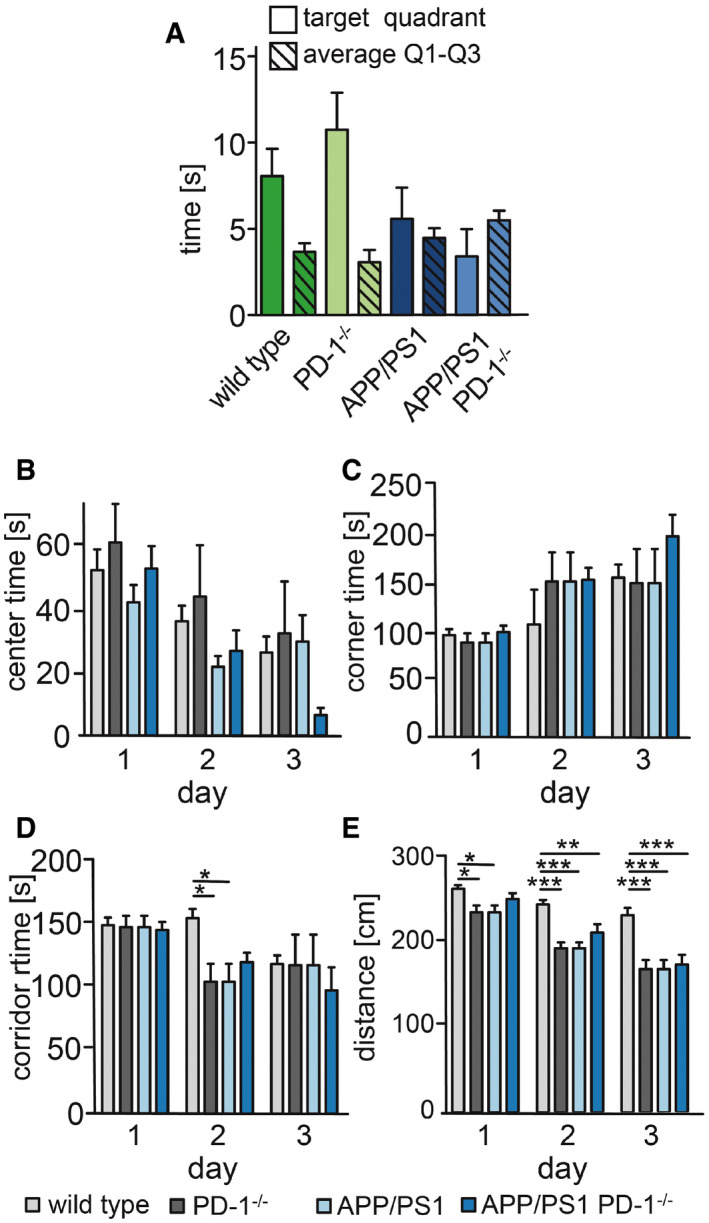
In line with the correlation of PD‐1 expression with Aβ uptake in microglia, testing whether PD‐1 deficiency affects the pathology in APP/PS1 mice revealed increased levels of Aβx‐40 and Aβx‐42 in soluble (RIPA‐soluble) and insoluble (SDS‐soluble) brain fractions at 9 months of age (Fig 4A and B). Accordingly, cortical and hippocampal plaque numbers and area in APP/PS1 PD‐1−/− mice were elevated (Fig 4C–E, Appendix Fig S6). Interestingly, these changes were independent of changes in the expression of the APP transgene and the formation of the C‐terminal fragments of APP (Figs 4F and EV1) pointing toward a deficit in the removal of Aβ. Increased Aβ generation and concomitant aggregation were shown to have a negative impact on memory function in APP‐transgenic mice (Chen et al, 2000). Accordingly, testing the formation of spatial memory in wild type, PD‐1−/−, APP/PS1, and APP/PS1 PD‐1−/− in the Morris water maze paradigm revealed increased latency at 9 months of age in APP/PS1 PD‐1−/− mice compared with APP/PS1 mice (Figs 4G and H, and EV2), suggesting deterioration of cognitive behavior due to PD‐1 knockout.
Figure 4. Deletion of PD‐1 in the APP/PS1 mouse model aggravates plaque pathology and behavioral deficits.
-
A, BELISA of the (A) RIPA‐soluble fraction of female APP/PS1 and APP/PS1 PD‐1−/− mice for Aβx‐40 (biological replicates with n = 6 for APP/PS1 and n = 5 for APP/PS1 PD‐1−/−, mean ± SEM, one‐way ANOVA (df = 1, F = 0.6, P = 0.45), Tukey's HSD, **P < 0.01, ***P < 0.001) and (B) of the SDS‐soluble fraction (biological replicates with n = 6 for APP/PS1 and n = 5 for APP/PS1 PD‐1−/−, mean ± SEM, one‐way ANOVA (df = 1, F = 32.8, P = 2 × 10⁻⁵), Tukey's HSD, **P < 0.01, ***P < 0.001).
-
CThioflavin T histochemistry from sagittal brain sections in the hippocampus (Hc), and cortex (Cx) of female APP/PS1 and APP/PS1 PD‐1−/− mice. Nuclei were stained using Hoechst 33342 (bar = 500 μm).
-
D, EMice were analyzed for (D) percentage of the covered areas (5 sections per mouse analyzed with the mean representing an individual data point; biological replicates with n = 6 for APP/PS1 and n = 9 for APP/PS1 PD‐1−/−, mean ± SEM, one‐way ANOVA (df = 1, F = 0.905, P = 0.90), Tukey's HSD, ***P < 0.001) and (E) the number of plaques per mm2 (5 sections per mouse analyzed with the mean representing an individual data point; biological replicates with n = 6 for APP/PS1 and n = 9 for APP/PS1 PD‐1−/−, mean ± SEM, one‐way ANOVA (df = 1, F = 4.08, P = 0.054), Tukey's HSD, **P < 0.01, ***P < 0.001).
-
FWestern blot analysis of brain lysates from female APP/PS1 and APP/PS1 PD‐1−/− mice for the expression of APP and APP C‐terminal fragments using antibodies 6E10 (transgene expression) and CT15 (transgene and endogenous expression). Tubulin was used as a loading control.
-
GTime needed to reach the hidden platform (latency in seconds) in the Morris water maze test (mean ± SEM of biological replicates with n = 12 for wt, n = 5 for PD‐1−/−, n = 7 for APP/PS1, and n = 8 for APP/PS1 PD‐1−/−, one‐way ANOVA (df = 3, F = 17.72, P = 1 × 10⁻⁹), Tukey's HSD, *P < 0.05, ***P < 0.001).
-
HAnalysis of the area under the curve (mean + SEM of biological replicates with n = 12 for wt, n = 5 for PD‐1−/−, n = 12 for APP/PS1, and n = 8 for APP/PS1 PD‐1−/−, ANOVA (df = 3, F = 6.98, P = 0.001), *P < 0.05 and **P < 0.01).
Figure EV1. APP expression is unaltered in APP/PS1 PD‐1−/− mice.
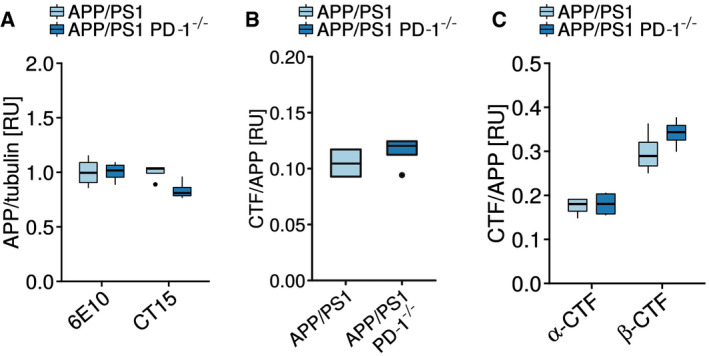
- Quantification of the APP expression normalized to tubulin shown in Fig 4F (biological replicates with n = 4 mice per group, one‐way ANOVA (df = 1, F = 2.776, P = 0.122), Tukey’s post hoc test).
- Quantification of the 6E10 Western blot and the calculation of the APP C‐terminal fragment (CTF)‐to‐APP ratio shown in Fig 4F (biological replicates with n = 4 mice per group, Student's t‐test (t = 0.9435, df = 6), P = 0.3818).
- Quantification of the CT15 Western blot and the calculation of the APP α‐C‐terminal fragment (α‐CTF)‐to‐APP and the APP β‐C‐terminal fragment (β‐CTF)‐to‐APP ratio shown in Fig 4F (biological replicates with n = 4 mice per group, ANOVA (df = 1, F = 1.184, P = 0.298), Tukey HSD).
Data information: (A–C) Central bands represent median, boxes show interquartile range (IQR), and whiskers define the ± 1.5xIQR.
Figure EV2. Behavioral analysis of wild‐type, PD‐1−/−, APP/PS1, and APP/PS1 PD‐1−/− mice.
-
AMice were tested one day after the last trial day for 30 s in the absence of the platform in quadrant 4. The time in the quadrants was measured and averaged for quadrants 1–3.
-
B–EEvaluation of the open field testing for (B) time spend in the center (center time) (ANOVA (F = 0.83, df = 6, P = 0.54), Bonferroni test), (C) corner time (ANOVA (F = 0.47, df = 6, P = 0.93), Bonferroni test), (D) corridor time (ANOVA (F = 1.487, df = 6, P = 0.193), Bonferroni test, *P < 0.05), and (E) distance (ANOVA (F = 0.83, df = 6, P = 0.54), Bonferroni test, *P < 0.05, **P < 0.01, and ***P < 0.001).
Data information: For all panels: mean + SEM of biological replicates with n = 12 for wt, n = 5 for PD‐1−/−, n = 7 for APP/PS1, and n = 5 for APP/PS1 PD‐1−/−.
PD‐1 regulates microglial Aβ uptake and inflammation
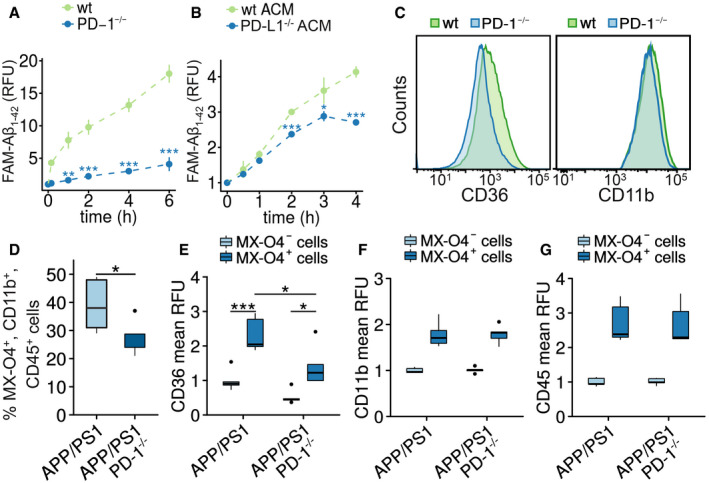
We have shown before that increased PD‐1 expression is localized to phagocytically active microglia (Fig 3F). Therefore, we measured the uptake of fluorescence‐labeled Aβ1‐42 in neonatal wild‐type and PD‐1−/− microglia. Loss of PD‐1 suppressed Aβ uptake in vitro (Fig 5A). Since PD‐L1 expression was observed on astrocytes in AD and APP/PS1 mice, an influence on microglial Aβ uptake was hypothesized. Applying conditioned medium from wild‐type or PD‐L1−/− astrocytic cultures, we observed decreased microglial Aβ uptake (Fig 5 B). While we cannot rule out the involvement of other astrocyte‐derived factors, this suggests that astrocytic PD‐L1 is a modulating factor for microglial Aβ uptake. In addition, a reduction in microglial Aβ phagocytosis was observed by flow cytometry in vitro (Fig EV3A), but, more importantly, PD‐1−/− microglia showed a marked reduction in CD36, a key regulator of Aβ uptake (Bamberger et al, 2003; Yamanaka et al, 2012) and inflammation (El Khoury et al, 2003; Heneka et al, 2013; Sheedy et al, 2013) (Fig 5C). In addition, uptake of fluorescence‐labeled Aβ1‐42 was unchanged by PD‐1−/− microglia independent of whether astrocyte‐conditioned, serum‐free, or serum‐containing medium was applied (Fig EV3B). Levels of the microglial marker CD11b were unaffected in PD‐1−/− microglia (Fig 5C). In agreement with this, in vivo analysis of microglial phagocytosis in APP/PS1 PD‐1−/− mice as measured by the amyloid dye methoxy‐XO4 revealed reduced Aβ content in CD11b+/CD45+ cells as compared to APP/PS1 mice at 9 months of age (Fig 5D). Again, reduced cell surface levels of CD36 were observed in APP/PS1 PD‐1−/− mice (Fig 5E), whereas CD11b and CD45 remained unchanged (Fig 5F and G).
Figure 5. PD‐1 deletion reduces phagocytosis and CD36 expression in microglia.
-
AIn vitro phagocytosis of FAM‐Aβ1‐42 by wild‐type or PD‐1−/− microglia for up to 6 h (mean ± SEM of a technical quadruplicate, Student's t‐test, **P < 0.01 and ***P < 0.001, representative result of an n = 2 biological replicate).
-
BIn vitro phagocytosis of FAM‐Aβ1‐42 by wild‐type microglia cultured in astrocyte‐conditioned medium (ACM) from wild‐type or PD‐L1−/− astroglial cultures (mean ± SEM of a technical quadruplicate, Student's t‐test, *P < 0.05 and ***P < 0.001, representative result of an n = 2 biological replicate).
-
CFlow cytometry analysis of microglia from wild‐type and PD‐1−/− mice for the expression of CD36 and CD11b.
-
DQuantification of microglial in vivo phagocytosis in female APP/PS1 and APP/PS1 PD‐1−/− mice at 8.5 months of age after intraperitoneal injection of methoxy‐XO4 (biological replicates with n = 5 for APP/PS1 and n = 4 for APP/PS1 PD‐1−/− mice, Student's t‐test (t = 2.1808, df = 6.9829), *P < 0.05).
-
E–GRelative expression of the cell surface marker (E) CD36 (biological replicates with n = 5 for APP/PS1 and n = 4 for APP/PS1 PD‐1−/− mice, ANOVA (df = 1, F = 0.002, P = 0.94), Tukey's HSD, *P < 0.05, ***P < 0.001), (F) CD11b (biological replicates with n = 5 for APP/PS1 and n = 4 for APP/PS1 PD‐1−/− mice), and (G) CD45 on methoxy‐XO4+ versus methoxy‐XO4− microglia in APP/PS1 and APP/PS1 PD‐1−/− mice normalized to methoxy‐X04‐negative cells from APP/PS1 mice (biological replicates with n = 5 for APP/PS1 and n = 4 for APP/PS1 PD‐1−/− mice).
Data information: (D–G) Central bands represent median, boxes show interquartile range (IQR), and whiskers define the ± 1.5xIQR.
Figure EV3. Aβ phagocytosis in PD‐1−/− microglial cells by flow cytometry.
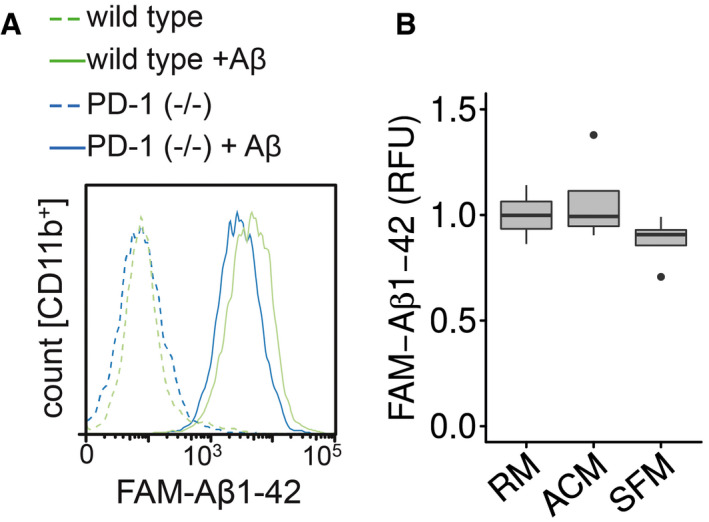
- Microglia from wild‐type or PD‐1−/− mice were incubated with FAM‐Aβ1‐42, and the increase in fluorescence was measured in the CD11b+ cells.
- Microglia were preincubated for 1 h with regular medium (RM), astrocyte‐conditioned medium (ACM), or serum‐free medium (SFM) followed by the addition of 0.5 μM FAM‐Aβ1‐42 for 4 h (median (central band) with interquartile range (IQR; boxes) and ± 1.5xIQR (whiskers) of one experiment in technical quadruplicates, one‐way ANOVA (df = 2, F = 1.493, P = 0.275), Tukey’s HSD).
Conducting transcriptome analysis of wild‐type and PD‐1−/− microglia revealed a pro‐inflammatory response pattern of KEGG pathways including cytokine–cytokine receptor and complement system activation (Fig 6A, Appendix Table S1). Expression of the inflammasome gene NLRP3 (Heneka et al, 2013) and its downstream product IL‐1β was upregulated in PD‐1−/− microglia, whereas CD36 was downregulated supporting our previous finding (Fig 6B, Appendix Fig S7, Appendix Table S2). Concerning the complement system, deletion of PD‐1 elevated the expression of many related genes including C3, C1q, and clusterin (Fig 6C, Appendix Fig S7, Appendix Table S3). Overall, PD‐1 seems to limit the expression of numerous genes (Fig EV4), in particular genes implicated in immune and macrophage/microglia‐related pathways (Fig EV5).
Figure 6. Transcriptome analysis of PD‐1−/− microglia.
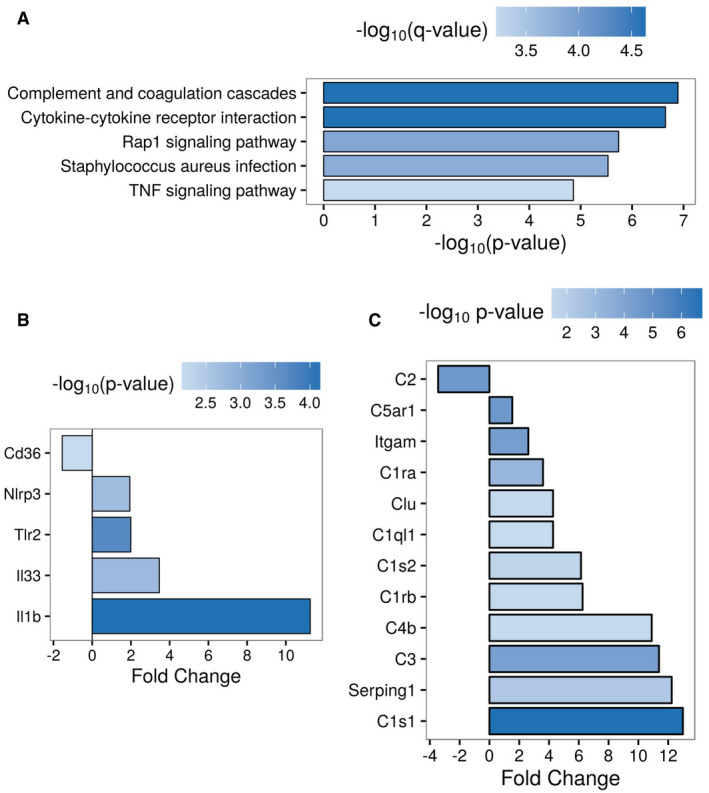
- Top 5 enriched KEGG pathways of differentially expressed genes (abs(fold change) > 2, P < 0.01, Benjamini–Hochberg‐adjusted) in PD‐1−/− vs. wild‐type microglia.
- Different expression of inflammasome‐related genes (abs(fold change) > 1.5, P < 0.05, Benjamini– Hochberg‐adjusted) in PD‐1−/− vs. wild‐type microglia.
- Different expression of complement system‐related genes (abs(fold change) > 1.5, P < 0.05, Benjamini–Hochberg‐adjusted) in PD‐1−/− vs. wild‐type microglia.
Figure EV4. Gene expression analysis of wild type and PD‐1−/− microglia.
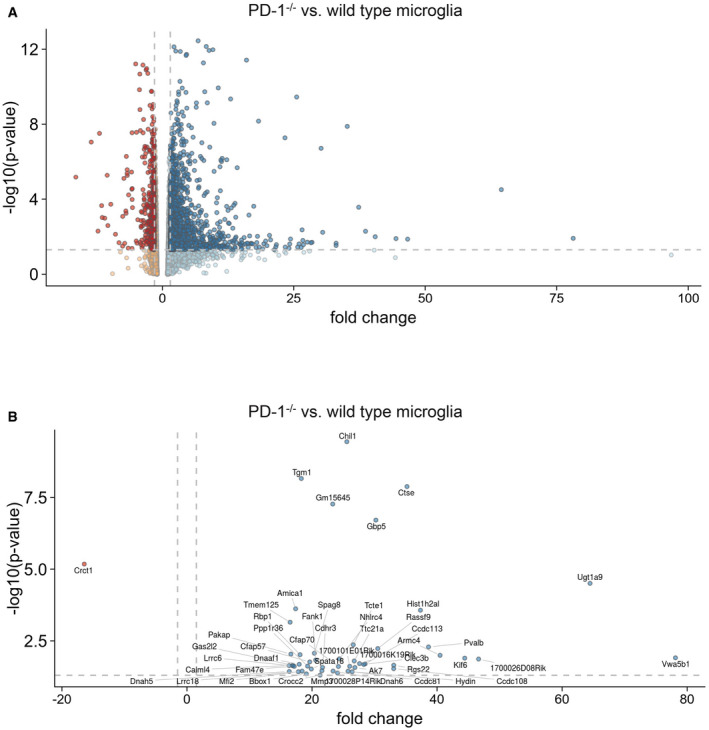
- Gene expression in microglia from wild‐type or PD‐1−/− mice presented as a Volcano plot. Dark data points represent more than 1.5 times up‐ or downregulated genes that have a P‐value of 0.05 or less (one‐way ANOVA, dashed lines represent fold change ± 1.5 and P = 0.05).
- Same as A but only the top 50 regulated genes are depicted (one‐way ANOVA, dashed lines represent fold change ± 1.5 and P = 0.05).
Figure EV5. Gene ontology (GO) enrichment analysis.
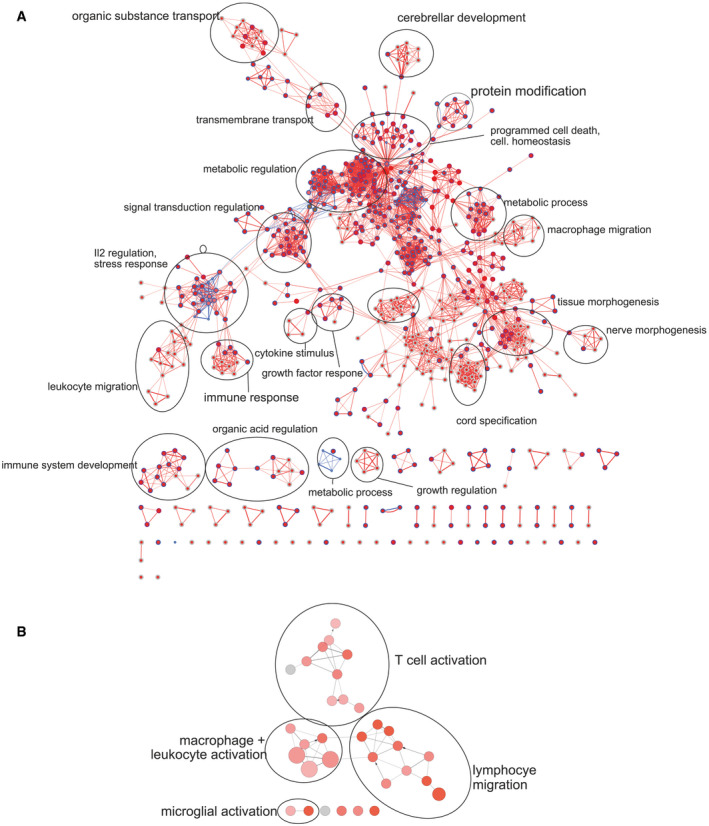
- Visualization of gene ontology enrichment analysis (GOEA) of DE genes (PD‐1−/− vs. wild‐type microglia: blue = downregulated genes, red = upregulated genes) using BiNGO and the EnrichmentMap plugin.
- ClueGO network analysis of “Immune System Process” GO terms of DE genes (PD‐1−/− vs. wild‐type microglia: red = upregulated genes).
Discussion
Our data suggest that a concerted action of soluble, astrocytic PD‐L1 and microglial PD‐1 is critical for the removal of Aβ deposits in APP/PS1 mice. As revealed by our transcriptomic data, PD‐1 limits the expression of many genes that are related to inflammatory processes confirming its proposed role as an immune checkpoint. Interestingly, PD‐1 has been shown to be one of the most upregulated genes in microglia from APP/PS1 mice compared with wild‐type mice, independently of aging (Holtman et al, 2015), suggesting an imbalance between immune activation and tolerance in this disease model. In this context, PD‐1 not only regulates the inflammatory response mediated by inflammatory cytokines, e.g., IL‐1β, in AD (Heneka et al, 2013; Sheedy et al, 2013), but also modulates the complement system, which has recently been discussed to be critical for synaptic loss in AD (Hong et al, 2016).
Concerning the changes in the amyloid pathology in the APP/PS1 PD‐1−/− mice, the observed increase in amyloid deposition may be the expression of multiple changes in Aβ turnover. Besides reduced uptake of Aβ, decreased degradation of Aβ in the lysosomal compartment or by extracellular proteases such as insulin‐degrading enzyme or neprilysin, or reduced transport of Aβ over the blood–brain barrier are possible changes. Since we observed that PD‐1 deficiency limited the uptake of Aβ in vitro at very early time points, when degradation has presumably not yet started, we favor the idea that decreased uptake is mainly responsible for the observed effect without excluding the other possibilities.
Increased expression of PD‐1 was clearly connected to the position of the microglia in relation to an amyloid deposit. Microglia that were close to amyloid plaques showed the highest expression of PD‐1 (Fig 3C). In addition, amyloid‐containing cells express high levels of PD‐1 (Fig 3F), suggesting that those cells were close to amyloid plaques and took up the material form there. This implies that PD‐1 is expressed only in a subset of microglial cells that are actively involved in the inflammatory reaction that occurs in response to the formation of the characteristic deposits during this disease.
PD‐1 upholds CD36 expression, an important factor concerning the microglial uptake of aggregated Aβ (Yamanaka et al, 2012; Sheedy et al, 2013; Zinselmeyer et al, 2013). Therefore, PD‐1 and PD‐L1 are critical for Aβ uptake and their expression should correlate with efficient removal. This is contradicted by the increase in soluble PD‐L1 in the CSF and increased expression of PD‐L1 and PD‐1 in the brains of confirmed AD patients. This may indicate that an unresolved, chronic inflammation that causes microglial exhaustion and dysfunction is ongoing and that at very late disease stages, this immune checkpoint is not functional anymore (Dong & Chen, 2006). In analogy to this, it has been reported that prolonged states of negative immune regulation result in PD‐1‐mediated immune exhaustion that goes along with reduced cell motility (Zinselmeyer et al, 2013). This anergy phenomenon has been observed in T cells and can be overcome by disrupting PD‐L1/PD‐1 interaction (Tsushima et al, 2007; Wherry, 2011).
It is conceivable that under conditions of chronic inflammation, where both PD‐L1 and PD‐ 1 are highly expressed, a blockade of this interaction might revive the immune response and is therefore a therapeutic strategy. Likewise, the prevention of PD‐L1 secretion could also present a useful therapeutic option. Recently, the positive effect of PD‐1 immunotherapy applying blocking antibodies to PD‐1 on plaque pathology and behavior has been demonstrated in AD mouse models (Baruch et al, 2016). In this study, the authors suggest that myeloid cells from the periphery are responsible for this effect. Nevertheless, the applied antibodies might also block the astrocyte to microglia PD‐L1/PD‐1 signaling, thereby rescuing the innate immune response in the brain. However, another study using the same anti‐PD‐1 antibody in three transgenic AD mouse models, performed in three different pharmaceutical companies, was not able to reproduce the previously published effects on Aβ pathology (Latta‐Mahieu et al, 2018). We show that PD‐1 is important for Aβ uptake and that complete loss of PD‐1 signaling by using a PD‐1 knockout model worsens progression of plaque pathology and cognition. Therefore, instead of PD‐1 blockade, another possible therapeutic approach could be a combination of a treatment that on the one hand strengthens PD‐1 signaling and on the other hand inhibits other exhaustion‐related factors.
Further research should identify mechanisms by which the PD‐1/PD‐L1 axis can be therapeutically employed in order to prevent microglia exhaustion and detrimental effects on AD pathogenesis.
Materials and Methods
Animals
APP/PS1 heterozygous transgenic mice expressing mouse APP containing the human amyloid‐β domain, and the Swedish mutation and the presenilin 1 Δexon 9 mutation, both under the control of the prion promoter (Jankowsky et al, 2001), and PD‐L1 and PD‐1‐deficient mice were kindly provided by Dr. Heinz Wiendl (University of Münster). Deletion of PD‐1 was verified by PCR genotyping as described (Kroner et al, 2009). For the immunohistochemistry, biochemistry, and in vivo phagocytosis assay, only female mice were used, whereas for the behavioral analysis, mixed‐gender groups were used. APP/PS1 mice were bred with CX3CR1‐EGFP mice (Jung et al, 2000) to allow the identification of microglia by GFP expression. Mice were housed under standard conditions at 22°C and a 12‐h light–dark cycle with free access to food and water. At the indicated ages, animals were killed and transcardially perfused with PBS, and the brains were removed. Animal care and handling complied with relevant ethical regulations and was performed according to the declaration of Helsinki and as approved by the local ethics committee.
Antibodies and reagents
PD‐1 was detected using PD‐1 antibodies #4065 (ProSci, Poway, CA) and PDCD1 #PAB13253 (Abnova, Heidelberg, Germany). PD‐L1 was detected using antibody #AF1019 (R&D, Wiesbaden, Germany) and PD‐L1 (E1L3N) XP (#13684; Cell Signaling, Leiden, the Netherlands). Characterization of microglia was performed using antibodies #MCA711 against CD11b (AbSerotec, Düsseldorf, Germany) and anti‐Iba1 (#019‐19741, Wako, Neuss, Germany). Astrocytes were detected using GFAP antibody #Z0334 (Dako, Hamburg, Germany). Aβ was detected using IC16 (Jager et al, 2009) against Aβ1‐17, APP, and APP‐CTF using antibodies 6E10 (#803010; BioLegend, San Diego, CA) and 140 (CT15, anti‐APP C‐ terminal 20 aa; 1:2,500 (Wahle et al, 2006)). EEA1 was detected using antibody #610456 (BD Bioscience, Heidelberg, Germany). Myc epitopes were detected using antibody 9E10 and tubulin using antibody E7 (both from DSHB, Iowa City, IO). Antibody CD32/16 (Calbiochem, Darmstadt, Germany) was used to block Fc receptors on the surface of microglia. DAPT was purchased from Calbiochem (Darmstadt, Germany), PMA from Sigma‐Aldrich (Darmstadt, Germany), and LPS from InvivoGen (Toulouse, France). Methoxy‐XO4 was purchased from Tocris (Wiesbaden, Germany). Aβ1‐42 and FAM‐Aβ1‐42 were purchased from PSL (Heidelberg, Germany). Peptides were solubilized in 1,1,1,3,3,3‐hexafluoroisopropanol, dried in a Speed Vac, resolubilized at 1 mg/ml in 10 mM NaOH, and diluted in phosphate buffer, pH 7, for 6 or 24 h.
Cell culture
Microglial cell cultures were prepared as previously described (Hanisch et al, 2004). After 5–8 days of primary cultivation, microglial cells were harvested by shaking off. Astrocytes were generated from microglia‐harvested mixed astroglial cultures by a mild trypsinization procedure (Saura et al, 2003). The resulting cell layer was trypsinized to receive single cells, plated, and at least once split before use. Conditioned medium was generated by incubating astroglial cultures for 72 h with neurobasal medium containing N2 supplement (Invitrogen, Darmstadt, Germany).
ELISAs
Quantitative determination of Aβx‐40 and Aβx‐42 from conditioned media was performed using the human amyloid‐βx‐40 and βx‐42 ELISA kits (The Genetics Company, Schlieren, Switzerland) according to the manufacturer's protocol. Samples were cleared by centrifugation at 10,000 g for 5 min and diluted to meet the concentration range of the standard curve. PD‐L1 levels from human cerebrospinal fluid (CSF) were determined using an ELISA kit (USCN, Wuhan, China) according to the manufacturer's protocol. pTau181 levels were determined using the INNOTEST phospho‐Tau (181P) ELISA (Fujirebio, Hanover, Germany).
Western blotting of brain extracts
Snap‐frozen brain hemispheres excluding the cerebellum were extracted as previously described (Kummer et al, 2011). Briefly, homogenates were extracted with 25 mM Tris–HCl, pH 7.5, 150 mM NaCl, 0.5% sodium deoxycholate, and 1% NP‐40 for 30 min on ice. After centrifugation at 100,000 g (RIPA‐soluble fraction), the pellet was sonified in 25 mM Tris–HCl, pH 7.5, and 2% SDS resulting from the SDS‐soluble fraction. Protein concentration in the RIPA‐soluble fraction was determined using the BCA Protein Assay Kit (Pierce, Bonn, Germany). Protein samples were separated by 4–12% NuPAGE (Invitrogen, Darmstadt, Germany) using MES or MOPS buffer and transferred to nitrocellulose membranes. For detection of Aβ, blots were boiled for 5 min in water. APP and CTF were detected using antibodies 6E10 and 140 and anti‐tubulin as a loading control, followed by incubation with appropriate infrared fluorescent dye‐conjugated secondary antibodies. Immunoreactivity was detected using an Odyssey CLx Imager (LI‐COR, Bad Homburg, Germany), and pictures were analyzed using Image Studio (LI‐COR, Bad Homburg, Germany).
In vitro phagocytosis assay
Microglial phagocytosis of N‐terminally FAM‐labeled Aβ1‐42 (FAM‐Aβ) in microglia cultured in medium derived from mixed glial cultures was measured by a plate‐based assay as described previously (Terwel et al, 2011). For the determination of FAM‐Aβ phagocytosis by flow cytometry, cells were incubated with 150 nM FAM‐Aβ for 4 h. Cells were incubated with Fc‐block (1:100; BD Bioscience, Heidelberg, Germany) and incubated for 10 min on ice, diluted with 0.5 ml HBSS, centrifuged at 1,000 rpm for 5 min at 4°C, taken up in 50 µl of primary antibody mix (CD11b‐APC, 1:100; CD36‐PE, 1:100), and incubated for 30 min on ice. Cells were centrifuged at 1,000 rpm for 5 min at 4°C and resuspended in 200 µl PBS and measured using a FACSCanto II (BD Bioscience, Heidelberg, Germany). Data were analyzed using FlowJo 10 (Tree Star, Ashland, OR).
Determination of plaque load
Thioflavin T staining was performed on cryosections dried for 30 min at room temperature and fixed in 4% paraformaldehyde for 20 min. Slices were rinsed 3 times with water, incubated with 0.01% thioflavin T in 80% ethanol, and then differentiated in 80% ethanol for 35 min. 5 sections per animal were analyzed. Cortical and hippocampal pictures were taken with an Olympus BX61 fluorescence microscope (Hamburg, Germany) and quantified using NIH ImageJ applying the maximum entropy threshold plugin to normalized pictures.
Immunochemistry
Mouse brain hemispheres were incubated overnight in 4% paraformaldehyde. Serial sagittal sections (40 µm) were cut using a vibratome (Leica, Solms, Germany). For immunohistochemistry, sections were incubated overnight at 4°C in PBS/0.1% Triton X‐100, and 20% goat or donkey serum with antibody. Double staining was performed by simultaneous incubation with both primary antibodies at 4°C overnight. Secondary antibodies, either whole IgG or F(ab)2 fragments (Invitrogen, Darmstadt, Germany), were applied alone or for double immunostaining simultaneously after washing with PBS. The cryo‐conserved human tissue was sectioned using a cryotome (10 µm; Leica, Solms, Germany), mounted on coated glass slides, fixed in 4% paraformaldehyde for 20 min, permeabilized in 0.1% Tx‐100, blocked with 20% serum PBS/0.1% Triton X‐100 for 1 h, and incubated overnight at 4°C with PBS/0.1% Triton X‐100 and 20% goat serum with antibody. HeLa cells were fixed with 4% paraformaldehyde for 10 min, permeabilized with 0.1% Tx‐100 for 10 min, blocked with 20% goat serum PBS/0.1% Triton X‐100 for 1 h and incubated overnight at 4°C in PBS/0.1% Triton X‐100, 20% goat serum with antibody. Secondary Alexa dye conjugates, either whole IgG or F(ab)2 fragments (Invitrogen, Darmstadt, Germany), were applied alone or for double immunostaining simultaneously after washing with PBS. Negative controls included omission of the secondary antibody. Pictures were acquired on a BX61 fluorescence microscope equipped with a spinning disk unit and processed using Cell^P software (Olympus, Hamburg, Germany) or with a Nikon A1‐MP laser scanning microscope and processed using Nikon Elements 4.2 (Nikon, Düsseldorf, Germany).
Behavioral analysis
The Morris water maze test was conducted as previously described (Heneka et al, 2013). Briefly, spatial memory testing was conducted in a pool consisting of a circular tank (Ø1 m) filled with opacified water at 24°C. The water basin was dimly lit (20–30 lux) and surrounded by a white curtain. The maze was virtually divided into four quadrants, with one containing a hidden platform (15 × 15 cm), present 1.5 cm below the water surface. Mice were trained to find the platform, orientating by means of three extra maze cues placed asymmetrically as spatial references. They were placed into the water in a quasi‐random fashion to prevent strategy learning. Mice were allowed to search for the platform for 40 s; if the mice did not reach the platform in the allocated time, they were placed onto it manually. Mice were allowed to stay on the platform for 15 s before initiation of the next trial. After completion of four trials, mice were dried and placed back into their home cages. Mice were trained 4 trials per day for 8 consecutive days. For spatial probe trials, which were conducted 24 h after the last training session (day 9), the platform was removed and mice were allowed to swim for 30 s. The drop position was at the border between the 3rd and 4th quadrant, with the mouse facing the wall at the start. Data are given as percent of time spent in quadrant Q1, representing the quadrant where the platform had been located, and compared with the averaged time the animals spent in the remaining quadrants. In the afternoon of the same day, a visual cued testing was performed with the platform being flagged and new positions for the start and goal during each trial. All mouse movements were recorded by a computed tracking system that calculated distances moved and latencies required for reaching the platform (Noldus, EthoVision 3.1). Mice that did not swim were removed after four attempts (Vorhees & Williams, 2006). The order of the animals was randomized but not blinded to the experimenter.
Flow cytometry
Flow cytometry analysis of microglia from mice was performed using antibodies CD11b‐APC (BioLegend, #101212), CD45‐FITC (eBioscience, San Diego, CA, #11‐0451), CD36‐PE (eBioscience, San Diego, CA, #12‐0361), and PD‐1 using 29F.1A12 (BioLegend, San Diego, CA). 7‐AAD staining was used to exclude dead cells from the analysis. Cultured microglia were incubated in DMEM supplemented with N2 overnight with 1 µM Aβ1‐42 or 100 ng/ml LPS. Staining was performed using APC‐CD11b (BioLegend, Uithoorn, the Netherlands, #101212) and PE‐PD‐1 (BioLegend, Uithoorn, the Netherlands, #135205) or PE‐IgG2ak isotype control antibodies at 4°C. Astrocytes were incubated in neurobasal medium overnight with 1 µM Aβ1‐42 or 100 U/μl Interferon‐γ /10 μg/ml TNF‐α. Cells were stained with PE‐PD‐L1 (BioLegend, Uithoorn, the Netherlands) or PE‐IgG2bk isotype control antibodies at 4°C. Samples were analyzed on a FACSCanto II flow cytometer (BD Bioscience, Heidelberg, Germany). Data were evaluated using FlowJo 10 (Tree Star, Ashland, OR).
In vivo phagocytosis assay
9‐month‐old wt, APP/PS1 and APP/PS1 PD‐1−/−‐transgenic mice were intraperitoneally injected 3 h before sacrifice with 10 mg/kg methoxy‐XO4 in 50% DMSO/50% NaCl (0.9%), pH 12 (Bolmont et al, 2008). Microglia isolation and analysis by flow cytometry have been previously described (Heneka et al, 2013).
Transfection of cells
C6, HeLa, and HEK293 cells (all purchased from DSMZ, Braunschweig, Germany), as well as HEK293 cells stably transfected with human PS1 or PS1D246A mutant constructs (kindly provided by Dr. Jochen Walter, University of Bonn), were maintained in DMEM supplemented with 10% fetal bovine serum, and 100 units ml‐1 penicillin/streptomycin. Cells were tested for mycoplasma by indirect DNA stain using Hoechst 33342 (Sigma‐Aldrich). The identity of the cells was verified by the provider by multiplex PCR of minisatellite markers for HeLa and HEK293 cells. The rat origin of C6 cells was verified by PCR by the provider. Plasmids were transiently transfected using Lipofectamine LTX (Thermo Fisher) according to the manufacturer's recommendations. For siRNA knockdown of BACE1 (Life Technologies, siRNA ID# 105154) and ADAM17 (Life Technologies, siRNA ID# 112004), HEK293 cells were transfected first with siRNA duplexes on day 1, followed by transfection of the pcDNA3.1‐mPD‐L1‐myc plasmid on day 2 using Lipofectamine 3000 (Life Technologies) for both transfections.
Human cerebrospinal fluid samples
Cerebrospinal fluid samples (n = 10) were derived from non‐diagnosed patients (control) or patients diagnosed with either mild cognitive impairment (MCI) or Alzheimer's disease (AD). Age averages were 65.8 ± SD 6.7 for control and 72.8 ± SD 6.4 for AD patients. MMSE averages were 29.8 ± SD 0.42 for control and 20.4 ± SD 2.75 for AD patients. The control group included samples from 8 males and 2 females, and the AD group from 3 males and 7 females. The experiments were in conformity with the principles of the Declaration of Helsinki and the Department of Health and Human Services Belmont Report. The use of the samples was approved by local ethics committees (Ethical committee of University of Bonn Medical Center).
Laser capture micro‐dissection
Brains of six 12‐ to 14‐month‐old APP/PS1 CX3CR1‐GFP/wt and six age‐matched CX3CR1‐GFP/wt (wild‐type) mice were fixed in 1% formaldehyde at 4°C for 5 h and stored at −80°C. Brains were coronally sectioned at 10 µm thickness, mounted on RNase‐free membrane slides 1.0 PEN (Zeiss), and stained with thiazine red (0.001% in 80% EtOH; Sigma‐Aldrich) to visualize amyloid‐β plaques. 500 GFP‐positive plaque‐associated microglial cells (within 100 µm of thiazine red‐positive amyloid‐β plaques), 500 plaque‐distant microglial cells (microglia < 100 µm from plaques) from each APP/PS1/CX3CR1‐GFP/ wt mouse, and 500 microglia from each CX3CR1‐GFP/wt mouse were dissected using a Zeiss PALM Microbeam System. All microglial cells were chosen from the cortex. Cells were catapulted in a PCR‐tube cap containing PKD Lysis Buffer (Qiagen) and RNAlater (Thermo Fisher). RNA was subsequently extracted with the RNeasy FFPE Kit (Qiagen, Düsseldorf, Germany), and RNA integrity was tested using the Agilent Bioanalyzer. The absence of genomic DNA was validated by PCR with GAPDH primers (TGTGCAGTGCCAGCCTC/ATGAAGGGGTCGTTGATGGC). The TransPlex Complete Whole Transcriptome Amplification Kit (Sigma‐Aldrich) was used to amplify cDNA. Gene expression analysis was performed utilizing customized TaqMan Array microfluidic cards (Thermo Fisher) and the 7900HT Fast Real‐Time PCR System (Thermo Fisher) with the following TaqMan probes: Pdcd1‐Mm01285676_m1, Cd274‐Mm00452054_m1, and Rn18s‐Mm03928990_g1. The assay was conducted following the manufacturer’s protocol. Expression of the respective genes was calculated using the ΔΔC t method, normalized against the expression of 18S‐rRNA, and was then transformed to the power of the target. C t values of 35 were assigned to samples showing no amplification.
Transcriptome analysis
1 × 10⁶ primary microglia (n = 3) were harvested and subsequently lysed in QIAzol (Qiagen), and total RNA was extracted according to the manufacturer’s protocol. The precipitated RNA was dissolved in RNase‐free water. The quality of the RNA was assessed using High‐Sensitivity RNA ScreenTapes on a TapeStation 2200 (Agilent). Total RNA was converted into libraries of double‐stranded cDNA molecules as a template for high‐throughput sequencing following the manufacturer’s recommendations using the Illumina TruSeq RNA Sample Preparation Kit v2. Briefly, mRNA was purified from 100 to 500 ng of total RNA using poly‐T oligo‐attached magnetic beads. Fragmentation was carried out using divalent cations under elevated temperature in Illumina proprietary fragmentation buffer. First‐strand cDNA was synthesized using random oligonucleotides and SuperScript II. Second‐strand cDNA synthesis was performed using DNA Polymerase I and RNase H. Remaining overhangs were converted into blunt ends via exonuclease/polymerase activities, and enzymes were removed. After adenylation of 3’ ends of DNA fragments, Illumina adapter oligonucleotides were ligated to prepare for hybridization. DNA fragments with ligated adapter molecules were selectively enriched using Illumina PCR primer in a 15‐cycle PCR. Size selection and purification of cDNA fragments with preferentially 200‐bp insert length was performed using SPRI Beads (Beckman‐Coulter). Size distribution of cDNA libraries was measured using High‐Sensitivity D1000 ScreenTapes on a TapeStation 2200 (Agilent). cDNA libraries were quantified using KAPA Library Quantification Kits (Kapa Biosystems). After cluster generation on a cBot, 75‐bp single reads were sequenced on a HiSeq 1500 and demultiplexed using CASAVA 1.8.
Transcriptome data analysis
Alignment to the mouse reference genome mm10 from UCSC was performed by HISAT using standard settings (HISAT version 0.1.5‐beta). Aligned SAM files were converted into BAM files using SAMtools (SAMtools version 1.2) and imported into Partek Genomics Suite (PGS) for further analysis. mRNA quantification was performed using mm10 RefSeq Transcripts (2014‐01‐03) as an annotation file. Afterward, raw gene count throughput samples were normalized by DESeq algorithm in R (Anders & Huber, 2010). Differentially expressed genes between groups were identified by applying 1‐way analysis of variance (ANOVA) model. Candidate genes were defined by setting different criteria. To study the biological functions of candidate genes, we applied Gene Ontology enrichment analysis on respective gene sets using the Cytoscape (v3.3.0) plugin BiNGO (v3.0.3) (Maere et al, 2005). To include only significant results, the FDR threshold was set to 0.05. The Cytoscape plugin EnrichmentMap (v2.0.1) (Merico et al, 2010) and Word Cloud (v3.0.1) (Oesper et al, 2011) and CluGO (Bindea et al, 2009) were used to visualize the GO networks. The cutoff for the Jaccard coefficient was set to 0.25 and the FDR q‐value to 0.1. KEGG pathway analysis was conducted using clusterProfiler (Yu et al, 2012).
Quantitative PCR of RNAseq data
For confirmation of the RNAseq results, RNA from wt and PD‐1−/− microglia was reversely transcribed using the High‐Capacity cDNA Reverse Transcription Kit (Applied Biosystems). Gene expression analysis was performed on a StepOne Real‐Time PCR System (Applied Biosystems) with the following TaqMan probes (Thermo Fisher): Gapdh Mm99999915_g1, Nrlp3 Mm00840904_m1, Itgam Mm00434455_m1, Cd36 Mm00432403_m1, Tlr2 Mm00442346_m1, Il33 Mm00505403_m1, C3 Mm01232779_m1, C1s1 Mm00663210_mH, C1s2 Mm00774615_m1, Il1β Mm00434228_m1, C2 Mm00442726_m1, Clu Mm01197002_m1, C1ql1 Mm00657289_m1, C3 Mm01232779_m1, and C1s1 Mm00663210_mH. The assay was conducted following the manufacturer’s protocol. Expression of the respective genes was calculated using the ΔΔCt method using Gapdh mRNA as a housekeeping gene. Statistical differences were calculated from the ΔΔCt values between the two groups, and the ΔΔC t values were then transformed to the power of the target (Yuan et al, 2006).
Statistics
Normality tests, Student’s t‐tests, and ANOVA were performed using either Prism 5 (GraphPad, San Diego) or R (R Foundation for Statistical Computing).
Author contributions
MPK, CK, HS, AG, AV‐S, SS, MB, and MB performed experiments. MPK, CI, CK, HS, AH, MB, KH, MB, and JLS analyzed data. MPK, AH, MB, JLS, EL, and MTH designed experiments. MPK, CI, and MTH wrote the paper.
Conflict of interest
MTH is a clinical advisory board member at IFM Therapeutics, scientific advisory board member at Alector, and associate editor of Neurology and Neuroinflammation, and received honoraria for oral presentations from Pfizer, Novartis, Roche, AbbVie, and Biogen. All other authors declare that they have no conflict of interest.
Supporting information
Appendix
Expanded View Figures PDF
Acknowledgments
We are grateful to Dr. Jochen Walter (University of Bonn) for providing the presenilin‐overexpressing HEK293. The synopsis image was created with BioRender.com. This study was supported by the Deutsche Forschungsgemeinschaft (KFO177, TP4) to MTH and by grants of the INMiND project of the Seventh Framework of the European Union. CI received funding from the Deutsche Forschungsgemeinschaft (DFG, German Research Foundation, IS 299/3‐1). MTH and CI are members of the Cluster of Excellence ImmunoSensation2, funded by the Deutsche Forschungsgemeinschaft (DFG, German Research Foundation) under Germany’s Excellence Strategy—EXC2151‐390873048.
The EMBO Journal (2021) 40: e108662.
Contributor Information
Markus P Kummer, Email: mpkummer@gmail.com.
Michael T Heneka, Email: michael.heneka@ukbonn.de.
Data availability
RNA‐sequencing data of wild‐type and PD‐1−/− microglia were deposited in the Gene Expression Omnibus database under GSE77643 (https://www.ncbi.nlm.nih.gov/geo/query/acc.cgi?acc=GSE77643).
References
- Abellanas MA, Zamarbide M, Basurco L, Luquin E, Garcia‐Granero M, Clavero P, San Martin‐Uriz P, Vilas A, Mengual E, Hervas‐Stubbs S et al (2019) Midbrain microglia mediate a specific immunosuppressive response under inflammatory conditions. J Neuroinflammation 16: 233 [DOI] [PMC free article] [PubMed] [Google Scholar]
- Anders S, Huber W (2010) Differential expression analysis for sequence count data. Genome Biol 11: R106 [DOI] [PMC free article] [PubMed] [Google Scholar]
- Bailly C, Thuru X, Quesnel B (2021) Soluble programmed death ligand‐1 (sPD‐L1): a pool of circulating proteins implicated in health and diseases. Cancers (Basel) 13: 3034 [DOI] [PMC free article] [PubMed] [Google Scholar]
- Bamberger ME, Harris ME, McDonald DR, Husemann J, Landreth GE (2003) A cell surface receptor complex for fibrillar beta‐amyloid mediates microglial activation. J Neurosci 23: 2665–2674 [DOI] [PMC free article] [PubMed] [Google Scholar]
- Baruch K, Deczkowska A, Rosenzweig N, Tsitsou‐Kampeli A, Sharif AM, Matcovitch‐Natan O, Kertser A, David E, Amit I, Schwartz M (2016) PD‐1 immune checkpoint blockade reduces pathology and improves memory in mouse models of Alzheimer's disease. Nat Med 22: 135–137 [DOI] [PubMed] [Google Scholar]
- Bindea G, Mlecnik B, Hackl H, Charoentong P, Tosolini M, Kirilovsky A, Fridman WH, Pages F, Trajanoski Z, Galon J (2009) ClueGO: a Cytoscape plug‐in to decipher functionally grouped gene ontology and pathway annotation networks. Bioinformatics 25: 1091–1093 [DOI] [PMC free article] [PubMed] [Google Scholar]
- Bolmont T, Haiss F, Eicke D, Radde R, Mathis CA, Klunk WE, Kohsaka S, Jucker M, Calhoun ME (2008) Dynamics of the microglial/amyloid interaction indicate a role in plaque maintenance. J Neurosci 28: 4283–4292 [DOI] [PMC free article] [PubMed] [Google Scholar]
- Chemnitz JM, Parry RV, Nichols KE, June CH, Riley JL (2004) SHP‐1 and SHP‐2 associate with immunoreceptor tyrosine‐based switch motif of programmed death 1 upon primary human T cell stimulation, but only receptor ligation prevents T cell activation. J Immunol 173: 945–954 [DOI] [PubMed] [Google Scholar]
- Chen G, Chen KS, Knox J, Inglis J, Bernard A, Martin SJ, Justice A, McConlogue L, Games D, Freedman SB et al (2000) A learning deficit related to age and beta‐amyloid plaques in a mouse model of Alzheimer's disease. Nature 408: 975–979 [DOI] [PubMed] [Google Scholar]
- Dong H, Chen X (2006) Immunoregulatory role of B7–H1 in chronicity of inflammatory responses. Cell Mol Immunol 3: 179–187 [PMC free article] [PubMed] [Google Scholar]
- Edwards DR, Handsley MM, Pennington CJ (2008) The ADAM metalloproteinases. Mol Aspects Med 29: 258–289 [DOI] [PMC free article] [PubMed] [Google Scholar]
- El Khoury JB, Moore KJ, Means TK, Leung J, Terada K, Toft M, Freeman MW, Luster AD (2003) CD36 mediates the innate host response to beta‐amyloid. J Exp Med 197: 1657–1666 [DOI] [PMC free article] [PubMed] [Google Scholar]
- Francisco LM, Sage PT, Sharpe AH (2010) The PD‐1 pathway in tolerance and autoimmunity. Immunol Rev 236: 219–242 [DOI] [PMC free article] [PubMed] [Google Scholar]
- Hanisch UK, Kettenmann H (2007) Microglia: active sensor and versatile effector cells in the normal and pathologic brain. Nat Neurosci 10: 1387–1394 [DOI] [PubMed] [Google Scholar]
- Hanisch UK, van Rossum D, Xie Y, Gast K, Misselwitz R, Auriola S, Goldsteins G, Koistinaho J, Kettenmann H, Moller T (2004) The microglia‐activating potential of thrombin: the protease is not involved in the induction of proinflammatory cytokines and chemokines. J Biol Chem 279: 51880–51887 [DOI] [PubMed] [Google Scholar]
- Heneka MT, Carson MJ, Khoury JE, Landreth GE, Brosseron F, Feinstein DL, Jacobs AH, Wyss‐Coray T, Vitorica J, Ransohoff RM et al (2015) Neuroinflammation in Alzheimer's disease. Lancet Neurol 14: 388–405 [DOI] [PMC free article] [PubMed] [Google Scholar]
- Heneka MT, Kummer MP, Stutz A, Delekate A, Schwartz S, Vieira‐Saecker A, Griep A, Axt D, Remus A, Tzeng T‐C et al (2013) NLRP3 is activated in Alzheimer's disease and contributes to pathology in APP/PS1 mice. Nature 493: 674–678 [DOI] [PMC free article] [PubMed] [Google Scholar]
- Holtman IR, Raj DD, Miller JA, Schaafsma W, Yin Z, Brouwer N, Wes PD, Möller T, Orre M, Kamphuis W et al (2015) Induction of a common microglia gene expression signature by aging and neurodegenerative conditions: a co‐expression meta‐analysis. Acta Neuropathol Commun 3: 31 [DOI] [PMC free article] [PubMed] [Google Scholar]
- Hong S, Beja‐Glasser VF, Nfonoyim BM, Frouin A, Li S, Ramakrishnan S, Merry KM, Shi Q, Rosenthal A, Barres BA et al (2016) Complement and microglia mediate early synapse loss in Alzheimer mouse models. Science 352: 712–716 [DOI] [PMC free article] [PubMed] [Google Scholar]
- Jager S, Leuchtenberger S, Martin A, Czirr E, Wesselowski J, Dieckmann M, Waldron E, Korth C, Koo EH, Heneka M et al (2009) alpha‐secretase mediated conversion of the amyloid precursor protein derived membrane stub C99 to C83 limits Abeta generation. J Neurochem 111: 1369–1382 [DOI] [PubMed] [Google Scholar]
- Jankowsky JL, Slunt HH, Ratovitski T, Jenkins NA, Copeland NG, Borchelt DR (2001) Co‐expression of multiple transgenes in mouse CNS: a comparison of strategies. Biomol Eng 17: 157–165 [DOI] [PubMed] [Google Scholar]
- Jung S, Aliberti J, Graemmel P, Sunshine MJ, Kreutzberg GW, Sher A, Littman DR (2000) Analysis of fractalkine receptor CX(3)CR1 function by targeted deletion and green fluorescent protein reporter gene insertion. Mol Cell Biol 20: 4106–4114 [DOI] [PMC free article] [PubMed] [Google Scholar]
- Kroner A, Schwab N, Ip CW, Sommer C, Wessig C, Wiendl H, Martini R (2009) The co‐inhibitory molecule PD‐1 modulates disease severity in a model for an inherited, demyelinating neuropathy. Neurobiol Dis 33: 96–103 [DOI] [PubMed] [Google Scholar]
- Kummer MP, Hermes M, Delekarte A, Hammerschmidt T, Kumar S, Terwel D, Walter J, Pape HC, Konig S, Roeber S et al (2011) Nitration of tyrosine 10 critically enhances amyloid beta aggregation and plaque formation. Neuron 71: 833–844 [DOI] [PubMed] [Google Scholar]
- Latta‐Mahieu M, Elmer B, Bretteville A, Wang Y, Lopez‐Grancha M, Goniot P, Moindrot N, Ferrari P, Blanc V, Schussler N et al (2018) Systemic immune‐checkpoint blockade with anti‐PD1 antibodies does not alter cerebral amyloid‐β burden in several amyloid transgenic mouse models. Glia 66: 492–504 [DOI] [PubMed] [Google Scholar]
- Lipp M, Brandt C, Dehghani F, Kwidzinski E, Bechmann I (2007) PD‐L1 (B7–H1) regulation in zones of axonal degeneration. Neurosci Lett 425: 156–161 [DOI] [PubMed] [Google Scholar]
- Maere S, Heymans K, Kuiper M (2005) BiNGO: a Cytoscape plugin to assess overrepresentation of gene ontology categories in biological networks. Bioinformatics 21: 3448–3449 [DOI] [PubMed] [Google Scholar]
- Merico D, Isserlin R, Stueker O, Emili A, Bader GD (2010) Enrichment map: a network‐based method for gene‐set enrichment visualization and interpretation. PLoS One 5: e13984 [DOI] [PMC free article] [PubMed] [Google Scholar]
- Nishimura H, Nose M, Hiai H, Minato N, Honjo T (1999) Development of lupus‐like autoimmune diseases by disruption of the PD‐1 gene encoding an ITIM motif‐carrying immunoreceptor. Immunity 11: 141–151 [DOI] [PubMed] [Google Scholar]
- Nishimura H, Okazaki T, Tanaka Y, Nakatani K, Hara M, Matsumori A, Sasayama S, Mizoguchi A, Hiai H, Minato N et al (2001) Autoimmune dilated cardiomyopathy in PD‐1 receptor‐deficient mice. Science 291: 319–322 [DOI] [PubMed] [Google Scholar]
- Oesper L, Merico D, Isserlin R, Bader GD (2011) WordCloud: a Cytoscape plugin to create a visual semantic summary of networks. Source Code Biol Med 6: 7 [DOI] [PMC free article] [PubMed] [Google Scholar]
- Okazaki T, Maeda A, Nishimura H, Kurosaki T, Honjo T (2001) PD‐1 immunoreceptor inhibits B cell receptor‐mediated signaling by recruiting src homology 2‐domain‐containing tyrosine phosphatase 2 to phosphotyrosine. Proc Natl Acad Sci USA 98: 13866–13871 [DOI] [PMC free article] [PubMed] [Google Scholar]
- Reiss K, Saftig P (2009) The "a disintegrin and metalloprotease" (ADAM) family of sheddases: physiological and cellular functions. Semin Cell Dev Biol 20: 126–137 [DOI] [PubMed] [Google Scholar]
- Ren X, Akiyoshi K, Vandenbark AA, Hurn PD, Offner H (2011) Programmed death‐1 pathway limits central nervous system inflammation and neurologic deficits in murine experimental stroke. Stroke 42: 2578–2583 [DOI] [PMC free article] [PubMed] [Google Scholar]
- Saura J, Tusell JM, Serratosa J (2003) High‐yield isolation of murine microglia by mild trypsinization. Glia 44: 183–189 [DOI] [PubMed] [Google Scholar]
- Schachtele SJ, Hu S, Sheng WS, Mutnal MB, Lokensgard JR (2014) Glial cells suppress postencephalitic CD8+ T lymphocytes through PD‐L1. Glia 62: 1582–1594 [DOI] [PMC free article] [PubMed] [Google Scholar]
- Sheedy FJ, Grebe A, Rayner KJ, Kalantari P, Ramkhelawon B, Carpenter SB, Becker CE, Ediriweera HN, Mullick AE, Golenbock DT et al (2013) CD36 coordinates NLRP3 inflammasome activation by facilitating intracellular nucleation of soluble ligands into particulate ligands in sterile inflammation. Nat Immunol 14: 812–820 [DOI] [PMC free article] [PubMed] [Google Scholar]
- Terwel D, Steffensen KR, Verghese PB, Kummer MP, Gustafsson JA, Holtzman DM, Heneka MT (2011) Critical role of astroglial apolipoprotein E and liver X receptor‐alpha expression for microglial Abeta phagocytosis. J Neurosci 31: 7049–7059 [DOI] [PMC free article] [PubMed] [Google Scholar]
- Tsushima F, Yao S, Shin T, Flies A, Flies S, Xu H, Tamada K, Pardoll DM, Chen L (2007) Interaction between B7–H1 and PD‐1 determines initiation and reversal of T‐cell anergy. Blood 110: 180–185 [DOI] [PMC free article] [PubMed] [Google Scholar]
- Vorhees CV, Williams MT (2006) Morris water maze: procedures for assessing spatial and related forms of learning and memory. Nat Protoc 1: 848–858 [DOI] [PMC free article] [PubMed] [Google Scholar]
- Wahle T, Thal DR, Sastre M, Rentmeister A, Bogdanovic N, Famulok M, Heneka MT, Walter J (2006) GGA1 is expressed in the human brain and affects the generation of amyloid beta‐peptide. J Neurosci 26: 12838–12846 [DOI] [PMC free article] [PubMed] [Google Scholar]
- Wang J, Yoshida T, Nakaki F, Hiai H, Okazaki T, Honjo T (2005) Establishment of NOD‐Pdcd1‐/‐ mice as an efficient animal model of type 1 diabetes. Proc Natl Acad Sci USA 102: 11823–11828 [DOI] [PMC free article] [PubMed] [Google Scholar]
- Wang Z, Zhang C, Liu X, Wang Z, Sun L, Li G, Liang J, Hu H, Liu Y, Zhang W et al (2016) Molecular and clinical characterization of PD‐L1 expression at transcriptional level via 976 samples of brain glioma. Oncoimmunology 5: e1196310 [DOI] [PMC free article] [PubMed] [Google Scholar]
- Wherry EJ (2011) T cell exhaustion. Nat Immunol 12: 492–499 [DOI] [PubMed] [Google Scholar]
- Wolfe MS, Xia W, Ostaszewski BL, Diehl TS, Kimberly WT, Selkoe DJ (1999) Two transmembrane aspartates in presenilin‐1 required for presenilin endoproteolysis and gamma‐secretase activity. Nature 398: 513–517 [DOI] [PubMed] [Google Scholar]
- Yamanaka M, Ishikawa T, Griep A, Axt D, Kummer MP, Heneka MT (2012) PPARgamma/RXRalpha‐induced and CD36‐mediated microglial amyloid‐beta phagocytosis results in cognitive improvement in amyloid precursor protein/presenilin 1 mice. J Neurosci 32: 17321–17331 [DOI] [PMC free article] [PubMed] [Google Scholar]
- Yao A, Liu F, Chen K, Tang L, Liu L, Zhang K, Yu C, Bian G, Guo H, Zheng J et al (2014) Programmed death 1 deficiency induces the polarization of macrophages/microglia to the M1 phenotype after spinal cord injury in mice. Neurotherapeutics 11: 636–650 [DOI] [PMC free article] [PubMed] [Google Scholar]
- Yu G, Wang LG, Han Y, He QY (2012) clusterProfiler: an R package for comparing biological themes among gene clusters. OMICS 16: 284–287 [DOI] [PMC free article] [PubMed] [Google Scholar]
- Yuan JS, Reed A, Chen F, Stewart CN Jr (2006) Statistical analysis of real‐time PCR data. BMC Bioinformatics 7: 85 [DOI] [PMC free article] [PubMed] [Google Scholar]
- Zinselmeyer BH, Heydari S, Sacristán C, Nayak D, Cammer M, Herz J, Cheng X, Davis SJ, Dustin ML, McGavern DB (2013) PD‐1 promotes immune exhaustion by inducing antiviral T cell motility paralysis. J Exp Med 210: 757–774 [DOI] [PMC free article] [PubMed] [Google Scholar]


