

Abstract
Histone chaperones modulate the stability of histones beginning from histone synthesis, through incorporation into DNA, and during recycling during transcription and replication. Following histone removal from DNA, chaperones regulate histone storage and degradation. Here, we demonstrate that UBR7 is a histone H3.1 chaperone that modulates the supply of pre‐existing post‐nucleosomal histone complexes. We demonstrate that UBR7 binds to post‐nucleosomal H3K4me3 and H3K9me3 histones via its UBR box and PHD. UBR7 binds to the non‐nucleosomal histone chaperone NASP. In the absence of UBR7, the pool of NASP‐bound post‐nucleosomal histones accumulate and chromatin is depleted of H3K4me3‐modified histones. We propose that the interaction of UBR7 with NASP and histones opposes the histone storage functions of NASP and that UBR7 promotes reincorporation of post‐nucleosomal H3 complexes.
Keywords: chaperone, chromatin, histone, NASP, UBR7
Subject Categories: Chromatin, Transcription & Genomics; Post-translational Modifications & Proteolysis
An unsuspected UBR7 function in recognition of displaced methylated histones opposes their storage by NASP, instead promoting their reincorporation into chromatin.
Introduction
The packaging of DNA into chromatin necessitates the assembly and disassembly of nucleosomes during DNA‐based processes such as transcription and replication (Luger et al, 1997; Alabert et al, 2017; Lai & Pugh, 2017; Gan et al, 2018; Petryk et al, 2018; Yu et al, 2018; Jeronimo et al, 2019; Kobayashi & Kurumizaka, 2019; Torne et al, 2020). Histone supply, deposition, and reassembly into nucleosomes depend on a class of histone binding proteins known as chaperones. Histone chaperones ensure the proper folding and stability of newly synthesized histone proteins as they emerge from the ribosome, facilitate import of pre‐nucleosomal histones into the nucleus, and mediate assembly of DNA and histones into nucleosomes (Campos et al, 2010, 2015). Histone chaperones are necessary for retention of pre‐existing nucleosomal parental histones during gene transcription (Jeronimo et al, 2019; Torne et al, 2020) and in the duplicating chromatin of dividing cells, allowing for preservation of epigenetic states within and across cellular generations (Gan et al, 2018; Petryk et al, 2018; Yu et al, 2018). Histone chaperones also interact with pre‐existing soluble post‐nucleosomal histones downstream of histone eviction from chromatin and upstream of histone degradation (Groth et al, 2007; Cook et al, 2011). The pathways that chaperone pre‐existing post‐nucleosomal histones are not as well characterized as the pathways that chaperone newly synthesized pre‐nucleosomal and nucleosomal histones.
NASP is a soluble, non‐nucleosomal histone H3/H4 chaperone that associates with pre‐nucleosomal histones bearing the H4K12ac post‐translational modification (PTM) as well as post‐nucleosomal histones bearing H3K4me3 or H3K27me3 (Wang et al, 2008; Campos et al, 2010, 2015; Cook et al, 2011; Bowman et al, 2016). NASP histone binding acts as a “buffer” that maintains a non‐nucleosomal pool of histone H3/H4 tetramers, and NASP depletion in HeLa‐S3 cells results in loss of roughly 90% of soluble, non‐nucleosomal H3/H4 (Cook et al, 2011). Inhibition of DNA polymerases reduces the amount of H3K4me3 histone associated with NASP, suggesting that NASP binds a pool of post‐nucleosomal histones evicted from chromatin during replication (Campos et al, 2015).
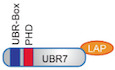
We and others have found UBR7 abundantly associated with histone H3.1 (Foltz et al, 2006, 2009; Campos et al, 2015; Ji et al, 2015; Lambert et al, 2015; Kleiner et al, 2018). UBR7 possesses two highly conserved domains: an ubiquitin ligase N‐recognin box (UBR box, amino acids 44–116) and a plant homeo‐domain (PHD, amino acids 132–188). Additionally, the C‐terminus of UBR7 is highly conserved across eukaryotes. The UBR7 UBR box does not bind peptides mimicking substrates of other UBR box containing proteins (Tasaki et al, 2009), suggesting that the UBR7 UBR box has evolved a novel, currently uncharacterized function. PHDs recognize various post‐translationally modified states of histone H3 N‐terminal tails. For example, PHDs in ING1‐5 bind di‐ and tri‐methylated H3, while PHDs in DNMT3L and AIRE bind monomethylated and unmodified H3 tails (Mellor, 2006; Champagne & Kutateladze, 2009; Musselman & Kutateladze, 2011; Bhushan et al, 2018). The PHD of UBR7 has been implicated in binding histone H3 (Kleiner et al, 2018) and is highly conserved from humans to S. pombe, suggesting that UBR7 has a critical role in cellular function through its histone binding activity (Zimmerman et al, 2014).
Here, we demonstrate that UBR7 is a histone chaperone that binds and modulates the supply of soluble, pre‐existing, post‐nucleosomal H3 histones. UBR7 is present in the nucleus and has been proposed to act at chromatin (Foltz et al, 2006; Campos et al, 2015; Ji et al, 2015; Lambert et al, 2015; Adhikary et al, 2019). Consistent with this, we observe UBR7 bound to chromatin; however, the majority of UBR7 is soluble and associated with non‐nucleosomal histone H3. We demonstrate that UBR7 binds to methylated histone H3 tails dependent on both its UBR box and PHD. UBR7 also associates with the histone chaperone NASP, and both NASP and UBR7 bind to methylated post‐nucleosomal histones. DNA replication contributes to the pool of post‐nucleosomal UBR7‐ and NASP‐bound histones. NASP‐bound post‐nucleosomal histones accumulate in the absence of UBR7. The soluble, non‐nucleosomal pool of histone H3 is increased in the absence of UBR7, as opposed to the non‐nucleosomal histone loss observed after NASP depletion (Cook et al, 2011). Consistent with the increased H3K4me3 bound to NASP, we observe that H3K4me3 is lost from transcriptional start sites (TSS) that are bound by UBR7. Overall, our data suggest that NASP and UBR7 activities oppose each other to regulate the cellular level of soluble post‐nucleosomal histones, where UBR7 promotes the reincorporation of NASP‐bound post‐nucleosomal histone H3 complexes into chromatin.
Results
UBR7 associates with histone H3.1
BioID proximity biotinylation was used to identify proteins associated with H3.1 in intact cells (Fig 1A) (Roux et al, 2012; Zasadzinska et al, 2018). H3.1 was tagged with the promiscuous biotin ligase BirA* and an HA tag to generate H3.1‐BirA*‐HA fusion protein. BirA* mediates covalent attachment of biotin to lysine residues in proteins both transiently and stably associated with H3.1‐BirA*‐HA. H3.1‐BirA*‐HA localizes to the nucleus of transfected HeLa‐T‐REx cells (Fig 1B). We confirmed that the localization pattern of overexpressed H3.1‐BirA*‐HA closely resembles that of endogenous histone H3 (Fig 1C). After treatment with biotin for 6 h, we observed extensive biotinylation of proteins in the pre‐extracted nuclei of H3.1‐BirA*‐HA cells, as visualized by staining with fluorophore‐conjugated streptavidin. This staining is absent from untreated H3.1‐BirA*‐HA cells and parental HeLa‐T‐REx cells treated with biotin for 6 h (Fig 1B).
Figure 1. UBR7 associates with histone H3.1.
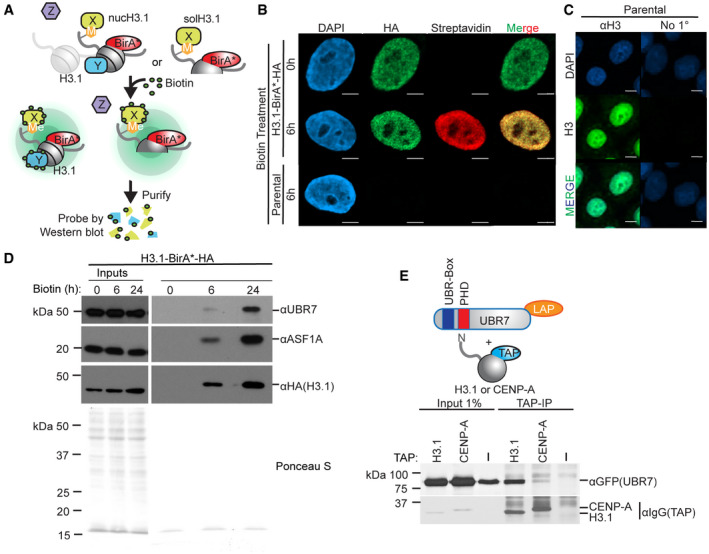
- Schematic representation of BioID proximity biotinylation in HeLa‐T‐REx cells stably expressing H3.1‐BirA*‐HA. Randomly cycling cells were treated with biotin to label proteins proximal to nucleosomal (nucH3.1) or non‐nucleosomal soluble (solH3.1). H3.1‐BirA*‐HA, and biotin‐labeled proteins were purified on streptavidin‐conjugated beads.
- Representative images of parental cells or cells stably expressing H3.1‐BirA*‐HA after incubation with or without biotin as in (A). Coverslips were pre‐extracted to visualize chromatin‐bound proteins. DNA is visualized via DAPI staining shown in blue, immunofluorescence for H3.1‐BirA*‐HA is shown in green, and biotinylated proteins are shown in red. Scale bar = 5 μm.
- Representative images of HeLa cells pre‐extracted as in (B). DNA is visualized as in (B), shown in cyan. Immunofluorescence for endogenous H3 is shown in green. Scale bar = 5 μm.
- Immunoblot analysis of proteins biotinylated and isolated as in (A). Parental HeLa‐T‐REx cells or cells expressing H3.1‐BirA*‐HA and treated with biotin for indicated times.
- Immunoblot analysis of H3.1‐TAP or CENP‐A‐TAP pulldown of UBR7‐LAP (schematic, upper). 293T cells were co‐transfected with UBR7‐LAP and TAP‐tagged constructs, which were purified on IgG‐conjugated sepharose beads.
Source data are available online for this figure.
Proteins that interact with H3.1 in intact cells were identified by isolating biotinylated proteins on streptavidin beads and analyzing by immunoblot (Fig 1A). BioID identified the known H3.1 histone chaperone ASF1 as abundantly labeled by H3.1‐BirA*‐HA (Fig 1D). We and others have shown that UBR7 is co‐purified with H3.1 (Foltz et al, 2006, 2009; Campos et al, 2015; Ji et al, 2015; Lambert et al, 2015; Kleiner et al, 2018). Therefore, we determined whether H3.1‐BirA*‐HA also biotinylated UBR7. Immunoblot using antibodies against endogenous UBR7 showed that UBR7 is biotinylated by H3.1‐BirA*‐HA (Fig 1D), providing an orthogonal demonstration of the interaction between UBR7 and histone H3.
The interaction between H3.1 and UBR7 identified in the H3.1‐BirA*‐HA BioID was confirmed using co‐immunoprecipitation (co‐IP). UBR7‐LAP and H3.1‐TAP or the divergent, centromere‐specific H3 variant CENP‐A‐TAP, were transiently co‐expressed, and the TAP‐tagged histones were purified from 293T cells. H3.1‐TAP efficiently co‐purified UBR7‐LAP (Fig 1E). CENP‐A‐TAP failed to robustly co‐purify UBR7‐LAP (Fig 1E) demonstrating that the interaction with UBR7 is H3.1‐specific. This is consistent with previous purifications of CENP‐A binding proteins, which did not identify UBR7 associated with CENP‐A (Obuse et al, 2004; Foltz et al, 2006, 2009; Zasadzinska et al, 2018).
To address the binding of UBR7 to histone H3 further, we compared the ability of H3.1 and the closely related variant H3.3 to bind UBR7. We performed mass spectrometry (MS) of proteins co‐purified by H3.1‐FLAG‐HA and H3.3‐FLAG‐HA from the nucleosomal fraction of 293T cells (Fig EV1A and B, Table EV1). H3.1‐FLAG‐HA but not H3.3‐FLAG‐HA co‐purified UBR7 from micrococcal nuclease (MNase) liberated nucleosomal fractions (Fig EV1A and B, Table EV1), which we confirmed by immunoblot (Fig EV1D and E). However, both H3 variants bound non‐nucleosomal UBR7 (Fig EV1F). To determine whether the single amino acid difference between histone H3.1 and H3.3 (A31 versus S31) in the amino terminus accounts for the inability of UBR7 to associate with H3.3 in chromatin, we tested the effect of amino acid swaps between H3.1 and H3.3 at position 31 (H3.1A31S‐FLAG‐HA and H3.3S31A‐FLAG‐HA) on the ability of H3 to co‐purify UBR7 (Fig EV1C). H3.1A31S‐FLAG‐HA but not H3.3S31A‐FLAG‐HA co‐purified UBR7 from nucleosomal fractions, and both mutated variants bound non‐nucleosomal UBR7 (Fig EV1D–F). This demonstrates that the amino acid difference between the H3.1 and H3.3 N‐terminal tail does not account for the inability of nucleosomal H3.3 to co‐purify UBR7. Together, these data suggest that the chromatin landscape of CENP‐A and H3.3‐containing chromatin is refractory to UBR7 binding, but that UBR7 can bind both the histone H3.1 and H3.3 variants in non‐nucleosomal contexts.
Figure EV1. UBR7 associates with histone H3.1.
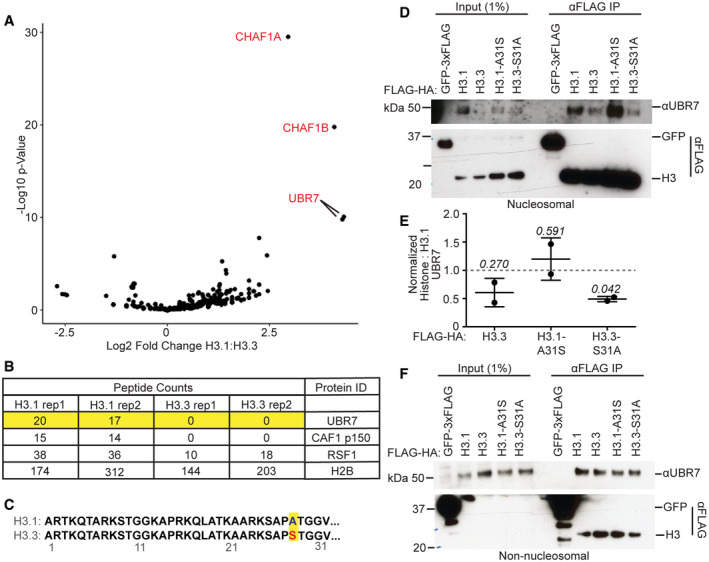
- Scatterplot of log2 fold change versus associated −log10 P‐value in spectral counts of peptides co‐purified by MNase‐liberated FLAG‐HA‐tagged H3.1 versus H3.3.
- Spectral counts for indicated proteins from MS data of proteins co‐purified by MNase‐liberated FLAG‐HA‐tagged H3.1 or H3.3. Experiment was performed twice.
- Schematic highlighting the only amino acid substitution, A31S, in the H3.3 versus H3.1 N‐terminal tail.
- Immunoblot analysis of anti‐FLAG IP from MNase‐liberated nucleosomal fraction of 293T cells transfected with 3xFLAG‐tagged GFP, or full‐length or mutant FLAG‐HA‐tagged H3.1 or H3.3.
- Quantification of the immunoblot data in (D). Immunoblot signal were normalized to anti‐FLAG signal. Error bars represent mean ± standard deviation. A two‐tailed one‐sample t‐test was used to calculate P‐values (italics) associated with group means difference from a hypothetical value of 1.0 (represented by dashed line). Experiment was performed twice.
- Immunoblot analysis of anti‐FLAG IP from non‐nucleosomal fraction of 293T cells transfected with 3xFLAG‐tagged GFP or full‐length or mutant FLAG‐HA‐tagged H3.1 or H3.3. Experiment was performed twice.
UBR7 exists in non‐nucleosomal and nucleosome‐bound pools
Having determined that UBR7 binds histone H3 (Figs 1 and EV1), we next defined the subcellular localization of UBR7. Biochemical fractionation was performed to estimate the relative abundance of UBR7 between the non‐nucleosomal and nucleosomal fractions in human 293T cells (Fig 2A–C). A soluble, non‐nucleosomal fraction was obtained by brief centrifugation of cells following hypotonic lysis in a low‐salt, mild detergent containing buffer. The nucleosomal fraction was obtained by MNase digestion of remaining pellet (Fig 2A). We compared dilutions of the whole cell extract, non‐nucleosomal, and nucleosomal fractions. The histone H3/H4 chaperone NASP was exclusively detected in the non‐nucleosomal fraction, and the histone H3/H4 chaperone ASF1 in both the non‐nucleosomal and nucleosomal fractions (Fig 2B), consistent with previous studies (Groth et al, 2005, 2007; Cook et al, 2011; Campos et al, 2015; Clement & Almouzni, 2015; Apta‐Smith et al, 2018; Dannah et al, 2018). We observed that ASF1 is enriched in the non‐nucleosomal fraction (Fig 2B). UBR7 is highly enriched in the non‐nucleosomal fraction over the nucleosomal fraction (Fig 2B and C). We estimated that UBR7 is enriched in the non‐nucleosomal fraction over the nucleosomal fraction by 1–2 orders of magnitude (˜50‐ to 100‐fold) (Figs 2C and EV2A and B).
Figure 2. UBR7 exists in non‐nucleosomal and nucleosome‐bound pools.
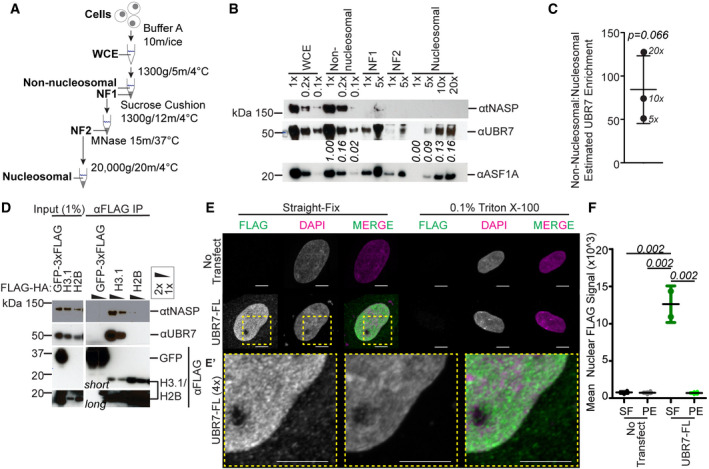
- Schematic representation of cellular fractionation to generate non‐nucleosomal and nucleosomal fractions. WCE: whole cell extract, NF1: nuclear fraction 1, NF2: nuclear fraction 2.
- Representative immunoblot analysis of NASP, UBR7, and ASF1 distribution in cellular fractions. Relative loading factors are marked, e.g., 1×, 0.2×. Numbers below blot indicate UBR7 immunoblot signal relative to 1× loading of non‐nucleosomal fraction.
- Enrichment of non‐nucleosomal:nucleosomal UBR7 as estimated from 5×, 10×, and 20× non‐nucleosomal loading conditions in Fig 2B (see Fig EV2). Error bars represent mean ± standard deviation. A two‐tailed one‐sample t‐test was used to calculate P‐value (italics) associated with mean difference from a hypothetical value of 1.0. Experiment in (B–C) was performed twice.
- Immunoblot of anti‐FLAG IP of 3xFLAG‐tagged GFP, or FLAG‐HA‐tagged H3.1 or H2B, from the non‐nucleosomal fraction of 293T cells.
- Representative images of HeLa cells transfected with UBR7‐FL. DNA is visualized via DAPI staining shown in magenta and immunofluorescence for 3xFLAG is shown in green. The area within yellow dotted box in (E) is magnified 4× in (E′). Scale bar = 5 μm.
- Quantification of the nuclear anti‐FLAG immunofluorescence intensity in (E). Error bars represent mean ± standard deviation. One‐way ANOVA was used to calculate P‐values (italics) associated with differences between treatments. Experiment in (E–F) was performed twice.
Source data are available online for this figure.
Figure EV2. UBR7 exists in non‐nucleosomal and nucleosome‐bound pools.
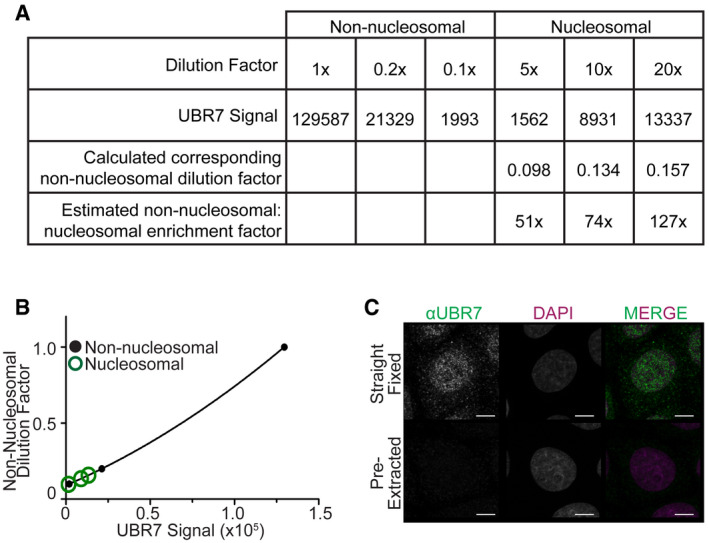
- Scatterplot representing the integrated density of anti‐UBR7 immunoblot bands in (Fig 2B) versus the corresponding non‐nucleosomal dilution factor. A standard curve was generated from the UBR7 immunoblot integrated pixel density from dilutions of the non‐nucleosomal fraction to determine the relative amount of protein in the nucleosomal fraction.
- Representative images of IF for endogenous UBR7 in HeLa cells. DNA is visualized via DAPI staining shown in magenta and immunofluorescence for UBR7 is shown in green. Scale bar = 5 μm. Experiment was performed three times.
Pre‐ and post‐nucleosomal H3/H4 histones exist as heterotetramers or heterodimers that exclude histones H2A and H2B (Luger et al, 1997; Xu et al, 2010; Zee et al, 2010). Because the majority of UBR7 is not chromatin bound, we hypothesized that UBR7 interacts with pre‐ or post‐nucleosomal forms of histone H3. To support this supposition, we determined whether UBR7 would interact with non‐nucleosomal H3.1 but not H2B. The ability of FLAG‐HA‐tagged H3.1 or H2B to co‐purify UBR7 or the histone H3/H4 chaperone NASP from the non‐nucleosomal fraction of 293T cells was tested. Consistent with previous work, NASP was co‐purified by H3.1‐FLAG‐HA but not H2B‐FLAG‐HA (Fig 2D) (Wang et al, 2008; Bowman et al, 2017). As predicted, UBR7 was co‐purified by non‐nucleosomal H3.1‐FLAG‐HA but not H2B‐FLAG‐HA (Fig 2D).
Subcellular localization of UBR7 was examined by immunofluorescence (IF). HeLa cells were transfected with 3xFLAG‐tagged UBR7 (UBR7‐FL). We observed by IF that UBR7‐FL was enriched in the nucleus as compared to the cytoplasm in HeLa cells, and in both compartments has a punctal pattern (Fig 2E and E’). To confirm the high solubility of UBR7 as observed by biochemical fractionation in 293T cells, we pre‐extracted non‐nucleosomal proteins from HeLa cells with 0.1% Triton X‐100 before fixation to visualize only chromatin‐bound proteins by IF, as described previously (Moreno‐Moreno et al, 2006; Huang et al, 2019; Prendergast et al, 2020). Pre‐extraction significantly reduced the nuclear anti‐FLAG UBR7‐FL signal (Fig 2E and F), again showing that the majority of UBR7 is soluble and non‐nucleosomal. Endogenous UBR7 detected by IF in straight‐fixed or pre‐extracted HeLa cells confirmed that, like UBR7‐FL, endogenous UBR7 localizes to the nucleus and is largely non‐nucleosomal (Fig EV2C).
The UBR7 UBR box and PHD mediate binding to the histone H3.1 N‐terminus
UBR7 contains two putative functional domains: the UBR box (amino acids 44–116) and the PHD (amino acids 132–188). PHDs have been shown to bind to histone H3.1 N‐terminal tails (Mellor, 2006; Champagne & Kutateladze, 2009; Musselman & Kutateladze, 2011; Bhushan et al, 2018). To test whether UBR7 interacts with the H3.1 N‐terminus, UBR7‐LAP and H3.1‐HA or a mutant in which the first 38 residues of the N‐terminus are deleted (H3.1∆NT‐HA) were transiently co‐expressed in 293T cells. Immunoprecipitated H3.1‐HA but not H3.1∆NT‐HA efficiently co‐purified UBR7‐LAP (Fig 3A). Both full‐length H3.1‐HA and H3.1∆NT‐HA localize to the nucleus in transiently transfected HeLa cells (Fig 3B), demonstrating that an inability of H3.1∆NT‐HA to localize to the nucleus does not explain the lack of binding between H3.1∆NT‐HA and UBR7. These data demonstrate that the N‐terminal tail of H3.1 is necessary for interaction with UBR7. This is consistent with previous work that demonstrated that the UBR7 PHD interacts with amino acids 1‐21 of the N‐terminal tail of H3.1 in vitro (Kleiner et al, 2018).
Figure 3. The UBR7 UBR box and PHD mediate binding to the histone H3.1 N‐terminus.
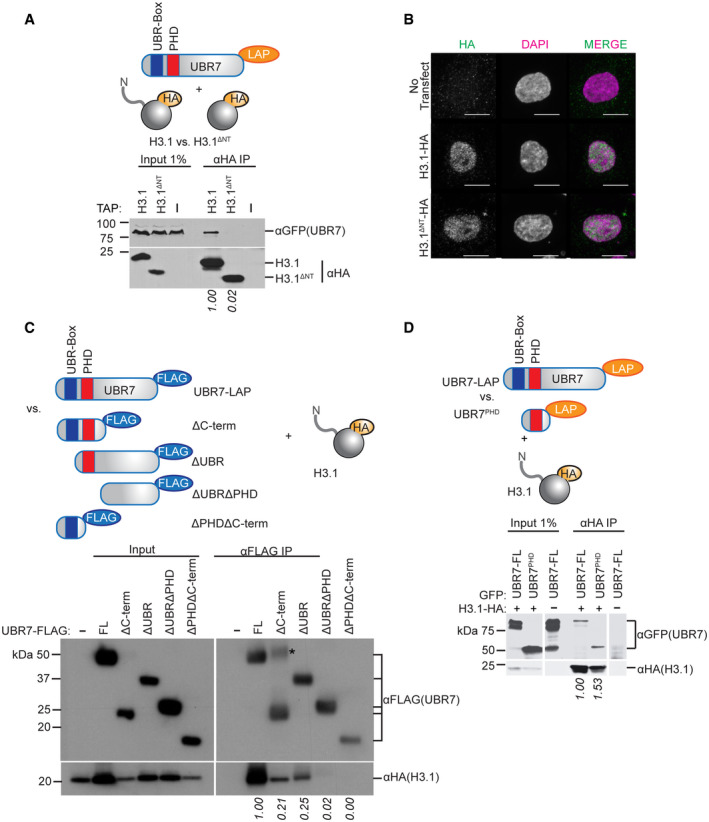
- Immunoblot analysis of anti‐H3.1‐HA pulldown of UBR7‐LAP after deletion of H3.1 N‐terminal tail (schematic, upper). 293T cells were co‐transfected with UBR7‐LAP and HA‐tagged constructs. Numbers below blot indicate HA‐normalized anti‐GFP immunoblot signal relative to full‐length H3.1‐HA.
- Representative images of HeLa cells transfected with indicated constructs. DNA is visualized via DAPI staining shown in magenta and immunofluorescence for endogenous H3 is shown in green. Scale bar = 10 μm. Experiment was performed three times.
- Immunoblot analysis of anti‐FLAG pulldown of full‐length UBR7‐FLAG (residues 1–425) or mutant UBR7 bearing deletion of UBR7 C‐terminus (ΔC‐term, residues 1–215), UBR box (ΔUBR, residues 117–425), UBR box and PHD (ΔUBRΔPHD, residues 216–425), or PHD and C‐terminus (ΔPHDΔC‐term, residues 1–116). 293T cells were co‐transfected with H3.1‐HA and UBR7‐FLAG constructs (schematic, upper). Asterisk represents non‐specific band. Numbers below blot indicate FLAG‐normalized anti‐HA immunoblot signal relative to full‐length UBR7‐FLAG.
- Immunoblot analysis of anti‐H3.1‐HA pulldown of full‐length UBR7‐LAP and UBR7PHD fragment (residues 117–215) (schematic, upper). 293T cells were transfected as in (A). Values below pulldown represent H3.1‐HA‐normalized GFP‐UBR7 immunoblot signal relative to UBR7‐FL. Data were acquired from a continuous membrane, and the image is cropped to omit irrelevant samples. Numbers below blot indicate HA‐normalized anti‐GFP immunoblot signal relative to full‐length UBR7‐LAP.
Source data are available online for this figure.
In addition to the proposed functional UBR7 UBR box and UBR7 PHD, the C‐terminus of UBR7 is highly conserved across evolution (Fig EV3). We next asked if the UBR7 UBR box, PHD, or C‐terminus are necessary for binding of UBR7 to histone H3.1, by analyzing UBR7 mutant constructs lacking the C‐terminus (∆C‐term), the UBR box (∆UBR), the UBR box and PHD (∆UBR∆PHD), or the PHD and C‐terminus (∆PHD∆C‐term). We transiently co‐transfected H3.1‐HA and full‐length or mutant UBR7‐FLAG constructs in 293T cells. Full‐length UBR7‐FLAG efficiently co‐purified H3.1‐HA from 293T cells lysates (Fig 3C). The ∆C‐term and the ∆UBR UBR7 mutants were able to bind to H3.1‐HA, albeit with reduced efficiency compared to full‐length UBR7. Deletion of the PHD domain (∆UBR∆PHD, ∆PHD∆C‐term) completely abolished co‐purification of H3.1‐HA by UBR7, suggesting the PHD domain is essential for binding (Fig 3C). From this, we could not conclude if the UBR7 PHD is sufficient for histone H3.1 binding. To test if the PHD mediates interaction with H3.1, we repeated the H3.1‐HA IP with UBR7‐LAP or the LAP tagged UBR7PHD fragment alone. H3.1‐HA efficiently co‐purified full‐length UBR7 and UBR7PHD (Fig 3D). Collectively, these data demonstrate that the UBR7 PHD is sufficient to mediate the interaction between UBR7 and the histone H3.1 N‐terminus, although the UBR7 UBR box and C‐terminus also contribute to binding to H3.1‐HA.
Figure EV3. The UBR7 UBR box and PHD mediate binding to the histone H3.1 N‐terminus.
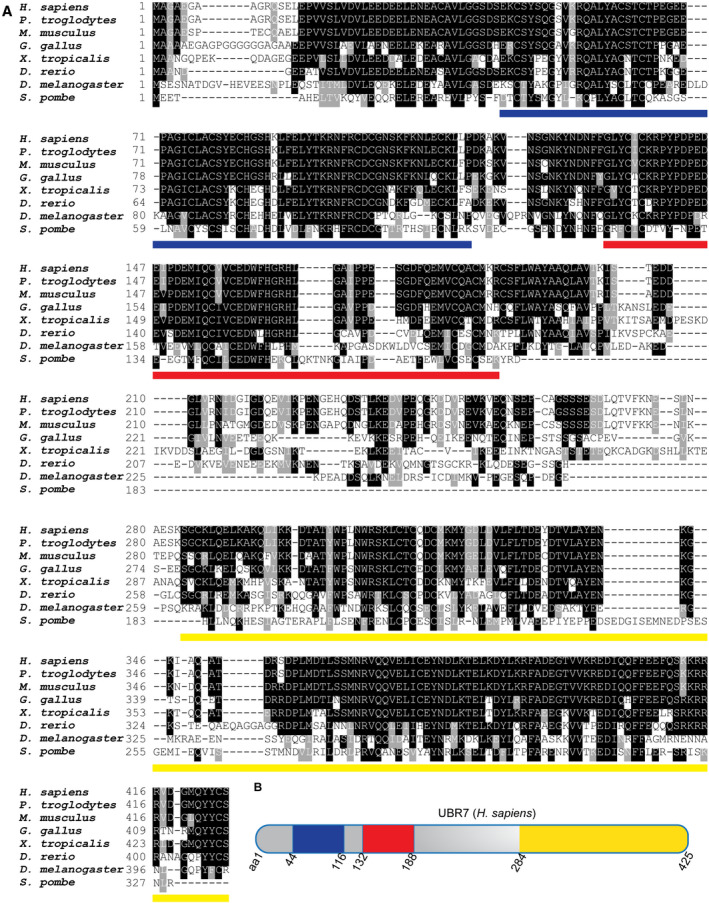
- Alignment of primary amino acid sequence for UBR7 homologs across evolution. Background is shaded when identity (black) or similarity (gray) of residue is conserved in ≥ 50% of compared species. Lines below sequences indicate locations of UBR box (blue), PHD (red), and highly conserved C‐terminus (yellow).
- Schematic of H. sapiens UBR7 protein. Amino acids delineating domains featured in (A) are labeled. Domains are colored as in (A).
The UBR7 PHD and UBR box mediate binding to post‐nucleosomal H3.1
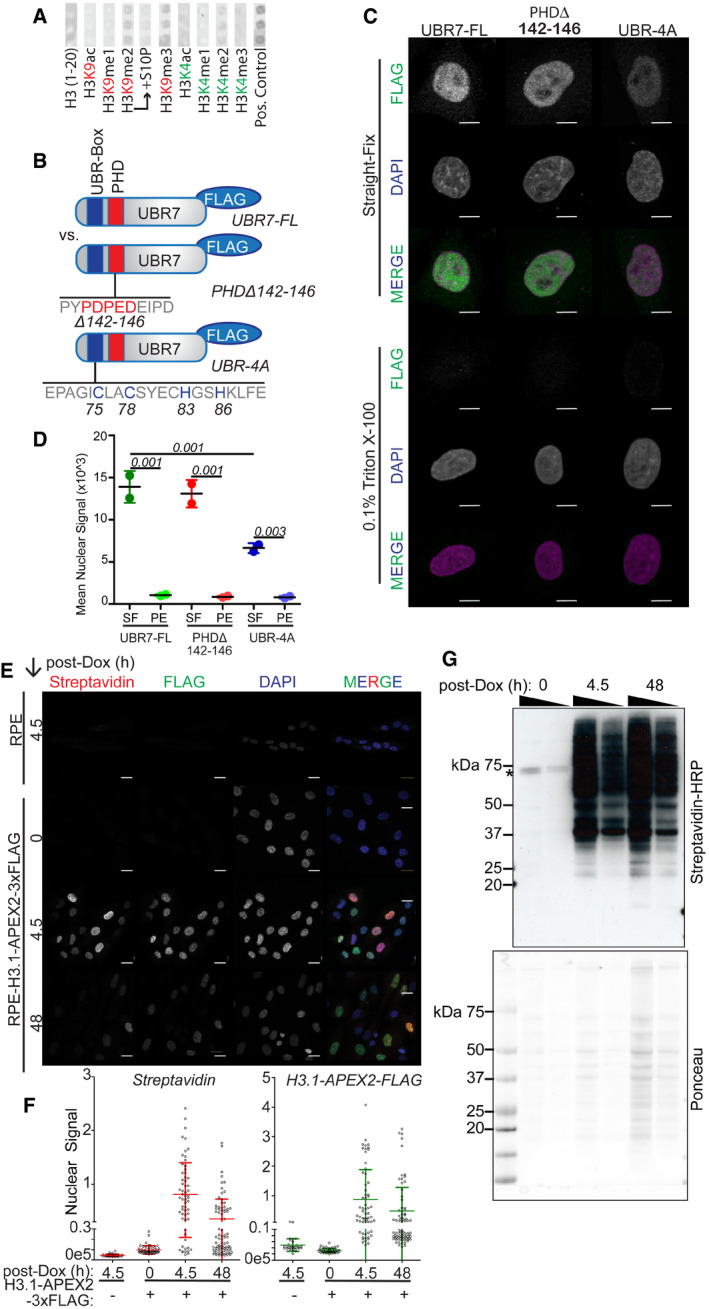
Knowing that the PHD of UBR7 mediates interaction with H3.1 (Fig 3), and that PHDs were previously reported to bind histone H3 tails with specific PTMs, including H3K4me3, H3K9me3, or H3K36me3 (Musselman & Kutateladze, 2011), we determined if UBR7 depends on H3.1 N‐terminal tail PTMs for its interaction. We probed a histone peptide array with purified His‐MBP‐UBR7 to identify histone H3 N‐terminal tail PTMs that are bound by UBR7. We observed that His‐MBP‐UBR7 binds peptides bearing the single modifications H3K4me2, H3K4me3, H3K9me2, and H3K9me3 but not monomethylated, acetylated, or unmodified H3 peptides (Figs 4A and EV4A, Dataset EV1). Like other H3K9 binding proteins, UBR7 failed to bind the H3K9 methylated peptides when the adjacent S10 residue was phosphorylated (Rea et al, 2000; Chin et al, 2005; Fischle et al, 2005; Duan et al, 2008).
Figure 4. The UBR7 PHD and UBR box mediate binding to post‐nucleosomal histone H3.1.
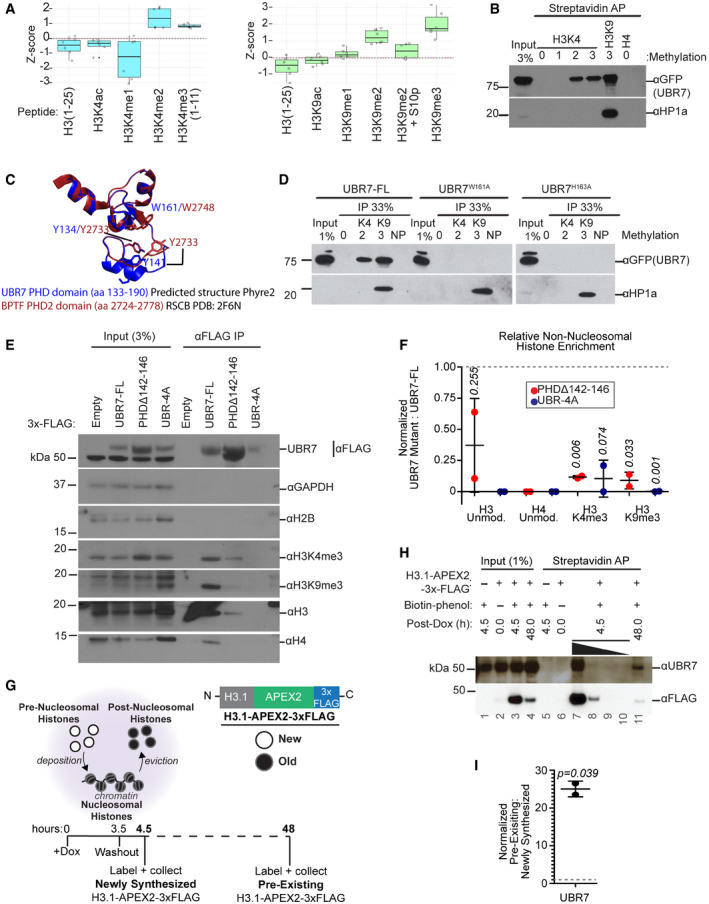
- Histone peptide array identified modified histone H3 N‐terminal peptides bound by purified His‐MBP‐UBR7. Boxplots represent Z‐scores of the local background corrected peptide intensity values on the array. Box limits represent 25th and 75th percentiles. Whiskers extend to 1.5× the interquartile range. Experiment was performed twice. Left: Peptides (un)modified at H3K4. Right: Peptides (un)modified at H3K9 and H3S10.
- Anti‐GFP immunoblot analysis of streptavidin pulldown of biotin‐conjugated H3 and H4 peptides following incubation with 293T‐GFP‐UBR7 cell lysate. HP1α serves as a positive control for binding to H3K9me3.
- Predicted structure of UBR7 PHD (a.a.133–190) using Phyre2 (Kelley et al, 2015) overlayed on the BPTF PHD2 structure (RSCB PDB: 2F6N) as reference. UBR7 PHD aromatic cage residues mutated in (D) and corresponding residues in BPTF PHD2 are labeled.
- Anti‐GFP immunoblot analysis of streptavidin pulldown of the indicated biotin‐conjugated H3 peptides following incubation with 293T‐GFP‐UBR7 cell lysate after mutation of residues highlighted in (C).
- Immunoblot analysis for total and modified histones in anti‐FLAG pulldown of constructs in (Fig EV4A) from soluble cellular fractions demonstrates that UBR7 UBR box and PHD are necessary for binding to post‐nucleosomal H3/H4.
- Quantification of the immunoblot data in (E). Immunoblot signals were normalized to anti‐FLAG signal. Error bars represent mean ± standard deviation. A two‐tailed one‐sample t‐test was used to calculate P‐values (italics) associated with group means difference from a hypothetical value of 1.0 (represented by dashed line). Experiment in (E‐F) was performed twice.
- Schematic representation of proximity biotinylation in stable inducible H3.1‐APEX2‐3xFLAG cells. To perform proximity biotinylation with newly synthesized H3.1‐APEX2‐3xFLAG, after doxycycline induction followed by washout, cells were immediately subjected to labeling reaction. To perform proximity biotinylation with pre‐existing H3.1‐APEX2‐3xFLAG, following washout cells were grown for 48 h before labeling reaction. Biotin‐labeled proteins were purified on streptavidin‐conjugated beads.
- Immunoblot analysis of streptavidin pulldown from proximity biotinylation described in (G). 4.5 h represent newly synthesized histones and 48 h represent pre‐existing histones. Wedge represents loading titration: 1× > 0.1× > 0.01× > 0.001×. All other lanes are loaded at 1× concentration.
- Quantification of anti‐FLAG (H3.1‐APEX2‐3xFLAG) and anti‐UBR7 immunoblot represented in (G‐H). Lanes 8 and 11 were quantified. Immunoblot signals were normalized to anti‐FLAG signal. Error bar represents mean ± standard deviation. A two‐tailed one‐sample t‐test was used to calculate P‐value (italics) associated with group mean difference from a hypothetical value of 1.0 (represented by dashed line). Experiment in (G‐I) was performed twice.
Source data are available online for this figure.
Figure EV4. The UBR7 PHD and UBR box mediate binding to post‐nucleosomal histone H3.1.
- Histone peptide array identified modified histone H3 N‐terminal peptides bound by purified His‐MBP‐UBR7. Corresponds to graphs in Fig 4A.
- Schematic representation of wild‐type UBR7‐FL, PHD mutant “PHDΔ142‐146,” and UBR box mutant “UBR‐4A” used in Fig 4E and F.
- Representative images of HeLa cells transfected with indicated 3xFLAG constructs. DNA is visualized via DAPI staining shown in magenta and immunofluorescence for 3xFLAG is shown in green. Scale bar = 5 μm.
- Quantification of the nuclear anti‐FLAG immunofluorescence intensity in (C) demonstrating that UBR7 constructs are highly susceptible to pre‐extraction with Triton X‐100. Error bars represent mean ± standard deviation. One‐way ANOVA was used to calculate P‐values (italics) associated with differences between treatments. Experiment in (C‐D) was performed twice.
- Representative images of parental RPE cells and RPE cells stably expressing dox‐inducible H3.1‐APEX2‐3xFLAG. Biotinylated proteins are visualized in red, DNA is visualized via DAPI staining shown in blue, and immunofluorescence for 3xFLAG is shown in green. Scale bar = 10 μm.
- Quantification of nuclear streptavidin‐Cy3 (biotinylated proteins) and anti‐FLAG immunofluorescence intensities in (E). Error bars represent mean ± standard deviation. Experiment in (E‐F) was performed twice.
- Streptavidin‐HRP blot analysis (upper) or Ponceau staining (lower) of biotinylated proteins in RPE‐H3.1‐APEX2‐3xFLAG cells treated with 1 µg/ml doxycycline (Dox) for indicated times. Wedge represents 2× > 1× loading. Asterisk indicates endogenously biotinylated proteins.
Source data are available online for this figure.
We confirmed our peptide microarray experiment using peptide pulldowns of UBR7 from extracts of cells expressing endogenous UBR7 containing an N‐terminal GFP tag. Briefly, lysed 293T‐GFP‐UBR7 cells were incubated with biotin‐conjugated peptides representing unmodified histone H3 or H4, or H3 bearing methylation at H3K4 or H3K9 (Fig 4B). Streptavidin affinity purification of histone peptides bearing the marks H3K4me2, H3K4me3, and H3K9me3 efficiently co‐purified GFP‐UBR7, in contrast to H3K4me1 or unmodified H3 and H4 peptides (Fig 4B), confirming that UBR7 binds to histone H3 di‐ and tri‐methylated at H3K4 or H3K9.
PHD domains contain an aromatic cage of residues that determine the specificity of PTM binding (Xu et al, 2014; Liu et al, 2016). We used Phyre2 to predict the structure of the UBR7 PHD, and overlayed the predicted structure with the PHD2 of BPTF, an H3K4me3 reader in the NURF complex (Li et al, 2006), as a reference (Fig 4C). The UBR7 PHD aromatic cage residues Y134, Y141, W161, and H163 are conserved with respect to those residues critical for BPTF PHD2 binding to modified histones. We hypothesized that the UBR7 PHD aromatic cage residues are important for binding of UBR7 specifically to di‐ and tri‐methylated H3 peptides. We repeated the peptide pulldown experiment in 293T‐GFP‐UBR7 cells in which W161 or H163 of the PHD aromatic cage were mutated to alanine. As opposed to full‐length GFP‐UBR7, the UBR7W161A and UBR7H163A mutants were not co‐purified by either H3K4me2 or H3K9me3 peptides (Fig 4D), demonstrating that these aromatic residues are necessary for UBR7 binding to methylated H3. This finding is consistent with previously reported importance of the UBR7 PHD aromatic cage for H3 binding in vitro (Kleiner et al, 2018).
To determine whether the interaction of UBR7 with modified histones extends to endogenous modified histones in cultured cells, we conducted IP of UBR7. As we demonstrate earlier, UBR7 is bound to histone H3 in non‐nucleosomal fractions (Fig 2C). As such, we tested the ability of 3xFLAG‐tagged UBR7 (UBR7‐FL) to co‐purify total histones and histones methylated at H3K4 and H3K9 from the non‐nucleosomal fraction of 293T cells. Anti‐FLAG IP of transiently expressed UBR7‐FL efficiently co‐purified total H3 and H4 (Fig 4E). Notably, UBR7‐FL failed to co‐purify histone H2B (Fig 4E), consistent with our finding that FLAG‐HA‐tagged non‐nucleosomal H3.1 but not H2B co‐purifies UBR7 (Fig EV2C). Consistent with our observation that UBR7‐bound H3K4 and K3K9 methylated peptides in vitro, the non‐nucleosomal H3 histones that were bound to UBR7 contained either K4me3 or K9me3 PTMs (Fig 4E).
Having demonstrated that the UBR7 PHD mediates binding to exogenously expressed H3 in vivo and to modified H3 peptides in vitro (Figs 3 and 4D), we predicted that this domain is necessary for binding to non‐nucleosomal endogenous modified histones in vivo. We repeated the anti‐FLAG IP from the non‐nucleosomal fraction of cells transfected with a 3xFLAG‐tagged UBR7 mutant, PHDΔ142–146, which eliminates amino acids 142–146 from the aromatic cage of the UBR7 PHD (Fig EV4B). As expected, the PHDΔ142–146 mutant was deficient for binding to all histone species tested (Fig 4E and F). Loss of binding to all histone species was also demonstrated with a UBR7 UBR box mutant, UBR‐4A, in which the metal‐coordinating ions of the UBR7 UBR box were mutated to alanine (Figs 4E and F, and EV4B). This is not due to a mislocalization of the PHDΔ142–146 or UBR‐4A mutants (Fig EV4C and D), further suggesting that UBR7 nuclear enrichment is independent of binding to histones (Figs 2E and F and EV4C and D). Together, these data demonstrate that the UBR7 PHD and UBR7 UBR box have evolved as critical domains, which mediate binding of UBR7 to methylated histone H3.
It is notable that the non‐nucleosomal histones bound by UBR7 bear H3K4me3 and H3K9me3 marks that are added to histones within the context of the intact nucleosome and are absent from pre‐nucleosomal histones (Benson et al, 2006; Loyola et al, 2006). Therefore, we surmise that UBR7 interacts with pre‐existing, evicted post‐nucleosomal histones. To test whether UBR7 interacts with pre‐existing histones, we employed a proximity biotinylation approach where histone H3.1 was tagged with APEX2, which mediates covalent attachment of biotin‐phenol to electron‐rich residues in proteins both transiently and stably associated with tagged H3.1, and which features improved temporal resolution over BirA* (Hung et al, 2016; Han et al, 2017). We expressed H3.1‐APEX2‐3xFLAG (H3.1‐APEX2) in human RPE cells under the control of a doxycycline‐inducible promoter. After a short pulse of doxycycline induction (3.5 h) and washout (1 h), proteins in the proximity of newly synthesized H3.1‐APEX2 were biotin‐labeled. Newly synthesized H3.1 is inserted into chromatin during S‐phase (Ahmad & Henikoff, 2002; Tagami et al, 2004). Since the short timeframe of doxycycline induction and washout (4.5 h) is a small fraction of the length of a cell cycle (˜48 h for RPE), the majority of newly synthesized H3.1‐APEX2 will not yet be deposited and therefore the labeled proteins will largely represent those associated with pre‐nucleosomal H3.1‐APEX2. We also chased cells for a full cell cycle (48 h) following doxycycline induction and washout, then repeated biotin labeling of proteins associated with pre‐existing H3.1‐APEX2. The proteins labeled at this time will represent those associated with nucleosomal H3.1‐APEX2 in chromatin or with evicted post‐nucleosomal H3.1‐APEX2 (Fig 4G). We observed extensive expression and biotinylation in cells expressing H3.1‐APEX2 4.5 and 48 h after doxycycline induction, but not in parental cells treated with doxycycline and biotinylation reagents or untreated RPE‐H3.1‐APEX2 cells (Fig EV4E–G).
We purified biotin‐labeled proteins from the 4.5 h (newly synthesized histone) and 48 h (pre‐existing histone) conditions on streptavidin beads. Exogenously overexpressed histones are rapidly degraded in yeast and human cells (Singh et al, 2009; Clement et al, 2018). Our experiments showed a similar effect, as we observed that greater than ninety percent of H3.1‐APEX2 was degraded over the 48 h chase (Fig 4H, lane 11 versus lane 8). As predicted, pre‐existing H3.1‐APEX2 efficiently biotinylated UBR7 (Fig 4H, lane 11), supporting our hypothesis that UBR7 is associated with pre‐existing histones bearing the marks of evicted post‐nucleosomal histones. We also observed that UBR7 is associated with newly synthesized H3.1‐APEX2 (Fig 4H, lane 7). By comparing the intensity of FLAG‐normalized anti‐UBR7 immunoblot signals, we estimate that pre‐existing H3.1‐APEX2 (48 h) bound ˜25× more UBR7 than newly synthesized H3.1‐APEX2 (4.5 h, Fig 4I). This suggests that UBR7 preferentially binds pre‐existing as opposed to newly synthesized histones.
UBR7 bound to post‐nucleosomal histone H3/H4 interacts with NASP
We used BioID proximity biotinylation coupled to mass spectrometry to identify additional proteins associated with UBR7 in HeLa‐T‐REx cells (Roux et al, 2012; Zasadzinska et al, 2018). We tagged UBR7 with the BirA* biotin ligase and an HA tag to generate UBR7‐BirA*‐HA fusion protein. We confirmed expression of UBR7‐BirA*‐HA by immunoblot (Fig 5A). After treatment with biotin for 16 h, we observed extensive biotinylation of proteins in the nuclei of UBR7‐BirA*‐HA cells, as visualized by staining with fluorophore‐conjugated streptavidin (Fig 5B). This staining is absent from untreated UBR7‐BirA*‐HA cells and parental HeLa‐T‐REx cells treated with biotin (Fig 5B). The top two proteins enriched in UBR7‐BirA*‐HA BioID were UBR7 itself and the non‐nucleosomal histone H3/H4 chaperone NASP (Fig 5C and Table EV4). Since both UBR7 and NASP bind to histone H3/H4, we explored the UBR7‐NASP interaction further.
Figure 5. UBR7 bound to post‐nucleosomal histone H3/H4 interacts with NASP.
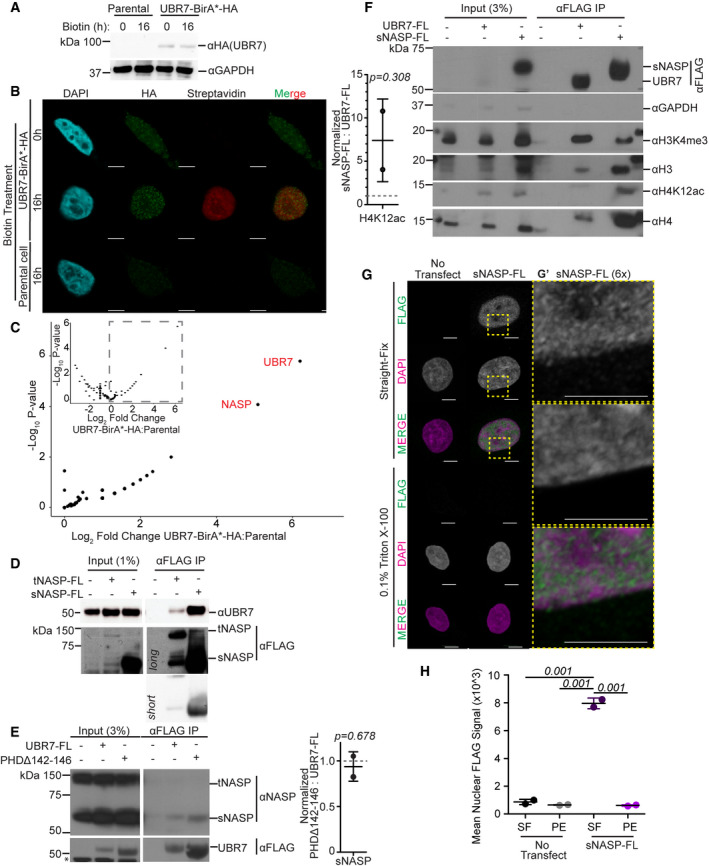
- Immunoblot analysis of parental HeLa cells or cells expressing UBR7‐BirA*‐HA confirms specific expression of UBR7‐BirA*‐HA.
- Representative images of parental cells or cells stably expressing UBR7 fused to BirA* ligase and HA tag (UBR7‐BirA*‐HA) after incubation with or without biotin. DNA is visualized via DAPI staining shown in cyan, immunofluorescence for UBR7‐BirA*‐HA is shown in green, and biotinylated proteins are shown in red. Scale bar = 5 μm.
- Quantification of log2 fold change and ‐log10 P‐value of MS spectral counts from UBR7‐BirA*‐HA (heavy) compared to parental (light) cells. Positive log2 fold changes are presented. Full dataset displayed as inset bordered by dotted line. The two proteins most abundantly labeled by UBR7‐BirA*‐HA are UBR7 and NASP. Experiment was performed twice.
- Immunoblot analysis of anti‐FLAG IP. Cells were fractionated 72 h post‐transfection, and 3xFLAG constructs were immunoprecipitated from non‐nucleosomal fraction.
- Immunoblot analysis of anti‐FLAG IP. Immunoblot signals were normalized to anti‐FLAG signal. Experiment was performed as in (D). Asterisk indicates non‐specific bands in input. Quantification appears on the right. A two‐tailed one‐sample t‐test was used to calculate P‐value (italics) associated with group mean difference from a hypothetical value of 1.0 (represented by dashed line). Experiment was performed twice.
- Immunoblot analysis for total and modified H3 and H4 in anti‐FLAG IP. Experiment was performed as in (D). Quantification appears on the left. Dot plot error bars represent mean ± standard deviation. Immunoblot signals were normalized to anti‐H4 signal. A two‐tailed one‐sample t‐test was used to calculate P‐value associated with group mean difference from a hypothetical value of 1.0. Experiment was performed twice.
- Representative images of HeLa cells transfected with sNASP‐FL. DNA is visualized via DAPI staining shown in magenta and immunofluorescence for 3xFLAG is shown in green. The area within yellow dotted box in (G) is magnified 4× in (G′). Scale bar = 5 μm.
- Quantification of the nuclear anti‐FLAG immunofluorescence intensity in (G) demonstrating that sNASP‐FL is highly susceptible to pre‐extraction with Triton X‐100. One‐way ANOVA was used to determine P‐values (italics) associated with differences between treatments. Error bars represent mean ± standard deviation. Experiment in (G–H) was performed twice.
Source data are available online for this figure.
We confirmed the binding of UBR7 to NASP by reciprocal IP in cultured cells. We restricted our analysis of UBR7 and NASP interaction to the non‐nucleosomal fraction of 293T cells in which both proteins are highly enriched (Fig 2B). NASP exists in two splice isoforms in mammalian cells originally differentiated by their enrichment in testicular (tNASP) versus somatic (sNASP) tissue (Fig EV5) (Richardson et al, 2000). Transiently transfected tNASP‐FL or sNASP‐FL efficiently co‐purified endogenous UBR7 (Fig 5D). Reciprocally, transiently transfected UBR7‐FL efficiently co‐purified endogenous sNASP. tNASP was not detected above background in UBR7‐FL purifications (Fig 5E), which shows that UBR7 may preferentially associate with the sNASP splice variant in 293T cells. Importantly, the UBR7 PHDΔ142–146 mutant, which fails to bind non‐nucleosomal histones (Fig 4E and F), binds non‐nucleosomal NASP (Fig 5E). We conclude that UBR7 and NASP interact independently of the ability of UBR7 to bind histones in the non‐nucleosomal fraction of human cells.
Figure EV5. UBR7 bound to post‐nucleosomal histone H3/H4 interacts with NASP.
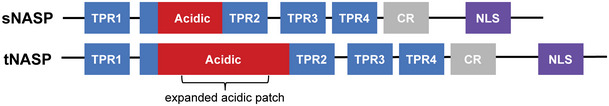
Schematic representation of NASP isoforms sNASP and tNASP. TPR: tetratricopeptide repeat. CR: capping region. NLS: nuclear localization signal.
NASP binds to histones bearing H4K5ac or H4K12ac, which are associated with pre‐nucleosomal histones (Benson et al, 2006; Loyola et al, 2006; Campos et al, 2015), and to H3K4me3 and H3K27me3 (Campos et al, 2015), which are associated with nucleosomal and post‐nucleosomal histones (Loyola et al, 2006). UBR7 binds to post‐nucleosomal histones bearing H3K4 or H3K9 tri‐methylation, which are acquired in chromatin (Loyola et al, 2006). We therefore compared binding of UBR7 and sNASP to either newly synthesized pre‐nucleosomal histones bearing H4K12ac or pre‐existing post‐nucleosomal histones bearing H3K4me3 in the non‐nucleosomal fraction of 293T cells. We immunoblotted anti‐FLAG IPs of UBR7‐FL or sNASP‐FL for total and modified H3 and H4. UBR7‐FL and sNASP‐FL co‐purified similar amounts of H3K4me3, but UBR7‐FL, in contrast to sNASP‐FL, failed to co‐purify H4K12ac (Fig 5F), consistent with our observation that UBR7 preferentially binds pre‐existing histones (Fig 4H–I). We therefore conclude that non‐nucleosomal UBR7‐FL and sNASP‐FL both associate with a pool of post‐nucleosomal histones marked by H3K4me3, but that sNASP‐FL associates with an additional, separate pool of pre‐nucleosomal histones bearing H4K12ac. We observed that sNASP‐FL co‐purified a greater amount of total non‐nucleosomal H3 and H4 than did UBR7‐FL (Fig 5F). This likely reflects the additional pre‐nucleosomal H3/H4 histone pool bound by sNASP but not UBR7.
We performed anti‐FLAG IF to determine the localization and solubility of transiently transfected sNASP‐FL in HeLa cells. Like UBR7‐FL (Fig 2E and F), sNASP‐FL was enriched in the nucleus as compared to the cytoplasm, had a punctal appearance, and was highly susceptible to pre‐extraction with 0.1% Triton X‐100 (Fig 5G‐G' and H). This is consistent with previous reports that sNASP is a soluble non‐nucleosomal histone chaperone (Cook et al, 2011; Campos et al, 2015; Apta‐Smith et al, 2018).
DNA replication contributes to UBR7‐ and sNASP‐bound post‐nucleosomal histone populations
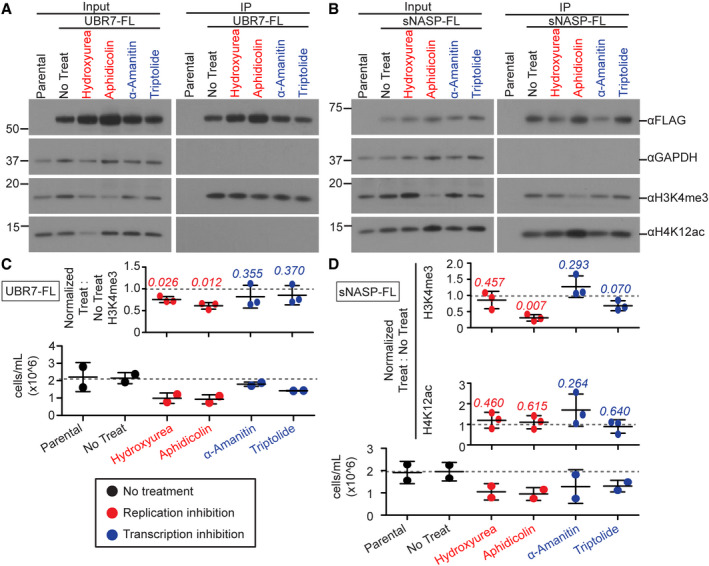
We next sought to determine the source of post‐nucleosomal histones bound by UBR7 and sNASP. Nucleosomal histones are evicted from chromatin during DNA replication and gene transcription (Gan et al, 2018; Petryk et al, 2018; Reveron‐Gomez et al, 2018; Yu et al, 2018; Jeronimo et al, 2019; Torne et al, 2020). We tested if these processes contribute to the pool of evicted post‐nucleosomal histones bound by UBR7 and sNASP by IP of either non‐nucleosomal UBR7‐FL or sNASP‐FL from 293T cells following treatment with DNA replication or transcription inhibitors. After DNA replication inhibition with hydroxyurea or aphidicolin, there is less H3K4me3 bound per UBR7‐FL (Fig 6A and C) and sNASP‐FL (Fig 6B and D). These changes were not observed after inhibition of RNA polymerases by either alpha‐amanitin or triptolide (Fig 6A–D). The effect on sNASP‐bound histones is restricted to post‐nucleosomal H3K4me3 histones, as sNASP binding to newly synthesized H4K12ac histones was unaffected by DNA replication or transcription inhibition (Fig 6B and D). This indicates that replication is the primary source of UBR7 and sNASP‐bound post‐nucleosomal histones. This is consistent with a previous report, suggesting that DNA replication contributes to the pool of sNASP‐bound K4me3‐modified histone H3 (Campos et al, 2015).
Figure 6. Replication contributes to sNASP and UBR7‐bound post‐nucleosomal histones.
-
A, BImmunoblot analysis for modified histone in anti‐FLAG pulldown of UBR7‐FL (A) or sNASP‐FL (B) from non‐nucleosomal fractions of untreated cells or cells treated with DNA replication inhibitors (hydroxyurea, aphidicolin) or transcription inhibitors (α‐amanitin, triptolide).
-
C, DPlots represent either normalized immunoblot signals from (C) UBR7‐FL or (D) sNASP‐FL immunoprecipitation or cell counts prior to fractionation. Immunoblot signals were normalized to anti‐FLAG signal. Error bars represent mean ± standard deviation, with gray dotted line marking mean of No Treat condition. A two‐tailed one‐sample t‐test was used to calculate P‐values (italics) associated with group means difference from a hypothetical value of 1.0. Experiments were performed three times. Cells numbers were counted in two of the three experiments.
Source data are available online for this figure.
UBR7 opposes stabilization of NASP‐bound post‐nucleosomal histone H3
Previous work demonstrates that NASP promotes the stability of non‐nucleosomal H3/H4, such that depletion of NASP results in loss of pre‐nucleosomal H3/H4‐bearing H4K5/12ac (Cook et al, 2011). Having shown that UBR7 interacts with NASP and post‐nucleosomal histones, we next asked if UBR7 loss would affect steady‐state non‐nucleosomal H3 levels. In contrast to the loss of non‐nucleosomal H3 observed following knockdown of NASP (Cook et al, 2011), UBR7 knockout (UBR7KO) cells have more non‐nucleosomal H3 compared to parental 293T cells (Fig 7A and B). We hypothesized that UBR7 binding to NASP and histones opposes histone buffering by NASP to promote loss of non‐nucleosomal H3 complexes and predicted that loss of UBR7 would stabilize NASP‐bound histones. To test this, we immunoprecipitated stably expressed sNASP‐FL from the non‐nucleosomal fraction of parental or UBR7KO 293T cells. We did not observe significant changes in sNASP‐FL steady‐state protein levels in UBR7KO versus parental cells (Fig 7C and D). sNASP‐FL co‐purified greater amounts of post‐nucleosomal (H3K4me3 and H3K9me3) histones in UBR7KO versus parental 293T cells (Fig 7C and D), suggesting that UBR7 antagonizes non‐nucleosomal histone stability promoted by sNASP.
Figure 7. UBR7 opposes stabilization of NASP‐bound post‐nucleosomal histone H3.
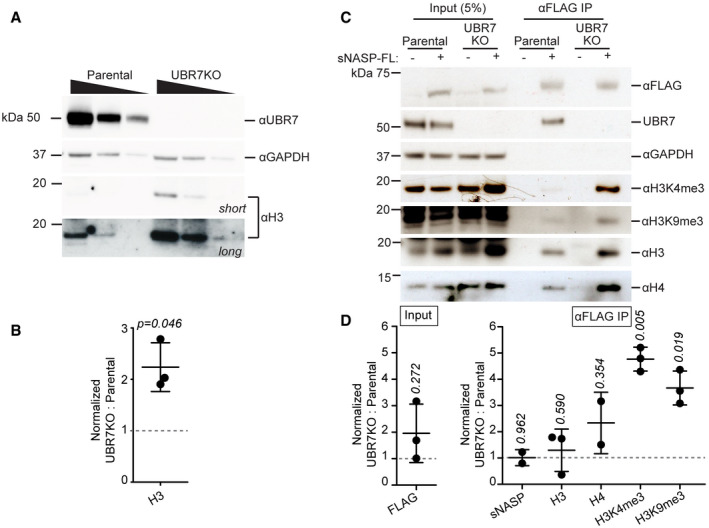
- Immunoblot analysis of histone H3, UBR7, and GAPDH in the non‐nucleosomal fraction of parental and 293T‐UBR7KO cells.
- Quantification of anti‐histone H3 immunoblot represented in (A). Immunoblot signals were normalized to anti‐GAPDH signal. Error bars represent mean ± standard deviation. A two‐tailed one‐sample t‐test was used to calculate P‐value (italics) associated with group mean difference from a hypothetical value of 1.0 (represented by dashed line). Experiment was performed three times.
- Immunoblot analysis of anti‐FLAG pulldown of sNASP‐FL in parental or 293T‐UBR7KO cells. 3xFLAG‐tagged sNASP‐FL was immunoprecipitated from non‐nucleosomal fraction. Experiment was performed three times.
- Quantification of anti‐FLAG (sNASP‐FL), and anti‐histone immunoblots represented in (C). Immunoblot signals were normalized to anti‐FLAG signal. Error bars represent mean ± standard deviation. A two‐tailed one‐sample t‐test was used to calculate P‐values (italics) associated with group means difference from a hypothetical value of 1.0 (represented by dashed line). Experiments were performed two (sNASP, H4) to three (all other targets) times.
Source data are available online for this figure.
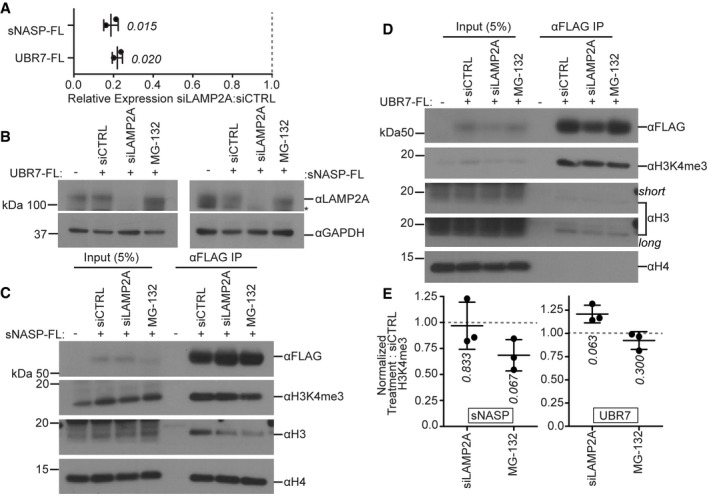
UBR7 does not promote degradation of sNASP‐bound histones
Previous work suggests that in the absence of NASP, non‐nucleosomal H3/H4 histones are degraded through chaperone‐mediated autophagy (CMA) (Cook et al, 2011). To test the idea that the accumulation of sNASP‐bound post‐nucleosomal H3 in the absence of UBR7 is because UBR7 promotes degradation of sNASP‐bound histones, we repeated IP of sNASP‐FL from the non‐nucleosomal fraction of 293T cells following inhibition of CMA or the proteasome by targeting the lysosomal adaptor LAMP2A with siRNA (Fig 8A and B) or treating cells with MG132, respectively. We did not observe an accumulation of sNASP‐ or UBR7‐bound post‐nucleosomal H3K4me3 after inhibition of CMA or the proteasome (Fig 8C–E). This suggests that the accumulation of sNASP‐bound histones in the absence of UBR7 is not due to a failure to degrade sNASP‐bound histones.
Figure 8. Inhibition of degradation does not cause accumulation of UBR7 or sNASP‐bound post‐nucleosomal histones.
-
AChanges in LAMP2A expression. RT–qPCR was performed to detect Actin and LAMP2A mRNA following treatment with siCTRL or siLAMP2A in sNASP‐FL and UBR7‐FL 293T cells. Gray dotted line represents expression level in siCTRL treatment. Error bar represents mean ± standard deviation. A two‐tailed one‐sample t‐test was used to calculate P‐values (italics) associated with group means difference from a hypothetical value of 1.0. Experiment was performed twice.
-
BImmunoblot for LAMP2A in parental 293T cells or cells expressing UBR7‐FL (left) or sNASP‐FL (right) following treatment with siCTRL, siLAMP2A, or MG‐132.
-
C, DImmunoblot for total and modified histones following anti‐FLAG IP from the non‐nucleosomal fraction of sNASP‐FL (C) or UBR7‐FL (D) expressing 293T cells treated with siCTRL, siLAMP2A, or MG‐132.
-
EQuantification of data represented in (C, D). Error bars represent mean ± standard deviation. A two‐tailed one‐sample t‐test was used to calculate P‐values (italics) associated with group means difference from a hypothetical value of 1.0 (represented by dashed line). Experiments in (C–E) were performed three times.
Source data are available online for this figure.
UBR7 promotes reincorporation of H3K4me3 into chromatin
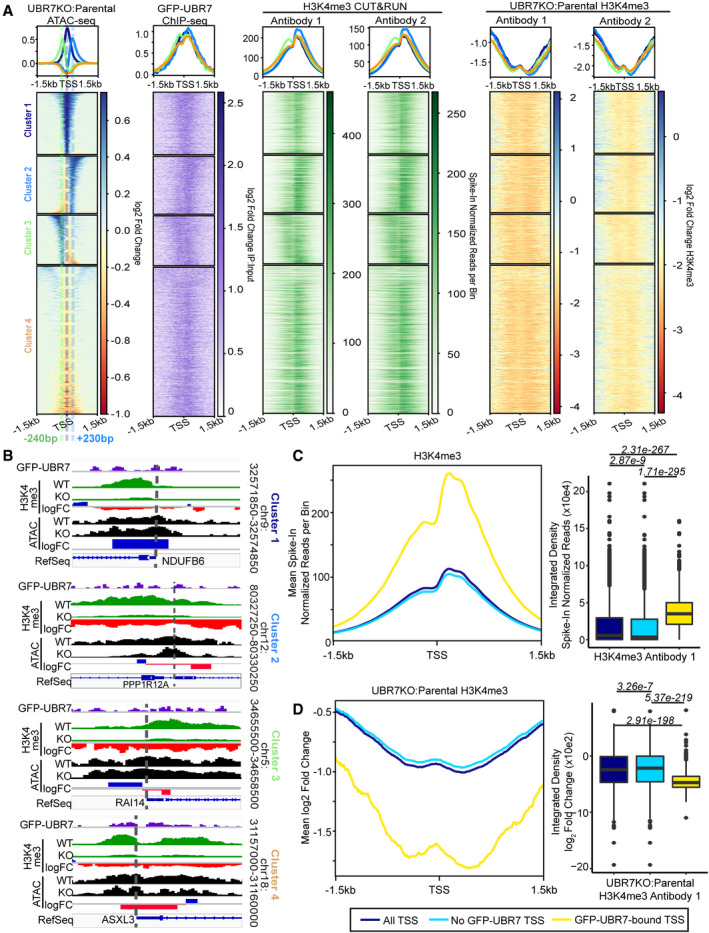
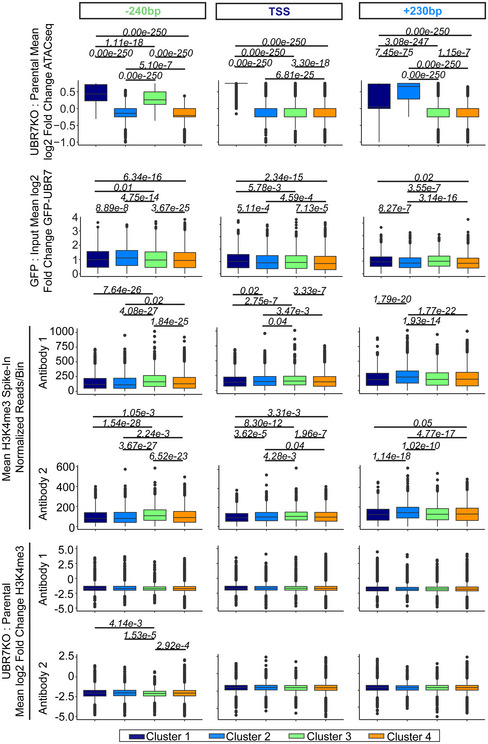
In order to determine whether the accumulation of sNASP‐bound post‐nucleosomal histones in the absence of UBR7 results from a cessation of histone reincorporation, we assessed changes in chromatin accessibility and the levels of H3K4me3 at sites bound by UBR7. We first performed ChIP‐seq for GFP‐UBR7 in 293T cells and found that GFP‐UBR7 peaks are enriched at promoters and transcription start sites (promoter‐TSS), followed by introns, and then intergenic regions (Figs 9 and EV6A–C, Table 1). ATAC‐seq analysis was conducted in parental and UBR7KO 293T cells (Fig 9). To focus on sites related to UBR7 function, and because we observed that a large proportion of GFP‐UBR7 peaks are associated with a promoter‐TSS (Table 1), we visualized changes in ATAC‐seq signal in UBR7KO versus parental 293T cells centered on TSS where changes in accessibility were observed in the absence of UBR7 (Fig 9A and B). Unsupervised K‐means analysis separated the data into 4 clusters with differing patterns of chromatin accessibility changes relative to the TSS. Chromatin accessibility at the TSS increases in cluster 1 and decreases in cluster 4 (Fig 9A and B) in UBR7KO versus parental 293T cells. These changes center on the TSS. In cluster 2, chromatin accessibility increases downstream of the TSS and decreases upstream of the TSS in the absence of UBR7, and vice versa in cluster 3 (Fig 9A and B). We centered GFP‐UBR7 ChIP‐seq data on these same TSS and observed that the pattern of GFP‐UBR7 binding mirrors that of chromatin accessibility gains in UBR7KO versus parental cells in clusters 1–3 (Figs 9A and B, and EV7).
Figure 9. Chromatin accessibility is altered and H3K4me3 is decreased at TSS bound by GFP‐UBR7 in UBR7KO 293T cells.
-
AHeatmaps of ATAC‐seq, anti‐GFP (GFP‐UBR7) ChIP‐seq, and anti‐H3K4me3 CUT&RUN in parental and UBR7KO cells. Plots are centered on TSS that show changes in ATAC‐seq signal in UBR7KO versus parental cells. Sites are clustered by unsupervised K‐means analysis. Cluster color key is defined by cluster labels.
-
BRepresentative genome track examples of clusters 1–4 as defined in (A). Antibody 1 H3K4me3 data are shown.
-
C, DMetaplots (left) of mean values per bin centered on all TSS, TSS not bound by GFP‐UBR7, and GFP‐UBR7‐bound TSS. Dot plots (right) represent H3K4me3 (Antibody 1) from parental 293T cells (C) or loss of H3K4me3 in UBR7KO versus parental cells (D). Box limits represent 25th and 75th percentiles. Whiskers extend to 1.5× the interquartile range. Outliers are represented as black dots. A Kruskal‐Wallis multiple comparisons test with Dunn post‐hoc test was used to calculate Benjamini‐Hochberg adjusted P‐values (italics). Values P < 0.05 are pictured. Experiment was performed with two independent anti‐H3K4me3 antibodies (see also data for Antibody 2 in Fig EV6E).
Figure EV6. Chromatin accessibility is altered and H3K4me3 is decreased at TSS bound by GFP‐UBR7 in UBR7KO 293T cells.
- Generation of GFP‐UBR7 293T cells. CRISPR‐Cas9 was used to insert GFP at the N‐terminus of endogenous UBR7 by homology directed repair. Loss of endogenous UBR7 and gain of GFP‐UBR7 (+25 kDa) were confirmed by immunoblot.
- Overlap of high‐confidence GFP‐UBR7 peaks with all non‐redundant TSS of hg19/GRCh37.
- Overlap of TSS with changes in chromatin accessibility in UBR7KO (i.e., TSS in Fig 9A) with all TSS as defined in (B).
- Representative genome track examples of H3K4me3 CUT&RUN with Antibody 2 in clusters 1–4 as defined in (Fig 9A).
- Metaplots of mean values per bin centered on all TSS, TSS not bound by GFP‐UBR7, and GFP‐UBR7‐bound TSS, as represented in (B). Dot plots represent H3K4me3 (Antibody 2) from parental 293T cells (left) or loss of H3K4me3 in UBR7KO versus parental cells (right). Box limits represent 25th and 75th percentiles. Whiskers extend to 1.5× the interquartile range. Outliers are represented as black dots. Values in italics represent Benjamini‐Hochberg adjusted P‐values from Dunn post‐hoc test following a Kruskal‐Wallis multiple comparisons test. Experiment was performed with two independent anti‐H3K4me3 antibodies (see also data for Antibody 1 in Fig 9C and D).
- Generation of additional UBR7KO2 293T cells for RNA‐seq. CRISPR‐Cas9 was used to insert a puromycin‐resistance cassette at the N‐terminus of endogenous UBR7 by homology directed repair. Loss of endogenous UBR7 was confirmed by immunoblot.
- Boxplots of mean log2 fold change of RNA levels (RNA‐seq) per TSS ± 1.5 kb in clusters 1–4 as defined in (D, Fig 9A). Box limits represent 25th and 75th percentiles. Whiskers extend to 1.5× the interquartile range. Outliers are represented as black dots. Experiment was performed three times.
Table 1.
Homer analysis of GFP‐UBR7 ChIP‐Seq peaks.
| Feature | % GFP‐UBR7 peaks |
|---|---|
| Promoter‐TSS | 42.4 |
| Intron | 24.7 |
| Intergenic | 14.7 |
| Exon | 7.1 |
| 5'UTR | 6.2 |
| Non‐coding | 2.4 |
| TTS | 1.8 |
| 3′UTR | 0.6 |
Figure EV7. GFP‐UBR7 binding, enrichment of H3K4me3, and changes in chromatin accessibility in the absence of UBR7 are spatially correlated.
Boxplots of defined values per TSS. Values were averaged across 100 bp centered on the TSS or the maximum mean gain in chromatin accessibility in clusters 2–3 (+230 bp or −240 bp, respectively) as defined in (Fig 9A). Box limits represent 25th and 75th percentiles. Whiskers extend to 1.5× the interquartile range. Outliers are represented as black dots. A Kruskal–Wallis multiple comparisons test with Dunn post‐hoc test was used to calculate Benjamini‐Hochberg adjusted P‐values (italics). Values P < 0.05 are pictured. ATAC‐seq was performed twice. GFP‐UBR7 ChIPseq was performed once. H3K4me3 CUT&RUN was performed with two independent anti‐H3K4me3 antibodies.
Based on the interaction of UBR7 with H3K4me3 and the increase of sNASP‐bound H3K4me3 in UBR7KO versus parental 293T cells, we assessed whether UBR7 function affects the degree of H3K4me3 at sites with changes in chromatin accessibility.
H3K4me3 levels were assessed by CUT&RUN for H3K4me3 using independent anti‐H3K4me3 antibodies in UBR7KO and parental 293T cells (Figs 9, EV6D and E, and EV7). The parental H3K4me3 signal was centered on the TSS in clusters 1–4 described above. We observed the typical enrichment of H3K4me3 around the TSS, with a greater enrichment immediately downstream of the TSS relative to upstream of the TSS (Figs 9A and C and EV6E) (Koch et al, 2007; Reveron‐Gomez et al, 2018). H3K4me3 signal in UBR7KO versus parental cells at these same sites showed H3K4me3 levels are reduced over the TSS in the absence of UBR7 (Figs 9 and EV6D and E). GFP‐UBR7 binding, local enrichments of H3K4me3, and changes in chromatin accessibility and H3K4me3 levels in the absence of UBR7 are spatially correlated (Fig EV7). Specifically, in cluster 2, H3K4me3 levels are higher downstream of the TSS than in clusters 1, 3, and 4, and GFP‐UBR7 binding and gains in chromatin accessibility in the UBR7KO occur downstream of the TSS (Figs 9A and B, and EV7). Furthermore, the loss of H3K4me3 downstream of the TSS is greater in cluster 2 than clusters 1, 3, and 4. A similar correlation occurs upstream of the TSS in cluster 3, where GFP‐UBR7 binding and gains in chromatin accessibility in the UBR7KO occurs upstream of the TSS, and H3K4me3 loss upstream of the TSS is greater in cluster 3 than clusters 1, 2, and 4 (Figs 9A and B, and EV7). Across clusters 1–4, we did not observe trends of changes in steady‐state RNA levels in UBR7KO versus parental cells by RNA‐seq (Fig EV6F and G). Importantly, the enrichment in H3K4me3 and changes in H3K4me3 levels in the absence of UBR7 are enriched at GFP‐UBR7‐bound TSS relative to all other TSS (Figs 9C and D, and EV6E).
Discussion
Histone chaperones regulate the stability of histones upstream of histone nuclear import and deposition into chromatin, during chromatin‐based processes such as gene transcription and DNA replication, and downstream of histone eviction from chromatin (Campos et al, 2010, 2015; Alabert et al, 2017; Lai & Pugh, 2017; Kobayashi & Kurumizaka, 2019). When histones are evicted from chromatin, possible outcomes include histone storage in a soluble non‐nucleosomal reservoir, degradation, or reincorporation into nucleosomes in chromatin (Cook et al, 2011; Gan et al, 2018; Petryk et al, 2018; Yu et al, 2018; Jeronimo et al, 2019; Torne et al, 2020; Hogan & Foltz, 2021).
Here, we characterize UBR7 as a chaperone of post‐nucleosomal H3.1/H4 histone complexes. We show that UBR7 is enriched in the nucleus of human cells, but while it is bound to intact chromatin, UBR7 is largely non‐nucleosomal. This is consistent with other work demonstrating binding of UBR7 to both chromatin‐derived nucleosomal and nuclear soluble non‐nucleosomal H3 (Campos et al, 2015; Ji et al, 2015; Kleiner et al, 2018). UBR7 reportedly has multiple functions in human cells. In mammary epithelial cells, the UBR7 PHD has been proposed to function as an H2B monoubiquitin ligase (Adhikary et al, 2019), and treatment with the anti‐cancer drug asukamycin enhances or induces interaction between UBR7 and p53, which promotes apoptosis (Isobe et al, 2020). Here, we demonstrate that the UBR7 UBR box and UBR7 PHD mediate binding to the N‐terminal tail of histone H3 bearing marks H3K4me2/3 and H3K9me3 in the non‐nucleosomal fraction of human cells. We did not observe binding of UBR7 to H2B in asynchronous 293T cells, which is consistent with a majority of UBR7 being associated with a non‐nucleosomal population of histone H3. As these marks are catalyzed in chromatin (Benson et al, 2006; Loyola et al, 2006; Hyun et al, 2017), these represent pre‐existing, evicted post‐nucleosomal histones.
We characterize UBR7 as a binding partner of the histone chaperone NASP. Using an unbiased BioID approach and reciprocal co‐IP, we showed that UBR7 interacts with NASP in the non‐nucleosomal fraction of 293T cells. Our work and the work of others provides substantial evidence for stable binding of UBR7 to histone H3 (Foltz et al, 2006, 2009; Campos et al, 2015; Ji et al, 2015; Lambert et al, 2015; Kleiner et al, 2018). We demonstrated that replication is a source of both UBR7‐ and NASP‐bound post‐nucleosomal histones. This is consistent with previous work, demonstrating that replication is a source of NASP‐bound histones, that the association between non‐nucleosomal H3.1 histones and either UBR7 or NASP increases during S‐phase, and that NASP binds non‐nucleosomal H3/H4 and buffers the cell against free histone oversupply in the context of replication stress (Cook et al, 2011; Campos et al, 2015). We propose the histone chaperone functions of NASP and UBR7 are important for regulating the post‐nucleosomal histone supply during replication. We observe that both UBR7 and NASP bind to post‐nucleosomal H3K4me3 histones, but only NASP binds to pre‐nucleosomal H4K12ac histones. sNASP binds histones in the absence of UBR7, demonstrating that sNASP exists in complex with histones independently of UBR7. Furthermore, we observe that UBR7 binds histone tail peptides in the absence of NASP. It is likely that subcomplexes of UBR7 and sNASP bound to post‐nucleosomal histones exist.
We demonstrate that UBR7 functions to modulate the supply of post‐nucleosomal H3K4me3 histones. In the absence of NASP, non‐nucleosomal H3 is lost (Cook et al, 2011). In contrast, we demonstrated that in the absence of UBR7, the non‐nucleosomal H3 pool increases, and sNASP‐bound post‐nucleosomal histones accumulate. This could be due to either changes in degradation or reincorporation into chromatin of sNASP‐bound post‐nucleosomal histones. Inhibition of CMA or the proteasome, both of which have been shown to influence histone stability, did not result in the accumulation of sNASP‐bound H3K4me3, as observed in UBR7KO cells, suggesting that UBR7 does not promote degradation of sNASP‐bound histones. Rather, UBR7‐bound TSS are more highly enriched for H3K4me3 than all other TSS, and loss of UBR7 leads to a reduction in nucleosomal H3K4me3 and changes in chromatin accessibility at these sites. These changes are spatially correlated upstream and downstream of the TSS. The observed changes in the chromatin landscape in the absence of UBR7 are not correlated with changes in steady‐state RNA levels. In UBR7KO cells, we observed loss of H3K4me3 both in clusters which gained or lost chromatin accessibility. This suggests that while H3K4me3 levels and UBR7 occupancy may influence where changes in chromatin accessibility take place, secondary factors may influence whether chromatin accessibility increases or decreases in the absence of UBR7. Together, these data support a model in which UBR7 promotes the reincorporation of sNASP‐bound post‐nucleosomal tri‐methylated histone H3 into chromatin. In the absence of UBR7, these histones remain sequestered in a stable sNASP‐bound non‐nucleosomal reservoir and the chromatin becomes depleted of H3K4me3 preferentially at sites normally bound by UBR7 (Fig 10).
Figure 10. UBR7 promotes redeposition of sNASP‐bound post‐nucleosomal H3K4me3.
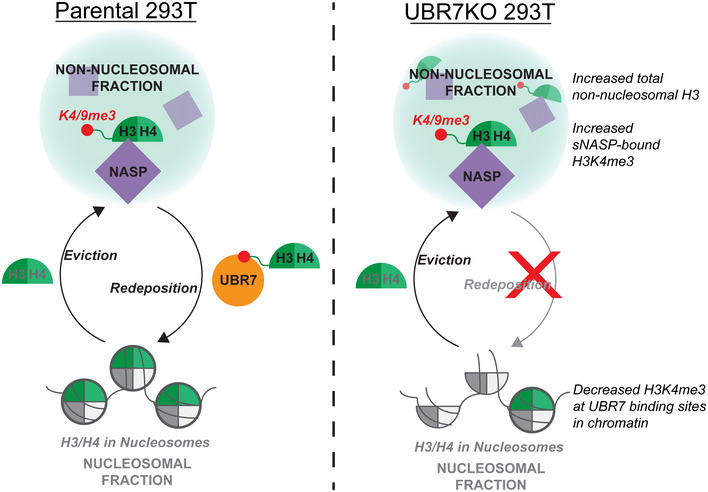
Model of UBR7 function. In the absence of UBR7, sNASP‐bound H3K4me3 is not deposited, and total non‐nucleosomal H3 and sNASP‐bound H3K4me3 accumulate, leading to depleted H3K4me3 at UBR7 binding sites in chromatin.
In general, the pathways which chaperone and govern the stability of post‐nucleosomal histones are less well characterized than the pathways which chaperone pre‐nucleosomal histones and nucleosomal histones during chromatin‐based processes including DNA replication. The UBR7‐NASP histone chaperone axis specifies a previously unidentified pool of post‐nucleosomal histones that are defined by N‐terminal di‐ and tri‐methylation bound by UBR7. UBR7 is a unique histone chaperone in its binding preference for post‐nucleosomal histones and its preference for binding to histones based on specific N‐terminus PTMs. This work provides new insight into regulation of the post‐nucleosomal histones through interactions between histones and the histone chaperones NASP and UBR7.
Materials and Methods
Cell culture and stable cell lines
293T, HeLa, and RPE lines and cells derived from these parental lines were grown in DMEM with 10% fetal bovine serum (FBS Optima, Atlanta Biologicals) and 1% Pen/Strep in a 37°C incubator with 5% CO2. Parental cell lines used in this study were gifts from the D. Cleveland laboratory. Cell lines tested negative for mycoplasma. Cell lines were validated using NGSCheckMate (Lee et al, 2017).
The HeLa H3.1‐BirA*‐HA cell line was derived as described previously (Zasadzinska et al, 2018).
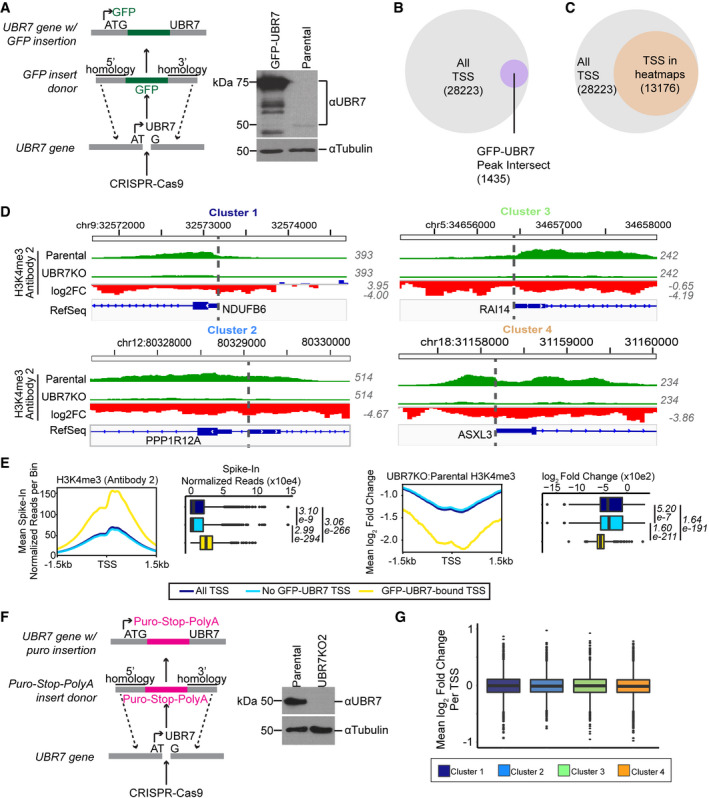
The GFP tagged UBR7 cell line was generated using CRISPR/Cas9‐mediated homology directed repair. UBR7‐sgRNA1 (Table EV2) that targets the N‐terminus of UBR7 gene was cloned into pX330‐U6‐Chimeric_BB‐CBh‐hSpCas9 plasmid (Addgene #42230) (Cong et al, 2013) and used to make a double‐stranded break. For GFP tagging, the linear repair PCR product was generated from a template plasmid containing GFP and using primers GFP‐UBR7‐Fwd and GFP‐UBR7‐Rev (Table EV2) that included a 50 bp UBR7 homology region. The primers were phosphorothioate modified at the 5′ two linkages to increase the stability of the PCR product in the cell. CRISPR/Cas9 plasmid (1 μg) and gel‐purified linear repair PCR product (400 ng) were co‐transfected in 293T cells using Lipofectamine 2000 reagent (Thermo Fisher Scientific 13778150) according to manufacturer protocol. Three days post‐transfection, the cells were expanded to a 10‐cm plate. Individual GFP‐positive colonies were hand‐picked following sorting by flow cytometry. The GFP integration was confirmed by immunoblotting using anti‐GFP antibody and anti‐UBR7 antibody (Table EV3). Genomic integration of GFP was also confirmed by genomic PCR and sequencing.
The doxycycline‐inducible RPE1hTERT H3.1‐APEX2‐3xFLAG and the 293T sNASP‐FL lines were generated by viral transduction. Lentivirus was produced by transfecting 3 × 10⁶ 293T cells on a 10‐cm plate using 12 μg of lentiviral transfer plasmid encoding H3.1‐APEX2‐3xFLAG or sNASP‐3xFLAG (sNASP‐FL), 6 μg of psPAX2 2nd‐generation viral packaging vector (Addgene #12260), and 3 μg pMD2.G viral envelope vector (Addgene #12259) with Lipofectamine 3000 (Life Technologies). After 18 h, the culture medium was replaced. Virus‐containing media was collected 48 and 72 h post‐transfection, pooled, passed through a 0.45‐μM SFCA syringe filter, and stored at −80°C. In order to make stable 293T and RPE cell lines, cells were transduced 5–18 h at an MOI of 0.3–0.5 in culture medium supplemented with 8 μg/ml polybrene. Transduced RPE cells were selected 48 h post‐transduction in 10 μg/ml puromycin DMEM for 5 days. Transduced 293T cells were selected 48 h post‐transduction by treatment with 1 μg/ml puromycin for 96 h. Doxycycline‐inducible expression of H3.1‐APEX2‐3xFLAG or constitutive expression of sNASP‐FL was confirmed by immunoblot and immunofluorescence using anti‐FLAG antibody (Table EV3).
Generation of UBR7KO1 293T clonal cells using UBR7‐sgRNA2 (Table EV2) was previously described (Srivastava et al, 2021).
Generation of UBR7KO2 clonal cells was as described for GFP‐UBR7 cells, but using a PCR donor insert encoding a puromycin‐stop‐polyA cassette generated using primers Puro‐UBR7‐Fwd and Puro‐UBR7‐Rev (Table EV2).
BioID and mass spectrometry
SILAC and BioID experiments were performed and biotinylated proteins purified as previously described (Zasadzinska et al, 2018). Mass spectrometry and protein identification were conducted as previously described (Hickox et al, 2017). Briefly, Log2 fold ratios were calculated from heavy versus light total spectral counts. Results were filtered against a list of common contaminants in BioID experiments performed in HeLa cells derived from the CRAPome database (Mellacheruvu et al, 2013). Filtered contaminants were selected based on Z‐scores > 2 and their occurrence in 90% of BioID experiments.
Immunofluorescence
Cells were plated in culture medium on coverglass (Fisher Scientific 12‐545‐81) pre‐coated with 0.1% poly L‐lysine (Sigma Aldrich P8920‐100ML). Visualization of H3.1‐BirA*‐HA, UBR7‐BirA*‐HA, and biotin‐labeled proteins was performed as described (Zasadzinska et al, 2018). tNASP‐FL, sNASP‐FL, and UBR7‐FL were visualized in transiently transfected HeLa cells. 24 h post‐transfection, cells were washed once with PBS, fixed in 4% formaldehyde in PBS for 10 min, and quenched with 0.1 M Tris–HCl (pH8.0). To visualize chromatin‐bound proteins, cells were pre‐extracted with 0.1% Triton X‐100 in PBS for 3 min prior to formaldehyde fixation (Moreno‐Moreno et al, 2006; Huang et al, 2019; Prendergast et al, 2020). For visualization of H3.1‐APEX2‐3xFLAG or biotin‐labeled proteins, cells were fixed as described above, excluding pre‐extraction, either 4.5 or 48 h after beginning of doxycycline pulse. Fixed cells were incubated in blocking buffer (0.1% Triton X‐100, 2% FBS, 1.6 mg/ml BSA in PBS) for 1 h at room temperature and incubated with indicated primary antibodies or Cy3‐streptavidin (Table EV3) in blocking buffer for 1 h. After washing in PBS supplemented with 0.1% Triton X‐100, cells were incubated with Cy3‐ or FITC‐conjugated secondary antibodies (Table EV3) at 1:1,000 for 1 h at room temperature. Following washing, cells were incubated with 0.2 μg/ml DAPI in PBS for 5 min, washed, and mounted on glass slides with Prolong Gold (Thermo Fisher Scientific P36930). Confocal imaging was conducting using a Zeiss LSM800 microscope with a 63× objective. All comparative images were collected under identical imaging parameters. Nuclear immunofluorescence signals were quantified as integrated pixel density from DAPI‐defined nuclear regions of interest in Fiji.
Plasmids and transfection
TAP‐tagged constructs were previously described (Foltz et al, 2006). HA‐tagged histone H3.1 and tailless mutant were generated using a destination vector provided by the Stukenberg lab and either H3.1‐F or H3.1‐tailless‐F and common H3.1‐R primers (Table EV2). His‐MBP tagged full‐length UBR7 was generated by LR reaction using pDEST566 (Addgene #11517) destination vector. UBR7‐LAP and various truncation mutants were created using gateway cloning into the LAP tag vector (Addgene #67618) containing eGFP and S‐tag. UBR7‐FLAG and various truncation mutants were previously described (Srivastava et al, 2021). To generate UBR7‐3xFLAG (UBR7‐FL), UBR7 and 3xFLAG sequences were PCR amplified from UBR7 and 3xFLAG expression constructs using primers UBR7‐FL‐Fwd1/UBR7‐FL‐Rev1 (UBR7) and UBR7‐FL‐Fwd2/UBR7‐FL‐Rev2 (3xFLAG) (Table EV2). The PHDΔ142‐146 mutant insert was amplified using primers UBR7‐FL‐Fwd1/PHDΔ142‐146‐Rev1 and PHDΔ142‐146‐Fwd2/UBR7‐FL‐Rev2 (Table EV2). The UBR‐4A mutant insert was amplified using primers UBR7‐FL‐Fwd1/UBR‐4A‐Rev1 and UBR‐4A‐Fwd2/UBR7‐FL‐Rev2 (Table EV2). The amplified and purified PCR fragments were cloned into EcoRV‐digested pLenti CMV Puro DEST (w118‐1) (Addgene # #17452) using NEBuilder HiFi DNA Assembly (NEB) according to manufacturer protocol. Gateway APEX2‐3xFLAG destination vector was produced by NEBuilder HiFi DNA Assembly using SalI/AgeI digested pCW57.1(Addgene #41393), and a synthetic gBlock of the APEX2‐3xFLAG sequence (Hung et al, 2016) flanked by overlaps upstream to the SalI and downstream to the AgeI site of pCW57.1 (Table EV2). H3.1‐APEX2‐3xFLAG was produced through Gateway LR reaction of Histone H3.1A entry clone (ORFeome v5.1) with our APEX2‐3xFLAG destination plasmid. Expression constructs of sNASP‐3xFLAG (sNASP‐FL) and tNASP‐3xFLAG (tNASP‐FL) were generated through gateway LR reactions of destination vector pCSF107mT‐GATEWAY‐3'‐FLAG (Addgene #67619) with entry clones sNASP (ORFeome v5.1) and tNASP (DNASU HsCD00042292), respectively. Then, to generate lentiviral expression constructs, overlapping PCR fragments were generated from sNASP‐3xFLAG and tNASP‐3xFLAG expression constructs using PCR primers s/tNASP‐FLAG‐F and s/tNASP‐FLAG‐R (Table EV2) and cloned into EcoRV‐digested pLenti CMV Puro DEST (w118‐1) (Addgene #17452) using NEBuilder HiFi DNA Assembly (NEB). Unless otherwise described, plasmids were transfected using Lipofectamine 2000 or 3000 (Thermo Fisher Scientific 13778150 or L3000015).
Whole cell immunoprecipitation and immunoblotting
For confirmation of UBR7 association with histone H3.1, 293T cells were co‐transfected with full‐length UBR7‐LAP or indicated truncation mutants and with TAP‐ or HA‐tagged histone H3.1 (H3.1‐TAP, H3.1‐HA) or indicated mutant or TAP‐tagged CENP‐A (CENP‐A‐TAP). 24 h post‐transfection, cells were lysed in RIPA buffer (50 mM Tris (pH 7.5), 150 mM NaCl, 1% NP40, 1 mM EDTA, Deoxycholic acid 0.3%, 0.15% SDS, 10% glycerol and protease and phosphatase inhibitors) for 30 min. The lysate was clarified by centrifugation for 30 min at 4°C at maximum speed and pre‐cleared with Gammabind Sepharose beads for 1 h. The antibody conjugated (anti‐HA or IgG, Table EV3) Gammabind Sepharose beads were blocked by 1 mg/ml BSA in RIPA buffer for 45 min. The beads were incubated with pre‐cleared lysate overnight at 4°C. The immune complex was recovered with Gammabind Sepharose beads, and the beads were washed 3× in RIPA buffer. Laemmli buffer was added to the beads, and purified proteins were eluted by heating at 95°C for 5 min. Anti‐GFP and anti‐HA antibodies were used for immunoblotting (Table EV3). Purification of FLAG‐tagged full‐length and mutant UBR7‐FLAG constructs in cells co‐transfected with H3.1‐HA was performed as described previously (Srivastava et al, 2021). The indicated antibodies were used for immunoblotting (Table EV3). The integrated pixel density of all immunoblot signals was quantified in Fiji.
Cellular fractionation, immunoprecipitation, and immunoblotting
For determining subcellular distribution of UBR7, cells were fractionated as described previously (Herz et al, 2014). Briefly, cells were lysed by incubation with cold, hypotonic Buffer A (10 mM HEPES‐KOH, pH 7.9, 10 mM KCl, 1.5 mM MgCl2, 340 mM sucrose, 10% glycerol, 0.2% Triton X‐100, 10 mM Sodium Butyrate, and 1× Protease inhibitor cocktail [Cat# 8340, Sigma‐Aldrich]) for 10 min, followed by centrifugation for 3 min, 1,300 g at 4°C. After collection of the supernatant containing soluble non‐nucleosomal proteins, remaining nuclei were further purified over a sucrose cushion (10 mM HEPES‐KOH, 30% sucrose, 1.5 mM MgCl2, 10 mM sodium butyrate), then incubated with 5 × 10³ U/ml MNase (New England Biolabs M0247S) in Buffer A supplemented with 1 mM CaCl2 for 15 min in a 37°C water bath. After addition of Stop Buffer (2 mM EGTA, 1 mM EDTA, 90 mM KCl, 0.1% Triton X‐100), cells were incubated on ice 10 min, then centrifuged for 20 min, 20,000 g at 4°C. The supernatant containing MNase‐liberated nucleosomal proteins was collected. To assess binding of non‐nucleosomal proteins to stably expressed sNASP‐FL or transiently transfected (72 h) tNASP‐FL, sNASP‐FL, or UBR7‐FL and mutants, cells were fractionated as described. The non‐nucleosomal fraction was incubated with Pierce Anti‐DYKDDDDK magnetic agarose (PIA36797, Fisher Scientific) overnight at 4°C. The recovered complexes and magnetic agarose were washed 4× in Wash Buffer (50 mM HEPES‐KOH, pH 7.9, 0.1 M KCl, 50 mM NaCl, 10% glycerol, 1 mM EDTA, 2 mM EGTA, 0.1% Triton X‐100, 10 mM sodium butyrate), and recovered complexes were eluted with 200 μg/ml 3xFLAG peptide (F4799, Sigma Aldrich) in Elution Buffer (20 mM HEPES‐KOH, pH 7.9, 0.1 M NaCl, 10 mM sodium butyrate) for 20 min on ice. To inhibit DNA or RNA polymerases stably expressed UBR7‐FL or sNASP‐FL, cells were treated with DNA polymerase inhibitors (2 mM hydroxyurea, 5 µg/ml aphidicolin) or RNA polymerase inhibitors (50 nM α‐amanitin, 0.1 µM triptolide) for 24 h prior to fractionation, as previously described (Campos et al, 2015). To inhibit CMA, stably expressing UBR7‐FL or sNASP‐FL cells were transfected with 20 nM siCTRL (Invitrogen # 4390846) or siLAMP2A (Table EV2) (Cook et al, 2011) for 5 h with RNAiMAX (Thermo Fisher Scientific #13778150) according to manufacturer protocol 48 h prior to fractionation. To inhibit the proteasome, stably expressed UBR7‐FL or sNASP‐FL cells were treated with 1 µM MG‐132 for 24 h prior to fractionation. To evaluate non‐nucleosomal histone levels in UBR7KO and parental 293T cells, cells were fractionated as previously described (Cook et al, 2011). The indicated antibodies were used for immunoblotting (Table EV3). Immunoblot integrated pixel densities were calculated using gel analysis tool in Fiji.
Histone peptide microarrays
Recombinant His‐MBP‐UBR7 was expressed and purified from Rosetta BL21 E. coli cells grown in LB supplemented with 0.6 mg/ml ZnCl2. Bacteria were lysed by sonication in Lysis buffer (25 mM Tris–Cl, pH 7.2, 200 mM NaCl, 20 mM MgCl2, 10% Glycerol, 5 mM BME, 10 mM beta‐glycerophosphate, 0.2 mM PMSF, Benzamidine (1,000× stock), Roche Complete Protease inhibitors (Sigma‐Aldrich 11873580001)). Recombinant His‐MBP‐UBR7 was purified on amylose beads and eluted with PBS containing 10 mM maltose and 0.6 mg/ml ZnCl2.
The purified protein was diluted in Binding Buffer (1× PBS, 5% BSA (w/v), 0.1% Tween‐20) to a final concentration of 3.4 μM. The peptide array was blocked in Binding Buffer for 30 min, and 200 µl His‐MBP‐UBR7 protein was then pipetted directly on to the peptide array and a coverslip placed on top of the solution. The array was placed in a humidified chamber and incubated overnight at 4°C. The array was washed with Binding Buffer and incubated with anti‐MBP antibody (1:1,000, New England Biolabs E8032S) for 2.5 h followed by Alexa‐647 conjugated goat anti‐mouse IgG (Jackson Immuno Research Labs Cat 115605003) antibody for 1 h. Fluorescence we detected using a Typhoon Trio imager. The peptide array was quantified using the Microarray Profile Image J plugin. Integrated density was collected for the peptide spot (Ispot) and for the spot + the surrounding background (ISpot+background). Local background correction we conducted using the following formula (ISpot+background–Ispot)/((Aspot+background–Aspot)/Aspot)where I = Integrated Density and A = area. Z‐score was calculated using all spots on the array.
Peptide pulldowns
Nuclear extract from 293T cells was prepared as described before with minor modifications (Dignam et al, 1983). Cells were suspended in 5 packed cell pellet volumes of Buffer A (10 mM HEPES, pH 7.9, 1.5 mM MgCl2, 10 mM KCl, and 0.5 mM DTT) and incubated for 10 min on ice. Cells were collected by centrifugation and re‐suspended in 2 packed cell pellet volumes of Buffer A. The cells were lysed by 13 strokes of a glass Dounce homogenizer (loose pestle) to release the nuclei. The nuclei were pelleted by centrifugation at 2,000 g. The supernatant was carefully removed, and the pellet was re‐suspended in 1.5 ml of Buffer C (20 mM HEPES, pH 7.9, 25% (v/v) glycerol, 0.42 M NaCl, 1.5 mM MgCl, 0.2 mM EDTA, 0.5 mM PMSF, and 0.5 mM DTT). The nuclei were lysed by 13 strokes of a glass Dounce homogenizer (tight pestle). Salt concentration was adjusted to 150 mM NaCl using Buffer D without salt (20 mM HEPES, pH 7.9, 20% (v/v) glycerol, 0.2 mM EDTA, 0.5 mM PMSF, and 0.5 mM DTT). Triton X‐100 was added to the nuclear extract to a final concentration of 0.1% and centrifuged at 15,000 g for 15–30 min. The supernatant was transferred to a fresh tube and pre‐cleared by using streptavidin magnetic beads. To make peptide conjugated streptavidin magnetic beads, beads were pre‐incubated with biotinylated peptides in PBS with 0.1% Triton X‐100 for ˜18 h at room temperature. The peptide‐conjugated streptavidin beads were then blocked by incubating in Buffer D (20 mM HEPES, pH 7.9, 20% (v/v) glycerol, 0.1 M KC1, 0.2 mM EDTA, 0.5 mM PMSF, and 0.5 mM DTT) containing 1 mg/ml BSA for 30 min. The beads were then added to the pre‐cleared lysate and incubated ˜18 h at 4°C, followed by 6 washes with Buffer D containing 300 mM KCl. 2× SDS sample buffer was added to the beads and boiled, followed by immunoblotting of inputs and pulldowns.
H3.1‐APEX2 proximity biotinylation
Stable RPE‐H3.1‐APEX2‐3xFLAG cells were treated with 1 μg/ml doxycycline (dox) for 3.5 h to induce H3.1‐APEX2‐3xFLAG expression. Dox‐treated RPE cells or untreated H3.1‐APEX2‐3xFLAG cells were used as negative controls. APEX2‐based proximity biotinylation was performed as described previously (Hung et al, 2016). Briefly, to perform proximity biotinylation for newly synthesized H3.1‐APEX2‐3xFLAG, 30 min after dox removal, 500 μM biotin‐phenol was added to culture medium for an additional 30 min. To catalyze biotin‐phenol attachment by H3.1‐APEX2‐3xFLAG, 1 mM H2O2 was added to the same medium for 1 min. After removal of labeling medium, cells were quenched by 4 × 1 min washes in Quencher Solution (5 mM Trolox, 10 mM sodium ascorbate, 10 mM sodium azide in PBS). To perform proximity biotinylation for pre‐existing H3.1‐APEX2‐3xFLAG, cells were cultured 48 h after dox removal before treatment with biotin‐phenol. The entire cell population was collected at 48 h (roughly 2× cell number versus 4.5 h) to capture the entire remaining pool of H3.1‐APEX2‐3xFLAG. Quenched cells were either straight‐fixed in 4% formaldehyde for immunofluorescence on coverglass, as described above, or collected for affinity purification of biotin‐labeled proteins, as follows. Cells were lysed in RIPA buffer (Thermo Fisher Scientific 89900) on ice for 2 min, then centrifuged at 50,000 g for 10 min at 4°C. The supernatant was incubated with streptavidin‐conjugated magnetic agarose (New England Biolabs S1420) ˜18 h at 4°C. The affinity purified complexes and magnetic agarose were washed twice with RIPA, then once each with RIPA supplemented to 2% SDS, 1 M KCl, 0.1 M Na2CO3, 2 M Urea in 10 mM Tris–HCl, pH 8.0, and twice with RIPA. Purified complexes were eluted by heating for 10 min at 95°C in 1.5× Laemmli sample buffer supplemented with 2 mM biotin and 20 mM DTT.
To estimate the enrichment of UBR7 co‐purified with pre‐existing versus newly synthesized H3.1‐APEX2‐3xFLAG, integrated pixel density (IPD) was quantified using Fiji for the anti‐FLAG and anti‐UBR7 immunoblots from loading conditions with the most comparable anti‐FLAG immunoblot intensity (Fig 4H, 0.1× of 4.5 h in lane 8 versus 1× of 48 h in lane 11). The anti‐UBR7 IPD was normalized to anti‐FLAG IPD within condition, and then, the ratio of 48 h to 4.5 h FLAG‐normalized anti‐UBR7 immunoblot signal was calculated.
Real‐time quantitative PCR validation of LAMP2A knockdown
Total RNA was isolated from UBR7‐FL or sNASP‐FL expressing 293T cells after treatment with siCTRL or siLAMP2A as described above using the Qiagen RNeasy Mini kit (Qiagen 74104). 1 µg of RNA was used as input for cDNA synthesis using the iScript cDNA Synthesis kit (Bio‐Rad 1708890). cDNA was diluted 1:5 and mixed with iTaq Universal SYBR Green Supermix (Bio‐Rad 1725121) and primers. Primer sequences to detect LAMP2A or Actin as a normalization control are listed in Table EV2. Real‐time quantitative PCR was performed on the Bio‐Rad CFX Connect (Bio‐Rad 1855201) according to standard procedure. Relative expression was determined using the 2−ΔΔCt method.
GFP‐UBR7 chromatin immunoprecipitation and DNA sequencing (ChIP‐seq) and data analysis
2 × 15 cm 90% confluent plates of GFP‐UBR7 293T cells were used for each ChIP‐seq experiment. The cells were fixed with 1% paraformaldehyde in DMEM for 15 min at 37°C, then quenched with 0.125 M glycine (final concentration) for 5 min at 37°C. The cells were washed with ice‐cold PBS containing Protease inhibitors (Roche Complete Protease inhibitors (Sigma‐Aldrich 11873580001). Cells were sonicated with a Branson sonicator at 40% amplitude, 0.7 s on 1.3 s off, for 10 min. Samples were then spun at max speed for 10 min at 4°C. The supernatant was collected and 50 µl retained as input sample. The lysate was pre‐cleared with beads. 4 µg anti‐GFP antibody (Table EV3) was added, and the samples were incubated overnight with rotation at 4°C. The immune complex was collected by incubating with Protein‐A Sepharose beads on a rotator at 4°C. The beads were washed 5× with washing buffer (50 mM HEPES pH 8.0, 1% NP‐40, 0.7% DOC, 0.5 M LiCl, freshly added protease inhibitors) then 1× with TE buffer. Immunoprecipitated complexes were eluted twice in serial by resuspending beads with 100 μl elution buffer (50 mM Tris–HCl pH 8.0, 1 mM EDTA, 1% SDS) and incubating for 30 min at 65°C. The supernatant was collected and treated with proteinase K for 2 h at 55°C, then DNA was purified by phenol‐chloroform extraction.
ChIP‐seq libraries were prepared with the KAPA HTP Library Preparation Kit (Illumina KK8234) using NEXTFLEX Adapters (Illumina 514104), according to manufacturer protocols, from 10ng of starting DNA. Libraries were size selected using SPRI beads (Beckman Coulter A63987). Libraries were assessed on an Agilent Bioanalyzer and sequenced on a NextSeq500 (Illumina) to generate 50 bp single‐end reads.
Raw BCL output files were processed using bclfastq (Illumina, version 2.17.1.14). Fastq files were quality trimmed with trimmomatic (Bolger et al, 2014). Trimmed reads were aligned to the human genome (UCSC hg19) with bowtie (Langmead & Salzberg, 2012; Langmead et al, 2019). Peaks were called from GFP‐IP bam files using input bam files as control with macs2 (Zhang et al, 2008). The nearest genomic feature was annotated by HOMER analysis (Heinz et al, 2010). DeepTools bamCompare was used to calculate the log2 fold change of GFP‐IP versus input from GFP‐UBR7 293T cells, which was visualized using plotHeatmap.
Assay for transposase accessible chromatin and DNA sequencing (ATAC‐seq) and data analysis
ATAC‐seq was performed as previously described (Buenrostro et al, 2015). Briefly, transposition was performed from 5000 parental or UBR7KO 293T cells resuspended in 50 µl of ATAC buffer (25 µl 2× TD buffer, 2.5 µl TDE1 transposase, Nextera; 0.5 µl Digitonin, Promega; 22 µl nuclease‐free water) for 30 min at 37°C with 300 rpm agitation. Fragmented DNA was collected using a Qiagen MinElute PCR kit (Qiagen 28004). Sequencing libraries were prepared by PCR, size selected, and quality controlled as described (Buenrostro et al, 2015). Libraries were sequenced on the NextSeq 500 to generate 50 bp single‐end reads. Experiment was performed twice.
Raw BCL output files were processed using bclfastq (Illumina, version 2.17.1.14) and fastq files were trimmed and analyzed with trim_galore (https://github.com/FelixKrueger/TrimGalore). Reads were aligned to the human genome (UCSC hg19) using bowtie2 (Langmead & Salzberg, 2012; Langmead et al, 2019) allowing up to one mismatch resulting in > 50% aligned reads in all samples. Multimapping reads were removed with samtools (option ‐q 5), and mitochondrial genome reads were removed with the sed command. Duplicate reads were removed with Picard (Picard toolkit, 2019). All bam files were downsampled to the number of reads in the smallest library. Peaks were called using macs2 in broad mode (Zhang et al, 2008; Tripodi et al, 2018). Bedtools (Quinlan & Hall, 2010) was used to identify and merge (sum) the macs2 scores across intersecting peaks between biological replicates. DeepTools (Ramirez et al, 2016) bamCompare was used to calculate the log2 fold change of UBR7KO versus parental 293T cells. Unique TSS were derived by first building a bed file using the “chrom” and “txn start” columns of NCBI RefSeq GRCh37/hg19 file downloaded from UCSC Table Browser (http://genome.ucsc.edu/cgi‐bin/hgTables) followed by a column of values (“txn start” +1). Bedtools merge was used to collapse redundant TSS. DeepTools plotHeatmap was used to visualize the log2 fold changes centered on non‐redundant TSS using unsupervised K‐means analysis.
H3K4me3 CUT&RUN and data analysis
The ProteinA‐MNase (pA‐MNase) was purified in E. coli cells as described previously using a protocol adapted from Schmid et al (2004). Parental and UBR7KO 293T cells and Drosophila Kc167 spike‐in cells were harvested at room temperature and resuspended in Wash Buffer (20 mM HEPES‐NaOH pH 7.5, 150 mM NaCl, 0.5 mM spermidine, 1× Roche protease inhibitor cocktail) and counted using a Vi‐Cell Blu cell counter. For each antibody, 4 × 10⁵ 293T cells were mixed with 1 × 10⁵ Kc167 cells, then incubated for 7 min with 10 µl of Concanavalin A‐coated magnetic beads (BioMag) in Binding Buffer (20 mM HEPES‐KOH pH 7.9, 10 mM KCl, 1 mM CaCl2, 1 mM MnCl2). The bead‐cell slurry was permeabilized in Wash Buffer supplemented with 0.005% digitonin (“Digitonin Buffer”) as determined by optimization, then incubated with anti‐H3K4me3 antibody (Antibody 1 = Millipore, Antibody 2 = Diagenode, Table EV3), or IgG as a control, (1:50) in Antibody Buffer (20 mM HEPES‐NaOH pH 7.5, 150 mM NaCl, 0.5 mM spermidine, 0.005% digitonin, 2 mM EDTA, 0.1% BSA, 100 nM TSA, 0.1 unit/ml citrate synthase, 1 mM Oxaloacetic acid, 1× Roche protease inhibitor cocktail) for 2 h at room temperature with nutation. The beads were washed twice in Digitonin Buffer, then incubated in 100 µl Digitonin buffer with 700 ng/ml pA‐MNase for 1 h at 4°C with nutation. The beads were washed twice in Digitonin Buffer, then resuspended in a low‐salt Wash Buffer (20 mM HEPES‐NaOH pH 7.5, 0.5 mM spermidine, 0.005% digitonin, 1× Roche protease inhibitor cocktail) and chilled to 0°C. The beads were then incubated with ice‐cold Calcium Incubation Buffer (3.5 mM HEPES‐NaOH pH 7.5, 10 mM CaCl2, 0.005% digitonin) for 30 min. The beads were washed with EGTA‐Stop Buffer (170 mM NaCl, 20 mM EGTA, 0.005% digitonin, 50 µg/ml RNase A) for 30 min at 37°C to release the chromatin fragments. To extract the DNA, 200 µl of Oligo Binding Buffer (Zymo) was added to each sample and the total volume was then added to a Zymo‐Spin DCC‐5 column and centrifuged. The column was washed twice with DNA Wash buffer from the DNA Clean & Concentrator‐5 Kit (Zymo). The DNA was eluted from the column in 15 µl of DNA Elution Buffer, and sample concentration was measured using a Qubit 3.0 fluorometer and Qubit dsDNA HS Assay Kit.
Illumina libraries were prepared using a NEBNext Ultra II Library Prep Kit for Illumina and NEBNext® Multiplex Oligos for Illumina® (Dual Index Primers Set 1) using a protocol adapted from the manufacturer. Modifications to the protocol are as follows: The End Prep heat inactivation step was conducted at 50°C for 60 min. The NEBNext Adaptor was diluted 1:25 in 10 mM Tris–HCl, pH 8.0 with 10 mM NaCl. After Adaptor Ligation, a DNA cleanup using 1.75× volumes of Sera‐Mag Select beads was conducted. The PCR cycle conditions were programmed as following: 1 cycle: 98°C for 30 s, 12 cycles: 98°C for 10 s, 65°C for 30 s, 1 cycle: 65°C for 5 min, Hold: 4°C. After PCR amplification, DNA cleanup was conducted twice with 1.2× volumes of Sera‐Mag Select (Cytiva) beads. Quality control was conducted on the resulting 15 µl elution using Agilent 4200 TapeStation D1000 ScreenTape to determine sample concentration and sample quality. Libraries were sequenced on the Illumina NovaSeq 6000 to generate 50 bp paired‐end reads.
Raw sequencing data were demultiplexed using bcl2fastq2 v2.19.1. Reads were trimmed for adaptor sequences using trimmomatic v0.36 and then aligned to concatenated hg38/Genome Reference Consortium Human Reference 38 Patch 15 (GRCh38.p15) and dm6/BDGP Release 6 + ISO1 MT assemblies of the human and Drosophila melanogaster genomes, respectively, using bowtie2 v2.3.1 with options ‐‐local ‐‐very‐sensitive‐local ‐‐no‐unal ‐‐no‐mixed ‐‐no‐discordant ‐‐phred33. Only reads with a MAPQ ≥ 30 were retained using samtools v1.3.1. PCR duplicates were removed with picard MarkDuplicates v2.9.2. Coverage‐based tracks were generated with deepTools bamCoverage with options ‐‐binSize 1 ‐‐normalizingUsing RPGC ‐‐effectiveGenomeSize 2800000000 ‐‐extendReads ‐‐samFlagInclude 64. CUT&RUN profiles were then calibrated by spike‐in normalization using Drosophila chromatin as the internal reference or spike‐in, analogous to that done for ChIP‐seq (Orlando et al, 2014), to determine the normalization coefficient or Occupancy Ratio (OR). Specifically, the OR was calculated as the product of IgG spike‐in reads and immunocleaved (IC) human reads, divided by the product of IgG human reads and IC spike‐in reads. Spike‐in normalized tracks were generated with deepTools bamCoverage with options ‐‐binSize 1 ‐‐normalizeUsing RPGC ‐‐effectiveGenomeSize 2800000000 ‐‐extendReads ‐‐samFlagInclude 64 ‐‐scaleFactor OR.
OR‐normalized tracks were remapped to genome build hg19/GRCh37. BigWig files were converted to bedGraph using UCSC binary utils (http://hgdownload.soe.ucsc.edu/admin/exe/linux.x86_64/) bigWigToBedGraph. BedGraph files were remapped to hg19 using UCSC binary utils liftOver with options ‐positions –bedPlus = 4 and hg38ToHg19.over.chain file. Resulting bedGraph files were sorted using LC_Collate = C sort with options ‐k1,1 ‐k2,2n. Overlapping coordinates were removed with UCSC binary utils bedRemoveOverlap. Resulting bedGraph files were converted to hg19 mapped tracks using UCSC binary utils bedGraphToBigWig.
DeepTools bigWigCompare was used to calculate the log2 fold change of H3K4me3 using in UBR7KO versus parental 293T cells, which were visualized using plotHeatmap.
Genomic track examples
Genome tracks were visualized using the Integrative Genomics Viewer (IGV) (Robinson et al, 2011, 2017; Thorvaldsdottir et al, 2013).
RNA sequencing
RNA was isolated from 1 × 10⁶ cells using the Qiagen RNeasy Mini kit. RNA quality was assessed at > 9 on the Bioanlayzer 2100 using the Eukaryote Total RNA Nano kit (Agilent 5067‐1511). 1 µg of RNA was used as input for library preparation using the Illumina TruSeq LS protocol (Illumina 15031048). Experiment was performed three times (twice in UBR7KO2 and once in UBR7KO1 cells).
All libraries were assessed on the Qubit and sequenced on Illumina HiSeq 2000 to generate 50 bp single‐end reads. Raw BCL output files were processed using bclfastq (Illumina, version 2.17.1.14). Further analysis was performed using the Ceto modular NGS analysis pipeline (E. Bartom, Northwestern University, https://github.com/ebartom/NGSbartom). Fastq files were quality trimmed with trimmomatic (Bolger et al, 2014). Trimmed reads were aligned to the human genome (UCSC hg19) with TopHat (version 2.1.0) (Trapnell et al, 2009) with gene annotations sourced from Ensembl release 72 assigned using Python package HTSeq 0.6.1 (Anders et al, 2015). Differentially expressed reads between all three UBR7KO versus all three parental 293T samples were identified using the exact test in EdgeR (Robinson et al, 2010; McCarthy et al, 2012).
To compare gene expression changes identified by RNA‐seq to changes in the chromatin landscape identified by ATAC‐seq and CUT&RUN, the mean log2 fold change of the genes associated with TSS for each cluster was calculated and visualized in R as described for ATAC‐seq analysis (see above).
Plasmids and transfection
Histone coding sequences were synthesized as gBlocks (H3.1, H3.3, H3.1‐A31S, H3.3‐S31A, H2B, see Table EV2) (Lewis et al, 2013; Herz et al, 2014) by Integrated DNA technologies and cloned into the into pcDNA5/FRT/TO plasmid (Thermo Fisher Scientific V652020) using NEB HiFi DNA Assembly Master Mix (New England Biolabs E2621L). Plasmids were transfected in 293T cells using Lipofectamine 2000 or 3000 (Thermo Fisher Scientific 13778150 or L3000015).
Cellular fractionation, immunoprecipitation, mass spectrometry, and immunoblotting
Cellular fractionation and immunoprecipitation were performed as described in the section “Cellular Fractionation, Immunoprecipitation, and Immunoblotting”.
To determine proteins bound to nucleosomal H3.1‐FLAG‐HA and H3.3‐FLAG‐HA, proteins co‐purified by anti‐FLAG immunoprecipitation were identified by mass spectrometry as described in the section "BioID and Mass Spectrometry". Log2 fold differences between H3.1 and H3.3 purifications were calculated from total spectral counts. Total spectral counts were compared between H3.1 and H3.3 purifications.
To assess UBR7 binding to transiently transfected (72 h) H2B‐FLAG‐HA, H3.1‐FLAG‐HA, H3.3‐FLAG‐HA, or indicated mutants, non‐nucleosomal or nucleosomal anti‐FLAG immunoprecipitations were immunoblotted with anti‐FLAG and anti‐UBR7 antibodies (Table EV3). To estimate the relative enrichment of UBR7 co‐purified by nucleosomal H3.1‐FLAG‐HA, H3.3‐FLAG‐HA, and mutants, anti‐UBR7 integrated pixel density was calculated using gel analysis tool in Fiji.
Alignment of UBR7 protein sequences
UBR7 protein RefSeqs in fasta format from NCBI were aligned using T‐Coffee (Notredame et al, 2000) (http://tcoffee.crg.cat/apps/tcoffee/do:regular). Resulting fasta alignment was visualized using Boxshade version 3.21 (written by K. Hofmann and M. Baron), hosted on https://embnet.vital‐it.ch/software/BOX_form.html, with RTF_new output. The following RefSeqs were used for alignment: NP_786924.2, XP_001149838.1, NP_079942.1, NP_001305390.1, XP_002933253.3, NP_997794.1, NP_609837.1, NP_595478.1.
H3.1‐APEX2 proximity biotinylation
To validate specific biotinylation of proteins by H3.1‐APEX2‐3xFLAG by immunoblot, RPE1hTert cells stably expressing doxycycline‐inducible H3.1‐APEX2‐3xFLAG were treated and biotinylated proteins were purified as described in the section “H3.1‐APEX2 Proximity Biotinylation” from untreated cells or cells collected 4.5 or 48 h following doxycycline treatment. Biotinylated proteins were detected by blotting with streptavidin‐HRP (Table EV3).
Author contributions
AKH, KMS, MAM, KPE, AS, and DRF designed the study. AKH, KMS, SK, SS, EZ, ASL, AOB, MNG, JB, CDR, and MAM performed experiments. AKH, KMS, ABW, EZ, JH, KAW, and MAM generated cell lines and reagents. AKH, KMS, and DRF wrote the manuscript with input from all authors.
Conflict of interest
The authors declare that they have no conflict of interest.
Supporting information
Expanded View Figures PDF
Dataset EV1
Table EV1
Table EV2
Table EV3
Table EV4
Source Data for Expanded View
Source Data for Figure 1
Source Data for Figure 2
Source Data for Figure 3
Source Data for Figure 4
Source Data for Figure 5
Source Data for Figure 6
Source Data for Figure 7
Source Data for Figure 8
Acknowledgements
DRF was supported by R21HD078946, R01GM143638, a Zell scholar grant from the Robert H. Lurie Comprehensive Cancer Center and the H‐foundation. KPE was supported by DP5OD024587, an administrative grant from Northwestern University. Thanks to T. Stukenberg and J. Babasa for reagents. Thanks to J.N. Savas and E.A. Hall for BioID mass spectrometry analysis. Thank you to E. Bartom for bioinformatics expertise. Thanks to T. Stukenberg, M.L. Mendillo, J. Topczewski, J.N. Savas, and members of the Foltz laboratory and Shilatifard laboratory for helpful comments.
The EMBO Journal (2021) 40: e108307.
Contributor Information
Kizhakke M Sathyan, Email: kizhakkemattada@uchc.edu.
Daniel R Foltz, Email: dfoltz@northwestern.edu.
Data availability
ChIP‐seq, ATAC‐seq, CUT&RUN, and RNA‐seq data: Gene Expression Ombinus GSE183730 (https://www.ncbi.nlm.nih.gov/geo/query/acc.cgi?acc=GSE183730).
References
- Adhikary S, Chakravarti D, Terranova C, Sengupta I, Maitituoheti M, Dasgupta A, Srivastava DK, Ma J, Raman AT, Tarco E et al (2019) Atypical plant homeodomain of UBR7 functions as an H2BK120Ub ligase and breast tumor suppressor. Nat Commun 10: 1398 [DOI] [PMC free article] [PubMed] [Google Scholar]
- Ahmad K, Henikoff S (2002) The histone variant H3.3 marks active chromatin by replication‐independent nucleosome assembly. Mol Cell 9: 1191–1200 [DOI] [PubMed] [Google Scholar]
- Alabert C, Jasencakova Z, Groth A (2017) Chromatin replication and histone dynamics. Adv Exp Med Biol 1042: 311–333 [DOI] [PubMed] [Google Scholar]
- Anders S, Pyl PT, Huber W (2015) HTSeq–a Python framework to work with high‐throughput sequencing data. Bioinformatics 31: 166–169 [DOI] [PMC free article] [PubMed] [Google Scholar]
- Apta‐Smith MJ, Hernandez‐Fernaud JR, Bowman AJ (2018) Evidence for the nuclear import of histones H3.1 and H4 as monomers. EMBO J 37: e98714 [DOI] [PMC free article] [PubMed] [Google Scholar]
- Benson LJ, Gu Y, Yakovleva T, Tong K, Barrows C, Strack CL, Cook RG, Mizzen CA, Annunziato AT (2006) Modifications of H3 and H4 during chromatin replication, nucleosome assembly, and histone exchange. J Biol Chem 281: 9287–9296 [DOI] [PubMed] [Google Scholar]
- Bhushan B, Erdmann A, Zhang Y, Belle R, Johannson C, Oppermann U, Hopkinson RJ, Schofield CJ, Kawamura A (2018) Investigations on small molecule inhibitors targeting the histone H3K4 tri‐methyllysine binding PHD‐finger of JmjC histone demethylases. Bioorg Med Chem 26: 2984–2991 [DOI] [PMC free article] [PubMed] [Google Scholar]
- Bolger AM, Lohse M, Usadel B (2014) Trimmomatic: a flexible trimmer for Illumina sequence data. Bioinformatics 30: 2114–2120 [DOI] [PMC free article] [PubMed] [Google Scholar]
- Bowman A, Koide A, Goodman JS, Colling ME, Zinne D, Koide S, Ladurner AG (2017) sNASP and ASF1A function through both competitive and compatible modes of histone binding. Nucleic Acids Res 45: 643–656 [DOI] [PMC free article] [PubMed] [Google Scholar]
- Bowman A, Lercher L, Singh HR, Zinne D, Timinszky G, Carlomagno T, Ladurner AG (2016) The histone chaperone sNASP binds a conserved peptide motif within the globular core of histone H3 through its TPR repeats. Nucleic Acids Res 44: 3105–3117 [DOI] [PMC free article] [PubMed] [Google Scholar]
- Buenrostro JD, Wu B, Chang HY, Greenleaf WJ (2015) ATAC‐seq: a method for assaying chromatin accessibility genome‐wide. Curr Protoc Mol Biol 109: 21–29 [DOI] [PMC free article] [PubMed] [Google Scholar]
- Campos EI, Fillingham J, Li G, Zheng H, Voigt P, Kuo W‐H, Seepany H, Gao Z, Day LA, Greenblatt JF et al (2010) The program for processing newly synthesized histones H3.1 and H4. Nat Struct Mol Biol 17: 1343–1351 [DOI] [PMC free article] [PubMed] [Google Scholar]
- Campos E, Smits A, Kang Y‐H, Landry S, Escobar T, Nayak S, Ueberheide B, Durocher D, Vermeulen M, Hurwitz J et al (2015) Analysis of the histone H3.1 interactome: a suitable chaperone for the right event. Mol Cell 60: 697–709 [DOI] [PMC free article] [PubMed] [Google Scholar]
- Champagne KS, Kutateladze TG (2009) Structural insight into histone recognition by the ING PHD fingers. Curr Drug Targets 10: 432–441 [DOI] [PMC free article] [PubMed] [Google Scholar]
- Chin HG, Pradhan M, Esteve PO, Patnaik D, Evans TC Jr, Pradhan S (2005) Sequence specificity and role of proximal amino acids of the histone H3 tail on catalysis of murine G9A lysine 9 histone H3 methyltransferase. Biochemistry 44: 12998–13006 [DOI] [PubMed] [Google Scholar]
- Clement C, Almouzni G (2015) MCM2 binding to histones H3–H4 and ASF1 supports a tetramer‐to‐dimer model for histone inheritance at the replication fork. Nat Struct Mol Biol 22: 587–589 [DOI] [PubMed] [Google Scholar]
- Clément C, Orsi GA, Gatto A, Boyarchuk E, Forest A, Hajj B, Miné‐Hattab J, Garnier M, Gurard‐Levin ZA, Quivy J‐P et al (2018) High‐resolution visualization of H3 variants during replication reveals their controlled recycling. Nat Commun 9: 3181 [DOI] [PMC free article] [PubMed] [Google Scholar]
- Cong L, Ran FA, Cox D, Lin S, Barretto R, Habib N, Hsu PD, Wu X, Jiang W, Marraffini LA et al (2013) Multiplex genome engineering using CRISPR/Cas systems. Science 339: 819–823 [DOI] [PMC free article] [PubMed] [Google Scholar]
- Cook AJ, Gurard‐Levin ZA, Vassias I, Almouzni G (2011) A specific function for the histone chaperone NASP to fine‐tune a reservoir of soluble H3–H4 in the histone supply chain. Mol Cell 44: 918–927 [DOI] [PubMed] [Google Scholar]
- Dannah NS, Nabeel‐Shah S, Kurat CF, Sabatinos SA, Fillingham J (2018) Functional analysis of Hif1 histone chaperone in Saccharomyces cerevisiae . G3 8: 1993–2006 [DOI] [PMC free article] [PubMed] [Google Scholar]
- Dignam JD, Lebovitz RM, Roeder RG (1983) Accurate transcription initiation by RNA polymerase II in a soluble extract from isolated mammalian nuclei. Nucleic Acids Res 11: 1475–1489 [DOI] [PMC free article] [PubMed] [Google Scholar]
- Duan Q, Chen H, Costa M, Dai W (2008) Phosphorylation of H3S10 blocks the access of H3K9 by specific antibodies and histone methyltransferase. Implication in regulating chromatin dynamics and epigenetic inheritance during mitosis. J Biol Chem 283: 33585–33590 [DOI] [PMC free article] [PubMed] [Google Scholar]
- Fischle W, Tseng BS, Dormann HL, Ueberheide BM, Garcia BA, Shabanowitz J, Hunt DF, Funabiki H, Allis CD (2005) Regulation of HP1‐chromatin binding by histone H3 methylation and phosphorylation. Nature 438: 1116–1122 [DOI] [PubMed] [Google Scholar]
- Foltz DR, Jansen LE, Black BE, Bailey AO, Yates JR 3rd, Cleveland DW (2006) The human CENP‐A centromeric nucleosome‐associated complex. Nat Cell Biol 8: 458–469 [DOI] [PubMed] [Google Scholar]
- Foltz DR, Jansen LE, Bailey AO, Yates JR 3rd, Bassett EA, Wood S, Black BE, Cleveland DW (2009) Centromere‐specific assembly of CENP‐a nucleosomes is mediated by HJURP. Cell 137: 472–484 [DOI] [PMC free article] [PubMed] [Google Scholar]
- Gan H, Serra‐Cardona A, Hua X, Zhou H, Labib K, Yu C, Zhang Z (2018) The Mcm2‐Ctf4‐Polalpha axis facilitates parental histone H3–H4 transfer to lagging strands. Mol Cell 72: 140–151 e143 [DOI] [PMC free article] [PubMed] [Google Scholar]
- Groth A, Corpet A, Cook AJ, Roche D, Bartek J, Lukas J, Almouzni G (2007) Regulation of replication fork progression through histone supply and demand. Science 318: 1928–1931 [DOI] [PubMed] [Google Scholar]
- Groth A, Ray‐Gallet D, Quivy JP, Lukas J, Bartek J, Almouzni G (2005) Human Asf1 regulates the flow of S phase histones during replicational stress. Mol Cell 17: 301–311 [DOI] [PubMed] [Google Scholar]
- Han S, Udeshi ND, Deerinck TJ, Svinkina T, Ellisman MH, Carr SA, Ting AY (2017) Proximity biotinylation as a method for mapping proteins associated with mtDNA in living cells. Cell Chem Biol 24: 404–414 [DOI] [PMC free article] [PubMed] [Google Scholar]
- Heinz S, Benner C, Spann N, Bertolino E, Lin YC, Laslo P, Cheng JX, Murre C, Singh H, Glass CK (2010) Simple combinations of lineage‐determining transcription factors prime cis‐regulatory elements required for macrophage and B cell identities. Mol Cell 38: 576–589 [DOI] [PMC free article] [PubMed] [Google Scholar]
- Herz HM, Morgan M, Gao X, Jackson J, Rickels R, Swanson SK, Florens L, Washburn MP, Eissenberg JC, Shilatifard A (2014) Histone H3 lysine‐to‐methionine mutants as a paradigm to study chromatin signaling. Science 345: 1065–1070 [DOI] [PMC free article] [PubMed] [Google Scholar]
- Hickox AE, Wong AC, Pak K, Strojny C, Ramirez M, Yates JR 3rd, Ryan AF, Savas JN (2017) Global analysis of protein expression of inner ear hair cells. J Neurosci 37: 1320–1339 [DOI] [PMC free article] [PubMed] [Google Scholar]
- Hogan AK, Foltz DR (2021) Reduce, retain, recycle: mechanisms for promoting histone protein degradation versus stability and retention. Mol Cell Biol 41: e0000721 [DOI] [PMC free article] [PubMed] [Google Scholar]
- Huang A, Kremser L, Schuler F, Wilflingseder D, Lindner H, Geley S, Lusser A (2019) Phosphorylation of Drosophila CENP‐A on serine 20 regulates protein turn‐over and centromere‐specific loading. Nucleic Acids Res 47: 10754–10770 [DOI] [PMC free article] [PubMed] [Google Scholar]
- Hung V, Udeshi ND, Lam SS, Loh KH, Cox KJ, Pedram K, Carr SA, Ting AY (2016) Spatially resolved proteomic mapping in living cells with the engineered peroxidase APEX2. Nat Protoc 11: 456–475 [DOI] [PMC free article] [PubMed] [Google Scholar]
- Hyun K, Jeon J, Park K, Kim J (2017) Writing, erasing and reading histone lysine methylations. Exp Mol Med 49: e324 [DOI] [PMC free article] [PubMed] [Google Scholar]
- Isobe Y, Okumura M, McGregor LM, Brittain SM, Jones MD, Liang X, White R, Forrester W, McKenna JM, Tallarico JA et al (2020) Manumycin polyketides act as molecular glues between UBR7 and P53. Nat Chem Biol 16: 1189–1198 [DOI] [PMC free article] [PubMed] [Google Scholar]
- Jeronimo C, Poitras C, Robert F (2019) Histone Recycling by FACT and Spt6 during transcription prevents the scrambling of histone modifications. Cell Rep 28: 1206–1218.e8 [DOI] [PubMed] [Google Scholar]
- Ji X, Dadon DB, Abraham BJ, Lee TI, Jaenisch R, Bradner JE, Young RA (2015) Chromatin proteomic profiling reveals novel proteins associated with histone‐marked genomic regions. Proc Natl Acad Sci USA 112: 3841–3846 [DOI] [PMC free article] [PubMed] [Google Scholar]
- Kelley LA, Mezulis S, Yates CM, Wass MN, Sternberg MJ (2015) The Phyre2 web portal for protein modeling, prediction and analysis. Nat Protoc 10: 845–858 [DOI] [PMC free article] [PubMed] [Google Scholar]
- Kleiner RE, Hang LE, Molloy KR, Chait BT, Kapoor TM (2018) A chemical proteomics approach to reveal direct protein‐protein interactions in living cells. Cell Chem Biol 25: 110–120.e3 [DOI] [PMC free article] [PubMed] [Google Scholar]
- Kobayashi W, Kurumizaka H (2019) Structural transition of the nucleosome during chromatin remodeling and transcription. Curr Opin Struct Biol 59: 107–114 [DOI] [PubMed] [Google Scholar]
- Koch CM, Andrews RM, Flicek P, Dillon SC, Karaoz U, Clelland GK, Wilcox S, Beare DM, Fowler JC, Couttet P et al (2007) The landscape of histone modifications across 1% of the human genome in five human cell lines. Genome Res 17: 691–707 [DOI] [PMC free article] [PubMed] [Google Scholar]
- Lai WKM, Pugh BF (2017) Understanding nucleosome dynamics and their links to gene expression and DNA replication. Nat Rev Mol Cell Biol 18: 548–562 [DOI] [PMC free article] [PubMed] [Google Scholar]
- Lambert JP, Tucholska M, Go C, Knight JD, Gingras AC (2015) Proximity biotinylation and affinity purification are complementary approaches for the interactome mapping of chromatin‐associated protein complexes. J Proteomics 118: 81–94 [DOI] [PMC free article] [PubMed] [Google Scholar]
- Langmead B, Salzberg SL (2012) Fast gapped‐read alignment with Bowtie 2. Nat Methods 9: 357–359 [DOI] [PMC free article] [PubMed] [Google Scholar]
- Langmead B, Wilks C, Antonescu V, Charles R (2019) Scaling read aligners to hundreds of threads on general‐purpose processors. Bioinformatics 35: 421–432 [DOI] [PMC free article] [PubMed] [Google Scholar]
- Lee S, Lee S, Ouellette S, Park WY, Lee EA, Park PJ (2017) NGSCheckMate: software for validating sample identity in next‐generation sequencing studies within and across data types. Nucleic Acids Res 45: e103 [DOI] [PMC free article] [PubMed] [Google Scholar]
- Lewis PW, Muller MM, Koletsky MS, Cordero F, Lin S, Banaszynski LA, Garcia BA, Muir TW, Becher OJ, Allis CD (2013) Inhibition of PRC2 activity by a gain‐of‐function H3 mutation found in pediatric glioblastoma. Science 340: 857–861 [DOI] [PMC free article] [PubMed] [Google Scholar]
- Li H, Ilin S, Wang W, Duncan EM, Wysocka J, Allis CD, Patel DJ (2006) Molecular basis for site‐specific read‐out of histone H3K4me3 by the BPTF PHD finger of NURF. Nature 442: 91–95 [DOI] [PMC free article] [PubMed] [Google Scholar]
- Liu Y, Tempel W, Zhang Q, Liang X, Loppnau P, Qin S, Min J (2016) Family‐wide characterization of histone binding abilities of human CW domain‐containing proteins. J Biol Chem 291: 9000–9013 [DOI] [PMC free article] [PubMed] [Google Scholar]
- Loyola A, Bonaldi T, Roche D, Imhof A, Almouzni G (2006) PTMs on H3 variants before chromatin assembly potentiate their final epigenetic state. Mol Cell 24: 309–316 [DOI] [PubMed] [Google Scholar]
- Luger K, Mader AW, Richmond RK, Sargent DF, Richmond TJ (1997) Crystal structure of the nucleosome core particle at 2.8 A resolution. Nature 389: 251–260 [DOI] [PubMed] [Google Scholar]
- McCarthy DJ, Chen Y, Smyth GK (2012) Differential expression analysis of multifactor RNA‐Seq experiments with respect to biological variation. Nucleic Acids Res 40: 4288–4297 [DOI] [PMC free article] [PubMed] [Google Scholar]
- Mellacheruvu D, Wright Z, Couzens AL, Lambert J‐P, St‐Denis NA, Li T, Miteva YV, Hauri S, Sardiu ME, Low TY et al (2013) The CRAPome: a contaminant repository for affinity purification‐mass spectrometry data. Nat Methods 10: 730–736 [DOI] [PMC free article] [PubMed] [Google Scholar]
- Mellor J (2006) It takes a PHD to read the histone code. Cell 126: 22–24 [DOI] [PubMed] [Google Scholar]
- Moreno‐Moreno O, Torras‐Llort M, Azorin F (2006) Proteolysis restricts localization of CID, the centromere‐specific histone H3 variant of Drosophila, to centromeres. Nucleic Acids Res 34: 6247–6255 [DOI] [PMC free article] [PubMed] [Google Scholar]
- Musselman CA, Kutateladze TG (2011) Handpicking epigenetic marks with PHD fingers. Nucleic Acids Res 39: 9061–9071 [DOI] [PMC free article] [PubMed] [Google Scholar]
- Notredame C, Higgins DG, Heringa J (2000) T‐Coffee: a novel method for fast and accurate multiple sequence alignment. J Mol Biol 302: 205–217 [DOI] [PubMed] [Google Scholar]
- Obuse C, Yang H, Nozaki N, Goto S, Okazaki T, Yoda K (2004) Proteomics analysis of the centromere complex from HeLa interphase cells: UV‐damaged DNA binding protein 1 (DDB‐1) is a component of the CEN‐complex, while BMI‐1 is transiently co‐localized with the centromeric region in interphase. Genes Cells 9: 105–120 [DOI] [PubMed] [Google Scholar]
- Orlando DA, Chen MW, Brown VE, Solanki S, Choi YJ, Olson ER, Fritz CC, Bradner JE, Guenther MG (2014) Quantitative ChIP‐Seq normalization reveals global modulation of the epigenome. Cell Rep 9: 1163–1170 [DOI] [PubMed] [Google Scholar]
- Petryk N, Dalby M, Wenger A, Stromme CB, Strandsby A, Andersson R, Groth A (2018) MCM2 promotes symmetric inheritance of modified histones during DNA replication. Science 361: 1389–1392 [DOI] [PubMed] [Google Scholar]
- Picard toolkit (2019) Broad Institute, GitHub repository http://broadinstitutegithubio/picard/
- Prendergast L, Hong E, Safina A, Poe D, Gurova K (2020) Histone chaperone FACT is essential to overcome replication stress in mammalian cells. Oncogene 39: 5124–5137 [DOI] [PMC free article] [PubMed] [Google Scholar]
- Quinlan AR, Hall IM (2010) BEDTools: a flexible suite of utilities for comparing genomic features. Bioinformatics 26: 841–842 [DOI] [PMC free article] [PubMed] [Google Scholar]
- Ramirez F, Ryan DP, Gruning B, Bhardwaj V, Kilpert F, Richter AS, Heyne S, Dundar F, Manke T (2016) deepTools2: a next generation web server for deep‐sequencing data analysis. Nucleic Acids Res 44: W160–W165 [DOI] [PMC free article] [PubMed] [Google Scholar]
- Rea S, Eisenhaber F, O'Carroll D, Strahl BD, Sun Z‐W, Schmid M, Opravil S, Mechtler K, Ponting CP, Allis CD et al (2000) Regulation of chromatin structure by site‐specific histone H3 methyltransferases. Nature 406: 593–599 [DOI] [PubMed] [Google Scholar]
- Reveron‐Gomez N, Gonzalez‐Aguilera C, Stewart‐Morgan KR, Petryk N, Flury V, Graziano S, Johansen JV, Jakobsen JS, Alabert C, Groth A (2018) Accurate recycling of parental histones reproduces the histone modification landscape during DNA replication. Mol Cell 72: 239–249.e5 [DOI] [PMC free article] [PubMed] [Google Scholar]
- Richardson RT, Batova IN, Widgren EE, Zheng LX, Whitfield M, Marzluff WF, O'Rand MG (2000) Characterization of the histone H1‐binding protein, NASP, as a cell cycle‐regulated somatic protein. J Biol Chem 275: 30378–30386 [DOI] [PubMed] [Google Scholar]
- Robinson JT, Thorvaldsdottir H, Winckler W, Guttman M, Lander ES, Getz G, Mesirov JP (2011) Integrative genomics viewer. Nat Biotechnol 29: 24–26 [DOI] [PMC free article] [PubMed] [Google Scholar]
- Robinson JT, Thorvaldsdottir H, Wenger AM, Zehir A, Mesirov JP (2017) Variant review with the integrative genomics viewer. Cancer Res 77: e31–e34 [DOI] [PMC free article] [PubMed] [Google Scholar]
- Robinson MD, McCarthy DJ, Smyth GK (2010) edgeR: a Bioconductor package for differential expression analysis of digital gene expression data. Bioinformatics 26: 139–140 [DOI] [PMC free article] [PubMed] [Google Scholar]
- Roux KJ, Kim DI, Raida M, Burke B (2012) A promiscuous biotin ligase fusion protein identifies proximal and interacting proteins in mammalian cells. J Cell Biol 196: 801–810 [DOI] [PMC free article] [PubMed] [Google Scholar]
- Schmid M, Durussel T, Laemmli UK (2004) ChIC and ChEC; genomic mapping of chromatin proteins. Mol Cell 16: 147–157 [DOI] [PubMed] [Google Scholar]
- Singh RK, Kabbaj MH, Paik J, Gunjan A (2009) Histone levels are regulated by phosphorylation and ubiquitylation‐dependent proteolysis. Nat Cell Biol 11: 925–933 [DOI] [PMC free article] [PubMed] [Google Scholar]
- Srivastava S, Sahu U, Zhou Y, Hogan AK, Sathyan KM, Bodner J, Huang J, Wong KA, Khalatyan N, Savas JN et al (2021) NOTCH1‐driven UBR7 stimulates nucleotide biosynthesis to promote T cell acute lymphoblastic leukemia. Sci Adv 7: eabc9781 [DOI] [PMC free article] [PubMed] [Google Scholar]
- Tagami H, Ray‐Gallet D, Almouzni G, Nakatani Y (2004) Histone H3.1 and H3.3 complexes mediate nucleosome assembly pathways dependent or independent of DNA synthesis. Cell 116: 51–61 [DOI] [PubMed] [Google Scholar]
- Tasaki T, Zakrzewska A, Dudgeon DD, Jiang Y, Lazo JS, Kwon YT (2009) The substrate recognition domains of the N‐end rule pathway. J Biol Chem 284: 1884–1895 [DOI] [PMC free article] [PubMed] [Google Scholar]
- Thorvaldsdottir H, Robinson JT, Mesirov JP (2013) Integrative Genomics Viewer (IGV): high‐performance genomics data visualization and exploration. Brief Bioinform 14: 178–192 [DOI] [PMC free article] [PubMed] [Google Scholar]
- Torné J, Ray‐Gallet D, Boyarchuk E, Garnier M, Le Baccon P, Coulon A, Orsi GA, Almouzni G (2020) Two HIRA‐dependent pathways mediate H3.3 de novo deposition and recycling during transcription. Nat Struct Mol Biol 27: 1057–1068 [DOI] [PubMed] [Google Scholar]
- Trapnell C, Pachter L, Salzberg SL (2009) TopHat: discovering splice junctions with RNA‐Seq. Bioinformatics 25: 1105–1111 [DOI] [PMC free article] [PubMed] [Google Scholar]
- Tripodi IJ, Allen MA, Dowell RD (2018) Detecting differential transcription factor activity from ATAC‐Seq data. Molecules 23: 1136 [DOI] [PMC free article] [PubMed] [Google Scholar]
- Wang H, Walsh ST, Parthun MR (2008) Expanded binding specificity of the human histone chaperone NASP. Nucleic Acids Res 36: 5763–5772 [DOI] [PMC free article] [PubMed] [Google Scholar]
- Xu C, Wang X, Liu K, Roundtree IA, Tempel W, Li Y, Lu Z, He C, Min J (2014) Structural basis for selective binding of m6A RNA by the YTHDC1 YTH domain. Nat Chem Biol 10: 927–929 [DOI] [PubMed] [Google Scholar]
- Xu M, Long C, Chen X, Huang C, Chen S, Zhu B (2010) Partitioning of histone H3–H4 tetramers during DNA replication‐dependent chromatin assembly. Science 328: 94–98 [DOI] [PubMed] [Google Scholar]
- Yu C, Gan H, Serra‐Cardona A, Zhang L, Gan S, Sharma S, Johansson E, Chabes A, Xu RM, Zhang Z (2018) A mechanism for preventing asymmetric histone segregation onto replicating DNA strands. Science 361: 1386–1389 [DOI] [PMC free article] [PubMed] [Google Scholar]
- Zasadzinska E, Huang J, Bailey AO, Guo LY, Lee NS, Srivastava S, Wong KA, French BT, Black BE, Foltz DR (2018) Inheritance of CENP‐A nucleosomes during DNA Replication Requires HJURP. Dev Cell 47: 348–362.e7 [DOI] [PMC free article] [PubMed] [Google Scholar]
- Zee BM, Levin RS, DiMaggio PA, Garcia BA (2010) Global turnover of histone post‐translational modifications and variants in human cells. Epigenet Chromatin 3: 22 [DOI] [PMC free article] [PubMed] [Google Scholar]
- Zhang Y, Liu T, Meyer CA, Eeckhoute J, Johnson DS, Bernstein BE, Nussbaum C, Myers RM, Brown M, Li W et al (2008) Model‐based analysis of ChIP‐Seq (MACS). Genome Biol 9: R137 [DOI] [PMC free article] [PubMed] [Google Scholar]
- Zimmerman SW, Yi YJ, Sutovsky M, van Leeuwen FW, Conant G, Sutovsky P (2014) Identification and characterization of RING‐finger ubiquitin ligase UBR7 in mammalian spermatozoa. Cell Tissue Res 356: 261–278 [DOI] [PubMed] [Google Scholar]