Abstract
Altered intestinal microbial composition promotes intestinal barrier dysfunction and triggers the initiation and recurrence of inflammatory bowel disease (IBD). Current treatments for IBD are focused on control of inflammation rather than on maintaining intestinal epithelial barrier function. Here, we show that the internalization of Gram‐negative bacterial outer membrane vesicles (OMVs) in human intestinal epithelial cells promotes recruitment of caspase‐5 and PIKfyve to early endosomal membranes via sorting nexin 10 (SNX10), resulting in LPS release from OMVs into the cytosol. Caspase‐5 activated by cytosolic LPS leads to Lyn phosphorylation, which in turn promotes nuclear translocalization of Snail/Slug, downregulation of E‐cadherin expression, and intestinal barrier dysfunction. SNX10 deletion or treatment with DC‐SX029, a novel SNX10 inhibitor, rescues OMV‐induced intestinal barrier dysfunction and ameliorates colitis in mice by blocking cytosolic LPS release, caspase‐5 activation, and downstream signaling. Our results show that targeting SNX10 may be a new therapeutic approach for restoring intestinal epithelial barrier function and promising strategy for IBD treatment.
Keywords: E‐cadherin, IBD, intestinal barrier function, LPS release, SNX10
Subject Categories: Membranes & Trafficking; Microbiology, Virology & Host Pathogen Interaction
A PIKfyve/caspase‐5/Lyn cascade downregulating E‐cadherin expression downstream of sorting nexin 10 provides a potential pharmacological target for inflammatory bowel disease caused by intestinal microbiome alterations.

Introduction
Alteration of intestinal microbial composition has a crucial impact on the intestinal barrier function. Impaired intestinal mucosal barrier function is the trigger for the initiation and recurrence of IBD (Plichta et al, 2019). Loss of an integrated gut mucosa barrier results in inappropriate translocation of intestinal luminal contents, commensal microbiota, and pathogenic microbes into the gut lamina propria, and ultimately induces intestinal inflammation (Graham et al, 2019). Current IBD treatment focuses on inflammation control rather than restoring intestinal epithelial barrier function. Accumulated proportions of Gram‐negative bacteria in the inflamed lesion of intestinal epithelium have been detected in the patients of intestinal inflammatory diseases (Seksik et al, 2003; Martin et al, 2005), indicating the elevated LPS from the augmentative Gram‐negative bacteria engages into the initiation and aggravation of intestinal inflammation. The OMVs derived from Gram‐negative bacteria are regarded as a carrier that releases LPS into the cytosol for activating the caspase‐11‐dependent signaling pathway in vivo and in vitro (Vanaja et al, 2016). However, the precise mechanism that triggers LPS release from OMVs and its impact on intestinal epithelial barrier function are largely unknown. SNX10 is a member of sorting nexin (SNX) family proteins. Our previous studies found it acted as an adaptor protein and played crucial roles in endosome/lysosome homeostasis and function maintenance. Since endosomal events are related to OMV internalization and LPS release (Vanaja et al, 2016), in the present study, we explored the role of SNX10 in the cytosolic release of LPS from OMVs and its impact on intestinal epithelial barrier function.
Results
SNX10 involves in OMV‐induced downregulation of E‐cadherin in intestinal epithelial cells
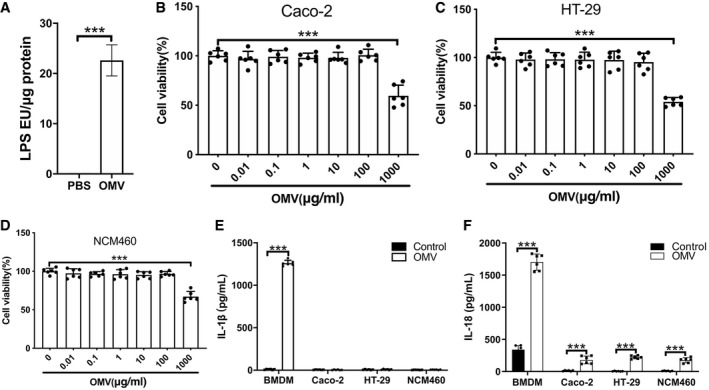
After LPS quantification, OMVs from Escherichia coli BL21 were used to treat Caco‐2, HT‐29, and NCM460 cells, no significant cytotoxicity was found at the concentration below 100 μg/ml (including 100 μg/ml, Fig EV1A–D). In bone marrow‐derived macrophages (BMDMs), IL‐1β and IL‐18 secretion was significantly increased and the cell viability was reduced by OMV (100 μg/ml) induction, while undetectable IL‐1β and slightly increased IL‐18 secretion were found in Caco‐2, HT‐29, or NCM460 cells (Fig EV1E and F, Appendix Fig S1A). The OMV‐induced IL‐18 secretion in intestinal epithelial cells was consistent with the results of the previous study (Knodler et al, 2014), and we also found that SNX10 deficiency prominently inhibited OMV‐induced IL‐18 secretion in Caco‐2 cells (Appendix Fig S2). These results suggest OMV treatment at 100 μg/ml might trigger a different signaling rather than inflammasome activation and pyroptosis in intestinal epithelial cells.
Figure EV1. Effects of OMV treatment on the viability of intestinal epithelial cells.
-
ALPS levels in purified OMVs were determined by LAL assay (n = 6 independent experiments).
-
B–DThe cell viability of Caco‐2 (B), HT‐29 (C), and NCM460 (D) cells treated with indicated doses of OMVs for 24 h was detected by Cell Counting Kit‐8 (CCK‐8; n = 6 independent experiments).
-
EIL‐1β secretion by indicated cell types stimulated with OMVs (100 μg/ml) for 24 h was detected by ELISA (n = 6 independent experiments).
-
FIL‐18 secretion by indicated cell types stimulated with OMVs (100 μg/ml) for 24 h was detected by ELISA (n = 6 independent experiments).
Data information: Data are means ± SD. Two‐tailed unpaired t‐test between two groups and one‐way ANOVA followed by Bonferroni post hoc test for multiple comparisons were utilized for statistical analyses. ***P < 0.001.
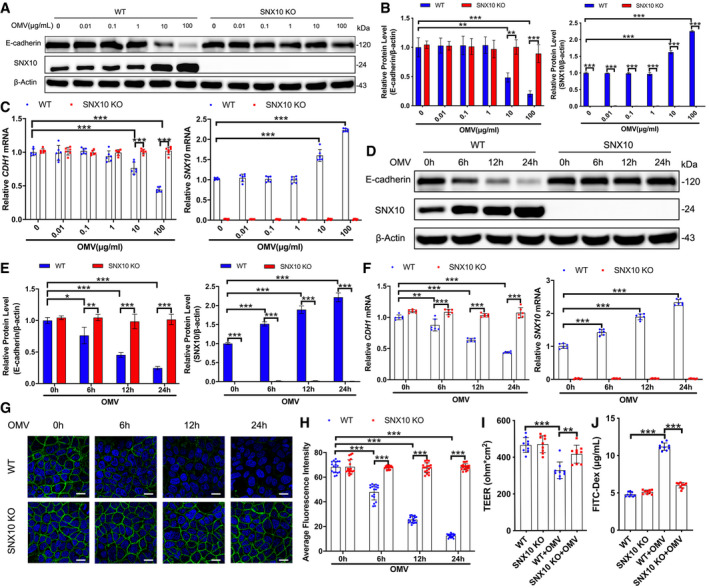
Alterations in tight junctions (TJs) and adherens junctions (AJs) may result in disturbance of paracellular permeability. As shown in Fig 1A–C, OMV treatment at 10 or 100 μg/ml for 24 h could reduce the protein and mRNA (CDH1) levels of E‐cadherin in a concentration‐dependent manner. Surprisingly, SNX10 deletion by CRISPR/Cas9 technique prohibited the E‐cadherin reduction caused by 10 or 100 μg/ml OMV treatment in Caco‐2 cells (Figs 1A–C and EV2A). These results were also confirmed by time course of OMV treatment (100 μg/ml) for 6, 12, and 24 h in both Caco‐2 and HT‐29 cells (Figs 1D–F and EV2A–D). Conversely, OMV treatment did not affect the expression of TJ proteins (Fig EV2E). Confocal images of WT Caco‐2 cell monolayers revealed that E‐cadherin was distributed regularly along with the cell boundaries, exhibiting a characteristic ‘chicken wire’ markup type (Fig 1G). In accordance with the dramatical reduction in protein and mRNA levels, incubation of Caco‐2 cells with OMV (100 μg/ml) treatment for 6, 12, and 24 h obviously impaired the structures of E‐cadherin by breaking successive band pattern and disturbing the distribution of E‐cadherin (Fig 1G and H). However, SNX10 deficiency reversed the OMV‐induced variations (Fig 1G and H). The results from intestinal barrier permeability assay in Caco‐2 and HT‐29 cells showed that SNX10 deficiency substantially prevented the OMV‐induced decline in transepithelial electrical resistance (TEER) and strikingly restrained OMV‐induced leakage of FITC‐dextran into the bottom chambers (Figs 1I and J, and EV2F and G). Based on these findings, we propose that SNX10 deficiency potentially maintains the intestinal barrier integrity through suppressing OMV‐induced downregulation of the adherens junction.
Figure 1. SNX10 involves in OMV‐induced downregulation of E‐cadherin in intestinal epithelial cells.
-
A–CWT and SNX10 KO Caco‐2 cells were treated with indicated doses of OMVs for 24 h. Protein expression of E‐cadherin and SNX10 was determined by immunoblots (A) and quantified by ImageJ software (B) (n = 3 independent experiments). The fold changes in mRNA levels of CDH1 (encoding E‐cadherin) and SNX10 in Caco‐2 cells were determined by RT–qPCR (C) (n = 6 independent experiments).
-
D–FWT and SNX10 KO Caco‐2 cells were treated with OMVs (100 μg/ml) for the indicated time. Protein expression of E‐cadherin and SNX10 was determined by immunoblots (D) and quantified by ImageJ software (E) (n = 3 independent experiments). The fold changes in mRNA levels of CDH1 and SNX10 were determined by RT–qPCR (F) (n = 6 independent experiments).
-
G, HConfocal images of E‐cadherin staining in Caco‐2 cells treated with OMVs (100 μg/ml) for the indicated time were captured (G), and the fluorescence intensity of E‐cadherin staining was quantified by ImageJ software (H) (n = 3 independent experiments, n = 18 fields analyzed). Scale bar: 20 μm.
-
ITEER value of Caco‐2 cell monolayers incubated with or without OMVs (100 μg/ml) for 24 h was analyzed (n = 9 independent experiments).
-
JCaco‐2 cell monolayers on transwell membranes were treated with or without OMVs (100 μg/ml) for 24 h. FITC‐dextran was added to these cells (top of the membrane). After 2 h, FITC‐dextran levels in the bottom chamber wells were measured (n = 9 independent experiments).
Data information: Data are means ± SD. One‐way ANOVA followed by Bonferroni post hoc test was used for statistical analyses. *P < 0.05; **P < 0.01; ***P < 0.001.
Source data are available online for this figure.
Figure EV2. SNX10 deficiency maintains the E‐cadherin expression and intestinal epithelial barrier function in HT‐29 cells treated with OMVs.
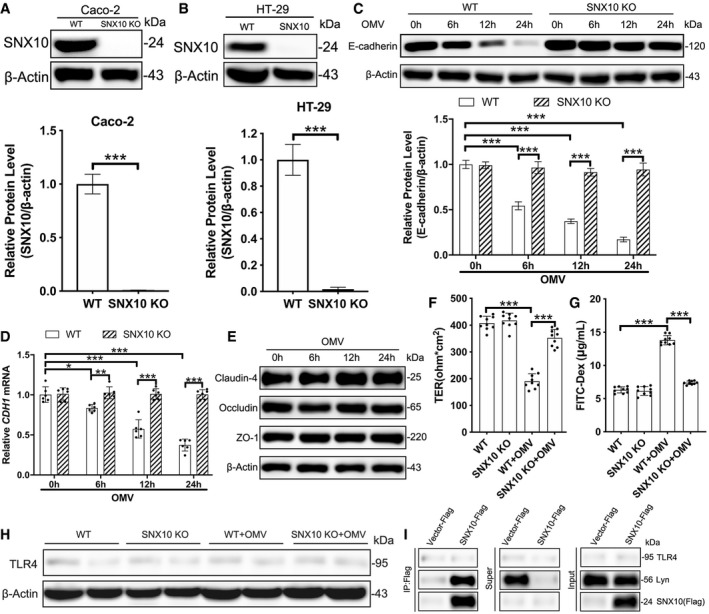
- SNX10 was deleted in Caco‐2 cells by CRISPR/Cas9 technology, and the efficiency was confirmed by immunoblots and quantified by ImageJ software (n = 6 independent experiments).
- SNX10 was deleted in HT‐29 cells by CRISPR/Cas9 technology, and the efficiency was confirmed by immunoblots and quantified by ImageJ software (n = 6 independent experiments).
- Protein levels of E‐cadherin in HT‐29 cells were measured by western blots and quantified by ImageJ software (n = 3 independent experiments).
- The relative mRNA levels of CDH1 (encoding E‐cadherin) in HT‐29 cells were determined by RT–qPCR method (n = 6 independent experiments).
- The expression of tight junction proteins in Caco‐2 cells treated with OMVs (100 μg/ml) was determined by immunoblots.
- TEER value of HT‐29 cell monolayers incubated with or without OMVs (100 μg/ml) for 24 h was measured (n = 9 independent experiments).
- HT‐29 cell monolayers on transwell membranes were treated with or without OMVs (100 μg/ml) for 24 h. FITC‐dextran was added to these cells (top of the membrane). After 2 h, FITC‐dextran levels in the bottom chamber wells were detected (n = 9 independent experiments).
- Lysates from WT and SNX10 KO Caco‐2 cells treated with or without 100 μg/ml OMVs for 24 h were analyzed by immunoblots.
- Lysates from Caco‐2 cells transfected with SNX10‐Flag were subjected to pull‐down assay with anti‐Flag antibody‐conjugated agarose, followed by immunoblots with indicated antibodies.
Data information: Data are means ± SD. Two‐tailed unpaired t‐test between two groups (A and B), and one‐way ANOVA followed by Bonferroni post hoc test for multiple comparisons were utilized for statistical analyses (C, D, F and G). *P < 0.05; **P < 0.01; ***P < 0.001.
Source data are available online for this figure.
Blockage of OMV‐induced E‐cadherin reduction in SNX10‐deficient cells is due to the inhibited nuclear localization of Snail/Slug proteins
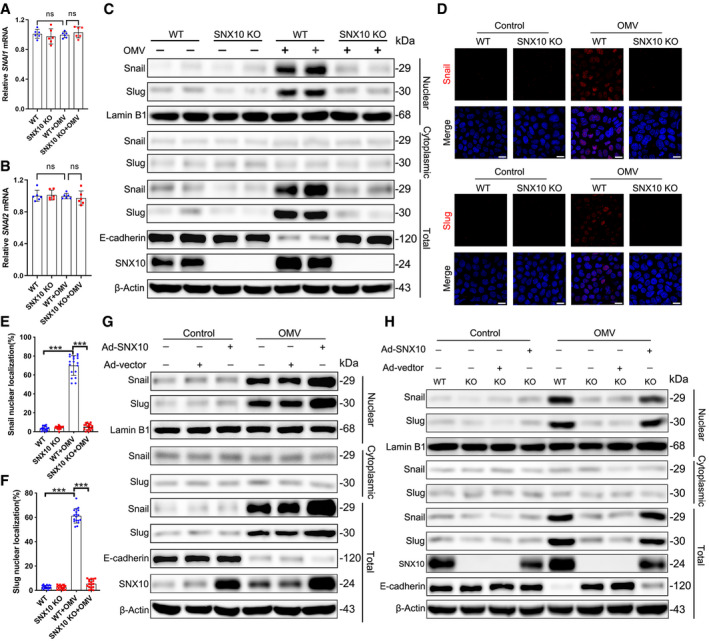
RT–qPCR showed OMV (100 μg/ml) treatment for 24 h did not affect the mRNA levels of SNAI1 (encoding Snail) or SNAI2 (encoding Slug; Fig 2A and B), but dramatically induced the nuclear localization of Snail and Slug (Fig 2C–F). SNX10 deficiency observably inhibited OMV‐induced nuclear localization of Snail and Slug (Fig 2C–F). Consistently, overexpression of SNX10 by infecting Caco‐2 cells with Ad‐SNX10 promoted OMV‐induced nuclear localization of Snail and Slug accompanied by more severe downregulation of E‐cadherin (Fig 2G). Furthermore, reintroduction of SNX10 reversed the reduction of nuclear Snail and Slug caused by SNX10 deficiency, resulting in the decreased protein expression of E‐cadherin (Fig 2H). These results suggest that SNX10 is involved in the maintenance of E‐cadherin expression by regulating nuclear localization of Snail and Slug.
Figure 2. Blockage of OMV‐induced E‐cadherin reduction in SNX10‐deficient cells is due to the inhibited nuclear localization of Snail/Slug proteins.
-
A, BWT and SNX10 KO Caco‐2 cells were treated with or without OMVs (100 μg/ml) for 24 h. The fold changes in mRNA levels of SNAI1 (encoding Snail) (A) and SNAI2 (encoding Slug) (B) in Caco‐2 cells were determined by RT–qPCR. n = 6 independent experiments. Data are means ± SD. One‐way ANOVA followed by Bonferroni post hoc test was used for statistical analyses. ns, not significant.
-
CWT and SNX10 KO Caco‐2 cells were treated with or without OMVs (100 μg/ml) for 24 h. Cytoplasmic and nuclear proteins were extracted for Snail and Slug determination by immunoblots.
-
D–FWT and SNX10 KO Caco‐2 cells were treated with or without OMVs (100 μg/ml) for 24 h. Snail and Slug were assessed by immunofluorescence staining (D) and quantified as the percentage of Snail (E) or Slug (F)‐positive nuclei, respectively. Scale bar: 20 μm. n = 3 independent experiments, n = 18 fields analyzed. Data are means ± SD. One‐way ANOVA followed by Bonferroni post hoc test was used for statistical analyses. ***P < 0.001.
-
GCaco‐2 cells were transfected with Ad‐vector or Ad‐SNX10, followed by treatment with or without 100 μg/ml OMVs for 24 h. Proteins from nucleus, cytoplasm, and total cell lysates were subjected to immunoblots with the indicated antibodies.
-
HWT and SNX10 KO Caco‐2 cells were transfected with Ad‐vector or Ad‐SNX10, followed by treatment with or without 100 μg/ml OMVs for 24 h. Proteins from nucleus, cytoplasm, and total cell lysates were subjected to immunoblots with the indicated antibodies.
Source data are available online for this figure.
SNX10 deficiency impairs Lyn‐mediated nuclear localization of Snail/Slug
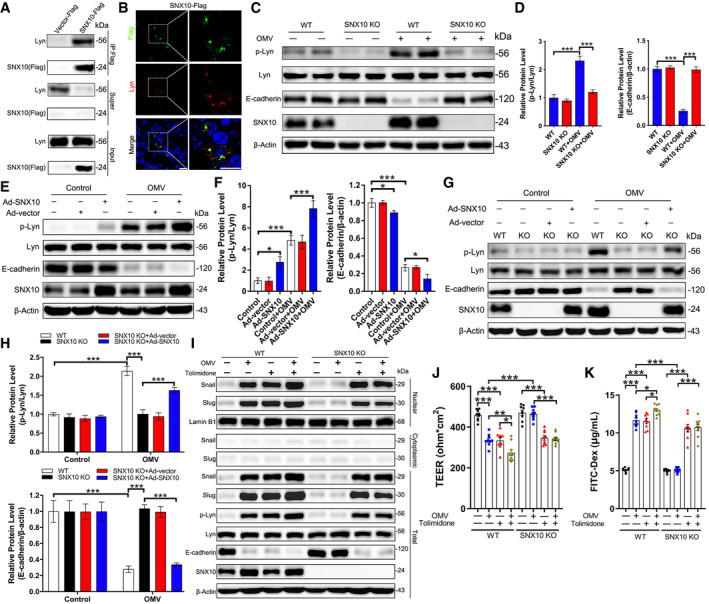
Lyn has emerged as an important upstream regulator of Snail and Slug (Thaper et al, 2017). The pull‐down experiment revealed a strong interaction of SNX10‐Flag with Lyn (Fig 3A), which was confirmed by co‐localization of SNX10‐Flag and Lyn (Fig 3B). OMV treatment increased the phosphorylated Lyn (p‐Lyn), which was prevented by SNX10 deficiency along with a sustained E‐cadherin expression (Fig 3C and D). Overexpression of SNX10 facilitated Lyn phosphorylation induced by OMVs together with a more distinct downregulation of E‐cadherin (Fig 3E and F). Rescue of SNX10 eliminated the reduction of Lyn phosphorylation and sustentation of E‐cadherin expression in SNX10‐deleted Caco‐2 cells with OMV treatment (Fig 3G and H). Tolimidone (Toli), a Lyn agonist, prominently increased the level of p‐Lyn accompanied by increased nuclear Snail/Slug proteins and decreased E‐cadherin in both WT and SNX10 KO cells (Fig 3I). Consistently, Tolimidone treatment also enhanced OMV‐induced decrease of TEER and leakage of FITC‐dextran into the bottom chambers (Fig 3J and K). These results indicate that the persistence of E‐cadherin expression in SNX10‐deficient cells resulted from the impaired Lyn‐mediated nuclear localization of Snail/Slug.
Figure 3. SNX10 deficiency impairs Lyn‐mediated nuclear localization of Snail/Slug.
-
ALysates from Caco‐2 cells transfected with SNX10‐Flag were subjected to pull‐down assay with anti‐Flag antibody‐conjugated agarose, followed by immunoblots with the indicated antibodies.
-
BRepresentative images of co‐staining of SNX10‐Flag and Lyn in Caco‐2 cells expressing SNX10‐Flag. Scale bar: 20 μm.
-
C, DLevels of p‐Lyn, Lyn, E‐cadherin, and SNX10 in WT and SNX10 KO Caco‐2 cells treated with or without OMVs (100 μg/ml) for 24 h were determined by immunoblots (C) and quantified by ImageJ software (D) (n = 3 independent experiments).
-
E, FCaco‐2 cells were transfected with Ad‐vector or Ad‐SNX10, followed by treatment with or without OMVs (100 μg/ml) for 24 h. Lysates were extracted and subjected to immunoblots with the indicated antibodies (E) and quantified by ImageJ software (F) (n = 3 independent experiments).
-
G, HWT and SNX10 KO Caco‐2 cells were transfected with Ad‐vector or Ad‐SNX10, followed by treatment with or without OMVs (100 μg/ml) for 24 h. Total cell lysates were subjected to immunoblots with the indicated antibodies (G) and quantified by ImageJ software (H) (n = 3 independent experiments).
-
ICytoplasmic and nuclear proteins were extracted from WT and SNX10 KO Caco‐2 cells treated with or without Tolimidone (10 μM), and the indicated proteins were analyzed by immunoblots.
-
JTEER value of Caco‐2 cell monolayers after incubation with or without Tolimidone (10 μM) for 24 h was analyzed (n = 9 independent experiments).
-
KCaco‐2 cell monolayers on transwell membranes were treated with or without Tolimidone (10 μM) for 24 h. FITC dextran was added to these cells (top of the membrane). After 2 h, FITC‐dextran levels in the bottom chamber wells were measured (n = 9 independent experiments).
Data information: Data are means ± SD. One‐way ANOVA followed by Bonferroni post hoc test was used for statistical analyses. *P < 0.05; **P < 0.01; ***P < 0.001.
Source data are available online for this figure.
Interaction of SNX10 and caspase‐5 is essential for OMV‐induced Lyn phosphorylation
We then explored whether OMV‐induced Lyn phosphorylation was related to caspase‐4 or −5 (caspase‐11 in mice). Neither OMV treatment nor SNX10 deficiency had significant effects on the expression of caspase‐4 or caspase‐5 in Caco‐2 cells (Fig 4A). Interestingly, caspase‐5 rather than caspase‐4 was pulled down by Flag‐tagged SNX10 (Fig 4B). Co‐localization of SNX10‐Flag and caspase‐5 was further confirmed (Fig 4C). Immunoprecipitation revealed that OMV treatment dramatically induced the interaction between caspase‐5 and Lyn, which was blocked by SNX10 deficiency (Fig 4D). Consistently, the co‐localization of caspase‐5 and Lyn was obviously increased by OMV stimulation, and this was reversed by SNX10 deficiency (Fig 4E and F). Interference of caspase‐5 rather than caspase‐4 could inhibit OMV‐induced Lyn phosphorylation, Snail/Slug nuclear localization, and E‐cadherin reduction (Fig 4G). In addition, OMV treatment did not affect the expression of Toll‐like receptor 4 (TLR4), and no interaction was found between TLR4 and SNX10 (Fig EV2H and I). These results indicate that interaction of caspase‐5 with SNX10 is required for OMV‐induced Lyn phosphorylation. To investigate which region is responsible for the interaction of caspase‐5 and SNX10, deletion mutagenesis was done as described in our previous study (Zhang et al, 2020). Deletion of the PX domain, but not the C or N terminus region of SNX10 abolished the interaction of caspase‐5 and SNX10 (Fig 4H) and inhibited Lyn phosphorylation induced by OMVs (Fig 4I). These results further confirmed the essential role of the interaction of caspase‐5 and SNX10 in OMV‐induced Lyn phosphorylation.
Figure 4. Interaction of SNX10 and caspase‐5 is essential for OMV‐induced Lyn phosphorylation.
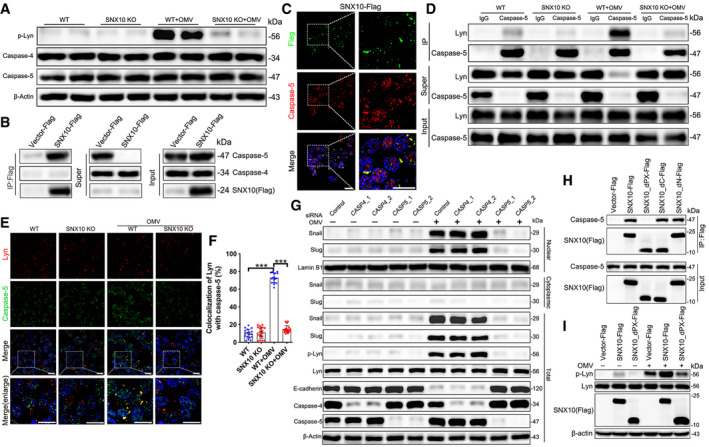
- Lysates from WT and SNX10 KO Caco‐2 cells treated with or without 100 μg/ml OMVs for 24 h were analyzed by immunoblots with the indicated antibodies.
- Lysates from Caco‐2 cells transfected with SNX10‐Flag were subjected to pull‐down assay with anti‐Flag antibody‐conjugated agarose, followed by immunoblots with the indicated antibodies.
- Representative images of co‐staining of SNX10‐Flag and caspase‐5 in Caco‐2 cells expressing SNX10‐Flag. Scale bar: 20 μm.
- WT and SNX10 KO Caco‐2 cells were treated with or without OMVs (100 μg/ml) for 24 h and then subjected to IP with anti‐caspase‐5 antibody.
- Representative images of costaining of Lyn and caspase‐5 in WT and SNX10 KO Caco‐2 cells treated with or without OMVs (100 μg/ml) for 24 h. Scale bar: 20 μm.
- The co‐localization of Lyn and caspase‐5 was quantified by ImageJ software. n = 3 independent experiments, n = 18 fields analyzed. Data are means ± SD. One‐way ANOVA followed by Bonferroni post hoc test was used for statistical analyses. ***P < 0.001.
- Cytoplasmic and nuclear proteins were extracted from Caco‐2 cells transfected with control siRNA, CASP4 siRNA, or CASP5 siRNA and the indicated proteins were detected by immunoblots.
- Lysates of Flag‐tagged full‐length SNX10 or its different truncated mutants transfected with Caco‐2 cells were subjected to immunoprecipitation.
- Caco‐2 cells were transfected with Flag‐tagged full‐length SNX10 or its indicated truncated mutant, followed by treatment with or without OMVs (100 μg/ml) for 24 h. Lysates were extracted and subjected to immunoblots with the indicated antibodies.
Source data are available online for this figure.
SNX10 deficiency blocks LPS release from early endosomes into the cytosol
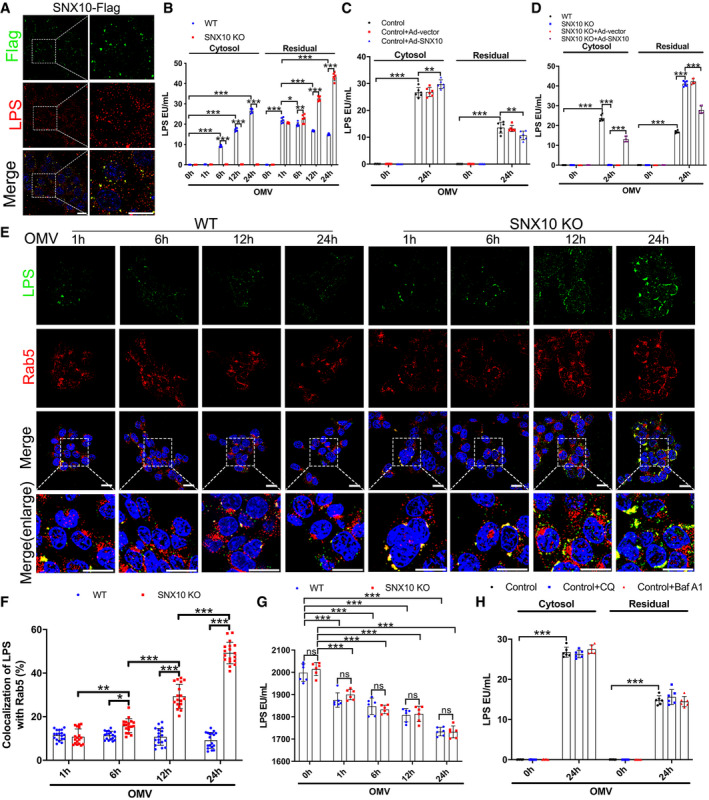
Since caspase‐5 is the cytosolic receptor of LPS, we wondered whether SNX10 deletion affected the LPS release from OMVs. Immunostaining revealed a visible colocalization of SNX10‐Flag and endosomal LPS in Caco‐2 cells transfected with SNX10‐Flag (Fig 5A). LPS content in WT cells was elevated in the cytosol but reduced in the residual over time. Interestingly, SNX10 deficiency completely blocked the increase of cytosolic LPS and a large amount of LPS was remained in the residual (Fig 5B). While, SNX10 complementation facilitated LPS release of OMVs (Fig 5C), and SNX10 reintroduction inhibited SNX10 KO‐induced blockage of LPS release in Caco‐2 cells (Fig 5D). Immunostaining showed almost all of the internalized OMVs were co‐localized with early endosomal marker Rab5 at 1 h of OMV stimulation, suggesting that the endocytosis was the indispensable approach for OMVs to acquire intracellular access (Fig 5E, Appendix Fig S3A and B). In WT cells, the co‐localization of LPS with Rab5 remained unchanged (Fig 5E). Surprisingly, in SNX10 KO Caco‐2 cells, beginning from 6 h of OMV treatment, LPS spots were obviously enlarged and much brighter than those in WT cells, and the co‐localization of cytoplasmic LPS and Rab5 dramatically increased over time (Fig 5E and F). While, almost no co‐localization of cytoplasmic LPS and Rab7 or LAMP2A was observed during the time course of OMV treatment (Appendix Fig S3A and B). In order to exclude the possible effect of SNX10 KO on the uptake of LPS, the LPS content in the cell culture supernatants after OMV treatment for the indicated time was measured. As shown in Fig 5G, no significant difference was found between WT and SNX10 KO Caco‐2 cells. These results suggest that SNX10 deficiency might directly block LPS release from early endosome into the cytosol. Notably, treatment with either chloroquine (CQ; 200 nM) or bafilomycin A1 (Baf A1; 50 nM) for 24 h had no significant effect on the release of LPS into the cytosol (Fig 5H), indicating that OMVs directly released LPS into the cytosol from early endosomes rather than late endosomes or lysosomes.
Figure 5. SNX10 deficiency blocks LPS release from early endosomes into the cytosol.
-
ACo‐staining of SNX10‐Flag and LPS in Caco‐2 cells transfected with SNX10‐Flag after treatment with OMVs (100 μg/ml) for 24 h. Scale bar: 20 μm.
-
BLPS levels in the cytosolic and residual fractions of Caco‐2 cells treated with OMVs (100 μg/ml) for the indicated time were detected by LAL assay (n = 6 independent experiments).
-
CCaco‐2 cells were transfected with Ad‐vector or Ad‐SNX10, followed by treatment with or without OMVs (100 μg/ml) for 24 h. LPS levels in the cytosolic and residual fractions of Caco‐2 cells were evaluated (n = 6 independent experiments).
-
DWT and SNX10 KO Caco‐2 cells were transfected with Ad‐vector or Ad‐SNX10, followed by treatment with or without OMVs (100 μg/ml) for 24 h. LPS levels in the cytosolic and residual fractions of Caco‐2 cells were detected (n = 6 independent experiments).
-
E, FWT and SNX10 KO Caco‐2 cells were treated with OMVs (100 μg/ml) for the indicated time and stained with antibodies against LPS and Rab5 (E). Scale bar: 20 μm. Co‐localized LPS and Rab5 were quantified by ImageJ software (F) (n = 3 independent experiments, n = 18 fields analyzed).
-
GLPS levels in the cell culture supernatants of WT and SNX10 KO Caco‐2 cells stimulated by OMVs (100 μg/ml) for the indicated time were detected by LAL assay (n = 6 independent experiments).
-
HLPS levels in the cytosolic and residual fractions of Caco‐2 cells stimulated by OMVs (100 μg/ml) with or without chloroquine (CQ; 200 nM) or bafilomycin A1 (Baf A1; 50 nM) for the indicated time were detected by LAL assay (n = 6 independent experiments).
Data information: Data are means ± SD. One‐way ANOVA followed by Bonferroni post hoc test was used for statistical analyses. *P < 0.05; **P < 0.01; ***P < 0.001; ns, not significant.
Recruitment of caspase‐5 to PIKfyve by SNX10 triggers LPS release from early endosomes into the cytosol
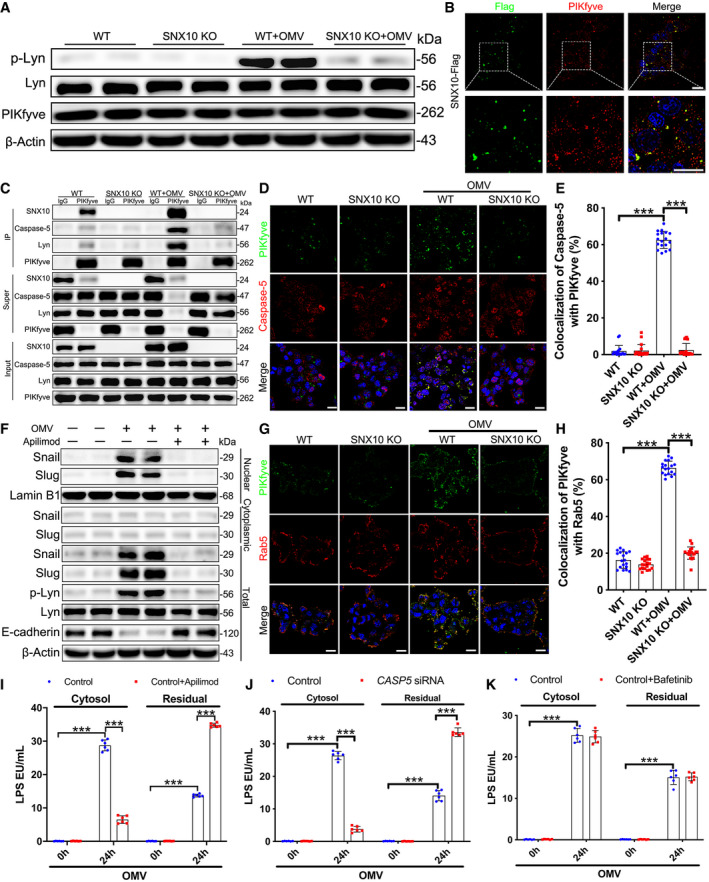
PIKfyve was involved in the endosome maturation (Huotari & Helenius, 2011) and the cargo exit from early endosomes (Rutherford et al, 2006). To explore the mechanism that SNX10 deficiency inhibited the release of LPS in OMVs from early endosomes, we screened the proteins that interacted with SNX10 and found PIKfyve might be involved in this process. Neither OMV treatment nor SNX10 deficiency affected the expression of PIKfyve (Fig 6A). Co‐localization of SNX10‐Flag and PIKfyve was confirmed by immunostaining (Fig 6B). The interaction of PIKfyve with SNX10, caspase‐5 or Lyn could be enhanced by OMV treatment, while impaired by SNX10 deficiency (Fig 6C). This was confirmed by immunostaining (Fig 6D and E). Furthermore, we found that caspase‐5 interference had no effect on OMV‐induced interaction between SNX10 and Lyn or PIKfyve and Lyn (Appendix Fig S4A). PIKfyve knockdown had no effect on OMV‐induced recruitment of caspase‐5 by SNX10‐Flag (Appendix Fig S4B). Similarly, caspase‐5 knockdown failed to affect OMV‐induced recruitment of PIKfyve by SNX10‐Flag (Appendix Fig S4C). Interestingly, OMV treatment obviously induced the co‐localization between PIKfyve and Rab5, which was also reduced by SNX10 deficiency, suggesting the early endosomal localization of PIKfyve was mediated by SNX10 (Fig 6G and H). Treatment with apilimod, an inhibitor of PIKfyve, could distinctly inhibit OMV‐induced Lyn phosphorylation, Snail/Slug nuclear localization, and E‐cadherin reduction (Fig 6F), and reduce LPS release from OMVs into the cytosol (Fig 6I). Interference of caspase‐5 observably inhibited LPS release into the cytosol (Fig 6J), while treatment with bafetinib, a specific inhibitor of Lyn, had no effects on LPS release (Fig 6K). These results indicate that the recruitment of caspase‐5 by SNX10 to PIKfyve is essential for triggering LPS release into the cytosol from early endosomes. Since guanylate‐binding proteins (GBPs) and the interferon‐inducible protein IRGB10 were involved in the activation of the LPS‐sensing caspase‐11 (Meunier et al, 2014; Pilla et al, 2014; Man et al, 2016), we also detected the effects of SNX10 deficiency on the expression of GBPs and IRGB10. However, SNX10 deficiency had no effect on the expression of GBPs (such as GBP2 and GBP5) and IRGB10 at the transcriptional level (Appendix Fig S6).
Figure 6. Recruitment of caspase‐5 to PIKfyve by SNX10 triggers LPS release from early endosomes into the cytosol.
-
ALysates from WT and SNX10 KO Caco‐2 cells treated with or without 100 μg/ml OMVs for 24 h were analyzed by immunoblots with the indicated antibodies.
-
BCo‐staining of SNX10‐Flag and PIKfyve in Caco‐2 cells transfected with SNX10‐Flag. Scale bar: 20 μm.
-
CWT and SNX10 KO Caco‐2 cells were treated with or without OMVs (100 μg/ml) for 24 h and then subjected to IP with anti‐PIKfyve antibody.
-
D, ECo‐staining of PIKfyve and caspase‐5 in WT and SNX10 KO Caco‐2 cells treated with or without OMVs (100 μg/ml) for 24 h (D). Anti‐PIKfyve and anti‐caspase‐5 antibodies were used to detect endogenous PIKfyve and caspase‐5, respectively. Scale bar: 20 μm. Co‐localized PIKfyve and caspase‐5 were quantified by ImageJ software (E) (n = 3 independent experiments, n = 18 fields analyzed).
-
FCaco‐2 cells were stimulated by OMVs (100 μg/ml) with or without apilimod (30 nM) for 24 h. Proteins of lysates extracted from Caco‐2 cells were subjected to immunoblots with the indicated antibodies.
-
G, HCo‐staining of PIKfyve and Rab5 in WT and SNX10 KO Caco‐2 cells treated with or without OMVs (100 μg/ml) for 24 h (G). Anti‐PIKfyve and anti‐Rab5 antibodies were used to detect endogenous PIKfyve and Rab5, respectively. Scale bar: 20 μm. Co‐localized PIKfyve and caspase‐5 were quantified by ImageJ software (H) (n = 3 independent experiments, n = 18 fields analyzed).
-
ILPS levels in the cytosolic and residual fractions of Caco‐2 cells stimulated by OMVs (100 μg/ml) with or without apilimod (30 nM) for the indicated time were detected by LAL assay (n = 6 independent experiments).
-
JCaco‐2 cells transfected with control siRNA or CASP5 siRNA were treated with OMVs (100 μg/ml) for the indicated time. LPS levels in the cytosolic and residual fractions of Caco‐2 cells were detected by LAL assay (n = 6 independent experiments).
-
KLPS levels in the cytosolic and residual fractions of Caco‐2 cells stimulated by OMVs (100 μg/ml) with or without bafetinib (1 μM) for the indicated time were detected by LAL assay (n = 6 independent experiments).
Data information: Data are means ± SD. One‐way ANOVA followed by Bonferroni post hoc test was used for statistical analyses. ***P < 0.001.
Source data are available online for this figure.
Targeting SNX10 protects against chronic and acute colitis through maintaining the intestinal barrier function in mice
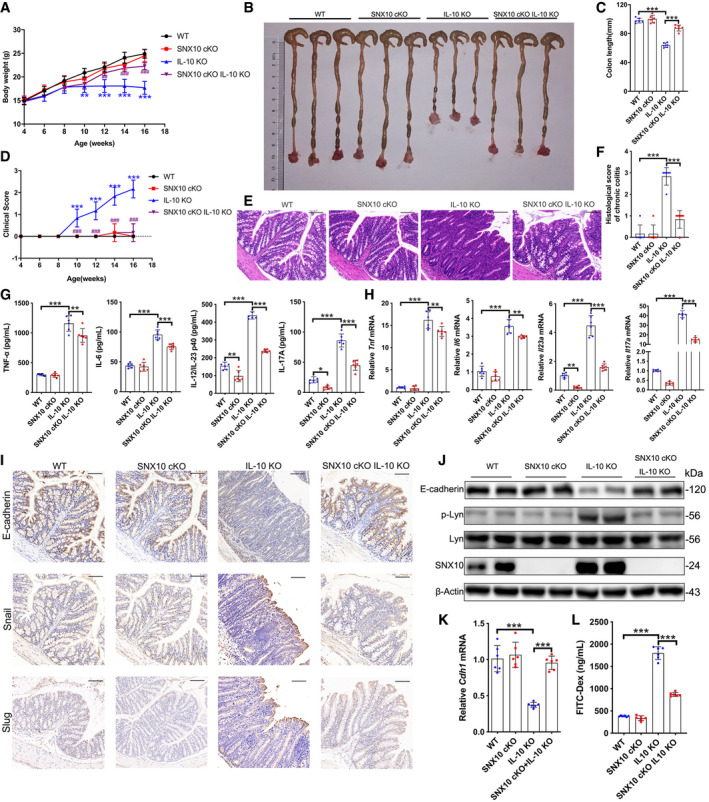
In order to understand the significance of SNX10‐mediated LPS release of OMVs in IBDs, the effects of SNX10 deficiency on IBDs were confirmed by SNX10 cKO IL‐10 KO mice (Fig EV3A–D). Compared with IL‐10 KO mice, SNX10 cKO IL‐10 KO mice exhibited higher body weight (Fig 7A), improved colon length (Fig 7B and C), and decreased clinical scores (Fig 7D). By H&E staining, inflammatory cell infiltration in the lamina propria, goblet cell loss, mucosal hyperplasia, crypt abscesses, and crypt ulcers were observed in colon tissues of IL‐10 KO mice at the age of 16 weeks (Fig 7E). While, in SNX10 cKO IL‐10 KO mice, those pathologic changes were observably improved (Fig 7E and F). The protein and mRNA levels of pro‐inflammatory factors in serum or colonic epithelium tissues were also reduced in SNX10 cKO IL‐10 KO mice (Fig 7G and H, Appendix Fig S7A). Immunohistochemistry showed the expression of E‐cadherin in colon epithelial tissues was reduced in IL‐10 KO mice, but reserved in SNX10 cKO IL‐10 KO mice (Fig 7I). This was confirmed by western blots and RT–qPCR (Fig 7J and K). Consistently, SNX10 cKO abolished the increase of Snail and Slug expression in colonic epithelium of IL‐10 KO mice, suppressed the phosphorylation levels of Lyn, and decreased the intestinal permeability (Fig 7I, J and L).
Figure EV3. The confirmation of SNX10 deficiency and IL‐10 deficiency in mice.
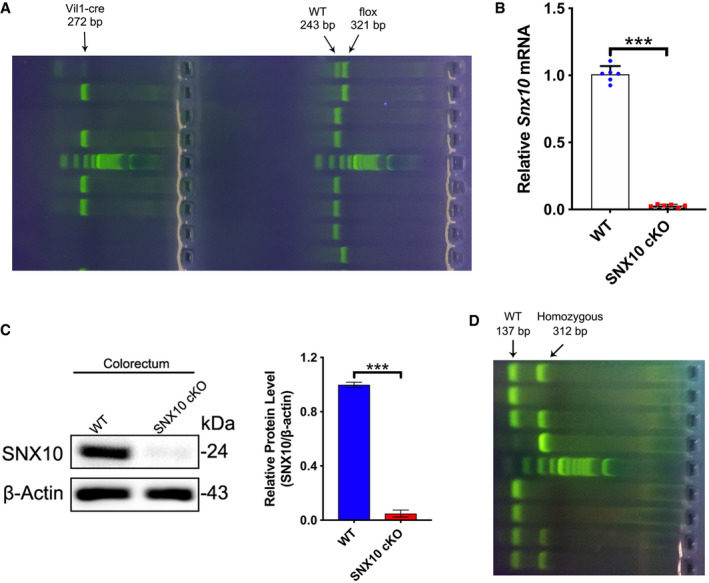
- Identification of SNX10 intestinal epithelium conditional knockout (SNX10 cKO) mice (Vil1‐cre + Snx10fl / fl ) and WT mice (Vil1‐cre − Snx10fl / fl ).
- The mRNA levels of Snx10 in intestinal epithelium of WT and SNX10 cKO mice were detected by RT–qPCR (n = 6 animals, each group).
- Protein expression of SNX10 in intestinal epithelium of WT and SNX10 cKO mice was determined by immunoblots and quantified by ImageJ software (n = 3 animals, each group).
- Identification of IL‐10 knockout (IL‐10 KO) mice (Il10 −/−) and WT mice (Il10 +/+).
Data information: Data are means ± SD. Two‐tailed unpaired t‐test between two groups was utilized for statistical analyses. ***P < 0.001.
Source data are available online for this figure.
Figure 7. SNX10 deficiency protects against IL‐10 deficiency‐induced chronic colitis and maintains the intestinal barrier function in mice.
-
ABody weight of mice was measured every 2 weeks from the 4th week to 16th week. Data are means ± SD. One‐way ANOVA followed by Bonferroni post hoc test was used for statistical analyses. **P < 0.01 and ***P < 0.001 versus WT group; ## P < 0.01 and ### P < 0.001 versus IL‐10 KO group.
-
B, CLength of colons from WT, SNX10 cKO, IL‐10 KO, and SNX10 cKO IL‐10 KO mice was measured (B) and analyzed (C) at the 16th week.
-
DClinical score was evaluated every 2 weeks from the 4th week to the 16th week. Data are means ± SD. One‐way ANOVA followed by Bonferroni post hoc test was used for statistical analyses. ***P < 0.001 versus WT group; ### P < 0.001 versus IL‐10 KO group.
-
E, FRepresentative H&E images of colon tissues of WT, SNX10 cKO, IL‐10 KO, and SNX10 cKO IL‐10 KO mice at the 16th week were shown (E) and analyzed (F). Scale bar: 100 μm.
-
GThe content of TNF‐α, IL‐6, IL‐12/IL‐23 p40, and IL‐17A in the serum of WT, SNX10 cKO, IL‐10 KO, and SNX10 cKO IL‐10 KO mice at the 16th week were measured by ELISA.
-
HThe relative mRNA levels of Tnf, Il6, Il23a, and Il17a in colon epithelial tissues of WT, SNX10 cKO, IL‐10 KO, and SNX10 cKO IL‐10 KO mice at the 16th week were measured.
-
IRepresentative immunohistochemistry images of E‐cadherin, Snail and Slug in colon tissues from WT, SNX10 cKO, IL‐10 KO, and SNX10 cKO IL‐10 KO mice at the 16th week were shown. Scale bar: 100 μm.
-
JProtein expression of E‐cadherin, p‐Lyn, and Lyn in colon epithelial tissues was determined by immunoblots.
-
KThe relative mRNA levels of Cdh1 (encoding E‐cadherin) in colon epithelial tissues were measured.
-
LThe gut permeability in vivo was evaluated using FITC‐dextran.
Data information: In (C and F–L), data are means ± SD. One‐way ANOVA followed by Bonferroni post hoc test was used for statistical analyses. *P < 0.05; **P < 0.01; ***P < 0.001.
Source data are available online for this figure.
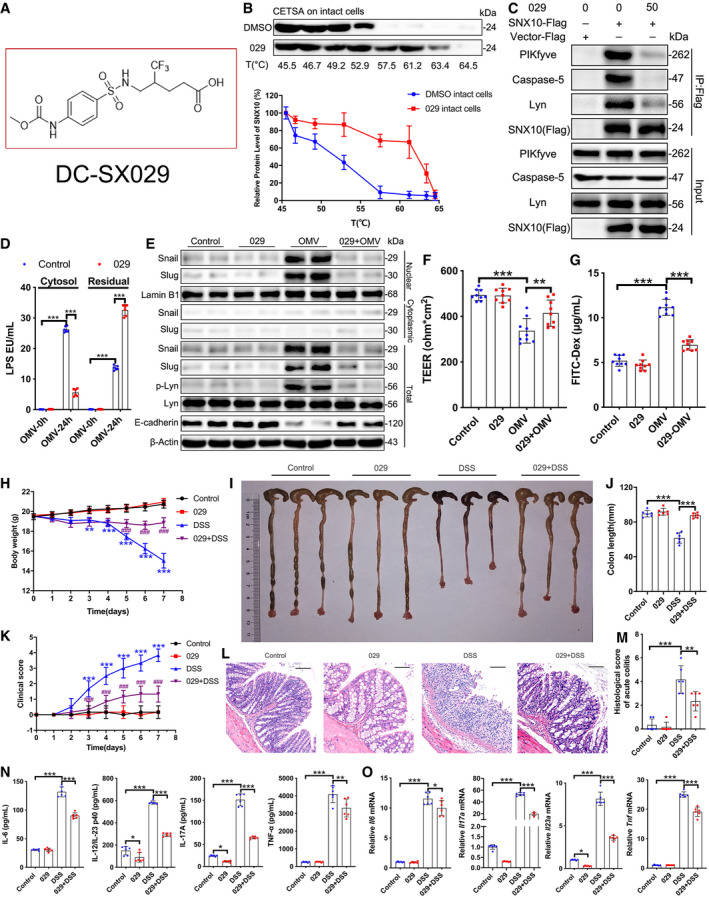
As described in our latest publication (Bao et al, 2021), we identified a novel small molecule DC‐SX029 as a potential SNX10 inhibitor. Here, we use DC‐SX029 to confirm the effects of SNX10 KO on intestinal epithelial barrier function as well as the mechanisms. The structure of DC‐SX029 is shown in Fig EV4A. Cellular thermal shift assay (CETSA) showed the stabilization of SNX10 protein clearly increased at temperatures ranging from 46.7 to 63.4°C (intact cells) by DC‐SX029 (Fig EV4B). Pulled down assay revealed interaction of SNX10‐Flag with PIKfyve, caspase‐5, or Lyn was impaired by DC‐SX029 in Caco‐2 cells (Fig EV4C). These results demonstrate that DC‐SX029 is able to bind to the SNX10 protein and serves as a protein–protein interaction (PPI) inhibitor to block the function of SNX10.
Figure EV4. Small molecule compound DC‐SX029 targets SNX10 to block its protein–protein interaction and improves DSS‐induced mouse colitis.
-
AThe structure of DC‐SX029.
-
BCellular Thermal Shift Assay (CETSA) was conducted with intact Caco‐2 cells transfected SNX10‐Flag in the presence of 50 μM DC‐SX029. Representative immunoblots for the stabilization of SNX10 protein under 45.5–64.5°C were shown. The protein levels were quantified by Image J (n = 3 independent experiments).
-
CCaco‐2 cells transfected with SNX10‐Flag were treated with vehicle or 50 μM DC‐SX029. Cell lysates were subjected to pull‐down by anti‐FLAG M2 agarose beads, followed by immunoblots with the indicated antibodies.
-
DLPS levels in the cytosolic and residual fractions of Caco‐2 cells stimulated by OMVs (100 μg/ml) with or without DC‐SX029 (50 μM) for the indicated time were detected by LAL assay (n = 6 independent experiments).
-
ECytoplasmic and nuclear proteins were extracted from Caco‐2 cells and the indicated proteins were detected by immunoblots.
-
FTEER value of Caco‐2 cell monolayers was analyzed (n = 9 independent experiments).
-
GCaco‐2 cell monolayers on transwell membranes were stimulated by OMVs (100 μg/ml) with or without DC‐SX029 (50 μM) for 24 h. FITC‐dextran was added to these cells (top of the membrane). After 2 h, FITC‐dextran levels in the bottom chamber wells were measured (n = 9 independent experiments).
-
HBody weight of mice was measured daily (n = 6 animals, each group). One‐way ANOVA followed by Bonferroni post hoc test was used for statistical analyses. **P < 0.01 and ***P < 0.001 versus Control group; ### P < 0.001 versus DSS stimulation group.
-
I, JLength of colons from mice induced by DSS with or without DC‐SX029 (2 mg/kg/day) was measured (I) and analyzed (J) on day 7 (n = 6 animals, each group).
-
KClinical score was evaluated every day for 1 week (n = 6 animals, each group). One‐way ANOVA followed by Bonferroni post hoc test was used for statistical analyses. ***P < 0.001 versus Control group; ### P < 0.001 versus DSS stimulation group.
-
L, MRepresentative H&E images of colon tissues of mice induced by DSS with or without DC‐SX029 (2 mg/kg/day) on day 7 were shown (L) and histological changes were analyzed (M) (n = 6 animals, each group). Scale bar: 100 μm.
-
NThe content of TNF‐α, IL‐6, IL‐12/IL‐23 p40, and IL‐17A in the serum of mice was measured by ELISA (n = 6 animals, each group).
-
OThe relative mRNA levels of Tnf, Il6, Il23a, and Il17a in colon epithelial tissues of mice were measured (n = 6 animals, each group).
Data information: Data are means ± SD. One‐way ANOVA followed by Bonferroni post hoc test was used for statistical analyses. *P < 0.05; **P < 0.01; ***P < 0.001.
Source data are available online for this figure.
Next, we investigated whether DC‐SX029 could effectively reproduce the effects of SNX10 deficiency. In Caco‐2 cells, DC‐SX029 (50 μM) reduced LPS release from OMVs into the cytosol (Fig EV4D) and inhibited OMV‐induced Lyn phosphorylation, Snail/Slug nuclear localization, and E‐cadherin reduction (Fig EV4E). Furthermore, DC‐SX029 (50 μM) dramatically prevented the OMV‐induced decline in TEER (Fig EV4F) and markedly restrained OMV‐induced leakage of FITC‐dextran into the bottom chambers (Fig EV4G). These results reveal a similar effect of DC‐SX029 as SNX10 deletion on maintaining intestinal epithelial barrier function.
To further explore the role of SNX10 in IBDs, we adopted DSS‐induced acute colitis mouse model to evaluate the in vivo activity of DC‐SX029. Oral administration of 2 mg/kg/day of DC‐SX029 moderated weight loss effectively from 5 to 7 days after DSS treatment (Fig EV4H). The colon length of DSS group was markedly shortened at the 7th day, while it was visibly reserved by DC‐SX029 treatment (Fig EV4I and J). The clinical scores were representatively raised from 3 to 7 days in DSS group but notably suppressed by DC‐SX029 administration (Fig EV4K). Histological examination revealed a significant relief by DC‐SX029 on inflammatory cell infiltration, crypt loss, and serious epithelial disruption in the colon tissues (Fig EV4L and M). The increased protein and mRNA levels of pro‐inflammatory factors induced by DSS in serum or colonic epithelium tissues were also reduced by DC‐SX029 treatment (Fig EV4N and O, Appendix Fig S7B). Consistent with the results of cell experiments, immunohistochemistry showed that the expression of E‐cadherin in colon epithelial tissues was reduced in DSS group but largely reserved by DC‐SX029 administration (Fig EV5A). Consistently, DC‐SX029 abrogated the enhanced expression of Snail/Slug induced by DSS in colon epithelial tissues (Fig EV5A). DSS treatment induced the phosphorylation of Lyn and reduced the protein expression of E‐cadherin in the colorectal epithelium of mice (Fig EV5B). While, DC‐SX029 eliminated the effects of DSS administration (Fig EV5B). The results from RT–qPCR confirmed DSS treatment markedly reduced the mRNA levels of Cdh1 (encoding E‐cadherin; Fig EV5C). The intestinal permeability assay revealed that DSS dramatically increased the intestinal permeability of mice, which was notably inhibited by DC‐SX029 administration (Fig EV5D). These results indicate that targeting SNX10 alleviates chronic and acute colitis through maintaining the intestinal barrier function in mice.
Figure EV5. The SNX10 PPI inhibitor DC‐SX029 maintains the intestinal epithelial barrier function in DSS‐induced mouse colitis.
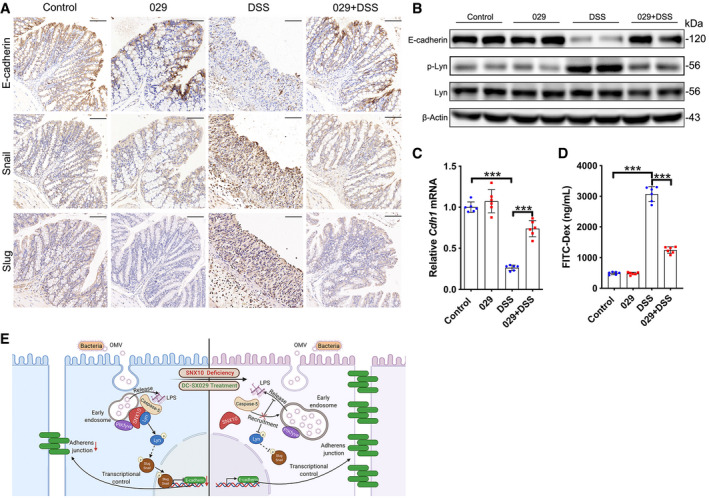
- Representative immunohistochemistry images of E‐cadherin, Snail and Slug in colon tissues on day 7 from mice induced by DSS with or without DC‐SX029 (2 mg/kg/day) were shown. Scale bar: 100 μm.
- Protein expression of E‐cadherin, p‐Lyn, and Lyn in colon epithelial tissues was determined by immunoblots.
- The relative mRNA levels of Cdh1 (encoding E‐cadherin) in colon epithelial tissues were measured (n = 6 animals, each group).
- The intestinal permeability in vivo was evaluated using FITC‐Dextran (n = 6 animals, each group).
- Proposed mechanisms for SNX10 in integrating liberation and sensing of cytoplasmic LPS to control PIKfyve‐caspase‐5‐Lyn‐Snail/Slug‐E‐cadherin signaling activation cascade.
Data information: Data are means ± SD. One‐way ANOVA followed by Bonferroni post hoc test was used for statistical analyses. ***P < 0.001.
Source data are available online for this figure.
Discussion
Although the etiology of IBDs remains largely unknown, accumulating evidence indicates that the imbalance between resident microbes in the gut and the host immune response at the mucosal barrier is the essential factor for intestinal inflammation in IBDs (Plichta et al, 2019). Given that the intestinal epithelium is hyporesponsive to luminal LPS which is constantly produced by Gram‐negative bacteria, it is not sufficient to only consider the impact of extracellular LPS‐mediated TLR4 signaling activation. The mechanisms underlying the interaction between intestinal luminal flora and intestinal mucosa need to be fully elucidated. OMVs are regarded as the significant secretion strategy and pathogenic factors for almost all Gram‐negative bacteria as part of their normal growth (Bielaszewska et al, 2013; Bonnington & Kuehn, 2014). OMVs can easily penetrate into intestinal epithelium and even transport to distant location within the host, inducing the activation of the cellular signaling response and contributing to the development of pathogenesis (Bielaszewska et al, 2013; Bonnington & Kuehn, 2014). LPS released from E. coli BL21‐derived OMVs was able to induce pyroptosis in various cells including BMDMs, bone marrow‐derived dendritic cells (BMDC), THP1 macrophages, and HeLa cells (Vanaja et al, 2016). We found that either SNX10 knockout or DC‐SX029 treatment increased the cell viability and inhibited the secretion of IL‐1β and IL‐18 in BMDMs (Appendix Fig S1A and B), indicating SNX10 may be involved in OMV‐induced pyroptosis signaling. Surprisingly, our data revealed OMVs derived from E. coli BL21 did not induce pyroptosis at the commonly used concentration in the intestinal epithelial cells including Caco‐2, HT‐29, and NCM460 cells. Instead, it caused a significant reduction of E‐cadherin followed by the increased intestinal barrier permeability in Caco‐2 and HT‐29 cells, supporting a critical impact of OMVs on intestinal epithelial barrier function.
Sensing of cytosolic LPS released from OMVs by caspase‐4 and caspase‐5 in humans and caspase‐11 in mice has emerged as a pivotal event during Gram‐negative bacterial infections (Vanaja et al, 2016; Wacker et al, 2017). After being internalized by the host cells through the clathrin‐dependent approach (Vanaja et al, 2016; Chen et al, 2018b), OMVs might liberate LPS from early endosomes into the host cell cytosol potentially through fusion with or transport across endosomal membranes (Bielaszewska et al, 2013; Vanaja et al, 2016; Chen et al, 2018b). It was reported that GBPs were involved in governing LPS access to the cytosol (Meunier et al, 2014; Pilla et al, 2014) and were essential for caspase‐11 (caspase‐4 in human) activation in response to OMVs (Finethy et al, 2017). Recent studies have demonstrated that the immunity‐related GTPase Irgm2 and the gamma‐aminobutyric acid (GABA)‐A‐receptor‐associated protein GabarapL2 inhibited caspase‐11 activation in response to OMVs (Eren et al, 2020; Finethy et al, 2020). Interestingly, mutations of the human IRGM gene are associated with increased risk for Crohn's Disease (Parkes et al, 2007; Weersma et al, 2009). The interferon‐inducible protein IRGB10 contributed to the activation of the LPS‐sensing caspase‐11 and NLRP3 inflammasome by Gram‐negative bacteria (Man et al, 2016), and we found that SNX10 deficiency had no effect on the expression of GBPs (such as GBP2 and GBP5) and IRGB10 at the transcriptional level preliminarily (Appendix Fig S6). In response to cytosolic LPS, caspase‐4 and caspase‐11 were activated and then cleaved GSDMD to release its NTD, which forms pores in the plasma membrane and induces cell pyroptosis. In monocytes, GSDMD pore formation resulted in NLRP3 inflammasome activation and the production of IL‐18 and IL‐1β (Rathinam et al, 2019). However, whether cytosolic LPS is also sensed by caspase‐4 or caspase‐5 in human intestinal epithelial cells is currently less investigated. In the present study, we found the recruitment of caspase‐5 by SNX10 to PIKfyve on the membranes of early endosomes was essential for the release of LPS into the cytosol. Unlike the known response (pyroptosis, NLRP3 inflammasome activation), the activation of caspase‐5 led to the phosphorylation of Lyn, which induced the nuclear localization of Snail/Slug, resulting in the downregulation of E‐cadherin and the disruption of intestinal epithelial barrier function.
Endosomes are characterized and distinguished by distinct proteins and lipids. PtdIns‐3‐P, is a dominant phosphoinositide on the organelle membranes of early endosomes (Mills et al, 1998, 1999). Synthesis of PtdIns‐3,5‐P2 from PtdIns‐3‐P by PIKfyve was involved in the endosome maturation (Huotari & Helenius, 2011). However, PIKfyve was also found abundant on early endosomes (Rutherford et al, 2006). A function or depletion of PIKfyve increased PtdIns‐3‐P which facilitated the fusion of homotypic early endosomes resulting in the blockage of cargo exit from early endosomes and enlarged early endosomes (Rutherford et al, 2006). Consistently, our data also showed PIKfyve activity was required for LPS release from early endosomes into the cytosol, suggesting a new function of PIKfyve in mediating the fusion of early endosomes with OMV. SNX10 was dominantly co‐located with the early endosome marker Rab5. The endosomal localization of SNX10 is determined by its PX domain which dominantly binds to PtdIns‐3‐P (Ellson et al, 2002). Our data showed an enhanced interaction between SNX10 and PIKfyve by OMV treatment, and SNX10 deficiency dramatically reduced the co‐localization of Rab5 and PIKfyve, suggesting a role of SNX10 in facilitating the early endosome location of PIKfyve. Considering the critical role of the interaction between SNX10 and caspase‐5, our results indicate the scaffolding function of SNX10 plays an essential role in LPS release and sensing on early endosomes.
The permeability of gut mucosa barrier is regulated by the apical junctional complex which is composed of tight junctions (TJs), adherens junctions (AJs), and desmosomes (Odenwald & Turner, 2017). AJs are the particularly classical and ample adhesion structures and have vital effects on maintaining tissue integrity and regulating cell viability. E‐cadherin, the transmembrane protein of AJs, is critical for epithelial cell barrier functions (Odenwald & Turner, 2017). In ulcerative colitis (UC) (Dubois & Van Heel, 2008; McGovern et al, 2010) and Crohn's disease (CD) (Barrett et al, 2008) patients, CDH1, which encodes E‐cadherin, has been confirmed as a susceptibility loci by genome‐wide association studies. In addition, variations of CDH1 have a tremendous possibility to involve in the disease status of IBDs (Elding et al, 2011). E‐cadherin was found to be prominently reduced in the ulcerated mucosa of colon tissues in patients with UC and CD (Jankowski et al, 1998; Karayiannakis et al, 1998). The downregulation of E‐cadherin–catenin complex could damage the integrity of gut barrier and expose the immune system of submucosa to the noxious external environment, causing the recurrence of diseases, especially CD (Wyatt et al, 1993). In the present study, we confirm that SNX10 deficiency or inhibition with the chemical PPI inhibitor DC‐SX029 could significantly block OMV‐induced reduction of E‐cadherin through PIKfyve‐caspase‐5‐Lyn‐Snail/Slug signaling pathway. Our in vivo data also support that restoring E‐cadherin expressions by targeting SNX10 could significantly improve the pathologic changes of IL‐10 deficiency‐induced chronic colitis and DSS‐induced acute colitis.
In summary, our study provides insights into how intracellular LPS is released and sensed in intestinal epithelial cells. Our work uncovers a contribution of scaffold protein SNX10 in providing a platform for the assembly and localization of molecules involved in LPS release, sensing, and signaling transduction (Fig EV5E). We also developed a novel small molecular compound DC‐SX029 that blocked SNX10 protein–protein interaction, which could not only maintain the intestinal barrier function but also inhibit intestinal inflammation. Targeting SNX10 provides a new potential therapeutic approach for restoring intestinal epithelial barrier function and may be a promising strategy for IBD treatment.
Materials and Methods
Mice
Snx10fl / fl mice background in C57BL/6 and Vil1‐cre mice (C57BL/6 background) were purchased from Shanghai Research Center for Model Organisms (Shanghai, China). The details on the production of the Snx10 floxed mice were shown in the Appendix Fig S5. Il10 −/− mice (C57BL/6 background) were purchased from the Jackson Laboratory (002251). Mice were kept with free access to sterilized food and water at 25 ± 1°C and maintained on a 12‐h light/dark cycle. Both male and female mice were used in this study. For IL‐10 deficiency‐induced spontaneous chronic colitis, under specific pathogen‐free (SPF) conditions, Vil1‐cre mice were mated with Snx10fl / fl mice to generate Vil1‐cre + Snx10fl / fl mice. Then Vil1‐cre + Snx10fl / fl mice were crossed with Il10 −/− mice to generate Vil1‐cre − Snx10fl / flIl10 +/+ (WT) mice, Vil1‐cre + Snx10fl / flIl10 +/+ (SNX10 cKO) mice, Vil1‐cre − Snx10fl / flIl10 −/− (IL‐10 KO) mice, and Vil1‐cre + Snx10fl / flIl10 −/− (SNX10 cKO IL‐10 KO) mice, and the condition of all mice was monitored from 4 to 16 weeks of age. For DSS‐induced acute colitis, under SPF conditions, normal C57BL/6 mice aged 8–10 weeks were administrated with or without 3% (wt/vol) DSS (MP Biomedicals) dissolved in drinking water for 7 days to induce colitis (Wirtz et al, 2007). All animal procedures were performed following the “Guide for the Care and Use of Laboratory Animals” published by the National Institutes of Health (NIH) and were approved by the ethics committee for experimental research, Shanghai Medical College, Fudan University.
Cell culture
The human colon epithelial cell line Caco‐2 (ATCC, HTB‐37) was cultured in DMEM (Gibco) supplemented with 20% FBS (ExCell Bio) and 1× penicillin–streptomycin solution (Gibco) under 5% (v/v) CO2 atmosphere at 37°C. The human colon epithelial cell line HT‐29 (ATCC, HTB‐38) was cultured in McCoy's 5A Medium (Gibco) supplemented with 10% FBS and 1× penicillin–streptomycin solution in an appropriate atmosphere (5% CO2, 95% air, 37°C). The Human colon epithelial cell line NCM460 was purchased from INCELL Corporation (San Antonio, TX) and cultured in McCoy's 5A Medium supplemented with 10% FBS at 37°C under 5% (v/v) CO2 atmosphere. BMDMs were isolated from both male and female C57BL/6 mice as described previously (You et al, 2020) and cultured in DMEM supplemented with 10% FBS containing 10 ng/ml M‐CSF (PeproTech) for 7 days under 5% (v/v) CO2 atmosphere at 37°C.
Purification and characterization of OMV
Purified OMVs were obtained from E. coli BL21 (Beyotime, D0337) using centrifugation based on the previous method (Vanaja et al, 2016) with modifications. Briefly, the E. coli BL21 was cultured in 200 ml of Luria Broth till OD600 of ˜0.5, and the supernatant without bacteria was collected by centrifugation at 5,000 g for 10 min at 4°C, followed by filtration with a 0.45‐μm filter (Millipore). OMVs were pelleted by ultracentrifugation at ˜284,100 g for 1.5 h at 4°C in a HITACHI P40ST rotor and then resuspended with 300 μl aseptic PBS. Agar plating was used for purified OMVs in order to confirm exclusion of bacterial contamination. LPS was quantified by Limulus Amebocyte Lysate (LAL) assay (Yeasen, 60402ES32) according to the manufacturer's instruction. BCA Protein Assay Kit (Thermo Scientific) was utilized to measure the protein concentration of OMV preparations on the basis of the manufacturer's instruction.
Immunoblots
Lysates were obtained from cells or colon epithelial tissues utilizing RIPA buffer (Beyotime). The protein content was measured by BCA Protein Assay Kit (Thermo Scientific) based on the manufacturer's instruction. Equal amounts of proteins were separated by 6–12% sodium dodecyl sulfate polyacrylamide gel electrophoresis (SDS–PAGE) and were then transferred on nitrocellulose membranes (Millipore). After blocking with 5% skim milk for 1 h, the membranes were incubated with the indicated primary antibodies at 4°C overnight. The main primary antibodies used are as follows: anti‐E‐cadherin (Abcam, ab76055, 1:1,000), anti‐Snail (Cell Signaling Technology, 3879, 1:1,000), anti‐Slug (Cell Signaling Technology, 9585, 1:1,000), anti‐Lamin B1 (Cell Signaling Technology, 13435, 1:1,000), anti‐SNX10 (Abcam, ab115890, 1:1,000), anti‐Flag (Cell Signaling Technology, 14793, 1:1,000; Cell Signaling Technology, 8146, 1:1,000), anti‐caspase‐4 (Abcam, ab25898, 1:1,000), anti‐caspase‐5 (Abcam, ab40887, 1:1,000), anti‐p‐Lyn (Abcam, ab40660, 1:1,000), anti‐Lyn (Abcam, ab32398, 1:1,000), anti‐β‐Actin (Cell Signaling Technology, 12262, 1:1,000), anti‐PIKfyve (Santa Cruz Biotechnology, sc‐100408, 1:500), anti‐claudin‐4 (Santa Cruz Biotechnology, sc‐376643, 1:500), anti‐occludin (Santa Cruz Biotechnology, sc‐271842, 1:500), anti‐ZO‐1 (Santa Cruz Biotechnology, sc‐33725, 1:500), and anti‐TLR4 (Santa Cruz Biotechnology, sc‐293072, 1:500). The following day, specific secondary antibodies conjugated with horseradish peroxidase were probed for 1 h at room temperature. The detection and visualization of the protein bands was completed with ECL kit (Yeasen) and ChemiDoc™ XRS system from Bio‐Rad (Shanghai, China). The band intensity was quantified with ImageJ software.
Real‐time PCR
Total RNA was isolated from cells and colon epithelial tissues using RNA isolater Total RNA Extraction Reagent (Vazyme) and reverse transcribed by Hifair® II 1st Strand cDNA Synthesis SuperMix for qPCR (Yeasen) in accordance with the manufacturer's instruction. qPCR was performed utilizing Hieff UNICON® qPCR SYBR Green Master Mix (Yeasen) in CFX96TM Real‐Time PCR Detection System (Bio‐Rad, Shanghai, China). The specific thermal cycling profile included initial denaturation at 95°C for 30 s, and 40 cycles at 95°C for 5 s and 60°C for 30 s. The specificity of all the primer pairs were verified by the analysis of melting curve and agarose gel electrophoresis. β‐actin was applied as the internal control. Each primer utilized for the research of RT–qPCR was synthesized by HuanGen Biotech (Shanghai, China). The sequences of primers employed in the study are stated in the Table EV1.
Confocal imaging
After stimulation with or without OMVs (100 μg/ml), cells on the coverslips (VWR) were washed with PBS and fixed by 4% paraformaldehyde for a quarter of an hour at 4°C. Next, cells were permeated with 0.1% saponin (Sigma‐Aldrich) diluted in PBS for 5 min and were then blocked using 10% goat serum (Gibco) for an hour. Cells were further treated with indicated primary antibodies at 4°C overnight. The main primary antibodies used for immunostaining are as follows: anti‐Flag (Cell Signaling Technology, 14793, 1:200; Cell Signaling Technology, 8146, 1:200), anti‐Lyn (R&D Systems, AF3206, 10 μg/ml), anti‐caspase‐5 (Novus Biologicals, NBP1‐77209, 2 μg/ml), and anti‐PIKfyve (Santa Cruz Biotechnology, sc‐100408, 1:50). The next day, cells were washed by PBS three times and were then treated with indicated Alexa Fluor‐labeled secondary antibodies (1:1,000, Invitrogen) diluted in PBS containing 10% goat serum at room temperature for 1 h. The coverslips were sealed by mounting media, and the images were captured at specific laser channels using confocal microscope (Zeiss, Germany). To identify which subcellular organelle the LPS was stuck in, the distribution of the cytoplasmic LPS versus organelle markers including early endosomes, late endosomes, and lysosomes was visualized by immunostaining with the antibodies against LPS (Abcam, ab35654, 1:200), Rab5 (Cell Signaling Technology, 3547, 1:200), Rab7 (Cell Signaling Technology, 9367, 1:200) and LAMP2A (Abcam, ab18528, 1:200).
In vitro permeability study
In 24‐well plates, the Caco‐2 cells or HT‐29 cells (2 × 10⁴ cells/cm2) were added in the upper chamber of polyethylene terephthalate hanging cell culture inserts (Millipore, MCHT24H48) with the pore size of 0.4 µm based on the method described previously (Kowapradit et al, 2010). Complete medium was added in both upper and lower chamber and the growth medium was replaced every second day till 14–21 days for Caco‐2 cells or 6–8 days for HT‐29 cells. After growing as monolayers, cells were treated with or without OMVs (100 μg/ml). Millicell‐ERS Volt‐Ohm Meter (Millipore) was utilized to detect the TEER. In addition, FITC‐Dextran (Sigma Aldrich, FD‐4) was used in the measurement of monolayer cell permeability. After the cell monolayers were washed with PBS for three times, 200 μl of FITC‐Dextran solution (1 mg/ml in Hank's Balanced Salt Solution [Gibco]) was added. After incubation for 2 h, FITC‐Dextran content in the lower chamber was detected by fluorescence with a microplate reader at a 480‐nm excitation wavelength and a 525‐nm emission wavelength.
Generation of SNX10 knockout stable cell lines
CRISPR/Cas9 technique was utilized to establish SNX10 stable knockout cell lines of Caco‐2 and HT‐29. Optimized Crispr Design tool (http://www.e‐crisp.org/E‐CRISP/) was applied to design small‐guide RNA (sgRNA) targeting human SNX10 gene. The sgRNA sequence was reported in our previous study as follows: GTGTCTGGGTTCGAGATCCT (Zhang et al, 2020). Lentivirus (Lenti‐CAS9‐sgRNA‐puro) encoding Cas9 nuclease and guide RNA targeting SNX10 or the vector for wild‐type control were developed. Caco‐2 and HT‐29 cells were then infected with Lentivirus‐CAS9‐sgRNA‐puromycin. After 72 h, SNX10 knockout stable cells were screened with 2.0 μg/ml of puromycin (Acros Organics).
Small interfering RNA (siRNA) and plasmid transfection
SiRNA, specifically targeting human caspase‐4 (CASP4 siRNA), human caspase‐5 (CASP5 siRNA), human PIKfyve (PIKFYVE siRNA), and a negative control (Control) were synthesized by RiboBio (Guangzhou, China). The sequences are as follows: CASP4_1 siRNA: AAGUGGCCUCUUCACAGUCAU; CASP4_2 siRNA: AAGAUUUCCUCACUGGUGUUU; CASP5_1 siRNA: AUAGAACGAGCAACCUUGACAA; CASP5_2 siRNA: CUACACUGUGGUUGACGAAAA; PIKFYVE siRNA: GGCACAAGCUAUAGCAAUU; non‐targeting siRNA: GGCUCUAGAAAAGCCUAUGC. Plasmids applied in the present study were stated in our previous study (Zhang et al, 2020). Plasmids generated for the research were verified by DNA sequencing. Lipofectamine RNAiMAX (Invitrogen) and Lipofectamine 3000 (Invitrogen) were utilized to transfect indicated siRNA and plasmids into cells according to the manufacturer's instruction, respectively.
SNX10 reintroduction assay
The negative control adenovirus vector (Ad‐vector) and the recombinant adenovirus vectors in the cause of SNX10 overexpression (Ad‐SNX10) were generated by Genechem (Shanghai, China). In the SNX10 reintroduction study, SNX10 knockout Caco‐2 cells were incubated with Ad‐vector or Ad‐SNX10 virus in the existence of 4 μg/ml of polybrene (Sigma‐Aldrich) up to 24 h.
Immunoprecipitation
For pull‐down experiment, cells were transfected with specific plasmids. Cell lysates were collected with lysis buffer (50 mM Tris‐HCl [pH 8.0], 150 mM sodium chloride, 0.1% lauryl sodium sulfate, protease inhibitors (Roche), and 1% NP‐40 (Amresco)) for half an hour at 4°C and then centrifuged for a quarter of an hour at 13,000 g. Cell lysates were then treated with 30 μl of anti‐FLAG M2 agarose beads (Sigma‐Aldrich) at 4°C for 6 h. Beads were then washed with lysis buffer three times and boiled for 5 min with 2× loading buffer (Beyotime). The samples were then analyzed by immunoblots. In an endogenous immunoprecipitation study, the protocol was implemented as mentioned above except that cell lysates were immunoprecipitated with indicated antibodies such as anti‐lgG (Cell Signaling Technology), anti‐caspase‐5 (Abcam), and anti‐PIKfyve (Santa Cruz Biotechnology) antibody.
Isolation of cytosol and residual fractions from Caco‐2 cells
Subcellular fractionation of Caco‐2 cells was completed through a digitonin‐dependent separation protocol as reported formerly with modifications (Vanaja et al, 2016). Briefly, 4 × 10⁶ Caco‐2 cells were stimulated with 100 μg/ml OMVs or left without treatment. After the indicated time of stimulation, sterile PBS was used to wash the cells three times on ice on a mechanical shaker for removing residual OMV. Next, cells were exposed to 0.005% digitonin (Sigma‐Aldrich) extraction buffer (300 μl) for 10 min and the supernatant containing cytosol was obtained. The residual fractions of Caco‐2 cells were obtained with 300 μl of 0.1% CHAPS buffer (Cell Signaling Technology). Cytosol and residual sections were exposed to agar plating for monitoring bacteria. The protein concentrations and LPS levels in the cytosol and residual fractions were measured by the BCA method and the LAL assay, respectively.
Cellular thermal shift assay
Cellular thermal shift assay was conducted according to the protocol as previously described (Jafari et al, 2014). Caco‐2 cells were transiently transfected with the SNX10‐Flag vector for 48 h. For intact cell assay, after treatment with 50 μM DC‐SX029 or DMSO for 1 h, Caco‐2 cells were collected and washed with PBS buffer several times to avoid excess compound residue. Each cell suspension was distributed into different 0.2‐ml PCR tubes (˜ 1 million cells per tube). Then samples were denatured at various temperatures for 3 min using a PCR instrument, and the cells were freeze‐thawed twice using liquid nitrogen. Samples were centrifuged and the supernatants were analyzed by immunoblots.
H&E staining and immunohistochemistry
The colon tissue from each mouse was fixed with 4% paraformaldehyde then embedded in paraffin. Colon slices (5 μm) were stained with hematoxylin and eosin. The H&E sections were scored blindly with a light microscope (Olympus, Tokyo, Japan) by an expert in pathology. The H&E slices of IL‐10 deficiency‐induced chronic colitis and DSS‐induced acute colitis were scored on the basis of the method described by Erben et al (2014). In the study of immunohistochemistry, the paraffin slices of colon tissues were deparaffinized in xylene and rehydrated with graded alcohols. Next, colon slices were boiled for 5 min in 10 mM citrate buffer (pH 6.0). After blocking endogenous peroxidase with 2% hydrogen peroxide, the slices were incubated with the indicated primary antibodies. Both immunohistochemistry and H&E staining experiments were conducted by Servicebio Inc. (Shanghai, China).
Enzyme‐linked immunosorbent assay
The content of tumor necrosis factor alpha (TNF‐α), interleukin‐6 (IL‐6), interleukin‐12/ interleukin‐23 p40 (IL‐12/IL‐23 p40), and interleukin‐17A (IL‐17A) in serum was detected by indicated ELISA kits (Dakewe) as per the manufacturer's instructions. The content of interleukin‐1 beta (IL‐1β) in cell supernatant was detected by indicated ELISA kits (Dakewe) as per the manufacturer's instructions.
In vivo intestinal permeability assay
The intestinal barrier integrity was assessed using FITC‐dextran (Sigma‐Aldrich, FD‐4) as previously described (Chen et al, 2018a). In brief, mice were starved for 4 h and then gavaged with FITC‐dextran (as per 600 mg/kg animal). Then animals were fasted for 4 h before euthanization. The content of FITC‐dextran in serum was measured according to the standard curve by fluorescence with microplate reader at a 480‐nm excitation wavelength and a 525‐nm emission wavelength.
Statistical analysis
Statistical analyses were conducted using GraphPad Prism software (version 9). Unless stated otherwise, numeric data expressed were representative of at least three repeated experiments and presented as mean ± SD. Two‐tailed unpaired t‐test between two groups, and one‐way ANOVA followed by Bonferroni post hoc test for multiple comparisons were utilized for statistical analyses. P < 0.05 was considered significant.
Author contributions
Conceptualization: XW, WS, HZ, and XS; methodology: XW, WS, and XS; investigation: XW, JN, YY, GF, SZ, WB, HH, HL, LL, YW, and MZ; visualization: XW, JN, and YY; writing: XW, YY, HZ, and XS; resources: WS, MZ, and XS; and funding acquisition: XS, YY, and WS.
Conflict of interest
The authors declare that they have no conflict of interest.
Supporting information
Appendix
Expanded View Figures PDF
Table EV1
Source Data for Expanded View/Appendix
Source Data for Figure 1
Source Data for Figure 2
Source Data for Figure 3
Source Data for Figure 4
Source Data for Figure 6
Source Data for Figure 7
Acknowledgements
This study was supported by the National Natural Science Foundation of China (No. 82130108, 81773744, 81973523, 81573441, and 81371923) and sponsored by Shanghai Pujiang Program (21PJ1401400). We also gratefully acknowledge financial support from “Personalized Medicines‐Molecular Signature‐based Drug Discovery and Development,” Strategic Priority Research Program of the Chinese Academy of Sciences (No. XDA12020368), the State Key Laboratory of Drug Research, Shanghai Institute of Materia Medica, Chinese Academy of Sciences (No. SIMM1903KF‐05), and Fudan‐SIMM Joint Research Fund (No. FU‐SIMM20183002).
The EMBO Journal (2021) 40: e108080.
See also: MS Dickinson & J Coers (December 2021)
Contributor Information
Hua Zhou, Email: hzhou@must.edu.mo.
Weixing Shen, Email: weixingshen@njucm.edu.cn.
Xiaoyan Shen, Email: shxiaoy@fudan.edu.cn.
Data availability
This study includes no data deposited in external repositories.
References
- Bao W, Liu X, You Y, Hou H, Wang XU, Zhang S, Li H, Feng G, Cao X, Jiang H et al (2021) Targeting sorting nexin 10 improves mouse colitis via inhibiting PIKfyve‐mediated TBK1/c‐Rel signaling activation. Pharmacol Res 169: 105679 [DOI] [PubMed] [Google Scholar]
- Barrett JC, Hansoul S, Nicolae DL, Cho JH, Duerr RH, Rioux JD, Brant SR, Silverberg MS, Taylor KD, Barmada MM et al (2008) Genome‐wide association defines more than 30 distinct susceptibility loci for Crohn's disease. Nat Genet 40: 955–962 [DOI] [PMC free article] [PubMed] [Google Scholar]
- Bielaszewska M, Rüter C, Kunsmann L, Greune L, Bauwens A, Zhang W, Kuczius T, Kim KS, Mellmann A, Schmidt MA et al (2013) Enterohemorrhagic Escherichia coli hemolysin employs outer membrane vesicles to target mitochondria and cause endothelial and epithelial apoptosis. PLoS Pathog 9: e1003797 [DOI] [PMC free article] [PubMed] [Google Scholar]
- Bonnington KE, Kuehn MJ (2014) Protein selection and export via outer membrane vesicles. Biochim Biophys Acta 1843: 1612–1619 [DOI] [PMC free article] [PubMed] [Google Scholar]
- Chen GX, Ran X, Li B, Li YH, He DW, Huang BX, Fu SP, Liu JX, Wang W (2018a) Sodium butyrate inhibits inflammation and maintains epithelium barrier integrity in a TNBS‐induced inflammatory bowel disease mice model. EBioMedicine 30: 317–325 [DOI] [PMC free article] [PubMed] [Google Scholar]
- Chen S, Yang D, Wen Y, Jiang Z, Zhang L, Jiang J, Chen Y, Hu T, Wang Q, Zhang Y et al (2018b) Dysregulated hemolysin liberates bacterial outer membrane vesicles for cytosolic lipopolysaccharide sensing. PLoS Pathog 14: e1007240 [DOI] [PMC free article] [PubMed] [Google Scholar]
- Dubois PC, Van Heel DA (2008) New susceptibility genes for ulcerative colitis. Nat Genet 40: 686–688 [DOI] [PubMed] [Google Scholar]
- Elding H, Lau W, Swallow DM, Maniatis N (2011) Dissecting the genetics of complex inheritance: linkage disequilibrium mapping provides insight into Crohn disease. Am J Hum Genet 89: 798–805 [DOI] [PMC free article] [PubMed] [Google Scholar]
- Ellson CD, Andrews S, Stephens LR, Hawkins PT (2002) The PX domain: a new phosphoinositide‐binding module. J Cell Sci 115: 1099–1105 [DOI] [PubMed] [Google Scholar]
- Erben U, Loddenkemper C, Doerfel K, Spieckermann S, Haller D, Heimesaat MM, Zeitz M, Siegmund B, Kühl AA (2014) A guide to histomorphological evaluation of intestinal inflammation in mouse models. Int J Clin Exp Pathol 7: 4557–4576 [PMC free article] [PubMed] [Google Scholar]
- Eren E, Planès R, Bagayoko S, Bordignon P‐J, Chaoui K, Hessel A, Santoni K, Pinilla M, Lagrange B, Burlet‐Schiltz O et al (2020) Irgm2 and Gate‐16 cooperatively dampen Gram‐negative bacteria‐induced caspase‐11 response. EMBO Rep 21: e50829 [DOI] [PMC free article] [PubMed] [Google Scholar]
- Finethy R, Luoma S, Orench‐Rivera N, Feeley EM, Haldar AK, Yamamoto M, Kanneganti TD, Kuehn MJ, Coers J (2017) Inflammasome activation by bacterial outer membrane vesicles requires guanylate binding proteins. MBio 8: e01188‐17 [DOI] [PMC free article] [PubMed] [Google Scholar]
- Finethy R, Dockterman J, Kutsch M, Orench‐Rivera N, Wallace GD, Piro AS, Luoma S, Haldar AK, Hwang S, Martinez J et al (2020) Dynamin‐related Irgm proteins modulate LPS‐induced caspase‐11 activation and septic shock. EMBO Rep 21: e50830 [DOI] [PMC free article] [PubMed] [Google Scholar]
- Graham WV, He W, Marchiando AM, Zha J, Singh G, Li H‐S, Biswas A, Ong MLDM, Jiang Z‐H, Choi W et al (2019) Intracellular MLCK1 diversion reverses barrier loss to restore mucosal homeostasis. Nat Med 25: 690–700 [DOI] [PMC free article] [PubMed] [Google Scholar]
- Huotari J, Helenius A (2011) Endosome maturation. EMBO J 30: 3481–3500 [DOI] [PMC free article] [PubMed] [Google Scholar]
- Jafari R, Almqvist H, Axelsson H, Ignatushchenko M, Lundback T, Nordlund P, Molina DM (2014) The cellular thermal shift assay for evaluating drug target interactions in cells. Nat Protoc 9: 2100–2122 [DOI] [PubMed] [Google Scholar]
- Jankowski JA, Bedford FK, Boulton RA, Cruickshank N, Hall C, Elder J, Allan R, Forbes A, Kim YS, Wright NA et al (1998) Alterations in classical cadherins associated with progression in ulcerative and Crohn's colitis. Lab Invest 78: 1155–1167 [PubMed] [Google Scholar]
- Karayiannakis AJ, Syrigos KN, Efstathiou J, Valizadeh A, Noda M, Playford RJ, Kmiot W, Pignatelli M (1998) Expression of catenins and E‐cadherin during epithelial restitution in inflammatory bowel disease. J Pathol 185: 413–418 [DOI] [PubMed] [Google Scholar]
- Knodler LA, Crowley SM, Sham HP, Yang H, Wrande M, Ma C, Ernst RK, Steele‐Mortimer O, Celli J, Vallance BA (2014) Noncanonical inflammasome activation of caspase‐4/caspase‐11 mediates epithelial defenses against enteric bacterial pathogens. Cell Host Microbe 16: 249–256 [DOI] [PMC free article] [PubMed] [Google Scholar]
- Kowapradit J, Opanasopit P, Ngawhirunpat T, Apirakaramwong A, Rojanarata T, Ruktanonchai U, Sajomsang W (2010) In vitro permeability enhancement in intestinal epithelial cells (Caco‐2) monolayer of water soluble quaternary ammonium chitosan derivatives. AAPS PharmSciTech 11: 497–508 [DOI] [PMC free article] [PubMed] [Google Scholar]
- Man SM, Karki R, Sasai M, Place DE, Kesavardhana S, Temirov J, Frase S, Zhu Q, Malireddi RKS, Kuriakose T et al (2016) IRGB10 liberates bacterial ligands for sensing by the AIM2 and Caspase‐11‐NLRP3 inflammasomes. Cell 167: 382–396.e317 [DOI] [PMC free article] [PubMed] [Google Scholar]
- Martin HM, Campbell BJ, Hart CA, Mpofu C, Nayar M, Singh R, Englyst H, Williams HF, Rhodes JM (2005) Enhanced Escherichia coli adherence and invasion in Crohn's disease and colon cancer. Gastroenterology 127: 80–93 [DOI] [PubMed] [Google Scholar]
- McGovern DPB, Gardet A, Törkvist L, Goyette P, Essers J, Taylor KD, Neale BM, Ong RTH, Lagacé C, Li C et al (2010) Genome‐wide association identifies multiple ulcerative colitis susceptibility loci. Nat Genet 42: 332–337 [DOI] [PMC free article] [PubMed] [Google Scholar]
- Meunier E, Dick MS, Dreier RF, Schürmann N, Broz DK, Warming S, Roose‐Girma M, Bumann D, Kayagaki N, Takeda K et al (2014) Caspase‐11 activation requires lysis of pathogen‐containing vacuoles by IFN‐induced GTPases. Nature 509: 366–370 [DOI] [PubMed] [Google Scholar]
- Mills IG, Jones AT, Clague MJ (1998) Involvement of the endosomal autoantigen EEA1 in homotypic fusion of early endosomes. Curr Biol 8: 881–884 [DOI] [PubMed] [Google Scholar]
- Mills IG, Jones AT, Clague MJ (1999) Regulation of endosome fusion. Mol Membr Biol 16: 73–79 [DOI] [PubMed] [Google Scholar]
- Odenwald MA, Turner JR (2017) The intestinal epithelial barrier: a therapeutic target? Nat Rev Gastroenterol Hepatol 14: 9–21 [DOI] [PMC free article] [PubMed] [Google Scholar]
- Parkes M, Barrett JC, Prescott NJ, Tremelling M, Anderson CA, Fisher SA, Roberts RG, Nimmo ER, Cummings FR, Soars D et al (2007) Sequence variants in the autophagy gene IRGM and multiple other replicating loci contribute to Crohn's disease susceptibility. Nat Genet 39: 830–832 [DOI] [PMC free article] [PubMed] [Google Scholar]
- Pilla DM, Hagar JA, Haldar AK, Mason AK, Degrandi D, Pfeffer K, Ernst RK, Yamamoto M, Miao EA, Coers J (2014) Guanylate binding proteins promote caspase‐11‐dependent pyroptosis in response to cytoplasmic LPS. Proc Natl Acad Sci USA 111: 6046–6051 [DOI] [PMC free article] [PubMed] [Google Scholar]
- Plichta DR, Graham DB, Subramanian S, Xavier RJ (2019) Therapeutic opportunities in inflammatory bowel disease: mechanistic dissection of host‐microbiome relationships. Cell 178: 1041–1056 [DOI] [PMC free article] [PubMed] [Google Scholar]
- Rathinam VAK, Zhao Y, Shao F (2019) Innate immunity to intracellular LPS. Nat Immunol 20: 527–533 [DOI] [PMC free article] [PubMed] [Google Scholar]
- Rutherford AC, Traer C, Wassmer T, Pattni K, Bujny MV, Carlton JG, Stenmark H, Cullen PJ (2006) The mammalian phosphatidylinositol 3‐phosphate 5‐kinase (PIKfyve) regulates endosome‐to‐TGN retrograde transport. J Cell Sci 119: 3944–3957 [DOI] [PMC free article] [PubMed] [Google Scholar]
- Seksik P, Rigottier‐Gois L, Gramet G, Sutren M, Pochart P, Marteau P, Jian R, Doré J (2003) Alterations of the dominant faecal bacterial groups in patients with Crohn's disease of the colon. Gut 52: 237–242 [DOI] [PMC free article] [PubMed] [Google Scholar]
- Thaper D, Vahid S, Nip KM, Moskalev I, Shan X, Frees S, Roberts ME, Ketola K, Harder KW, Gregory‐Evans C et al (2017) Targeting Lyn regulates Snail family shuttling and inhibits metastasis. Oncogene 36: 3964–3975 [DOI] [PubMed] [Google Scholar]
- Vanaja SK, Russo AJ, Behl B, Banerjee I, Yankova M, Deshmukh SD, Rathinam VAK (2016) Bacterial outer membrane vesicles mediate cytosolic localization of LPS and caspase‐11 activation. Cell 165: 1106–1119 [DOI] [PMC free article] [PubMed] [Google Scholar]
- Wacker MA, Teghanemt A, Weiss JP, Barker JH (2017) High‐affinity caspase‐4 binding to LPS presented as high molecular mass aggregates or in outer membrane vesicles. Innate Immun 23: 336–344 [DOI] [PMC free article] [PubMed] [Google Scholar]
- Weersma RK, Stokkers PCF, Cleynen I, Wolfkamp SCS, Henckaerts L, Schreiber S, Dijkstra G, Franke A, Nolte IM, Rutgeerts P et al (2009) Confirmation of multiple Crohn's disease susceptibility loci in a large Dutch‐Belgian cohort. Am J Gastroenterol 104: 630–638 [DOI] [PubMed] [Google Scholar]
- Wirtz S, Neufert C, Weigmann B, Neurath MF (2007) Chemically induced mouse models of intestinal inflammation. Nat Protoc 2: 541–546 [DOI] [PubMed] [Google Scholar]
- Wyatt J, Vogelsang H, Hübl W, Waldhöer T, Lochs H (1993) Intestinal permeability and the prediction of relapse in Crohn's disease. Lancet 341: 1437–1439 [DOI] [PubMed] [Google Scholar]
- You Y, Bao W‐L, Zhang S‐L, Li H‐D, Li H, Dang W‐Z, Zou S‐L, Cao X‐Y, Wang XU, Liu L‐X et al (2020) Sorting Nexin 10 mediates metabolic reprogramming of macrophages in atherosclerosis through the Lyn‐dependent TFEB signaling pathway. Circ Res 127: 534–549 [DOI] [PubMed] [Google Scholar]
- Zhang S, Yang Z, Bao W, Liu L, You Y, Wang XU, Shao L, Fu W, Kou X, Shen W et al (2020) SNX10 (sorting nexin 10) inhibits colorectal cancer initiation and progression by controlling autophagic degradation of SRC. Autophagy 16: 735–749 [DOI] [PMC free article] [PubMed] [Google Scholar]


