

Abstract
Current techniques for the detection of multi-pesticides are limited by technical complexity, sensitivity and cost. There is an urgent demand of developing new specific recognition elements and sensitive signal readouts for on-site monitoring. In this work, we developed a fluorescent aptamer-based lateral flow biosensor (apta-LFB) integrated with fluorophore-quencher nano-pairs and a smartphone spectrum reader to accomplish triple-target detection of chlorpyrifos, diazinon, and malathion. Aptamers serve as alternative recognition elements instead of antibodies in LFB, offering better specificity and stability. A novel fluorophore-quencher nano-pair (quantum dots nanobeads and gold nanostars) was implemented to perform “signal-on” instead of “signal-off”. After optimization, detection limit of chlorpyrifos, diazinon, and malathion were determined to be 0.73 ng/mL, 6.7 ng/mL, and 0.74 ng/mL, respectively. Greatly increased sensitivity may come from the combination of improved signal and zero background. This innovative cascade strategy allowed to lower the detection limit of pesticides residue level in food, which is largely considered satisfactory. The accuracy and practicality of this design for effective on-site quantification of multi-pesticides were further confirmed using 12 vegetable and fruit samples. The estimated recoveries were between 82.4% and 112.8% in spiked vegetable samples, which indicated that the developed method is capable for detecting multi-pesticides in food samples. This sensitive handheld-system is promising to become a powerful tool for practical on-site application of multi-pesticide quantification procedures.
Keywords: Pesticide, Smartphone, Fluorescence, Aptasensor, Spectrum reader
1. Introduction
The traditional, widespread use of multi-pesticides has raised serious concerns regarding their effects on both the natural environment and human health (Calvert et al., 2004; Pingali and Roger, 2012). The key guarantee for supervision is the continuous innovation and progress of deteciton technology. Current techniques for detection of multi-pesticides are various, such as gas chromatography (Chen et al., 2016; Hu et al., 2004; Zhang et al., 2017), capillary gas chromatography (Deleu and Copin, 2015), liquid chromatography (Filho et al., 2011), mass spectrometry (Deng et al., 2017), surface enhanced Raman scattering (Pang et al., 2014; Zhang et al., 2014a, 2014b). However, they are limited by technical complexity, sensitivity and cost (Zhang et al., 2014a, 2014b; Zhao et al., 2013). There is still an urgent demand for novel, on-site detection methods for multi-pesticide quantification in food-related industries and environmental concerns.
With advancements in on-site techniques, the lateral flow biosensor (LFB) is particularly attractive as a tool for pesticide analysis due to its low cost, sensitivity, specificity, user-friendliness, speed, simplicity, as well as ready deliverability to end-users (Cheng et al., 2017; Li et al., 2010; Parolo and Merkoçi, 2013). Existing LFBs are mainly capable of single-pesticide determinations through a specific antibody and a colorimetric reader (Chen and Wu, 2012; Kim et al., 2011; Liu et al., 2011; Ngom et al., 2010). However, the antibody is sensitive to temperature and physiological conditions, which makes long-term storage difficult (Chen and Yang, 2015). Moreover, the simple colorimetric readout lacks sensitivity, which makes it unsuitable for the trace analysis of pesticides in any complex sample environment (Sajid et al., 2015). Many researchers have explored novel recognition elements and sensitive signal readouts in effort to circumvent these limitations.
Aptamers, as promising alternative recognition elements for biosensors, are single-stranded oligonucleic acids with superior advantages over antibodies, which are not animal-derived, easier to artificially synthesize, smaller, purer, and offer better stability in terms of temperature and biological activity (Chen and Yang, 2015). Recent studies on aptamers for the detection of chlorpyrifos (Jiao et al., 2016, 2017), diazinon (Jokar et al., 2017), and malathion (Bala et al., 2016; Barahona et al., 2013) have been selected in vitro through systematic evolution of ligands by exponential enrichment (SELEX) from random-sequence nucleic acid libraries. The aptasensor is arguably an ideal choice for detecting these pesticides, however, there has been relatively little research on them to date (and especially little in terms of multiplex detection). There are two main approaches to improving the sensitivity of an apta-LFB strategy: strengthening the target signal or lowering the background signal (Lu et al., 2011). In the first case, fluorescent nanomaterials can function as enhanced signal elements due to their useful physical and chemical characteristics (Liu et al., 2014; Yang et al., 2014). In the second approach, designing a portable reader with a zero-background output is potentially very effective.
In this study, we used a fluorescent apta-LFB with improved specificity and stability combined with a smartphone spectrum reader with zero-background signal readout to develop a hand-held device for the on-site quantification of multi-pesticides. This design represents three main advantages: 1) we employed aptamers as recognition elements instead of antibodies, achieving simultaneous triple-analyte detection (chlorpyrifos, diazinon, and malathion); 2) we discovered a highly sensitive “turn-on” signal which works on the basis of a novel fluorescence-quenchable system (QDs-AuNSs); 3) we obtained a zero-background readout by using a 3D-printed smartphone-based reader that measures the full emission spectra of fluorescent apta-LFB, marking the first ever successful application on LFBs. Together, both of the proposed fluorescent apat-LFBs and smartphone spectrum reader may facilitate significant advancements in the on-site and sensitive detection of multi-pesticides.
2. Experimental section
2.1. Materials
Chloroauric acid tetrahydrate (HAuCl4·4H2O), trisodium citrate, sodium citrate dihydrate, Triton X-100, mycose, sodium dodecyl sulfonate (SDS), NaCl, Na3PO4·12H2O, Tween-20, sucrose, deoxyadenosine triphosphate (dATP), bovine serum albumin (BSA), phosphate buffered saline (PBS, pH 7.4, 0.01 M), sodium chloride-sodium citrate (SSC) buffer (20 concentrate, pH 7.0), borate buffer (BB, pH 9.0, 0.1 M), and the pesticides used in this study (chlopyrifos, malathion, diazinon, atrazine, carbaryl, acetamiprid, and 2,4-D.) were purchased from Sigma Chemical Company (St. Louis, MO, USA). Streptavidin was purchased from Invitrogen (Carlsbad, CA, USA). QDs nanobeads premodified by polystyrene maleic-anhydride copolymer were provided by Shanghai Kundao Biotech Co., Ltd. (Shanghai, China). Backing cards (HF000MC100), glass fiber sample pads (CFSP001700), conjugation pads (GFCP000800), nitrocellulose membranes (135s), and absorbent pads (CFSP001700) were purchased from Millipore (Bedford, MA, USA). Sequences of aptamers for chlorpyrifos (Jiao et al., 2017, 2016), aptamers for diazinon (Jokar et al., 2017), aptamers for malathion (Bala et al., 2016) and corresponding biotinylated complementary sequences (Table S1), were synthesized and purified by Sangon Biotech Co., Ltd. (Shanghai, China). Double distilled water (ddwater) was used in all experiments.
2.2. AuNSs-aptamer probe preparation
First, 0.3 mL of 0.1% HAuCl4 was added to 15 mL of 40 mM HEPES solution (pH 7.8) for a 40-min incubation period. After incubation, the mixture was centrifuged at 8000 rpm for 10 min and the supernatant was discarded. The product nanoparticles, AuNSs, were then stored at 4 °C prior to use. Next, 30 μL of 100 mM of dATP was added into 1 mL of the as-synthesized AuNSs solution. The mixture was incubated at room temperature for 20 min 15 μL of 1% of SDS was slowly added into the mixture and incubated on a shaker for 10 min 20 μL of 1 M NaCl was dropped into the mixture at a rate of 5 μL/10 min, then 0.5 OD of each thiolated aptamer was added, including chlorpyrifos-binding aptamer (CBA), diazinon-binding aptamer (DBA), and malathion-binding aptamer (MBA). The mixture was incubated for 3 h in water bath at 60 °C and centrifuged at 12,000 rpm for 15 min. Finally, the precipitated AuNSs-aptamer probes were washed with 1 mL of PBS and dispersed in 20 μL of storage buffer (containing 20 nM of Na3PO4·12H2O, 5% BSA, 0.25% Tween-20%, and 10% sucrose).
2.3. Preparation of T line-mixture
A T line-mixture consisting of QDs nanobeads-BSA conjugates and each streptavidin-biotinylated complementary sequences (BCS) was prepared. The QDs nanobeads-BSA conjugates were prepared by adding 25 μL of QDs nanobeads, 1 μL of EDC (1 mg/mL), and 1.5 μL NHS (1 mg/mL) into 100 μL of distilled water. The solution was incubated at room temperature in a dark chamber for 2 h. The resulting solution was centrifuged at 7000 rpm for 15 min and the supernatant was discarded. The resulting precipitate was suspended in 200 μL PBS (pH 7.4) and mixed with 100 μL of BSA (100 mg/mL), then the resulting solution was incubated at room temperature for 1 h and centrifuged at 7000 rpm for 15 min. The resulting precipitate was suspended in 250 μL PBS (pH 7.4) and stored in dark at 4 °C. The resulting solution was a 10-fold dilution of QDs nanobeads to QDs nanobeads-BSA conjugates. The streptavidin-BCS solution was prepared by adding 30 μL of 1 mg/mL of streptavidin solution to 30 μL of 100 μM BCS solution. The mixture was incubated at room temperature for 1 h and stored at 4 °C until later use. The T line-mixture was prepared by adding 6 μL of 10-fold dilution of QDs nanobeads-BSA conjugates in each 54 μL of streptavidin-BCS solution.
2.4. Fluorescent apta-LFB preparation
The fluorescent apta-LFB was consisted of a triangle-shape sample pad, three branch pads, three nitrocellulose membranes, three absorbent pads, and an interoperable backing (Scheme 1A). The sample pad was made from glass fiber and saturated with 1 ×PBS containing 1% BSA and 0.25% Tween-20, then dried overnight at room temperature. Three test lines were prepared by dispensing the corresponding T line-mixture at the same location on each nitrocellulose membrane with a BioDot Biojet BJQ 3000 dispenser (Irvine, CA). For prototyping and future commercial application, visual control line also can to be included on each nitrocellulose membrane. The nitrocellulose membranes were dried overnight at 37 °C and stored at 4 °C. The branch pads and absorbent pads were assembled on the backing with an overlap of approximately 1–2 mm. Single LFBs were cut at 4-mm widths using a BioDot Paper Cutter module CM4000 (Irvine, CA). Finally, three LFBs with different test lines (S or E) were assembled together on the triangle-shape sample pad. The assembled apta-LFB was either used immediately or stored under dry conditions at room temperature until further tests.
Scheme 1.

Apta-LFB design: (A) Positive sample; (B) Negative sample.
2.5. Assay procedure
In a typical test, 10 μL of AuNSs-aptamer probe and 10 μL of target solution were added to 80 μL of binding buffer (1 × PBS containing 0.1 M Nacl) and incubated at room temperature for 40 min. A fluorescence apta-LFB was preset in the minicartridge while 100 μL of the incubated sample was loaded to the triangular sample pad and migrated upward due to capillary force. Black lines became visible after 5 min. The minicartridge was inserted into the 3D-printed smartphone reader to record the fluorescence results. The colorful image of each channel was converted into the corresponding spectrum. This assembled device can obtain phone images which can be quantified via commercial software (ImageJ and Origin) with any appropriate data analysis strategy (Fig. S1) to further obtain zero-background signal outputs.
2.6. Preparation of spiked real samples
The process was summarized in Fig. S2 Step 1: 10 g of pesticide-free spinach were homogenized to a free-flowing puree in a blender, then 100 mL of spiking solution was added to the blender for another 2 min to ensure homogenization. Step 2: The homogenate was filtered through filter paper. These as-prepared samples can be directly tested according to the above procedures by proposed assay and gas chromatography.
3. Results and discussion
3.1. Principle
3.1.1. Fluorescent aptasensor
The principle of the proposed apta-LFB is illustrated in Scheme 1. For small molecule detection, a fluorophore-quencher system can provide a more sensitive “turn-on” signal for fluorescent biosensors than the conventional “turn-off” mode (Fu et al., 2013; Yao et al., 2016). Quantum dots (QDs) nanobeads were used as a powerful fluorophore in accordance with their high quantum yield and chemical stability (Uhl et al., 2017). Gold nanoparticles (AuNPs) are often used as nanoquenchers, and are generally successful but are limited by their maximum absorption wavelength (Fu et al., 2014; Liu et al., 2013). Starshaped gold nanoparticles, also called gold nanostars (AuNSs), have broader surface plasmon absorbance and may be more feasible as fluorophore-quenchers in combination with QDs (Wang et al., 2010). This was our approach to the proposed fluorophore-quencher system. Apta-LFB strategy implementation relies on three biotinylated complementary sequences (BCS-C, BCS-D, and BCS-M; Table SI), which we linked with streptavidin then mixed with QDs nanobeads-BSA conjugates and immobilized on a nitrocellulose membrane to form three specific test lines. In a typical assay, the positive sample (Scheme 1A) containing the desired amount of target pesticides and AuNSs-aptamer probes (CBA, DBA, and MBA; Table S1) was incubated to form complexes at room temperature. After incubation, this solution was applied onto the sample pad and driven by capillary forces to flow past the branch pad, which can regulate flow separately. When the resulting complexes reached the test lines, they were not captured by the corresponding BCS; the fluorescence of QDs nanobeads became visible on the lines. In the absence of target pesticides (Scheme 1B), AuNSs-aptamer probes were captured on the test lines by hybridization between the aptamer and corresponding immobilized BCS. The accumulation of AuNSs on the lines quenched the fluorescence. This approach allowed us to combine the merits of advanced aptamer technology and fluorescence-quenching LFBs in a rapid and portable apta-LFB for the detection of multi-pesticides.
3.1.2. Smartphone spectrum reader
Zero-background readout was implemented by fluoresence spectrum analysis, because precise target spectral segmentation can be obtained without any atmosphere and background noise (Gao et al., 2000). For fluoresence apta-LFB, the ability to measure the spectrum of fluorescent emission is especially useful, as the combined contributions of excitation and emission can be measured independently. 3D printing technology allows for hand-held, smartphone-based fluorescence spectrum readers (Eltzov et al., 2015) with remarkable potential for multi-pesticide scanning due to their low cost and portability. We created a portable fluoresence apta-LFB spectrometer attachment to the existing camera module of an iPhone 5, which was equipped with multiple components including an excitation laser source, power, sample cascade, and fluoresence imaging optics (external lens, longpass filter, and transmission diffraction grating) (Scheme 2A-B). The compactness of this spectrometer platform for imaging multiple apta-LFBs was achieved through a broad transmission diffraction grating (1200 lines/mm) with a 47° orientation.
Scheme 2.

Mobile phone fluorescence spectrum reader. (A) Anatomy of the mobile device. (B) Schematic side view showing inner structure. (C) Smartphone-based fluorescence detection principle. Excitation laser (405 nm) illuminates test zone containing the probe-target duplexes; a portion of the emission is gathered via a collecting lens oriented perpendicular to the laser and sent through a longpass filter, where it is further collimated before incidence upon a diffraction grating placed directly in front of the camera. (D Images of broadband light, red, green, and blue laser pointers over smartphone screen. (E) Calibration of pixel versus wavelength by three laser pointers.
One of the major obstacles to any portable fluoresence apta-LFB quantification system is the unpure fluorescent signal arising from the test zone, in combination with the noise background created by excitation light leakage and membrane substrates. To overcome the signal-to-noise ratio-related limitations, we ensured that our system is capable of measuring the full emission spectra and thus capable of differentiating a broad range of tags. A commercial laser diode (5 mW) was installed as the excitation source to illuminate the sample cascade with a incidence angle of 60°. This oblique illumination angle reduced the background noise and balanced the laser power illuminated on each parallel channel (Fig. S3). The direct reflexion excitation light combined with the scattered photons as well as with the autofluorescence of the nitrocellulose membranes, which were then mapped onto the cell phone's sensor array.
To further clear the background noise and minimize scattered excitation photons and autofluorescence, we used a longpass filter with a blocking wavelength of 500 nm that strongly attenuates shorter wavelengths (Scheme 2C). During imaging, the grating dispersed emitted light onto the smartphone's CMOS image sensor, enabling separation of the spectral components into an easily observable, multicolored band as shown in Scheme 2D. This novel design has two main advantages: firstly, that the oblique angle of excitation illumination and cost-effective longpass filter help to reduce the background noise originating in the reflexion excitation light and autofluorescence of nitrocellulose membranes. Secondly, the full emission spectra contain different amounts of spatial excitation light, background noise, autofluorescence and tags emitted along the spectral imaging, thus minimizing background noise variations.
Although we focused on blue-excited, red-emission fluorescence, which covers a wide range of intercalators and aptamer probes in this work, the multimode optical fibers could be easily adapted for the digital readout and quantification of various fluorescent assays. For wavelength calibration, three conventional lasers (405 nm, 532 nm, and 632.8 nm) enabled the assignment of wavelength values to pixel values along the spectral images (Scheme 2D, Fig. S4). There was a linear relationship between wavelength value and pixel index resulting in a single-pixel wavelength increment of 0.23 nm/pixel (Scheme 2E). The assembled device can obtain phone images which can be quantified via commercial software (ImageJ and Origin) with appropriate data analysis strategy (Fig. S1) to further obtain zero-background outputs.
3.2. Characterization
3.2.1. Construction
TEM was used to reveal the morphology and structure of the nanoparticles, which showed that the AuNSs were well-dispersed (Fig. 1B) resembling a clear night sky (Fig. 1A). The shapes of the as-synthesized AuNSs were four-pointed star, five-pointed star or six-pointed star, and the sizes were approximately 20–30 nm (Fig. 1C-F). This was probably caused by the high sensitivity of the synthesis conditions, which readily generated various sizes and morphologies of AuNSs during growth. The diameters of the QDs nanobeads were uniformly distributed at approximately 90 nm (Fig. 1G-I) in a compact QD-polymer structure tightly encapsulated in the polymer matrix. Their large size and polymer matrix allowed the QDs nanobeads to be easily immobilized on the lines.
Fig. 1.
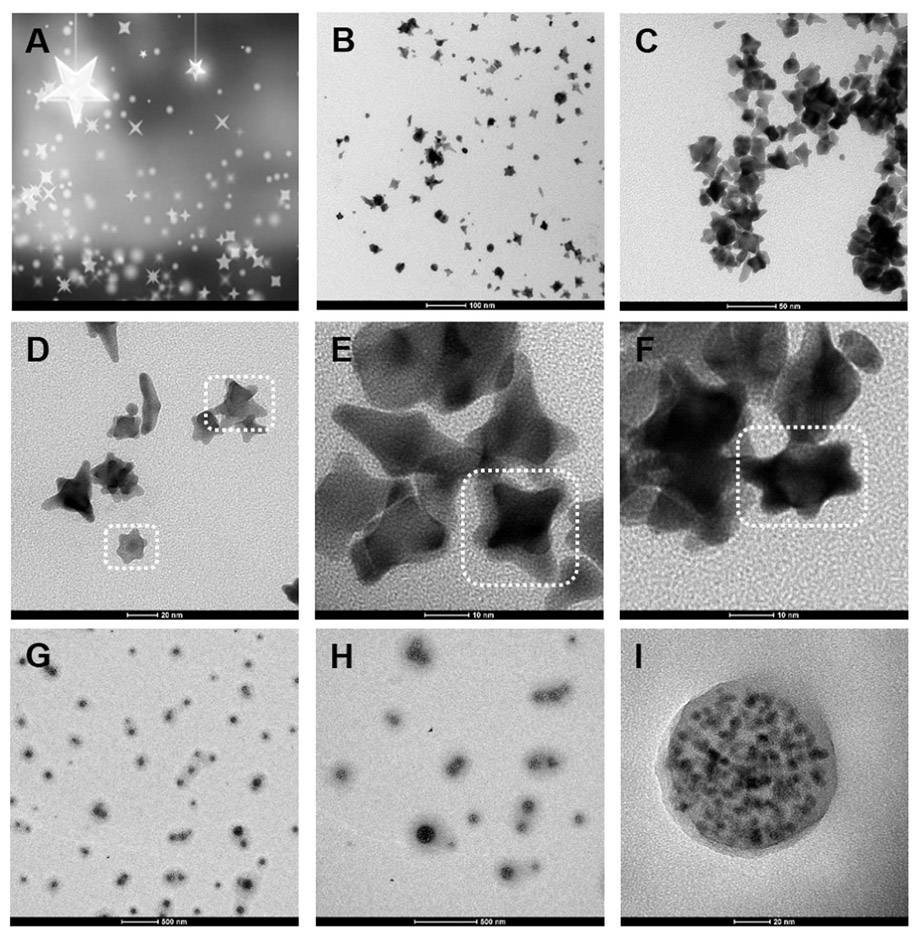
(A) “Clear night sky” image; (B-F) TEM image of AuNSs; (G-I) TEM image of QDs nanobeads.
3.2.2. Function
The fluorophore-quencher system is composed of two parts: the AuNSs which serve as an acceptor and QDs nanobeads as another donor. We used this AuNSs-QDs nano-pair for the first time in this study and were indeed able to exploit their matched fluorescence quenching-unquenching abilities in developing the “turn-on” fluorescence biosensor. We confirmed this by subjecting the as-synthesized AuNSs and commercial QDs nanobeads to UV/vis spectroscopy. The absorption spectrum of AuNSs and the emission spectrum of QDs nanobeads overlapped across a wide range (Fig. 2A). When the donor is in close proximity to a quencher with an absorption spectrum that overlaps the donor emission spectrum, the donor emission energy is transferred in a nonradiative way through long-range coupling via Förster resonance energy transfer (FRET).(Ghosh and Chattopadhyay, 2013) The mechanism of energy transfer from QDs nanobeads to AuNSs is illustrated in Fig. 2B.
Fig. 2.

(A) UV/vis spectroscopy of AuNSs (black), QDs nanobeads (red), and AuNSs-aptamer probes (blue). (B) Schematic illustration of energy transfer from QDs nanobeads to AuNSs. (C) Representative fluorescence decay curves of QDs nanobeads (1) and AuNSs quenched QDs nanobeads (2). (D) Zeta potential of AuNSs (1), AuNSs-aptamer probes (2), QDs nanobeads (3), and QDs nanobeads-BSA conjugates (4).
Our fluorescence lifetime measurements (Fig. 2C) indicated that fluorescence decay occurred from the QDs nanobeads to AuNSs-quenched QDs nanobeads, which also confirmed the reliability of the proposed fluorophore-quencher system. It is worth noting that the UV/vis spectroscopy of AuNSs-aptamer probes showed a slight shift of approximately 20 nm compared to bare AuNSs, which indicates the successful functionalization of aptamers (Fig. 2A). To further verify the successful conjugation of aptamers and antibodies, we also measured the zeta potential of the nanoparticles, both before and after modification. As shown in Fig. 2D, the zeta potential decreased after aptamer and antibody conjugations, which confirmed successful functionalization. In addition, electronic state and chemical characterization have been carried out by XPS techniques. In Fig. S5, the sample of AuNSs-aptamer probes showed high peaks at ~133 eV, ~398 eV and ~1071 eV, respectively. The peaks at ~133 eV and ~398 eV correspond to phosphorus (P2p) and nitrogen (N1s) from nucleotides. The peak at ~1071 eV sodium (Na1s) come from DNA (aptamers) being sodium salt. It's clear to confirm that the aptamers have been loaded on AuNSs successfully.
3.3. Optimization
A variety of AuNSs were synthesized under various synthesis times and pH values. The effects were investigated by UV–vis spectra. Under various synthesis times, the color of the reaction mixture changed slowly from light yellow (0 min) to light purple (10 min), blue (20 min) and, finally, dark blue (after 30 min). The growth of AuNSs from 10 to 40 min agrees well with the red shifting from 560 nm to 630 nm (Fig. S6A). The reaction was completed in approximately 40 min, because there were no subsequent changes in the spectra of AuNSs after that length of time. Similarly, the maximum absorption peaks were a red shift with the variation of pH from 7.0 to 7.8 (Fig. S6B). This phenomena indicated that the pH values have a great significant effect on AuNSs synthesis, and the AuNSs with the synthesis pH value of 7.8 were therefore used in subsequent studies, providing the greatest overlap with QDs nanobeads and the best-matched fluoropher-quencher abilities.
The dilution rate of QDs nanobeads-BSA conjugates affects the fluorescent apta-LFB response, which was optimized by dispensing QDs nanobeads-BSA conjugates with different dilution rates on test lines and observing the fluorescent-quenching phenomenon with the smartphone spectrum reader. At 1-fold and 10-fold dilution, the fluorescence of the QDs nanobeads were too strong to be quenched by the AuNSs (Fig. 3A and B). At 100-fold and 1000-fold dilution, however, the fluorescent of QDs nanobeads could be quenched completely, thus resulting in significant differences between the positive and the negative samples (Fig. 3A and B). Considering that the stronger signal is desired for any sensitive assay, 100-fold dilutions of QDs nanobeads-BSA conjugates were used in the subsequent study.
Fig. 3.

Impact factors of fluorescent apta-LFB system investigated by smartphone spectrum reader. (A) and (B) Effect of different dilution rate of QDs-BSA conjugates: 1-fold, 10-fold, 100-fold and 1000-fold; target concentration: 1 mg/mL; binding time: 60 min (C) and (D) Effect of various binding time between aptamers and targets: 10 min, 20 min, 30 min, 40 min and 50 min; target concentration: 1 μg/mL.
Additionally, as the binding process between aptamers and targets is time-dependent, the effect of various binding times for chlorpyrifos, diazinon and malathion were investigated. Measurement of the fluorescent spectrum confirmed, as expected, that the fluorescence intensity increased with the growth of the binding time and changed very little after 40 min, 20 min and 30 min for chlorpyrifos, diazinon and malathion, respectively (Fig. 3C and D). Therefore, the optimized binding time was therefore selected to the longest one, 40 min, for all subsequent experiments.
3.4. Sensitivity
We examined the performance of the proposed system in the presence of different concentrations of targets from 100 pg/mL to 100 μg/mL. A set of representative photographs captured by the smartphone spectrum reader is shown in Fig. 4A. There was an obvious and continuous increase in the intensity of the yellow and red zones as the amount of targets increased. For qualitative analysis, we observed the apparent yellow and red zones with as low as 10 ng/mL of the three targets. After plotting the fluorescence spectra versus concentration, there was a clear maximum near 610 nm (Fig. 4B). Taking chlorpyrifos as an example, the peak height of 100 μg/mL chlorpyrifos and 10 μg/mL chlorpyrifos were determined to be very close at 610 nm, which indicated that the detection capability saturated and it was impossible to detect higher concentrations. Similarly, the peak height of 100 pg/mL chlorpyrifos and negative control were determined to be very close at 610 nm, which indicated that the detection ability reached the limit and it was impossible to detect a lower concentration. With the assistance of standard curve (Fig. 4C), the limit of detection (LOD) of chlorpyrifos, diazinon, and malathion were determined to be 0.73 ng/mL, 6.7 ng/mL, and 0.74 ng/mL, respectively. We calculated the LODs as 3α/slope, where α represents the standard deviation of the negative control and slope is obtained from the linear calibration plot. It is important to note that the ability to test pesticides at ng/mL level is sufficient to detect them at residue level according to the commonly accepted standards of many organizations across the globe (Table S2).
Fig. 4.

Sensitivity of the apta-LFB system investigated via smartphone spectrum reader. (A) Photographs captured by smartphone spectrum reader with different target concentrations from 100 pg/mL to 100 μg/mL and negative control. Targets: chlorpyrifos (C), diazinon (D), and malathion (M). (B) Fluorescence curve of chlorpyrifos, diazinon, and malathion obtained by plotting fluorescence spectra versus concentration. (C) Standard curve of chlorpyrifos, diazinon, and malathion obtained by plotting target peak area versus log concentration (ng/mL).
In contrast to other recently published research into biosensors, the novel multi-quantification assay discussed here offers a similar or lower sensitivity to that of a single target detection assay (Table S3). We attribute the high sensitivity of the proposed assay to two signal improvement mechanisms: 1) the “turn-on” fluorescence signal generated by the fluorophore-quencher system and 2) the zero-background signal readout by the smartphone spectrum reader, which can effectively provide on-site multiplex detection. We also compared the performance of our smartphone-based fluorescence spectrum reader against that of a commercial table-top fluorence reader which works by reading each test line to report single fluorescence intensities. After calibration and normalization, we found strong correlation between the two readers; their trends were very well matched (Fig. S7). However, our system allowed us to detect similar amounts of targets with more channels, lower background, smaller volume, no additional power supply, and at a lower cost. In other words, the proposed system appears to be superior on many levels for actual on-site detection.
3.5. Specificity
We investigated interference with regards to the binding specificity in the presence of possible interfering pesticides such as atrazine, carbaryl, acetamiprid, and 2,4-D. These herbicides and insecticides are commonly employed within the global agricultural community. Fig. S8 clearly shows where the proposed assay responded to corresponding targets whereas the response of the biosensor for other pesticides was almost negligible. These results indicate that apta-LFB can effectively distinguish targets from other interfering pesticides, thus confirming the intrinsic binding selectivity and specificity of the proposed sensing platform.
3.6. Detection of real samples
Vegetables and fruits are highly regulated products owing to their high risk of pesticide residue. We performed the detection experiment in 13 vegetable and fruit samples, including maize, long bean, cauliflower, eggplant, oyster mushroom, shiitake mushroom, apple, orange, tomato, blueberry, spinach, lettuce, and cabbage. The results were summarized in Table 1. All the 13 food samples showed “not detected” results of chlorpyrifos, diazinon, and malathion by gas chromatography (NY/T 761–2008, agricultural industry standard of China) and our proposed method in this study. Furthermore, Furthermore, spinach, lettuce, and cabbage were selected as matrix for spiked-recovery assay. A range of different concentrations of spiked samples (100 ng/mL, 50 ng/mL, and 10 ng/mL) were prepared. The recovery rates were evaluated at between 83.4% and 110.7% for gas chromatography and between 82.4% and 112.8% for the proposed method in this study. The data revealed that no difference existed between the two assays, confirming the accuracy of the developed handheld-system and the feasibility in various matrix for detecting multi-pesticides. These results indicated that the aptasensor has notable potential for pralctical application.
Table 1.
Determination results of multi pesticides residue in real food samples and spiked food samples.
| Sample | Added (ng/mL) | Detected (ng/mL) by method A | Recovery Rate (%) of method A |
Detected (ng/mL) by method B | Recovery Rate (%) of method B |
||||||||||
|---|---|---|---|---|---|---|---|---|---|---|---|---|---|---|---|
|
|
|
|
|
|
|||||||||||
| C | D | M | C | D | M | C | D | M | C | D | M | C | D | M | |
| Maize | 0 | 0 | 0 | ND | ND | ND | / | / | / | ND | ND | ND | / | / | / |
| Long bean | 0 | 0 | 0 | ND | ND | ND | / | / | / | ND | ND | ND | / | / | / |
| Cauliflower | 0 | 0 | 0 | ND | ND | ND | / | / | / | ND | ND | ND | / | / | / |
| Eggplant | 0 | 0 | 0 | ND | ND | ND | / | / | / | ND | ND | ND | / | / | / |
| Oyster mushroom | 0 | 0 | 0 | ND | ND | ND | / | / | / | ND | ND | ND | / | / | / |
| Shiitake mushroom | 0 | 0 | 0 | ND | ND | ND | / | / | / | ND | ND | ND | / | / | / |
| Apple | 0 | 0 | 0 | ND | ND | ND | / | / | / | ND | ND | ND | / | / | / |
| Orange | 0 | 0 | 0 | ND | ND | ND | / | / | / | ND | ND | ND | / | / | / |
| Tomato | 0 | 0 | 0 | ND | ND | ND | / | / | / | ND | ND | ND | / | / | / |
| Blueberry | 0 | 0 | 0 | ND | ND | ND | / | / | / | ND | ND | ND | / | / | / |
| Spinach | 0 | 0 | 0 | ND | ND | ND | / | / | / | ND | ND | ND | / | / | / |
| Spinach | 10 | 50 | 100 | 9.55 | 54.35 | 108.00 | 95.5 | 108.7 | 108.0 | 8.37 | 48.33 | 84.62 | 83.7 | 96.7 | 84.6 |
| Spinach | 50 | 100 | 10 | 48.65 | 106.80 | 10.85 | 97.3 | 106.8 | 108.5 | 46.38 | 87.92 | 8.44 | 92.8 | 87.9 | 84.4 |
| Spinach | 100 | 10 | 50 | 102.70 | 8.61 | 52.95 | 102.7 | 86.1 | 105.9 | 87.92 | 8.72 | 47.78 | 87.9 | 87.2 | 95.6 |
| Lettuce | 0 | 0 | 0 | ND | ND | ND | / | / | / | ND | ND | ND | / | / | / |
| Lettuce | 10 | 50 | 100 | 9.60 | 46.3 | 87.20 | 96.0 | 92.6 | 87.2 | 8.82 | 47.12 | 106.89 | 88.2 | 94.2 | 106.9 |
| Lettuce | 50 | 100 | 10 | 49.70 | 102.9 | 11.07 | 99.4 | 102.9 | 110.7 | 41.20 | 88.35 | 8.67 | 82.4 | 88.4 | 86.7 |
| Lettuce | 100 | 10 | 50 | 97.50 | 9.27 | 54.30 | 97.5 | 92.7 | 108.6 | 106.54 | 8.60 | 52.17 | 106.5 | 86.0 | 104.3 |
| Cabbage | 0 | 0 | 0 | ND | ND | ND | / | / | / | ND | ND | ND | / | / | / |
| Cabbage | 10 | 50 | 100 | 10.05 | 44.75 | 104.30 | 100.5 | 89.5 | 104.3 | 9.30 | 42.19 | 92.79 | 93.0 | 84.4 | 92.8 |
| Cabbage | 50 | 100 | 10 | 46.40 | 91.40 | 10.81 | 92.8 | 91.4 | 108.1 | 46.63 | 108.48 | 8.39 | 93.3 | 108.5 | 83.9 |
| Cabbage | 100 | 10 | 50 | 83.40 | 10.20 | 51.00 | 83.4 | 102.0 | 102.0 | 88.34 | 9.12 | 51.39 | 88.3 | 91.2 | 112.8 |
A: Gas chromatography (NY/T 761–2008, agricultural industry standard of China).
B: The proposed method in this study.
C: Chlorpyrifos.
D: Diazinon.
M: Malathion.
ND: Not Detected.
4. Conclusion
In summary, a portable multiplexed platform integrating fluorescent apta-LFB with fluorophore-quencher nano-pairs (QDs-AuNSs) and a smartphone spectrum reader was developed for the rapid and on-site detection of pesticides including chlorpyrifos, diazinon, and malathion. The proposed detection strategy combines the advantages of DNA aptamers, LFB testing, 3D printing technology, and fluoresence spectrum analysis with a zero-background signal. QDs-AuNSs paired with “turn-on” fluorophore-quencher abilities were successfully matched. We used this system to fabricate a multiplexed apta-LFB for the quantitative detection of pesticides with high sensitivity and specificity. To make the platform applicable for on-site use, we developed a smartphone spectrum reader for analysis of the tested fluorescent apta-LFB, which makes the system highly portable and easily accessible. We used spiked spinach samples to test the proposed platform and ultimately confirmed its favorable recovery rates, practical reliability, and stability. The results presented here may represent a workable foundation for studying pesticide quantification in real food matrices. We believe this sample-to-answer system will become a powerful tool for practical on-site application of multi-pesticide quantification.
Supplementary Material
Acknowledgements
This work was supported by the Centers for Disease Control and Prevention/National Institute for Occupational Safety and Health (CDC/NIOSH) Grant No. R01OH011023-01A1 and China Scholarship Council (201606350119) to Nan Cheng.
Footnotes
Appendix A. Supporting information
Supplementary data associated with this article can be found in the online version at http://dx.doi.org/10.1016/j.bios.2018.06.002.
References
- Bala R, Kumar M, Bansal K, Sharma RK, Wangoo N, 2016. Biosens. Bioelectron 85, 445. [DOI] [PubMed] [Google Scholar]
- Barahona F, Bardliving CL, Phifer A, Bruno JG, Batt CA, 2013. Ind. Biotechnol 9 (1), 42–50. [Google Scholar]
- Calvert GM, Plate DK, Das R, Rosales R, Shafey O, Thomsen C, Male D, Beckman J, Arvizu E, Lackovic M, 2004. Am. J. Ind. Med 45 (1), 14–23. [DOI] [PubMed] [Google Scholar]
- Chen A, Yang S, 2015. Biosens. Bioelectron 71, 230–242. [DOI] [PubMed] [Google Scholar]
- Chen B, Wu FQ, Wu WD, Jin BH, Xie LQ, Feng W, Ouyang G, 2016. Microchem. J 126, 415–422. [Google Scholar]
- Chen C, Wu J, 2012. Sensors 12 (9), 11684–11696. [DOI] [PMC free article] [PubMed] [Google Scholar]
- Cheng N, Xu Y, Huang K, Chen Y, Yang Z, Luo Y, Xu W, 2017. Food Chem. 214, 169–175. [DOI] [PubMed] [Google Scholar]
- Deleu R, Copin A, 2015. J. Sep. Sci 7 (6), 338–339. [Google Scholar]
- Deng M, Yu T, Luo H, Zhu T, Huang X, Luo L, 2017. Int. J. Mass Spectrom [Google Scholar]
- Eltzov E, Guttel S, Low Yuen Kei A, Sinawang PD, Ionescu RE, Marks RS, 2015. Electroanal 27 (9), 2116–2130. [Google Scholar]
- Filho AM, dos Santos FN, Pereira PA, 2011. J. Sep. Sci 34 (21), 2960–2966. [DOI] [PubMed] [Google Scholar]
- Fu Q, Liang J, Lan C, Zhou K, Shi C, Tang Y, 2014. Sens. Actuator B: Chem 203, 683–689. [Google Scholar]
- Fu Q, Tang Y, Shi C, Zhang X, Xiang J, Liu X, 2013. Biosens. Bioelectron 49, 399–402. [DOI] [PubMed] [Google Scholar]
- Gao X, Huete AR, Ni W, Miura T, 2000. Remote Sens. Environ 74 (3), 609–620. [Google Scholar]
- Ghosh D, Chattopadhyay N, 2013. [Google Scholar]
- Hu X, Jianxin Y, Zhigang Y, Lansun N, Yanfei L, Peng W, Jing L, Xin H, Xiaogang C, Yibin Z, 2004. J. Aoac Int 87 (4) (-). [PubMed] [Google Scholar]
- Jiao Y, Hou W, Fu J, Guo Y, Sun X, Wang X, Zhao J, 2017. Sens. Actuator B: Chem 243, 1164–1170. [Google Scholar]
- Jiao Y, Jia H, Guo Y, Zhang H, Wang Z, Sun X, Zhao J, 2016. RSC Adv. 6 (63), 58541–58548. [Google Scholar]
- Jokar M, Safaralizadeh MH, Hadizadeh F, Rahmani F, Kalani MR, 2017. J. Biomol. Struct. Dyn 35 (2), 343–353. [DOI] [PubMed] [Google Scholar]
- Kim YA, Lee E-H, Kim K-O, Lee YT, Hammock BD, Lee H-S, 2011. Anal. Chim. Acta 693 (1), 106–113. [DOI] [PMC free article] [PubMed] [Google Scholar]
- Li Z, Wang Y, Wang J, Tang Z, Pounds JG, Lin Y, 2010. Anal. Chem 82 (16), 7008–7014. [DOI] [PubMed] [Google Scholar]
- Liu C, Jia Q, Yang C, Qiao R, Jing L, Wang L, Xu C, Gao M, 2011. Anal. Chem 83 (17), 6778–6784. [DOI] [PubMed] [Google Scholar]
- Liu D, Huang X, Wang Z, Jin A, Sun X, Zhu L, Wang F, Ma Y, Niu G, HightWalker AR, 2013. ACS Nano 7 (6). 5568. [DOI] [PMC free article] [PubMed] [Google Scholar]
- Liu M, Song J, Shuang S, Dong C, Brennan JD, Li Y, 2014. ACS Nano 8 (6), 5564–5573. [DOI] [PubMed] [Google Scholar]
- Lu L-M, Zhang X-B, Kong R-M, Yang B, Tan W, 2011. J. Am. Chem. Soc 133 (30), 11686–11691. [DOI] [PMC free article] [PubMed] [Google Scholar]
- Ngom B, Guo Y, Wang X, Bi D, 2010. Anal. Bioanal. Chem 397 (3), 1113–1135. [DOI] [PubMed] [Google Scholar]
- Pang S, Labuza TP, He L, 2014. Analyst 139 (8), 1895–1901. [DOI] [PubMed] [Google Scholar]
- Parolo C, Merkoçi A, 2013. Chem. Soc. Rev 42 (2), 450–457. [DOI] [PubMed] [Google Scholar]
- Pingali PL, Roger PA, 2012. Springer Science & Business Media. [Google Scholar]
- Sajid M, Kawde A-N, Daud M, 2015. J. Saudi Chem. Soc 19 (6), 689–705. [Google Scholar]
- Uhl B, Hirn S, Immler R, Mildner K, Möckl L, Sperandio M, Bräuchle C, Reichel CA, Zeuschner D, Krombach F, 2017. ACS Nano 11 (2), 1498–1508. [DOI] [PubMed] [Google Scholar]
- Wang Z, Zhang J, Ekman JM, Kenis PJ, Lu Y, 2010. Nano Lett. 10 (5), 1886–1891. [DOI] [PubMed] [Google Scholar]
- Yang X, Yu Y, Gao Z, 2014. ACS Nano 8 (5), 4902–4907. [DOI] [PubMed] [Google Scholar]
- Yao Y, Guo W, Zhang J, Wu Y, Fu W, Liu T, Wu X, Wang H, Gong X, Liang X.-j., 2016. ACS Appl. Mater. Inter 8 (35), 22963–22970. [DOI] [PubMed] [Google Scholar]
- Zhang S, Liu X, Qin J, Yang M, Zhao H, Wang Y, Guo W, Ma Z, Kong W, 2017. J. Chromatogr. B 1068–1069. 233. [DOI] [PubMed] [Google Scholar]
- Zhang Y, Wang Z, Wu L, Pei Y, Chen P, Cui Y, 2014a. Analyst 139 (20), 5148. [DOI] [PubMed] [Google Scholar]
- Zhang W, Asiri AM, Liu D, Du D, Lin Y, 2014b. TrAC Trend Anal. Chem 54, 1–10. [Google Scholar]
- Zhao Y, Zhang W, Lin Y, Du D, 2013. Nanoscale 5 (3), 1121–1126. [DOI] [PubMed] [Google Scholar]
Associated Data
This section collects any data citations, data availability statements, or supplementary materials included in this article.