Abstract
Manganese dioxide nanoflowers (MnO2 NFs) were synthesized and used as a dual readout probe to develop a novel immunochromatographic test strip (ITS) for detecting pesticide residues using chlorpyrifos as the model analyte. MnO2 NFs-labeled antibody for chlorpyrifos was employed as the signal tracer for conducting the ITS. After 10 min competitive immunoreaction, the tracer antibody was captured by the immobilized immunogen in the test strip, resulting in the captured MnO2 NFs on test line. The captured MnO2 NFs led to the appearance of brown color on the test line, which could be easily observed by the naked eye as a qualitative readout. Due to the very slight colorimetric difference of chlorpyrifos at trace concentrations, the semiquantitative readout by naked eyes could not meet the demand of quantitative analysis. MnO2 NFs showed a significant effect on the luminol–H2O2 chemiluminescent (CL) system, and the CL signal driven by MnO2 NFs were used to detect the trace concentration of chlorpyrifos quantitatively. 1,3-Diphenylisobenzofuran quenching studies and TMB-H2O2 coloration assays were conducted for studying the enhancing mechanism of MnO2 NFs, which was based on the oxidant activity to decompose H2O2 for forming reactive oxygen species. Under optimal conditions, the linear range of chlorpyrifos was 0.1–50 ng/mL with a low detection limit of 0.033 ng/mL (S/N = 3). The reliability of the dual-readout ITS was successfully demonstrated by the application on traditional Chinese medicine and environmental water samples. Due to the simultaneous rapid-qualitative and sensitive-quantitative detection, the dual-readout protocol provides a promising strategy for rapid screening and field assay on various areas such as environmental monitoring and food safety.
Graphical Abstract
Organophosphorus pesticides (OPs) have been utilized extensively in agriculture worldwide as broad spectrum insecticides.1,2 Humans can be exposed to OPs occupationally through pesticide application or nonoccupationally through spray drift or dietary exposures to food residues or contaminated water. OPs inhibit cholinesterases, including acetylcholinesterase and butyrylcholinesterase, by covalently binding to the active site of these enzymes causing toxicity.3-5 In extreme acute cases, cholinesterase inhibition is clinically observed as salivation, lacrimation, urination, and defecation. As such, sensitive methods for OP detection and quantification are needed to monitor for OPs in both occupational and nonoccupational settings.
A large number of analytical techniques have been developed for quantifying trace levels of OPs, including GC/MS, UPLC/MS, and MS/MS.6-9 However, these chromatographic and spectrometric techniques are not suitable for rapid screening of samples from the field due to costly instruments, complicated operation, long assay time and specially trained personnel. To overcome these disadvantages, novel single-readout-based enzymatic sensors have been established for rapid testing of OPs residues.10-13 For example, a colorimetric biosensor was developed for detecting paraoxon based on a blocking effect of thiocholine on enzymatic etching of gold nanorods in the presence of horseradish peroxidase (HRP).10 A novel electrochemical biosensor for malathion detection was developed by using direct electron transfer between HRP and peptide nanotubes-modified electrode.11 By using the organophosphate hydrolase enzyme combined with HRP, Sahin et al. proposed a new dual-enzyme electrochemical platform for dichlofenthion to detect an electroactive leaving group or to detect a change in pH simultaneously.12
Even though enzymes have been successfully utilized as a single-signal probe for OP detection, they suffer from poor stability and limited availability. As such, a variety of metal-based,14-18 carbon-based,19-23 and metal–carbon composite-based24-29 nanomaterials with high stability and low cost have been employed as an alternative detection mechanism. Furthermore, nanomaterials-based colorimetric immunochromatographic test strips (ITSs) have been widely used as potential devices for field screening. Nanomaterials such as graphene oxide,30 Fe3O4 nanoparticles,31 and carbon nanotubes32 have been reported for this purpose. Even though semiquantitative colorimetric ITSs especially by naked eyes showed great potential in rapid testing, its low sensitivity and accuracy restricted the practical application. Compared with single-signal-based strategy in the colorimetric ITSs, the dual-signal/dual-readout could increase accuracy and diversity. Compared with other optical techniques, chemiluminescence (CL) showed high signal-blank-ratio and increased sensitivity. Additionally, the CL reaction directly led to luminescence without the need of outer emission light source and sophisticated light filter.27,28 As an ideal response candidate, CL assays of high sensitivity could be combined with colorimetric protocols to develop a dual-response ITS for semiquantitation and sensitive-detection simultaneously. Therefore, developing nanomaterials performing high colorimetric response and enhanced CL response offers an opportunity for improving OP detection.
Herein, manganese dioxide nanoflowers (MnO2 NFs) were synthesized by a direct reduction of KMnO4 with poly-(dimethyl diallyl ammonium chloride) (PDDA). MnO2 NFs were labeled to an antibody for chlorpyrifos (an OP for a model analyte) as the dual-signal probe. Chlorpyrifos in sample solution competed with the coating antigen of chlorpyrifos immobilized on the test line of ITS to bind with the tracer antibody. By virtue of a dark brown color, MnO2 NFs were adopted as a novel colorimetric probe for the semiquantitative detection of OPs. Furthermore, based on the oxidant activity, MnO2 NFs functioned as a potent CL enhancer with a remarkably enhancing effect on the luminol–H2O2 CL reaction, which contributed to detect the trace concentration of chlorpyrifos quantitatively. Dual readouts including colorimetric signals and CL signals were used for higher sensitivity and improved accuracy in field assay and rapid testing. The present colorimetric/CL ITS protocol could simultaneously realize semiquantitation and sensitive-detection of OPs.
EXPERIMENTAL SECTION
Instruments.
CL signals were obtained with a MPI-A CL analyzer (Xi’an Remax Electronic Science and Technology Co., Ltd., China) equipped with a photomultiplier operated at −800 V. Transmission electron microscopy (TEM) was carried out using a Philips CM200UT transmission electron microscope. Ultrapure water (18.2 MΩ/cm) produced by a Milli-Q Integral system (Millipore) was used for preparing all aqueous solutions. Absorbance signals were recorded by a UV-2450 spectrometer. Raman spectrum was obtained using a Renishaw inVia spectrometer. X-ray photoelectron spectroscopy (XPS) measurements were performed with a Physical Electronics Quantera Scanning X-ray Microprobe.
Reagents and Materials.
TMB Liquid Substrate System, luminol, bovine serum albumin (BSA), KMnO4, K2PtCl4 (Pt, 44.99%), HAuCl4 (Au, 49.98%), Na2PdCl4 (Pd, 49.98%), ascorbic acid, PDDA, 1,3-diphenylisobenzofuran (DPBF), chlorpyrifos, parathion, methyl parathion, diazinon, malathion and fenitrothion were all purchased from Sigma-Aldrich (U.S.A.). Graphite, FeCl3, and K4[Fe(CN)6] were all provided by Alfa Aesar. Mouse monoclonal antibody for chlorpyrifos (antichlorpyrifos McAb) and chlorpyrifos–BSA bioconjugate were all obtained from Wuxi Determine Bio-Tech Co. Ltd. (China). Goat antimouse IgG was purchased from Abcam Inc. (USA). 40 nm gold nanoparticles were obtained from nanoComposix (U.S.A.). Nitrocellulose membrane, fiber sample pad, fiber conjugate pad and absorbent pad were purchased from Millipore Corp. (U.S.A.). Phosphate buffer saline (PBS, 0.10 M pH 7.4) containing 1.0% BSA and 0.05% Tween-20 was adopted as the blocking buffer for the pretreatment of the conjugate pad and absorbent pad. Polystyrene 96-well microplates were provided by Corning Incorporated (U.S.A.). Astragalus and Poria cocos were purchased from a local pharmacy in Chongqing (China) and water sample was collected from South Fork Palouse River outside of Washington State University. All other reagents of analytical grade were utilized as received without further treatment.
Preparation of MnO2 NFs.
PDDA (20%, 4.5 mL) was added to 20 mL of ultrapure water and heated to 120 °C. Afterward, 4.0 g of KMnO4 was added to the mixed solution while stirring for 60 min until the mixture turned dark brown. The resultant was centrifuged at 8000 rpm for 10 min and further washed twice with ethanol and three times with ultrapure water, respectively. Finally, a MnO2 NFs aqueous dispersion (2 mg/mL) was obtained for further use. Four nanomaterials including Pt–Au bimetallic nanoparticles (PtAu BNPs), Pt–Pd bimetallic nanoparticles (PtPd BNPs), Prussian blue nanorods (PB NRs), and graphene oxide (GO) were utilized for studying the mechanism of the effect of MnO2 NFs on the luminol–H2O2 CL system. Detailed preparation of the other four nanomaterials was illustrated in the Supporting Information.
Preparation of MnO2 NFs-Labeled Anti-Chlorpyrifos McAb.
MnO2 NFs and antichlorpyrifos McAb were conjugated using an electrostatic effect. In detail, the pH value of MnO2 NFs at 2 μg/mL was adjusted to 8.2 by adding the desired amount of 0.02 M K2CO3. Then 5 μL of 1 mg/mL antichlorpyrifos McAb was added rapidly to 1 mL of the adjusted MnO2 NFs. With a 60 min gentle stirring at room temperature (RT), 110 μL of 10% BSA was added to the mixture for another 30 min gentle stirring. Afterward, the mixed solution was centrifuged at 10000 rpm at 4 °C for 10 min and the brown precipitate was further washed twice with 2% BSA. Conjugated antibody-nanoflowers were dispersed in 100 μL of ultrapure water containing 2% BSA and 3% sucrose. Then the resultant MnO2 NFs-labeled antichlorpyrifos McAb was stored at 4 °C prior to use. The preparation of the gold nanoparticles-labeled antichlorpyrifos McAb was the same as that of the MnO2 NFs-labeled antichlorpyrifos McAb, except that MnO2 NFs were replaced by gold nanoparticles.
Fabrication of ITS.
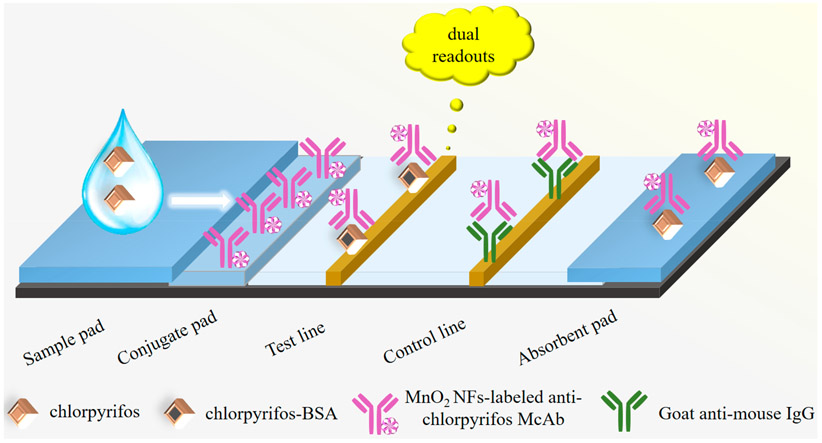
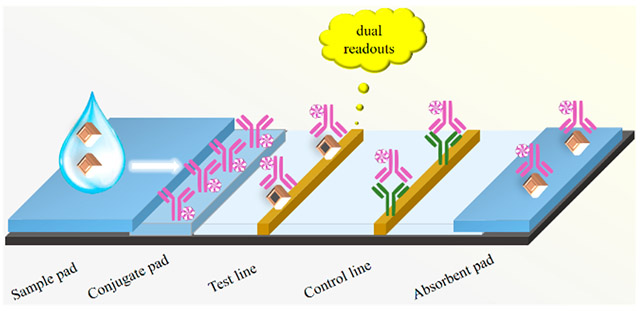
Figure 1 displays the proposed ITS (4 mm in width) including an absorbent pad, a nitrocellulose membrane, a conjugated pad and a sample pad. The desired amount of the blocking buffer was utilized for the pretreatment of both the conjugate pad and the sample pad, and then the pads were dried at RT. As the dual-readout probe, the MnO2 NFs-labeled antichlorpyrifos McAb was added onto the conjugated pad and dried at 37 °C. As the coating immunogen, 0.5 μL of 1.0 mg/mL chlorpyrifosμBSA bioconjugate was deposited around the bottom of the nitrocellulose membrane to form the test line. A total of 0.5 μL of 1.0 mg/mL goat antimouse IgG was deposited at the upper position of the nitrocellulose membrane to form the control line. It is about 5 mm distance between the test line and the control line. After 4 h of dying at RT, every part of ITS mentioned above was overlapped with its adjacent part for 1.5 mm when assembled. The fabrication of gold nanoparticles-based ITS was the same procedure as above, except that the gold nanoparticles-labeled antichlorpyrifos McAb was adopted as the tracer antibody instead of the MnO2 NFs-labeled antichlorpyrifos McAb.
Figure 1.
Schematic illustration of the dual-readout ITS based on the CL enhancement of MnO2 NFs.
Procedure of Dual-Readout Assay.
Sample solution (80 μL) containing chlorpyrifos was added onto the sample pad and then diffused through ITS driven by capillary force. With a complete immunoreaction, brown color appeared gradually in test line as a qualitative response observed by naked eyes. Afterward, the test line was cut and placed into a microplate well containing 50 μL of luminol solution as a CL emitter. Subsequently, the CL signal was collected as a quantitative readout after 50 μL of the freshly prepared H2O2 was injected into the well.
Pretreatment of Mock Samples.
For Astragalus and Poria cocos samples, 1.0 g of ground powder was mixed with desired amounts of chlorpyrifos (dissolved in methanol), followed by a 15 min incubation at RT. A total of 10 mL of 0.10 M PBS at pH 7.4 containing 0.05% Tween-20 and 10% methanol was adopted as an elution solution for extracting the spiked analyte. After a 3 min vortex stirring, the mixture containing chlorpyrifos was centrifuged at 10000 rpm for 10 min and the supernatant was diluted to the desired volume. For the water sample, it was filtered through a filter membrane with a pore size of 0.22 μm for further use.
RESULTS AND DISCUSSION
Characteristics of MnO2 NFs.
MnO2 NFs were easily synthesized via one–step strategy by KMnO4 reduction with PDDA. As displayed in Figure 2, MnO2 NFs with various occasional nanopetals could be observed with TEM, showing a typical three-dimensional morphology with the mean size of 40 nm. Moreover, the high surface area of the various nanopetals in MnO2 NFs significantly increased the amount of nanoscale-entrapped antibody in the labeling process. Figure S1 displayed the three-dimensional morphologies of PtAu BNPs, PtPd BNPs, PB NRs, and GO. The XPS spectrum (Figure S2A) of MnO2 NFs exhibited two peaks located at the binding energy of 640.8 and 652.6 eV, which were attributed to the Mn 2p3/2 and Mn 2p1/2 of MnO2, respectively. The energy separation of 11.8 eV is also in agreement with previous reports.33 As seen in Figure S2B, the Raman spectrum of the MnO2 NFs showed a peak at 648 cm−1, which was corresponding to the vibration of Mn─O bond.33
Figure 2.
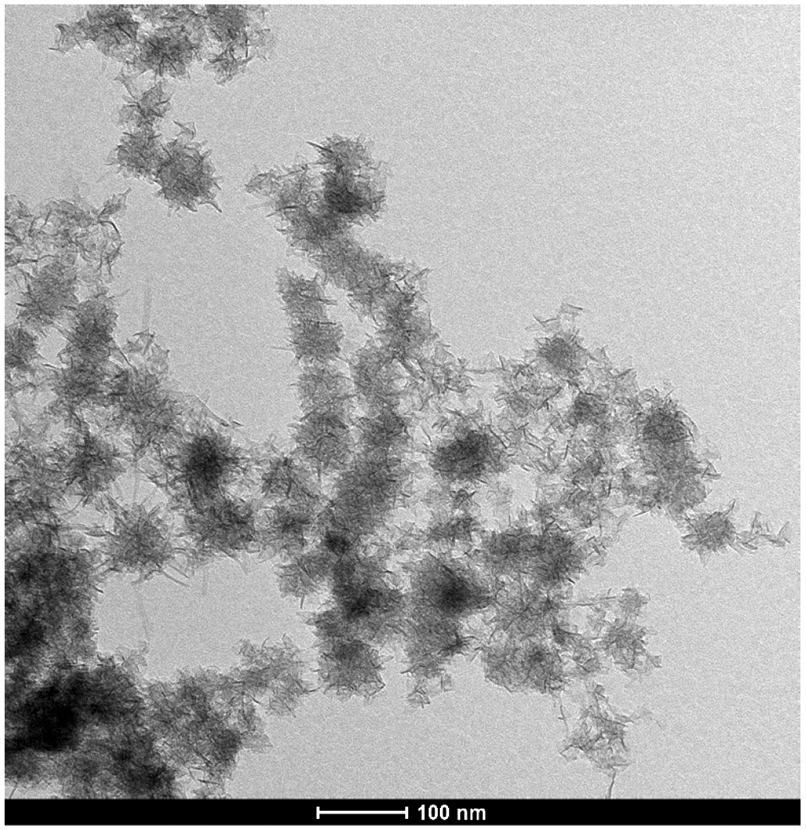
TEM image of MnO2 NFs.
Principle of CL Enhancement of MnO2 NFs on Luminol–H2O2 System.
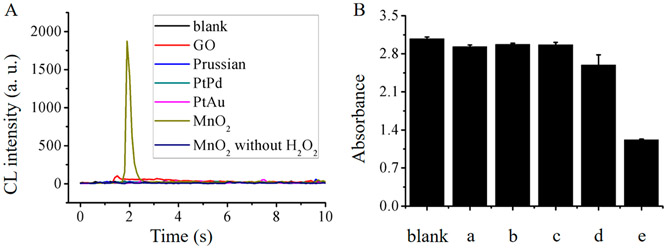
In this investigation, five peroxidase-like nanomaterials,34-38 including MnO2 NFs, PtAu BNPs, PtPd BNPs, PB NRs, and GO, were tested for their ability for enhancing CL intensity of the luminol–H2O2 system. As seen in Figure 3A, similar to ultrapure water (as blank), PtAu BNPs, PtPd BNPs, and PB NRs did not display observable enhancement of the CL emission. On the other hand, GO and MnO2 NFs demonstrated moderate (4.3× blank) and robust (78.1× blank) CL enhancement.
Figure 3.
(A) CL signals of luminol–H2O2 system by ultrapure water (as blank), MnO2 NFs, PtAu BNPs, PtPd BNPs, PB NRs, and GO, where the concentrations of luminol, H2O2 and nanomaterials were 5 × 10⁻⁷ M, 0.20 M, and 10 μg/mL, respectively, and the volumes of three substances for CL emission were all 20 μL. (B) Absorbance of DPBF at 450 nm after 3 min incubation with H2O2 and ultrapure water as a blank, (a) PtAu BNPs, (b) PtPd BNPs, (c) PB NRs, (d) GO, and (e) MnO2 NFs.
DPBF quenching studies were conducted to ensure CL enhancement of these nanomaterials (see in Supporting Information).39 In luminol–H2O2 CL system, reactive oxygen species was indispensable for triggering CL emission. As a reactive oxygen species trapping reagent, the absorbance of DPBF at 410 nm decreased with the increase of reactive oxygen species. Figure 3B displayed a 60.4% decrease in DPBF absorbance when the trapping reagent was mixed with MnO2 NFs and H2O2, indicating a good activity of MnO2 NFs in the oxidation of H2O2 to form reactive oxygen species. A decrease of 15.7% caused by GO also was in accordance with moderate CL enhancement on luminol–H2O2 system above. While a decrease of 4.8%, 3.4%, 3.6% caused by PtAu BNPs, PtPd BNPs, and PB NRs (Figure 3B), respectively, demonstrated the amount of reactive oxygen species was too low to driven CL reaction (Figure 3A).
For peroxidase-like activity of these nanomaterials except MnO2 NFs, results of the CL enhancement experiments were not in agreement with their good catalytic activity on TMB–H2O2 coloration in some reported works. As such TMB–H2O2 coloration tests were conducted to explore this discrepancy. As seen in Figure S3A, all these nanomaterials could catalyze H2O2-induced TMB oxidation within 3 min. However, plenty of flocculent precipitates existed in TMB solution catalyzed by MnO2 NFs within 5 min (Figure S3B). As expected, PtAu BNPs, PtPd BNPs, PB NRs, and GO functioned as peroxidase-like nanozymes and catalyzed the oxidation of H2O2 for TMB coloration. However, MnO2 NFs should be treated as a strong oxidant to oxidize TMB for developing coloration, and then the redox reaction resulted in instability of MnO2 NFs to form flocculent precipitates. Therefore, the other four peroxidase-like catalysts nanomaterials at 10 μg/mL could only produce reactive oxygen species at low concentration, which could not trigger high CL signals. However, MnO2 NFs at the same concentration functioned as an oxidant to decompose H2O2 and form plenty of reactive oxygen species for enhancing CL signal.
Principle of Dual-Readout ITS.
As shown in Figure 1, a sample solution containing chlorpyrifos was added onto the sample pad, which migrated through the strip driven by capillary force. During migration, the sample mixed with the tracer antibody in the conjugated pad first. As the mixture of chlorpyrifos and tracer antibody reached the test line, free chlorpyrifos in sample solution competed with the immobilized chlorpyrifos-BSA bioconjugate for binding with the MnO2 NFs-labeled antibody. Due to the captured MnO2 NFs on test line, a brown color appeared and was recorded by naked eyes as a colorimetric and semiquantitative response. After triggering the luminol-H2O2 CL system, a CL response enhanced by the MnO2 NFs was collected for the sensitive, quantitative measurement of chlorpyrifos.
Optimization of the Experimental Conditions.
Conditions were optimized for achieving good analytical performance of the ITS assay. The sensitivity of CL-based ITS depended on several experimental parameters, including pH, incubation time, volume of the tracer antibody and concentrations of CL coreactants. In general, pH was a key parameter for the emission efficiency of CL systems and the signal enhancement of MnO2 NFs. Figure S4 displays various CL responses resulting from different pH conditions in the MnO2 NFs–luminol–H2O2 CL system, implying signal enhancement of MnO2 NFs on the luminol–H2O2 CL reaction was optimal at pH 7.4. CL signals in different assay times were collected to investigate the optimal incubation time. As seen in Figure S5A, CL signal enhanced sharply with an increasing incubation time and almost achieved to the maximum value at 10 min, suggesting that the immunoreaction attained saturation at this incubation time. Longer incubation time resulted in increased CL signal, maybe due to increased nonspecific adsorption on the test line. Figure S5B shows CL signals when different volumes of the tracer antibody were employed in the ITS using chlorpyrifos at 5 ng/mL (as signal) and PBS buffer (as blank). When 5 μL was employed as the amount of tracer antibody, the signal-to-blank ratio reached the minimum value of 73.6%, demonstrating the competitive reaction between free chlorpyrifos and immobilized chlorpyrifos–BSA was strongest. After careful comparison, optimal concentrations of luminol and H2O2 were chosen to be 5.0 × 10⁻⁵ M and 0.20 M (data not shown), respectively.
Performance of Dual-Readout ITS.
Prior to sophisticated quantitative chromatographic and spectrometric techniques, it was appropriate to utilize facile single-response-based semiquantitative techniques in rapid testing and field assay. Semiquantitative colorimetric ITS assays were widely used in many areas in virtue of such merits as single step, easy operation, short detection time and high throughout. However, the reported single-response-based semiquantitative techniques often suffered from low sensitivity. Thus, a dual-readout ITS strategy was proposed to improve the sensitivity and reliability of the facile semiquantitative techniques.
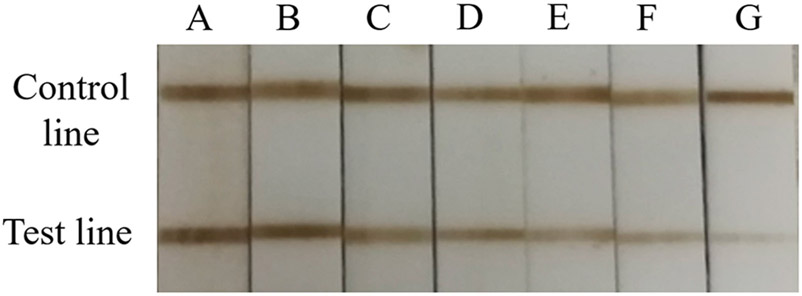
In detail, Figure 4 shows the decrease of brown color in test line with the increase of chlorpyrifos concentration at ng/mL level since a competitive format was adopted in the proposed dual-readout ITS. As a comparison, a gold-nanoparticles-based ITS was conducted for detecting chlorpyrifos qualitatively. As seen in Figure S6, a slight colorimetric difference of chlorpyrifos at 0.3 ng/mL could be observed by naked eyes as the semiquantitative readout. Compared with the gold nanoparticles-based ITS, a lower concentration of 0.1 ng/mL for semiquantitative detection could be realized in the proposed method (Figure 4). Thus, MnO2 NFs were prepared easily as a novel colorimetric probe instead of conventional gold nanoparticles for chlorpyrifos detection in the present ITS assay. Different with other colorimetric techniques requiring sophisticated instrumentation, the semiquantitative MnO2 NFs-based ITS assay with naked-eye monitoring showed a great potential in rapid screening and field test.
Figure 4.
Photograph of different brown colors in the proposed ITS assay for chlorpyrifos at (A) 0, (B) 0.1, (C) 0.5, (D) 1.0, (E) 10, (F) 25, and (G) 50 ng/mL.
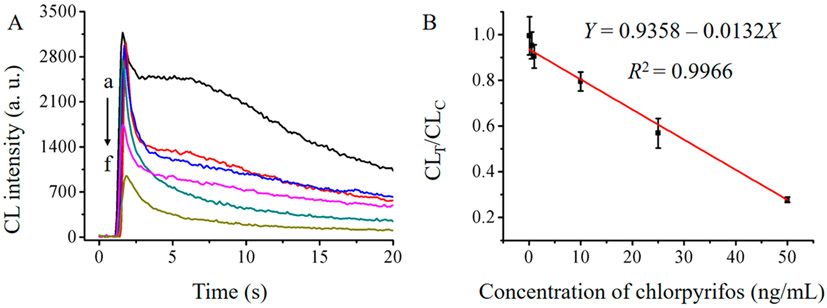
Furthermore, the MnO2 NFs-driven CL signal could be collected to detect the concentration of chlorpyrifos quantitatively for improved accuracy in the proposed dual-readout MnO2 NFs-based protocol. CL signal on the test line for detecting chlorpyrifos decreased linearly with the increasing concentration of the analyte as seen in Figure 5. However, as chlorpyrifos was detected on the ITS assay at different concentrations of 0.1, 0.5, 1.0, 10, 25, and 50 ng/mL, the RSD (relative standard deviation) value of CL signals on control line was lower than 3.5%, demonstrating the good stability of the control. The standard curve range for chlorpyrifos was 0.1–50 ng/mL with a detection limit of 0.033 ng/mL (S/N = 3), which was lower than that of many reported single-readout approaches, such as ELISA, electrochemical sensor, fluorescent assay, surface-enhanced Raman scattering spectroscopy, and LC-MS/MS (Table S1 in Supporting Information). The regression equation could be expressed as Y = 0.9358–0.0132X (R2 = 0.9966), where Y was the ratio of CL intensity on test line and CL intensity on control line (CLT/CLC) and X was the chlorpyrifos concentration. RSD assays were performed for estimating the stability for chlorpyrifos detection at low (0.5 ng/mL), medium (1.0 ng/mL) and high (10 ng/mL) concentration. The RSD values were 6.1%, 5.6% and 5.2%, respectively, suggesting satisfactory reproducibility of the ITS assay.
Figure 5.
CL signals of the proposed ITS for chlorpyrifos at (a) 0.1, (b) 0.5, (c) 1.0, (d) 10, (e) 25, and (f) 50 ng/mL. (B) The standard curve of the proposed ITS assay for chlorpyrifos detection. All the tests were performed under the optimal conditions (n = 3).
Estimation of Specificity.
Parathion, methyl parathion, diazinon, malathion and fenitrothion were utilized as interferents for examining the specificity of the ITS protocol. The specificity test was conducted by using all pesticides at 25 ng/mL. Figure S7 shows the CL signals of both chlorpyrifos and five interfering chemicals. The degree of interference values were calculated according to the following equation:
| (1) |
Here, I, T, and B are CL signals of the interferents, chlorpyrifos, and PBS buffer (as blank), respectively. Degree of interference values for all these pesticides were not higher than 5.9%, suggesting minimal interference for chlorpyrifos detection.
Application in Mock Samples.
As a proof-of-concept, the proposed platform was used to estimate chlorpyrifos levels in Astragalus, Poria cocos, and water samples. In detail, these samples were spiked with chlorpyrifos at low, medium and high concentrations and then detected by using the ITS assay. As seen in Table 1, the recovery and RSD results showed satisfactory recovery of 90.0–120.0% with RSD values all below 8.7%, indicating the ITS assay is able to reliably measure chlorpyrifos in traditional Chinese medicine and aqueous matrixes.
Table 1.
Recovery Tests of Chlorpyrifos Spiked in Water, Astragalus, and Poria cocos (n = 3)
| sample |
water |
Astragalus
|
Poria cocos
|
||||||
|---|---|---|---|---|---|---|---|---|---|
| added (ng/mL) | 1.0 | 5.0 | 25 | 1.0 | 5.0 | 25 | 1.0 | 5.0 | 25 |
| found (ng/mL) | 1.0 | 5.8 | 23.9 | 1.1 | 5.7 | 25.8 | 0.9 | 6.0 | 27.9 |
| RSD (%) | 5.0 | 8.7 | 2.6 | 5.7 | 3.8 | 5.8 | 5.4 | 6.6 | 6.5 |
| recovery (%) | 100 | 116 | 95.6 | 110 | 114 | 103 | 90 | 120 | 112 |
CONCLUSION
By employing MnO2 NFs as a dual-readout probe, a novel colorimetric/CL ITS was developed for detection of chlorpyrifos. The chlorpyrifos concentration-dependent formation of a dark brown color observable by naked eye makes this approach attractive for rapid screening in field conditions. Moreover, oxidant activity of MnO2 NFs used for enhancing luminol–H2O2 CL emission enabled quantitative detection of chlorpyrifos with a low detection limit of pg/mL level. Under optimal conditions, the proposed platform showed acceptable reliability and great potential for detecting pesticide residues in various matrixes. The ITS has advantages of dual-signal readout, cost-efficiency, low assay time, and simple operation. This platform could be extended as an effective dual-readout protocol for food safety, environment monitoring, and clinical diagnosis.
Supplementary Material
ACKNOWLEDGMENTS
This work was supported by the Centers for Disease Control and Prevention/National Institute for Occupational Safety and Health (CDC/NIOSH) Grant No. R01OH011023-01A1. Its contents are solely the responsibility of the authors and do not necessarily represent the official views of CDC.
Footnotes
Supporting Information
The Supporting Information is available free of charge on the ACS Publications website at DOI: 10.1021/acs.anal-chem.7b05247.
Supporting figures and table (PDF).
The authors declare no competing financial interest.
REFERENCES
- (1).Hassani S; Momtaz S; Vakhshiteh F; Maghsoudi AS; Ganjali MR; Norouzi P; Abdollahi M Arch. Toxicol 2017, 91, 109–130. [DOI] [PubMed] [Google Scholar]
- (2).Tankiewicz M; Fenik J; Biziuk M TrAC, Trends Anal. Chem 2010, 29, 1050–1063. [Google Scholar]
- (3).Ye C; Wang M-Q; Zhong X; Chen S; Chai Y; Yuan R Biosens. Bioelectron 2016, 79, 34–40. [DOI] [PubMed] [Google Scholar]
- (4).Lu D; Wang J; Wang L; Du D; Timchalk C; Barry R; Lin Y Adv. Funct. Mater 2011, 21, 4371–4378. [Google Scholar]
- (5).Zhang X; Wang H; Yang C; Du D; Lin Y Biosens. Bioelectron 2013, 41, 669–674. [DOI] [PubMed] [Google Scholar]
- (6).Jiang L; Huang T; Feng S; Wang JJ Chromatogr. A 2016, 1456, 49–57. [DOI] [PubMed] [Google Scholar]
- (7).Cequier E; Sakhi AK; Haug LS; Thomsen CJ Chromatogr. A 2016, 1454, 32–41. [DOI] [PubMed] [Google Scholar]
- (8).Kemmerich M; Bernardi G; Adaime MB; Zanella R; Prestes OD J. Chromatogr. A 2015, 1412, 82–89. [DOI] [PubMed] [Google Scholar]
- (9).Xia Z; Liu Y; Cai W; Shao XJ Chromatogr. A 2015, 1411, 110–115. [DOI] [PubMed] [Google Scholar]
- (10).Saa L; Grinyte R; Sánchez-Iglesias A; Liz-Marzán LM; Pavlov V ACS Appl. Mater. Interfaces 2016, 8, 11139–11146. [DOI] [PubMed] [Google Scholar]
- (11).Baker PA; Goltz MN; Schrand AM; Kim D-S Biosens. Bioelectron 2014, 61, 119–123. [DOI] [PubMed] [Google Scholar]
- (12).Sahin A; Dooley K; Cropek DM; West AC; Banta S Sens. Actuators, B 2011, 158, 353–360. [Google Scholar]
- (13).Zhao Q; Huang H; Zhang L; Wang L; Zeng Y; Xia X; Liu F; Chen Y Anal. Chem 2016, 88, 1412–1418. [DOI] [PubMed] [Google Scholar]
- (14).Zeb A; Xie X; Yousaf AB; Imran M; Wen T; Wang Z; Guo H-L; Jiang Y-F; Qazi IA; Xu A-W ACS Appl. Mater. Interfaces 2016, 8, 30126–30132. [DOI] [PubMed] [Google Scholar]
- (15).Wang C; Qian J; Wang K; Yang X; Liu Q; Hao N; Wang C; Dong X; Huang X Biosens. Bioelectron 2016, 77, 1183–1191. [DOI] [PubMed] [Google Scholar]
- (16).Singh S; Mitra K; Shukla A; Singh R; Gundampati RK; Misra N; Maiti P; Ray B Anal. Chem 2017, 89, 783–791. [DOI] [PubMed] [Google Scholar]
- (17).Zhang W; Asiri AM; Liu D; Du D; Lin Y TrAC, Trends Anal. Chem 2014, 54, 1–10. [Google Scholar]
- (18).Zhu C; Yang G; Li H; Du D; Lin Y Anal. Chem 2015, 87, 230–249. [DOI] [PMC free article] [PubMed] [Google Scholar]
- (19).Qian J; Yang X; Yang Z; Zhu G; Mao H; Wang KJ Mater. Chem. B 2015, 3, 1624–1632. [DOI] [PubMed] [Google Scholar]
- (20).Lin T; Zhong L; Wang J; Guo L; Wu H; Guo Q; Fu F; Chen G Biosens. Bioelectron 2014, 59, 89–93. [DOI] [PubMed] [Google Scholar]
- (21).Zhang L-N; Deng H-H; Lin F-L; Xu X-W; Weng S-H; Liu A-L; Lin X-H; Xia X-H; Chen W Anal. Chem 2014, 86, 2711–2718. [DOI] [PubMed] [Google Scholar]
- (22).Wu X; Song Y; Yan X; Zhu C; Ma Y; Du D; Lin Y Biosens. Bioelectron 2017, 94, 292–297. [DOI] [PubMed] [Google Scholar]
- (23).Wen W; Yan X; Zhu C; Du D; Lin Y Anal. Chem 2017, 89, 138–156. [DOI] [PubMed] [Google Scholar]
- (24).Darabdhara G; Sharma B; Das MR; Boukherroub R; Szunerits S Sens. Actuators, B 2017, 238, 842–851. [Google Scholar]
- (25).Ahmed SR; Kim J; Suzuki T; Lee J; Park EY Biosens. Bioelectron 2016, 85, 503–508. [DOI] [PubMed] [Google Scholar]
- (26).Liang M; Fan K; Pan Y; Jiang H; Wang F; Yang D; Lu D; Feng J; Zhao J; Yang L Anal. Chem 2013, 85, 308–312. [DOI] [PubMed] [Google Scholar]
- (27).Guan G; Yang L; Mei Q; Zhang K; Zhang Z; Han M-Y Anal. Chem 2012, 84, 9492–9497. [DOI] [PubMed] [Google Scholar]
- (28).Vázquez-González M; Liao W-C; Cazelles R; Wang S; Yu X; Gutkin V; Willner I ACS Nano 2017, 11, 3247–3253. [DOI] [PubMed] [Google Scholar]
- (29).Wen W; Song Y; Yan X; Zhu C; Du D; Wang S; Asiri AM; Lin Y Mater. Today 2018, 21, 164–177. [Google Scholar]
- (30).Yu L; Li P; Ding X; Zhang Q Talanta 2017, 165, 167–175. [DOI] [PubMed] [Google Scholar]
- (31).Liu C; Jia Q; Yang C; Qiao R; Jing L; Wang L; Xu C; Gao M Anal. Chem 2011, 83, 6778–6784. [DOI] [PubMed] [Google Scholar]
- (32).Yao L; Teng J; Zhu M; Zheng L; Zhong Y; Liu G; Xue F; Chen W Biosens. Bioelectron 2016, 85, 331–336. [DOI] [PubMed] [Google Scholar]
- (33).Chen Y; Ye D; Wu M; Chen H; Zhang L; Shi J; Wang L Adv. Mater 2014, 26, 7019–7026. [DOI] [PubMed] [Google Scholar]
- (34).Song Y; Qu K; Zhao C; Ren J; Qu X Adv. Mater 2010, 22, 2206–2210. [DOI] [PubMed] [Google Scholar]
- (35).Ni P; Sun Y; Dai H; Lu W; Jiang S; Wang Y; Li Z; Li Z Sens. Actuators, B 2017, 240, 1314–1320. [Google Scholar]
- (36).Jiang T; Song Y; Wei T; Li H; Du D; Zhu M-J; Lin Y Biosens. Bioelectron 2016, 77, 687–694. [DOI] [PubMed] [Google Scholar]
- (37).Jiang T; Song Y; Du D; Liu X; Lin Y ACS Sens. 2016, 1, 717–724. [Google Scholar]
- (38).Liu J; Meng L; Fei Z; Dyson PJ; Jing X; Liu X Biosens. Bioelectron 2017, 90, 69–74. [DOI] [PubMed] [Google Scholar]
- (39).Vankayala R; Lin C-C; Kalluru P; Chiang C-S; Hwang KC Biomaterials 2014, 35, 5527–5538. [DOI] [PubMed] [Google Scholar]
Associated Data
This section collects any data citations, data availability statements, or supplementary materials included in this article.


