

Abstract
Vitamin D deficiency has been linked to cardiovascular disease and risk factors including hypertension. The authors sought to determine prevalence rates of hypertension in adults tested for 25‐hydroxyvitamin D categorized by their levels and evaluate odds ratios for hypertension at lower 25‐hydroxyvitamin D levels compared with optimal levels. A cross‐sectional study was conducted January 1, 2004, through December 31, 2006, of patients aged 18 years and older within a large ethnically diverse population. Diagnosis of hypertension was determined by International Statistical Classification of Diseases and Related Health Problems codes. Patients were categorized into quartiles according to 25‐hydroxyvitamin D levels: ideal (≥40 ng/mL), adequate (30–39 ng/mL), deficient (15–29 ng/mL), and severely deficient (<15 ng/mL). Prevalence rates of hypertension and odds ratios were calculated for each 25‐hydroxyvitamin D quartile, adjusting for age, sex, race, and renal insufficiency. A total of 2722 individuals met the inclusion criteria for the study. The overall prevalence of hypertension in the study population was 24%. Hypertension rates were 52%, 41%, 27%, and 20% in 25‐hydroxyvitamin D quartiles <15 ng/mL, 15 to 29 ng/mL, 30 to 39 ng/mL, and ≥40 ng/mL, respectively (P<.001). Odds ratios (95% confidence intervals) for hypertension adjusting for age, sex, race, and renal insufficiency were 2.7 (1.4–5.2), 2.0 (1.5–2.6), and 1.3 (1.2–1.6) for 25‐hydroxyvitamin D levels <15 ng/mL, 15 to 29 ng/mL, and 30 to 39 ng/mL, respectively, compared with the ≥40 ng/mL group. This study demonstrates increased rates of hypertension in individuals who tested for lower levels of 25‐hydroxyvitamin D starting at levels <40 ng/mL. This retrospective analysis raises the question of whether supplementing to optimal vitamin D levels can prevent or improve hypertension. J Clin Hypertens (Greenwich). 2011;13:170–177. © 2010 Wiley Periodicals, Inc.
Vitamin D deficiency is widespread, affecting up to 40% of the adult population in the United States by some estimates. 1 Low levels of vitamin D have been described with a multitude of disease processes, including increased blood pressure (BP), cardiovascular disease, and all‐cause mortality. 2 , 3 , 4 , 5 , 6 , 7 , 8 , 9 , 10 , 11 , 12 , 13 A meta‐analysis demonstrated a 7% risk reduction in all‐cause mortality in patients who received vitamin D supplementation compared with those who did not. 6 Three studies evaluating data from the Third National Health and Nutrition Examination Survey (NHANES III) population and another study in Norway of more than 4000 patients demonstrated an inverse relationship between 25‐hydroxyvitamin D (D25) levels and BP. 7 , 8 , 9 , 10
Longitudinal observations have also demonstrated low vitamin D levels and increased risk of incident hypertension. 14 , 15 Furthermore, studies on vitamin D supplementation have shown promise in lowering BP. 16 , 17 , 18 However, not all studies have described such an effect of vitamin D supplementation. 11 , 19 , 20 , 21 , 22 , 23 Additionally, other longitudinal observations failed to demonstrate greater incident hypertension in patients with low vitamin D. 10 , 24
Vitamin D has been shown to regulate the renin‐angiotensin‐aldosterone system, suppress vascular smooth muscle proliferation, inhibit parathyroid hormone (PTH) secretion, and regulate calcium and phosphorous levels, which are all possible mechanisms by which vitamin D may impact BP. 25 , 26 , 27 , 28 , 29 , 30 , 31 , 32
The putative mechanism of vitamin D on BP stems from the effects of active 1,25 dihydroxyvitamin D. However, the upstream D25 is generally a more accurate indicator of vitamin D stores due to its longer half‐life and better correlation with PTH levels. 33 , 34
An association between D25 levels and BP does appear to exist but studies have been overall inconsistent in demonstrating an effect of vitamin D therapy/supplementation on ameliorating hypertension or reducing incidence. One of the reasons may be the suboptimal dosing of vitamin D and the fact that the studies were not necessarily treating to an optimal level. Cross‐sectional prevalence studies also compared BP and hypertension rates based on relative distribution of vitamin D levels rather than by comparing rates across absolute levels.
Determining a correlation between decreased D25 levels and increased rate of hypertension is of particular interest because of the potential clinical implications. The importance of further exploring this relationship was the impetus for this study. Using data from a large ethnically diverse integrated health care system, we identified patients who were tested for D25 and compared hypertension rates across different D25 levels.
Methods
Study Population
Study participants were all members of the Kaiser Permanente Southern California health plan, which is an integrated health care system providing comprehensive care to more than 3.3 million members at 11 medical centers and 100 satellite clinics and service sites throughout Southern California. All members have similar coverage benefits for health care services, including office visits, tests, and medications. These data were collected as part of normal health care operations. All health care encounters are tracked using a common electronic medical record database. This was a retrospective cross‐sectional study of eligible patients limited to adults aged 18 years and older who had documented levels of D25 drawn between January 1, 2004, and December 31, 2006. D25 tests were ordered and drawn as part of routine clinical practice for various clinical indications by health practitioners. The study protocol was approved by the Kaiser Permanente Southern California institutional review board.
Identification of Hypertension
Diagnosed hypertension in study participants was identified by inpatient and outpatient International Statistical Classification of Diseases and Related Health Problems (ICD) codes specific to hypertension. The accuracy of ICD coding for the diagnosis of hypertension was internally validated by The Permanente Medical Group (Rhonda Woodling HTN Task Force). In 1999, the internal hypertension registry, totaling 386,710 patients, was used to determine the positive predictive value (PPV) of ICD coding for hypertension based on number of times hypertension was coded. An individual who had hypertension coded once had a PPV of 88.7%, whereas someone coded at least twice had a PPV of 98.1% (Table S1). Of the patients who were identified as hypertensive in our study population, 95.5% had ≥2 hypertension ICD diagnoses. No data or validation on the specificity of hypertension exist to our knowledge within the Kaiser Permanente Southern California database. Additionally, actual BP measurement data were not available for all individuals within the entire study population.
Exclusions
Exclusion criteria were determined to eliminate causes of secondary hypertension, which can potentially confound the relationship of D25 and hypertension. Based on inpatient or outpatient ICD diagnoses coding, secondary causes of hypertension that were identified and excluded were patients with sleep apnea (codes 327.23A, 327.23B, 327.23C, 327.23D); aldosteronism (codes 255.10A, 255.10B, 255.14A, 255.13B); renovascular disease (codes 403.00B, 403.10, 403.90E, 403.90G, 403.90L, 405.91B, 405.11B, 405.01B); coarctation of the aorta (codes 747.10A, 747.10B, 747.10C, 747,10D); Cushing’s syndrome (codes 255.0E, 255.0F, 255.0G, 255.3A, 255.3C, 255.3D); and pheochromocytoma (codes 194.0C, 194.0D, 227.0A).
Serum Vitamin D Analysis
All serum samples were analyzed using the Nichols Advantage 25‐OHD assay (Nichols Institute Diagnostics, San Clemente, CA) in which levels are determined by liquid chromatography with tandem mass spectrometry. D25 results were categorized into predetermined quartiles based on the absolute D25 levels rather than the population distribution. Optimal levels of D25 for the prevention of various negative health outcomes have not been clearly defined. As D25 levels fall, calcium absorption decreases and PTH levels rise. Thus, the maximal suppression of PTH release by D25 is one criterion used to define optimal D25 levels. PTH levels tend to rise at D25 levels <30 ng/mL. Thus, accepted normal D25 levels are >30 ng/mL. 35 , 36 More recent studies have suggested that ideal serum levels of D25 to prevent various negative health outcomes, including bony fracture risk, colon cancer, and poor calcium absorption, are at levels of ≥40 ng/mL. 2 , 35 , 37 For this study, we established the ideal plasma D25 level at ≥40 ng/mL and as the reference group. The four quartiles were categorized as ideal (≥40 ng/mL), adequate (30–39 ng/mL), deficient (15–29 ng/mL), and severely deficient (<15 ng/mL).
Covariates
Data on age, sex, race, and renal insufficiency (RI) were used in multivariate analyses to determine odds ratios (ORs) for hypertension based on D25 quartiles. RI was defined based on an estimated glomerular filtration rate (eGFR) <60 mL/min/1.73 m2 calculated by the abbreviated Modification of Diet in Renal Disease (MDRD) study equation. 38 Other laboratory data assessed included serum calcium, phosphorous, and PTH levels. Body mass index, smoking status, physical activity, and other patient lifestyle habits such as salt intake and sun exposure were not included in the analyses because sufficient information was not available for the entire study population.
Analyses
The goal of the study was to determine and compare the rates of hypertension based on D25 levels in individuals who had a clinical indication for a D25 test. The primary end point was the adjusted OR for hypertension within each D25 quartile compared with the ideal quartile using multivariate logistic regressions analysis. The prevalence of hypertension in each D25 quartile was also determined and comparisons made using analysis of variance. The crude and adjusted ORs for hypertension were calculated for each D25 quartile. Adjusted ORs were generated after control for age, sex, race (black vs non‐black), and RI (defined as eGFR <60 mL/min/1.73 m2). The quartile with D25 ≥40 ng/mL was used as the reference group. All statistical results were generated using SAS version 9.13 (SAS Institute Inc, Cary, NC) statistical software and results with P values <.05 were considered statistically significant.
Results
A total of 2722 patients were identified to have a documented D25 within the study period. The study population characteristics are detailed in Table I. Mean overall D25 level for the entire population was 48 ng/mL, and the majority had a D25 level >40 ng/mL. The overall prevalence of hypertension in the study population was 24% (657 patients). Ninety‐four percent of the individuals diagnosed with hypertension were coded on ≥3 separate visits. Only 4.5% had a single ICD code for hypertension. Thus, >95% of the patients coded for hypertension had 98.1% PPV for an accurate diagnosis of hypertension.
Table I.
Baseline Demographics of the Study Population
| No. | ||
|---|---|---|
| Age, mean, y | 58.5 | 2722 |
| Sex | ||
| Female, % | 69.1 | 1881 |
| Male, % | 30.9 | 841 |
| Race | ||
| White, % | 56.0 | 1525 |
| Black, % | 11.4 | 310 |
| Native American, % | 0.1 | 2 |
| Asian, % | 7.6 | 208 |
| Other, % | 24.9 | 677 |
| Parathyroid hormone, mean, pg/mL | 76.6 | 1790 |
| Calcium, mean, mg/dL | 9.4 | 2473 |
| Phosphorous, mean, mg/dL | 3.6 | 1888 |
| Creatinine, mean, mg/dL | 1.1 | 2721 |
| 25‐hydroxyvitamin D, mean, ng/mL | 47.7 | 2722 |
| <15, % | 1.5 | 42 |
| 15–29, % | 13.0 | 353 |
| 30–39, % | 18.9 | 515 |
| ≥40, % | 66.6 | 1812 |
| Glomerular filtration rate, mL/min/1.73 m2 | ||
| <60, % | 23.1 | 630 |
| ≥60, % | 76.9 | 2092 |
Baseline demographics stratified by D25 quartiles are shown in Table II. RI was present in nearly a quarter of the study population, as 77% of the patients had an eGFR ≥60 mL/min/1.73 m2. Patients in the highest D25 quartile were younger and had a greater proportion of women. Patients in the lowest D25 quartile had similar representation of men and women. While average phosphorous levels decreased with higher D25 quartiles, the rate of RI patients decreased with higher D25 quartiles (P<.0001).
Table II.
Baseline Demographics According to Vitamin D Quartile
| D25 Quartile, ng/mL | <15 (n=42) | 15–29 (n=353) | 30–39 (n=515) | ≥40 (n=1812) | P Value |
|---|---|---|---|---|---|
| Age, mean, y | 59.7 | 63.7 | 61.5 | 56.7 | <.0001 |
| Sex | |||||
| Female, % | 52.4 | 57.8 | 64.9 | 72.9 | <.0001 |
| Male, % | 47.6 | 42.2 | 35.1 | 27.1 | |
| Race | |||||
| White, % | 61.9 | 60.1 | 59.6 | 54.1 | .0166 |
| Black, % | 21.4 | 11.6 | 9.7 | 11.6 | |
| Native Americans, % | 0.2 | 0.2 | |||
| Other, % | 9.5 | 18.4 | 24.3 | 26.7 | |
| Parathyroid hormone, mean, pg/mL | 95.3 | 126.7 | 75.1 | 66.5 | <.0001 |
| Calcium, mean, mg/dL | 8.9 | 9.2 | 9.4 | 9.5 | <.0001 |
| Phosphorous, mean, mg/dL | 4.5 | 3.9 | 3.7 | 3.4 | <.0001 |
| Estimated glomerular filtration rate, mL/min/1.73 m2 | |||||
| <60, % | 73.8 | 49.6 | 28.0 | 15.5 | <.0001 |
| ≥60, % | 26.2 | 50.4 | 72.0 | 84.5 | |
Baseline demographics stratified by 25‐hydroxyvitamin D (D25) quartiles. Analysis of variance used for comparisons across quartiles.
The prevalence rate of hypertension within each quartile increased in a graded manner with each lower D25 quartile (Figure 1). Patients in the severely deficient D25 quartile (<15 ng/mL) had the greatest rate of hypertension (52.4% [n=22]). Patients in the deficient quartile (15–29 ng/mL) had a 40.8% (n=144) rate, followed by 27.2% (n=140) and 19.4% (n=351) hypertension rates in the adequate (30–39 ng/mL) and ideal (≥40 ng/mL) quartiles, respectively (P<.0001).
Figure.
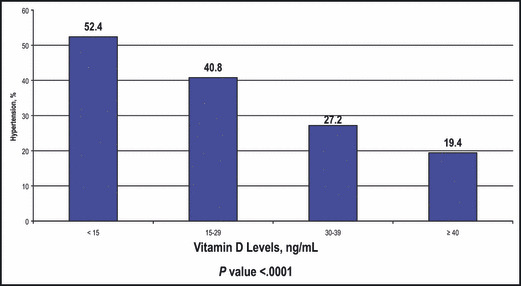
Rate of hypertension within vitamin D quartiles. The rate of hypertension within each quartile increased in a graded manner with each lower 25‐hydroxyvitamin D (D25) quartile. Patients in the severely deficient D25 quartile (<15 ng/mL) had the greatest rate of hypertension (52.4%, n=22). Patients in the deficient quartile (15–29 ng/mL) had a 40.8% (n=144) rate, followed by 27.2% (n=140) and 19.4% (n=351) hypertension rates in the adequate (30–39 ng/mL) and ideal (≥40 ng/mL) quartiles, respectively (P<.0001).
Results of unadjusted and adjusted logistics regression analyses are listed in Table III. The OR for hypertension was inversely related to increasing D25 quartiles. Compared with the ideal D25 quartile (≥40 ng/mL), the crude OR (95% confidence interval [CI]) for hypertension in the adequate D25 quartile (30–39 ng/mL) was 1.55 (1.24–1.95). The crude OR for hypertension was 2.87 (2.25–3.65) and 4.58 (2.47–8.48) for D25 quartiles 15 ng/mL to 29 ng/mL and <15 ng/mL, respectively, compared with D25 quartile ≥40 ng/mL.
Table III.
Odds Ratios for Hypertension by Vitamin D Quartiles
| Explanatory Variable | Odds Ratio (95% Confidence Interval) for Hypertension Using Logistic Regressions | |
|---|---|---|
| Crude Odds Ratio | Odds Ratio Adjusting for Other Covariates Within Column | |
| D25 <15 vs ≥40 | 4.58 (2.47–8.48) | 2.70 (1.41–5.19) |
| D25 15–29 vs ≥40 | 2.87 (2.25–3.65) | 2.00 (1.54–2.59) |
| D25 30–39 vs ≥40 | 1.55 (1.24–1.95) | 1.29 (1.02–1.64) |
| D25 ≥40 | 1.0 (reference) | 1.0 (reference) |
| Age, y | ||
| 60–99 vs 0–59 | 2.06 (1.72–2.47) | 1.66 (1.37–2.01) |
| Sex | ||
| Male vs female | 1.33 (1.10–1.60) | 1.21 (0.99–1.47) |
| Race | ||
| Black vs white | 1.43 (1.10–1.86) | 1.49 (1.13–1.97) |
| RI | ||
| eGFR <59 vs ≥60 mL/min/1.73 m2 | 3.06 (2.52–3.71) | 2.18 (1.76–2.69) |
In the multivariate analyses, adjusting for covariates of age, race, sex, and RI, the OR remained statistically significant throughout the quartiles and continued to demonstrate a graded increase with lower quartiles of D25. The respective ORs for hypertension were 1.29 (1.02–1.64), 2.00 (1.54–2.59), and 2.70 (1.41–5.19) for quartiles 30 ng/mL to 39 ng/mL, 15 to 29 ng/mL, and <15 ng/mL to quartile ≥40 ng/mL (Table III). Age, race, and RI were independently associated with increased OR for hypertension as well. The OR for hypertension was 1.66 (1.37–2.01) in patients older than 59 years compared with those 59 years and younger. In RI patients, the OR for hypertension was 2.18 (1.76–2.69) compared with those without RI. Black race also had an increased OR for hypertension (1.49 [1.13–1.97]). Male sex had a higher OR for hypertension in the unadjusted analysis, but this difference was not sustained on the multivariate‐adjusted logistic regressions analysis (1.21 [0.99–1.47]).
Discussion
At least 65 million people, accounting for more than 30% in the United States and many more throughout the world, are affected by hypertension. 39 Hypertension and its direct association with cardiovascular outcomes and other organ damages are well described. 12 , 13 , 40
This study evaluated patients who were tested for D25 and thus had clinical indications for D25 testing. Nevertheless, within this study population we observed greater rates and ORs for hypertension at lower levels of D25. The percentage of patients with hypertension increased in a graded manner, starting with the adequate D25 quartile (30–39 ng/mL), and this percentage increased lower levels of D25. Logistic regression analyses after adjusting for age, sex, race, and RI revealed that even patients with adequate D25 levels (30–39 ng/mL) have a 30% increased risk for hypertension compared with patients with ideal D25 levels (≥40 ng/mL).
The prevalence of RI in the overall study population was found to be 23%, and the rate of RI increased with lower D25 quartiles. One systematic review of 26 studies evaluating the prevalence of chronic kidney disease (CKD) found that the median prevalence of CKD was 7.2% in the general population aged 30 years and older with a 23% to 36% prevalence of CKD in patients 64 years and older. 41 Theoretically, depressed renal function should not directly affect D25 levels since D25 is upstream of the pathway, resulting in activation to 1,25‐hydroxyvitamin D primarily within the kidney. However, a higher prevalence of D25 deficiency in CKD is well described. 42 , 43 , 44 , 45 , 46 , 47 This is likely due to the confounding of similar risk factors that CKD patients have for vitamin D deficiency. CKD patients are often instructed on low phosphorous (less dairy) in their diet. Due to comorbidities, they often have a more confined and sedentary lifestyle with less sun and UV light exposure. Age‐related skin changes and gut absorption can often present in CKD patients and can decrease D25 synthesis or absorption in the body. 1 , 48
The hypertension rate was 24% in our study population, which is similar to the NHANES III population that reported a hypertension rate of 24% as well. 49 It is also noted that the average age of our study population was older (58.5 years) with a greater proportion of women (69%). This overrepresentation of the elderly and women may be related to individuals who have a propensity to have D25 levels drawn and may not truly reflect the general population. This selection bias is a shortcoming of our cross‐sectional analysis. Our retrospective study identified and evaluated only those who had a clinical indication for D25 testing. Thus, this population may not be representative of the general population within the health plan or the United States. An illustration of that is the fact that patients in the optimal quartile of vitamin D (≥40 ng/mL) were youngest. Additionally, our study population did not distribute evenly across our predefined quartiles and thus relative comparisons made not be entirely accurate given the disparity in actual number of patients in the quartiles.
Another shortcoming is the lack of data on confounders such as body mass index, smoking status, and physical activity, which were not considered or controlled in our analyses due to insufficient data for the entire study population. We were unable to capture data on vitamin D intake whether through prescription, over‐the‐counter supplementation, or diet. Thus, the potential class effect of vitamin D supplementation could not be accounted for in our study.
This study further supports a relationship between D25 levels and hypertension. A similar evaluation of the NHANES III population showed an inverse relationship between D25 levels and BP. 7 , 9 The patients in the lowest quintile of D25 had a 30% greater risk of hypertension compared with those in the lowest quintile of D25. 8 Jorde and colleagues 10 also found an inverse relationship between BP and D25 within a population in Norway.
Two prospective cohort studies by Forman and colleagues, 14 , 15 which evaluated patients from the Nurses’ Health Study and Health Professionals’ Follow‐up Study, found several‐fold increased risk for developing hypertension in patients with D25 levels <15 ng/mL compared with D25 ≥30 ng/mL. Wang and colleagues 18 demonstrated that women with the highest dietary intake of vitamin D had a lower risk of incident hypertension. However, Jorde and colleagues10 had a different observation when they evaluated D25 and incident hypertension in a large population from Norway. Their 15‐year follow‐up study did not show a predictive risk of future hypertension in those with lower baseline D25 levels.
Interventions with vitamin D on BP have also been described. Pfeifer and colleagues16 demonstrated that supplementation of calcium and D25 was more effective in lowering BP than calcium alone. Elderly women who received 800 IU of D25 daily with calcium helped to decrease systolic BP by 9.3%. Others have also shown vitamin D supplementation and favorable BP outcomes. 17 , 18 Krause and colleagues 50 showed that regular exposure to UV‐B light decreased BP by 6 mm Hg, which is presumably due to a vitamin D–related mechanism. Conversely, more negative results from studies have been reported where the impact of vitamin D intake on BP failed to be demonstrated. 11 , 19 , 20 , 21 , 22 , 23 We feel that suboptimal dosing of vitamin D may be one of the reasons. For instance, Women’s Health Initiative participants were taking a mere 400 IU of cholecalciferol daily. 22 Most studies did not treat patients to an optimal goal level of D25 but had them take a modest dose. Cross‐sectional prevalence studies also compared BP and hypertension rates based on relative distribution of vitamin D levels rather than by comparing rates across predetermined levels.
The mechanism of vitamin D impacting BP is not well understood and has not been definitively elucidated. Vitamin D–deficient patients have been shown to have impaired calcium homeostasis, 31 and low calcium can contribute to hypertension. 51 The abnormal transcellular fluxes in calcium levels caused by vitamin D deficiency has also been shown to increase vascular smooth muscle tone. 30 High PTH levels have also been shown to increase arterial BP and cause vascular stiffness. 52 , 53 Patients in our study with lower D25 had higher phosphorous and PTH levels along with lower calcium levels, compared with those with adequate and optimal levels of D25.
The renin‐angiotensin system is important in BP by its effects on both volume regulation and vasoconstriction. Vitamin D has been shown to downregulate the renin‐angiotensin system in several animal models. 32 , 54 , 55 A study by Li and colleagues32 demonstrated that 1,25‐dihydroxyvitamin D receptor‐null mice have increased renin expression and increased angiotensin II levels, resulting in higher arterial pressures and cardiac hypertrophy. The same study showed that effectively depriving rats of 1,25‐dihydroxyvitamin D results in higher renin levels and higher arterial BPs.
Vitamin D receptors are present on various tissues such as leukocytes, vascular smooth muscle cells, endothelial cells, and juxtaglomerular cells. These cell lines can affect systemic BP. 25 , 32 Vitamin D can directly suppress vascular smooth muscle cell proliferation and epidermal growth factor. 25 Adequate vitamin D levels can prevent vascular smooth muscle contraction and increase arterial compliance, causing a possible vasodilatory effect on blood vessels. 25 , 27 , 28 It has also been shown to improve endothelial function. 17 These protective or beneficial mechanisms can be potentially compromised with lower vitamin D levels.
Conclusions
In order to reduce complications of hypertension, including cardiovascular events, renal failure, heart disease, and cerebrovascular events, it is important to identify potentially modifiable risk factors for hypertension. Previous observational studies and interventions with vitamin D have been intriguing due to its implications on hypertension. Yet other studies have failed to demonstrate any relationship between vitamin D deficiency and BP. While our retrospective study observed higher rates of hypertension in patients with suboptimal levels of D25 levels, we feel that it lends support to an important question, and that is whether vitamin D supplementation should be targeted to certain goal levels. Further studies need to be performed to determine whether detection and optimization of D25 levels >40 ng/mL may help to prevent or ameliorate hypertension.
Acknowledgments and disclosures: The authors would like to thank Rhonda Woodling and The Permanente Medical Group for providing the hypertension validation data. John J. Sim had full access to all of the data in the study and takes responsibility for the integrity of the data and the accuracy of the data analysis. John J. Sim has an ongoing research grant funding from Novartis Pharmaceuticals and Genzyme Biotechnology. This study was funded in its entirety by Kaiser Permanente Southern California Medical Group.
Supporting information
Table S1. The hypertension registry of The Permanente Medical Group
Supporting info item
References
- 1. Holick MF. High prevalence of vitamin D inadequacy and implications for health. Mayo Clin Proc. 2006;81(3):353–373. [DOI] [PubMed] [Google Scholar]
- 2. Holick MF. Vitamin D deficiency. N Engl J Med. 2007;357(3):266–281. [DOI] [PubMed] [Google Scholar]
- 3. Bischoff‐Ferrari HA, Dietrich T, Orav EJ, et al. Positive association between 25‐hydroxy vitamin D levels and bone mineral density: a population‐based study of younger and older adults. Am J Med. 2004;116(9):634–639. [DOI] [PubMed] [Google Scholar]
- 4. Chiu KC, Chu A, Go VL, et al. Hypovitaminosis D is associated with insulin resistance and beta cell dysfunction. Am J Clin Nutr. 2004;79(5):820–825. [DOI] [PubMed] [Google Scholar]
- 5. de Boer IH, Kestenbaum B, Shoben AB, et al. 25‐hydroxyvitamin D levels inversely associate with risk for developing coronary artery calcification. J Am Soc Nephrol. 2009;20(8):1805–1812. [DOI] [PMC free article] [PubMed] [Google Scholar]
- 6. Autier P, Gandini S. Vitamin D supplementation and total mortality: a meta‐analysis of randomized controlled trials. Arch Intern Med. 2007;167(16):1730–1737. [DOI] [PubMed] [Google Scholar]
- 7. Scragg R, Sowers M, Bell C. Serum 25‐hydroxyvitamin D, ethnicity, and blood pressure in the Third National Health and Nutrition Examination Survey. Am J Hypertens. 2007;20(7):713–719. [DOI] [PubMed] [Google Scholar]
- 8. Martins D, Wolf M, Pan D, et al. Prevalence of cardiovascular risk factors and the serum levels of 25‐hydroxyvitamin D in the United States: data from the Third National Health and Nutrition Examination Survey. Arch Intern Med. 2007;167(11):1159–1165. [DOI] [PubMed] [Google Scholar]
- 9. Judd SE, Nanes MS, Ziegler TR, et al. Optimal vitamin D status attenuates the age‐associated increase in systolic blood pressure in white Americans: results from the third National Health and Nutrition Examination Survey. Am J Clin Nutr. 2008;87(1):136–141. [DOI] [PubMed] [Google Scholar]
- 10. Jorde R, Figenschau Y, Emaus N, et al. Serum 25‐hydroxyvitamin D levels are strongly related to systolic blood pressure but do not predict future hypertension. Hypertension. 2010;55(3):792–798. [DOI] [PubMed] [Google Scholar]
- 11. Scragg R, Holdaway I, Singh V, et al. Serum 25‐hydroxycholecalciferol concentration in newly detected hypertension. Am J Hypertens. 1995;8(4 Pt 1):429–432. [DOI] [PubMed] [Google Scholar]
- 12. Lewington S, Clarke R, Qizilbash N, et al. Age‐specific relevance of usual blood pressure to vascular mortality: a meta‐analysis of individual data for one million adults in 61 prospective studies. Lancet. 2002;360(9349):1903–1913. [DOI] [PubMed] [Google Scholar]
- 13. Vasan RS, Larson MG, Leip EP, et al. Impact of high‐normal blood pressure on the risk of cardiovascular disease. N Engl J Med. 2001;345(18):1291–1297. [DOI] [PubMed] [Google Scholar]
- 14. Forman JP, Curhan GC, Taylor EN. Plasma 25‐hydroxyvitamin D levels and risk of incident hypertension among young women. Hypertension. 2008;52(5):828–832. [DOI] [PMC free article] [PubMed] [Google Scholar]
- 15. Forman JP, Giovannucci E, Holmes MD, et al. Plasma 25‐hydroxyvitamin D levels and risk of incident hypertension. Hypertension. 2007;49(5):1063–1069. [DOI] [PubMed] [Google Scholar]
- 16. Pfeifer M, Begerow B, Minne HW, et al. Effects of a short‐term vitamin D(3) and calcium supplementation on blood pressure and parathyroid hormone levels in elderly women. J Clin Endocrinol Metab. 2001;86(4):1633–1637. [DOI] [PubMed] [Google Scholar]
- 17. Sugden JA, Davies JI, Witham MD, et al. Vitamin D improves endothelial function in patients with Type 2 diabetes mellitus and low vitamin D levels. Diabet Med. 2008;25(3):320–325. [DOI] [PubMed] [Google Scholar]
- 18. Wang L, Manson JE, Buring JE, et al. Dietary intake of dairy products, calcium, and vitamin D and the risk of hypertension in middle‐aged and older women. Hypertension. 2008;51(4):1073–1079. [DOI] [PubMed] [Google Scholar]
- 19. Schleithoff SS, Zittermann A, Tenderich G, et al. Vitamin D supplementation improves cytokine profiles in patients with congestive heart failure: a double‐blind, randomized, placebo‐controlled trial. Am J Clin Nutr. 2006;83(4):754–759. [DOI] [PubMed] [Google Scholar]
- 20. Major GC, Alarie F, Dore J, et al. Supplementation with calcium + vitamin D enhances the beneficial effect of weight loss on plasma lipid and lipoprotein concentrations. Am J Clin Nutr. 2007;85(1):54–59. [DOI] [PubMed] [Google Scholar]
- 21. Nagpal J, Pande JN, Bhartia A. A double‐blind, randomized, placebo‐controlled trial of the short‐term effect of vitamin D3 supplementation on insulin sensitivity in apparently healthy, middle‐aged, centrally obese men. Diabet Med. 2009;26(1):19–27. [DOI] [PubMed] [Google Scholar]
- 22. Margolis KL, Ray RM, Van Horn L, et al. Effect of calcium and vitamin D supplementation on blood pressure: the Women’s Health Initiative Randomized Trial. Hypertension. 2008;52(5):847–855. [DOI] [PMC free article] [PubMed] [Google Scholar]
- 23. Zittermann A, Frisch S, Berthold HK, et al. Vitamin D supplementation enhances the beneficial effects of weight loss on cardiovascular disease risk markers. Am J Clin Nutr. 2009;89(5):1321–1327. [DOI] [PubMed] [Google Scholar]
- 24. Forman JP, Bischoff‐Ferrari HA, Willett WC, et al. Vitamin D intake and risk of incident hypertension: results from three large prospective cohort studies. Hypertension. 2005;46(4):676–682. [DOI] [PubMed] [Google Scholar]
- 25. Carthy EP, Yamashita W, Hsu A, et al. 1,25‐Dihydroxyvitamin D3 and rat vascular smooth muscle cell growth. Hypertension. 1989;13(6 Pt 2):954–959. [DOI] [PubMed] [Google Scholar]
- 26. Zittermann A. Vitamin D and disease prevention with special reference to cardiovascular disease. Prog Biophys Mol Biol. 2006;92(1):39–48. [DOI] [PubMed] [Google Scholar]
- 27. Somjen D, Weisman Y, Kohen F, et al. 25‐hydroxyvitamin D3‐1alpha‐hydroxylase is expressed in human vascular smooth muscle cells and is upregulated by parathyroid hormone and estrogenic compounds. Circulation. 2005;111(13):1666–1671. [DOI] [PubMed] [Google Scholar]
- 28. Kristal‐Boneh E, Froom P, Harari G, et al. Association of calcitriol and blood pressure in normotensive men. Hypertension. 1997;30(5):1289–1294. [DOI] [PubMed] [Google Scholar]
- 29. McCarty MF, Thomas CA. PTH excess may promote weight gain by impeding catecholamine‐induced lipolysis‐implications for the impact of calcium, vitamin D, and alcohol on body weight. Med Hypotheses. 2003;61(5–6):535–542. [DOI] [PubMed] [Google Scholar]
- 30. Rostand SG. Ultraviolet light may contribute to geographic and racial blood pressure differences. Hypertension. 1997;30(2 Pt 1):150–156. [DOI] [PubMed] [Google Scholar]
- 31. Schedl HP, Miller DL, Pape JM, et al. Calcium and sodium transport and vitamin D metabolism in the spontaneously hypertensive rat. J Clin Invest. 1984;73(4):980–986. [DOI] [PMC free article] [PubMed] [Google Scholar]
- 32. Li YC, Kong J, Wei M, et al. 1,25‐Dihydroxyvitamin D(3) is a negative endocrine regulator of the renin‐angiotensin system. J Clin Invest. 2002;110(2):229–238. [DOI] [PMC free article] [PubMed] [Google Scholar]
- 33. Chapuy MC, Preziosi P, Maamer M, et al. Prevalence of vitamin D insufficiency in an adult normal population. Osteoporos Int. 1997;7(5):439–443. [DOI] [PubMed] [Google Scholar]
- 34. DeLuca HF. Overview of general physiologic features and functions of vitamin D. Am J Clin Nutr. 2004;80(6 suppl):1689S–1696S. [DOI] [PubMed] [Google Scholar]
- 35. Bischoff‐Ferrari HA, Giovannucci E, Willett WC, et al. Estimation of optimal serum concentrations of 25‐hydroxyvitamin D for multiple health outcomes. Am J Clin Nutr. 2006;84(1):18–28. [DOI] [PubMed] [Google Scholar]
- 36. Holick MF, Chen TC. Vitamin D deficiency: a worldwide problem with health consequences. Am J Clin Nutr. 2008;87(4):1080S–1086S. [DOI] [PubMed] [Google Scholar]
- 37. Hollis BW. Circulating 25‐hydroxyvitamin D levels indicative of vitamin D sufficiency: implications for establishing a new effective dietary intake recommendation for vitamin D. J Nutr. 2005;135(2):317–322. [DOI] [PubMed] [Google Scholar]
- 38. Levey AS, Bosch JP, Lewis JB, et al. A more accurate method to estimate glomerular filtration rate from serum creatinine: a new prediction equation. Modification of Diet in Renal Disease Study Group. Ann Intern Med. 1999;130(6):461–470. [DOI] [PubMed] [Google Scholar]
- 39. Fields LE, Burt VL, Cutler JA, et al. The burden of adult hypertension in the United States 1999 to 2000: a rising tide. Hypertension. 2004;44(4):398–404. [DOI] [PubMed] [Google Scholar]
- 40. Chobanian AV, Bakris GL, Black HR, et al. The seventh report of the Joint National Committee on prevention, detection, evaluation, and treatment of high blood pressure: the JNC 7 report. JAMA. 2003;289(19):2560–2572. [DOI] [PubMed] [Google Scholar]
- 41. Zhang QL, Rothenbacher D. Prevalence of chronic kidney disease in population‐based studies: systematic review. BMC Public Health. 2008;8:117. [DOI] [PMC free article] [PubMed] [Google Scholar]
- 42. Taskapan H, Ersoy FF, Passadakis PS, et al. Severe vitamin D deficiency in chronic renal failure patients on peritoneal dialysis. Clin Nephrol. 2006;66(4):247–255. [DOI] [PubMed] [Google Scholar]
- 43. Saab G, Young DO, Gincherman Y, et al. Prevalence of vitamin D deficiency and the safety and effectiveness of monthly ergocalciferol in hemodialysis patients. Nephron Clin Pract. 2007;105(3):c132–c138. [DOI] [PubMed] [Google Scholar]
- 44. Querings K, Girndt M, Geisel J, et al. 25‐hydroxyvitamin D deficiency in renal transplant recipients. J Clin Endocrinol Metab. 2006;91(2):526–529. [DOI] [PubMed] [Google Scholar]
- 45. Levin A, Bakris GL, Molitch M, et al. Prevalence of abnormal serum vitamin D, PTH, calcium, and phosphorus in patients with chronic kidney disease: results of the study to evaluate early kidney disease. Kidney Int. 2007;71(1):31–38. [DOI] [PubMed] [Google Scholar]
- 46. LaClair RE, Hellman RN, Karp SL, et al. Prevalence of calcidiol deficiency in CKD: a cross‐sectional study across latitudes in the United States. Am J Kidney Dis. 2005;45(6):1026–1033. [DOI] [PubMed] [Google Scholar]
- 47. Mehrotra R, Kermah D, Budoff M, et al. Hypovitaminosis D in chronic kidney disease. Clin J Am Soc Nephrol. 2008;3(4):1144–1151. [DOI] [PMC free article] [PubMed] [Google Scholar]
- 48. Bouillon R, Sarandeses LA, Allewaert K, et al. Biologic activity of dihydroxylated 19‐nor‐(pre)vitamin D3. J Bone Miner Res. 1993;8(8):1009–1015. [DOI] [PubMed] [Google Scholar]
- 49. Burt VL, Whelton P, Roccella EJ, et al. Prevalence of hypertension in the US adult population. Results from the Third National Health and Nutrition Examination Survey, 1988–1991. Hypertension. 1995;25(3):305–313. [DOI] [PubMed] [Google Scholar]
- 50. Krause R, Buhring M, Hopfenmuller W, et al. Ultraviolet B and blood pressure. Lancet. 1998;352(9129):709–710. [DOI] [PubMed] [Google Scholar]
- 51. Peterlik M, Cross HS. Vitamin D and calcium deficits predispose for multiple chronic diseases. Eur J Clin Invest. 2005;35(5):290–304. [DOI] [PubMed] [Google Scholar]
- 52. Hulter HN, Melby JC, Peterson JC, et al. Chronic continuous PTH infusion results in hypertension in normal subjects. J Clin Hypertens. 1986;2(4):360–370. [PubMed] [Google Scholar]
- 53. Fitzpatrick LA, Bilezikian JP, Silverberg SJ. Parathyroid hormone and the cardiovascular system. Curr Osteoporos Rep. 2008;6(2):77–83. [DOI] [PubMed] [Google Scholar]
- 54. Xiang W, Kong J, Chen S, et al. Cardiac hypertrophy in vitamin D receptor knockout mice: role of the systemic and cardiac renin‐angiotensin systems. Am J Physiol Endocrinol Metab. 2005;288(1):E125–E132. [DOI] [PubMed] [Google Scholar]
- 55. Zhou C, Lu F, Cao K, et al. Calcium‐independent and 1,25(OH)2D3‐dependent regulation of the renin‐angiotensin system in 1alpha‐hydroxylase knockout mice. Kidney Int. 2008;74(2):170–179. [DOI] [PubMed] [Google Scholar]
Associated Data
This section collects any data citations, data availability statements, or supplementary materials included in this article.
Supplementary Materials
Table S1. The hypertension registry of The Permanente Medical Group
Supporting info item