

Abstract
Hyperuricemia is a common finding in hypertensive patients, especially among those who are on diuretic therapy. However, its clinical relevance regarding cardiovascular and chronic kidney disease (CKD) has not clearly been established. The authors assessed whether, in a population of 385 hypertensive women categorized according to diuretic therapy, the stratification in quartiles by uric acid levels would identify a gradient of changes in renal function and in risk factors for cardiovascular disease. The following were evaluated: serum uric acid, glycemia, total and fractional cholesterol, triglycerides, apolipoprotein (Apo) B, Apo A‐I, and C‐reactive protein. Renal function was assessed by serum creatinine, albuminuria, and estimated glomerular filtration rate (eGFR) by the Modification of Diet in Renal Disease equation, whereas cardiovascular risk was estimated through the Framingham score. A total of 246 women were on diuretic therapy; 139 were taking other antihypertensive medications. There was a reduction in eGFR parallel to the increase in uric acid levels, regardless of diuretic use and without a concomitant increase in albuminuria. In both groups, higher uric acid levels translated into an increase in metabolic syndrome components, in markers of insulin resistance, triglyceride/high‐density lipoprotein levels, and Apo B/Apo A‐I ratios, as well as in Framingham scores. Hyperuricemia was associated with an increase in inflammatory markers only in patients on diuretic therapy. In a binary logistic regression, hyperuricemia (uric acid >6.0 mg/dL) was independently associated with CKD (eGFR <60 mL/min/1.73 m²) (odds ratio, 2.63; 95% confidence interval, 1.61–4.3; P<.001). In hypertensive women, the presence of hyperuricemia indicated a substantial degree of kidney dysfunction as well as a greater cardiovascular risk profile.
Hyperuricemia is a clinical finding in 25% to 40% of adult patients with untreated hypertension. Most commonly it is asymptomatic if it is not accompanied by clinically related conditions, such as gout and nephrolithiasis. 1 , 2 In hypertensive patients, there is an impairment in the tubular secretion of uric acid, 3 which may be a sign of early renal vascular involvement due to hypertension, specifically nephrosclerosis. 4 In addition, essential hypertension is an insulin‐resistant state per se, 5 and the compensatory hyperinsulinemia results in a significant reduction in renal uric acid clearance. 6 Diuretic use may also contribute to higher serum uric acid levels. 7 This effect is dose‐dependent and related to the corresponding volume depletion. 8
Although hyperuricemia has long been known to be associated with essential hypertension, 1 , 2 its clinical relevance was ignored for a long time. Partially, this happened because of the strong correlation seen among uric acid and other risk factors for renal and cardiovascular (CV) disease, especially those related to insulin resistance. 9 This also may have happened as a result of the rise in serum urate levels in patients taking diuretics, 10 which made it difficult to recognize uric acid as an independent risk factor. In the late 1990s, an appropriate animal model was developed that allowed the study of sustained mild hyperuricemia. 11 The experimental results indicate that mild hyperuricemia induces systemic hypertension and renal injury without intrarenal crystal deposition but is related to renal vasoconstriction through endothelial dysfunction and renin‐angiotensin system (RAS) activation. 11 , 12 , 13 , 14 Even considering that those experimental observations demonstrated the pathogenic role of uric acid, not all epidemiologic study data have identified hyperuricemia as an independent predictor of renal and CV diseases. 15 , 16 , 17 , 18
The objective of this study was to assess whether stratification by uric acid levels allows the identification of a gradient of change in renal function and in CV risk factors in a population of hypertensive women. As a secondary objective, we tested the hypothesis that hyperuricemia is associated with chronic kidney disease (CKD) regardless of diuretic therapy.
Methods
In total, 385 individuals were selected from outpatients at the Hypertension and Cardiovascular Metabolism Unit of the Universidade Federal de São Paulo (UNIFESP, Federal University of São Paulo). Patients were selected based on the following inclusion criteria: (1) female sex; and (2) essential hypertension defined according to the criteria of the Seventh Report of the Joint National Committee on Prevention, Detection, and Treatment of High Blood Pressure (JNC 7). 19 Our sample was restricted to women due to the more prominent impact of hyperuricemia in CV and renal outcomes in this sex. 20 , 21 , 22 Patients with known or suspected secondary hypertension, as well as those who were treated with allopurinol, were excluded from the study. The study was approved by the UNIFESP Research in Ethics Committee. All participating patients gave written informed consent. The study design was cross‐sectional, and the patients were evaluated during the period from January to July of 2007.
Clinical Evaluation
A registry was created in order to record comorbidities, medication use, and history of CV disease. CV disease was defined as the presence of coronary heart disease (CHD) (evidence of silent myocardial infarction or myocardial ischemia, history of unstable angina or stable angina pectoris, and history of coronary angioplasty or coronary artery surgery) or CHD risk equivalent (peripheral arterial disease, abdominal aortic aneurysm, carotid artery disease, renal artery disease), according to American Heart Association guidelines. 23 Menopause was defined as the absence of menstrual cycles for at least 1 year. Patients receiving hormone replacement therapy were included in the nonmenopausal group.
The diagnosis of diabetes mellitus was based on the criteria established by the American Diabetes Association. 24 We identified the metabolic syndrome (MS) based on the diagnostic criteria established by the International Diabetes Federation. 25
Patients were submitted to anthropometric evaluation, which included the determination of weight, height, waist circumference, and body mass index (BMI).
Blood pressure values measured in the clinical evaluation are expressed as the mean of 2 measurements.
Laboratory Testing
Patients were instructed to discontinue lipid‐lowering drugs (statins, fibrates, nicotinic acid) 1 month before the laboratory testing in order to better characterize the lipid profile.
Fasting glycemia, as well as serum levels of total cholesterol and triglycerides, were determined by colorimetric enzymatic methods. Levels of high‐density lipoprotein (HDL) cholesterol were measured through homogeneous colorimetric enzymatic method, and low‐density lipoprotein (LDL) cholesterol levels were calculated using the Friedewald formula. The analyzer used was the Roche Hitachi 912 (Roche Hitachi, Montreal, QC, Canada).
Serum uric acid levels were determined through urease enzymatic method (Cobas Mira Plus; Roche, Indianapolis, IN), and serum levels of C‐reactive protein (CRP) were determined through chemiluminescence immunoassay, with an analytical sensitivity of 0.01 mg/dL, intra‐assay variability of 4.2% to 6.4%, and interassay variability of 4.8% to 10%.
Renal evaluation was made through the determination of serum creatinine levels, levels of albuminuria, and estimated glomerular filtration rate (eGFR) based on the equation derived from the Modification of Diet in Renal Disease (MDRD) study. 26 CKD definition was based on eGFR values <60 mL/min/1.73 m2. 27
Serum creatinine levels were measured by a method using the principle of reaction with picrate solution in alkaline medium. This method has been calibrated to be traceable to isotope dilution mass spectrometry, as recommended by the National Kidney Disease Education Program. 28
Albuminuria was determined in 12‐hour overnight urine samples through immunoturbidimetry, with normal values defined as a urinary albumin excretion rate <20 μg/min.
Levels of apolipoprotein (Apo) B and Apo A‐I were quantified through immunoturbidimetry in the Cobas Mira Plus apparatus, analytical sensitivity being 15 mg/L for the former and 6 mg/L for the latter. The relationship between these Apo levels, referred to as Apo B/Apo A‐I ratio, was used in this study as an insulin resistance marker, in addition to the triglyceride/HDL ratio, as previously demonstrated. 29 , 30 Serum samples were stored at −80°C.
CV Risk Estimation
The Framingham score, which is based on age, sex, total cholesterol, HDL cholesterol, systolic blood pressure, and smoking was calculated in order to estimate the risk of CHD in 10 years, according to the obtained score. 31
Statistical Analysis
The population studied was stratified based on the diuretic use, being subsequently analyzed in quartiles, according to serum concentrations of uric acid obtained in the group as a whole.
We used analysis of variance to compare the quantitative variables, expressed as mean and standard deviation, and the chi‐square test to compare the qualitative variables, with P value expressing statistical significance among quartiles within each group (users and non‐users of diuretics).
For quantitative variables without normal distribution, the Kruskal–Wallis test was used.
Univariate statistical analyses (chi‐square) were performed in order to study the association of CKD (eGFR <60 mL/min/1.73 m2) with hyperuricemia (serum uric acid levels above the 75th percentile obtained in the sample as a whole), age older than 55 years, waist circumference >80 cm, HDL cholesterol <50 mg/dL, triglycerides >150 mg/dL, fasting glucose ≥100 mg/dL or diabetes, tobacco use, albuminuria >20 μ/min, LDL cholesterol >130 mg/dL, CV disease, and diuretic therapy. Significant univariate predictors (P<.05) were included in binary logistic regression analysis.
The statistical significance level was set at P<.05 for all the conclusions obtained through inferential analysis.
The statistical analysis was carried out using SPSS, version 15.0 (SPSS Inc, Chicago, IL).
Results
A total of 385 hypertensive women were analyzed, divided into 2 groups based on diuretic use. Of these, 246 were on diuretic therapy and 139 were taking other nondiuretic antihypertensive medications. Regarding diuretic therapy, most patients were treated with hydrochlorothiazide (96%), and the most commonly used dosage was 25 mg (79.9%), followed by 12.5 mg (16.7%) and 50 mg (3.4%). The remaining patients were treated with furosemide (4%). The impact that stratifying the patients by uric acid levels had on the parameters analyzed is shown in Table I.
Table I.
General Characteristics: Stratified Sample by Uric Acid Quartiles
| Diuretic Users | Non‐Users of Diuretics | |||||||
|---|---|---|---|---|---|---|---|---|
| Parameter | 1st quartile (2.0–4.2 mg/dL) (n=51) | 2nd quartile (4.3–5.0 mg/dL) (n=57) | 3rd quartile (5.1–6.0 mg/dL) (n=59) | 4th quartile (6.1–10.0 mg/dL) (n=79) | 1st quartile (2.0–4.2 mg/dL) (n=40) | 2nd quartile (4.3–5.0 mg/dL) (n=38) | 3rd quartile (5.1–6.0 mg/dL) (n=37) | 4th quartile (6.1–10.0 mg/dL) (n=24) |
| Age, y | 57.3±9.1 | 56.7±8.5 | 58.1±9.4 | 59.4±8.8 | 54.6±11.7 | 58.1±10.8 | 58.5±9.9 | 63.2±9.0b |
| DM, % | 33.3 | 26.3 | 20.3 | 39.2 | 25.0 | 21.1 | 35.1 | 25.0 |
| Menopause, % | 72.5 | 71.9 | 74.6 | 82.3 | 50.0 | 68.4 | 75.7 | 87.5b |
| Smoking, % | 7.8 | 7.0 | 3.4 | 11.4 | 5.0 | 2.6 | 8.1 | 12.5 |
| CVD, % | 2.0 | – | 11.9 | 15.2a | 7.5 | 15.8 | 5.4 | 8.3 |
| ACEI/ARB use, % | 70.6 | 80.7 | 72.9 | 79.7 | 52.5 | 65.8 | 70.3 | 70.8 |
| BMI, kg/m² | 29.0±4.9 | 29.6±5.9 | 31.2±5.2 | 33.1±5.3a | 27.4±5.4 | 28.8±4.9 | 31.3±4.9 | 30.5±4.5a |
| SBP, mm Hg | 138±16 | 136±14 | 139±23 | 138±18 | 137±16 | 140±13 | 139±19 | 140±23 |
| DBP, mm Hg | 84±12 | 85±9 | 86±11 | 86±13 | 86±10 | 85±7 | 85±8 | 82±10 |
| Waist, cm | 91.1±12.4 | 92.5±13.8 | 97.4±11.1 | 101.6±10.0a | 89.0±12.8 | 93.1±10.4 | 98.7±10.9 | 98.5±12.2a |
| HDL‐C, mg/dL | 66.3±17.1 | 61.2±12.1 | 55.8±13.6 | 55.2±14.2a | 64.6±17.6 | 61.0±14.7 | 57.8±11.7 | 56.5±20.9 |
| LDL‐C, mg/dL | 115.5±31.3 | 124.2±32.3 | 122.4±29.6 | 129.0±39.5 | 127.6±39.4 | 139.3±42.2 | 123.6±31.5 | 131.1±43.9 |
| Triglycerides, mg/dL | 129.3±65.8 | 127.0±81.8 | 160.4±79.5 | 178.8±99.2a | 116.5±48.2 | 127.4±54.5 | 147.7±74.0 | 194.1±121.1a |
| Glycemia, mg/dL | 105.1±43.4 | 96.2±35.8 | 98.3±31.5 | 111.7±37.9 | 106.2±59.8 | 97.4±32.7 | 97.8±38.3 | 102.2±35.2 |
| Uric acid, mg/dL | 3.62±0.48 | 4.62±0.21 | 5.57±0.28 | 7.18±0.89 | 3.58±0.57 | 4.7±0.24 | 5.44±0.28 | 6.9±0.83 |
| Creatinine, mg/dL | 0.85±0.1 | 0.94±0.12 | 0.95±0.14 | 1.04±0.27a | 0.86±0.09 | 0.95±0.17 | 0.92±0.18 | 0.95±0.13 |
| Leukocytes, N/mm³ | 5496±1622 | 5998±1762 | 6355±2344 | 6619±2059b | 6095±1900 | 5955±2005 | 6340±2168 | 6473±1762 |
| Albuminuria, μg/min | 16.8±28.8 | 7.8±10.5 | 17.2±47.5 | 45.8±133.3 | 14.2±27.6 | 48.8±237.6 | 53.4±210.3 | 9.0±15.0 |
| eGFR (MDRD), mL/min/1.73 m² | 76.6±11.6 | 68.5±10.3 | 66.4±10.6 | 62.5±15.5a | 74.5±10.7 | 67.8±13.2 | 72.2±17.3 | 65.1±13.6b |
| TG/HDL | 2.21±1.63 | 2.31±2.16 | 3.07±1.83 | 3.61±2.62a | 2.05±1.27 | 2.31±1.35 | 2.72±1.51 | 4.04±3.15a |
| Apo B/apo A‐I | 0.67±0.21 | 0.73±0.2 | 0.74±0.17 | 0.82±0.21a | 0.71±0.27 | 0.75±0.2 | 0.74±0.21 | 0.78±0.19 |
| CRP, mg/dL | 0.41±0.45 | 0.58±0.70 | 0.77±0.73 | 0.84±0.77c | 0.4±0.35 | 0.63±1.15 | 0.57±0.49 | 0.73±0.7 |
| Framingham score | 14.8±3.3 | 14.8±3.5 | 15.2±4.3 | 16.5±3.2b | 13.0±5.2 | 15.3±3.9 | 15.4±3.6 | 17.3±2.9a |
Abbreviations: ACEI, angiotensin‐converting enzyme inhibitor; ARB, angiotensin II receptor blocker; Apo, apolipoprotein; BMI, body mass index; CRP, C‐reactive protein; CVD, cardiovascular disease; DBP, diastolic blood pressure; DM, diabetes mellitus; eGFR, estimated glomerular filtration rate; HDL‐C, high‐density lipoprotein cholesterol; LDL‐C, low‐density lipoprotein cholesterol; MDRD, modification of diet in renal disease; SBP, systolic blood pressure; TG, triglycerides. a P<.01 intragroup. b P<.05 intragroup. c P<.05 intragroup (Kruskal–Wallis test).
An increase in serum uric acid levels was associated with advanced age, as well as with menopause, only in the group of women who were not using diuretics (Table I).
We found that in both groups, an elevated uric acid level was associated with higher BMI, greater waist circumference, higher triglyceride levels, a greater number of MS components, a higher triglyceride/HDL ratio, and a higher Framingham score (Table I). There was also a reduction in the eGFR parallel to the increase in the uric acid level, which occurred regardless of the use of diuretics (Table I).
Only diuretic users presented a significant elevation of the inflammatory marker levels, CRP, and leukocyte counts, as well as higher values of Apo B/Apo A‐I ratio, which occurred in parallel with increases in serum uric acid levels (Table I).
When we stratified the sample by the number of MS components, we observed a progressive increase in uric acid levels, which reached the maximum value in patients presenting with 4 MS components (Figure).
Figure.
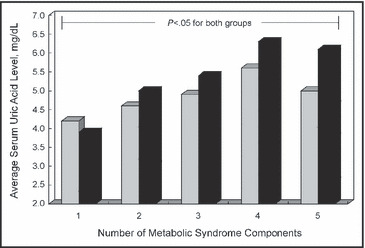
Average serum uric acid levels according to the number of metabolic syndrome components and diuretic therapy. Grey squares indicate non‐users of diuretics; black squares, users of diuretics.
In the univariate analysis, hyperuricemia (uric acid >6.0 mg/dL), HDL cholesterol <50 mg/dL, and age 55 years and older had a significant association with CKD (Table II). These significant factors in the univariate analysis were simultaneously assessed in the binary logistic regression, where hyperuricemia (odds ratio, 2.63; 95% confidence interval, 1.61–4.3; P<.001) and age 55 years and older (odds ratio, 2.54; 95% confidence interval, 1.55–4.17; P<.001) remained significantly associated with CKD.
Table II.
Univariate Analysis for the Association With Chronic Kidney Disease
| Parameter | Chronic Kidney Disease | |
|---|---|---|
| OR (95% CI) | P Value | |
| Age ≥55 y | 2.79 (1.72–4.50) | <.001 |
| Waist >80 cm | 0.93 (0.45–1.95) | .85 |
| HDL cholesterol <50 mg/dL | 1.67 (1.04–2.68) | .03 |
| Triglycerides >150 mg/dL | 0.79 (0.5–1.24) | .36 |
| Fasting glucose ≥100 mg/dL or diabetes | 0.93 (0.59–1.47) | .82 |
| Smoking | 0.53 (0.21–1.34) | .21 |
| Albuminuria >20 μ/min | 1.24 (0.7–2.28) | .45 |
| LDL cholesterol >130 mg/dL | 1.01 (0.65–1.58) | >.99 |
| Diuretic use | 1.02 (0.65–1.60) | >.99 |
| Serum uric acid >6.0 mg/dL | 3.14 (1.95–5.05) | <.001 |
| Cardiovascular disease | 1.78 (0.86–3.67) | .12 |
Abbreviations: CI, confidence interval; HDL, high‐density lipoprotein; LDL, low‐density lipoprotein; OR, odds ratio.
Discussion
The results of the present study indicate that in hypertensive women, higher serum uric acid levels are associated with impaired renal function, characterized by reductions in eGFR. This gradient of renal dysfunction observed along the uric acid quartiles occurred regardless of the use of diuretics and was not followed by a concomitant increase in urinary excretion of albumin. In addition, patients with higher uric acid levels had a worse CV risk profile, reflected by higher values of insulin resistance indexes, number of MS components, and Framingham scores.
Our data showing a correlation between renal dysfunction and higher uric acid levels are in accordance with the data obtained by Iseki and colleagues, 20 who demonstrated that in women, hyperuricemia (serum uric acid ≥6 mg/dL) was an independent predictive factor of CKD. A reduction in GFR might explain hyperuricemia due to the consequent reduction in the excretion of uric acid. 32 However, it has been demonstrated that the risk of evolving to CKD remains the same even after the adjustment for baseline values of serum creatinine. 33 Nevertheless, we cannot rule out the influence of diuretic therapy on the results of that study, since the medication in use was not recorded. Our data indicate that, regardless of diuretic therapy, uricemia increases in parallel with reduction in renal function. The magnitude of the correlation between uric acid and CKD was not reproduced in the study conducted by Chonchol and colleagues, 16 in which baseline levels of uric acid had a weak association with a subsequent reduction in eGFR during a 9‐year follow‐up period. In that study, the sample was divided into uric acid quintiles, without stratification by sex. Taking into consideration the fact that uric acid levels are different between men and women due to uricosuric action of estrogen, 33 it is possible that this type of analysis contributed to the differences observed between our results and those from Chonchol and colleagues. It has also been demonstrated that uric acid acts as a risk factor for CKD, 20 left ventricle hypertrophy, 21 and CV disease 22 only in women, suggesting that hyperuricemia and its clinical repercussions are more restricted to the female sex.
Studies involving animal models have demonstrated that hyperuricemia is more than a marker of GFR reduction. An induced increase in uric acid levels in rats resulted in glomerular hypertension, systemic arterial hypertension, activation of the RAS, afferent arteriosclerosis, and renal interstitial inflammation, culminating in fibrosis. 12 , 14 , 34 In addition, an allopurinol‐induced reduction in serum uric acid levels has been shown to prevent the development of hypertension, as well as to avert changes in the levels of renin and nitric oxide synthase. 12 In humans, the use of allopurinol has also been shown to promote benefits in the preservation of renal function in hyperuricemic individuals with established CKD, 35 as well as in individuals with preserved GFR, 36 showing the importance of recognizing and treating hyperuricemia.
A better understanding of the mechanisms responsible for the beneficial effect of allopurinol is needed, however. Either the reduction of uric acid or a reduction in xanthine oxidase–associated oxidants can be related to those effects. 14 , 34 , 37 In terms of kidney function and blood pressure, the experimental studies suggest that the benefits result from lowering uric acid itself, whether it is achieved through xanthine oxidase blockade or through uricosuric agents. 14 , 34 On the other hand, patients with chronic heart failure treated with allopurinol exhibited an improvement in endothelial function, which did not occur among patients who received a uricosuric agent, even for the same degree of urate lowering. 37
The fact that hyperuricemia correlated with higher triglyceride/HDL and Apo‐B/Apo A‐I ratios provides indirect evidence that hyperuricemia identifies individuals with insulin resistance and a higher CV risk. Increases in these ratios characterize a proatherogenic state, which has been associated with CV events. 38 , 39 The existence of a subclinical inflammatory process is also part of the physiopathology of arteriosclerotic disease, 40 and the increase in inflammatory markers associated with hyperuricemia may contribute to this unfavorable CV scenario. 41 In our study, however, we observed a significant association between a proinflammatory state and hyperuricemia only in patients on diuretic therapy. This might be explained by the fact that thiazide treatment, potentially via RAS activation, may trigger a low‐grade inflammation. 42 To date, there are no data to indicate that greater uricemia has clinical implications that are different for individuals using diuretics than for those not using such medications. However, in diuretic users (on chlorthalidone), the Systolic Hypertension in the Elderly Program (SHEP) study showed that participants presenting a >1.0 mg/dL increase in uric acid levels did not experience a reduction in the rate of CV events. 43 Therefore, the higher uric acid levels in diuretic users should be considered in treatment management.
Conclusions
In hypertensive women, higher levels of uric acid are independently associated with a substantial degree of renal dysfunction. Hyperuricemia was more closely related to changes in inflammatory markers in patients on diuretic therapy. However, a uric acid increase should be viewed independently of antihypertensive therapy. It identified renal dysfunction and a worse CV risk profile regardless of diuretic therapy. It has not been formally recommended that asymptomatic hyperuricemia be treated. Long‐term intervention studies are necessary in order to clarify whether uric acid reduction would translate into better renal and CV outcomes in a hypertensive population.
Disclosure: The manuscript was supported by grants from Fundação de Amparo à Pesquisa do Estado de São Paulo (FAPESP).
References
- 1. Cannon PJ, Stason WB, Demartini FE, et al. Hyperuricemia in primary and renal hypertension. N Engl J Med. 1966;275:457–464. [DOI] [PubMed] [Google Scholar]
- 2. Kinsey D, Walther R, Sise HS, et al. Incidence of hyperuricemia in 400 hypertensive subjects. Circulation. 1961;24:972–973. [Google Scholar]
- 3. Tykarski A. Evaluation of renal handling of uric acid in essential hypertension: hyperuricemia related to decreased urate secretion Nephron. 1991;59:364–368. [DOI] [PubMed] [Google Scholar]
- 4. Messerli FH, Frohlich ED, Dreslinki DR, et al. Serum uric acid in essential hypertension : an indicator of renal vascular involvement. Ann Intern Med. 1980;93:817–821. [DOI] [PubMed] [Google Scholar]
- 5. Pollare T, Lithell H, Berne C. Insulin resistance is a characteristic feature of primary hypertension independent of obesity. Metabolism. 1990;39:167–174. [DOI] [PubMed] [Google Scholar]
- 6. Muscelli E, Natali A, Bianchi S, et al. Effect of insulin on renal sodium and uric acid handling in essential hypertension. Am J Hypertens. 1996;9:746–752. [DOI] [PubMed] [Google Scholar]
- 7. Kahn AM. Effect of diuretics on the renal handling of urate. Semin Nephrol. 1988;8(3):305–314. [PubMed] [Google Scholar]
- 8. Carlsen JE, Kober L, Torp‐Pedersen C, et al. Relation between dose of bendrofluazide, antihypertensive effect, and adverse biochemical effects. BMJ. 1990;300:975–978. [DOI] [PMC free article] [PubMed] [Google Scholar]
- 9. Rathmann W, Funkhouser E, Dyer AR, et al. Relations of hyperuricemia with the various components of the insulin resistance syndrome in young black and white adults: the CARDIA study (Coronary Artery Risk Development in Young Adults). Ann Epidemiol. 1998;8:250–261. [DOI] [PubMed] [Google Scholar]
- 10. Culleton BR, Larson MG, Kannel WB, et al. Serum uric acid and risk for cardiovascular disease and death: the Framingham Heart Study. Ann Intern Med. 1999;131(1):7–13. [DOI] [PubMed] [Google Scholar]
- 11. Mazzali M, Hughes J, Kim YG, et al. Elevated uric acid increases blood pressure in the rat by a novel crystal‐independent mechanism. Hypertension. 2001;38:1101–1106. [DOI] [PubMed] [Google Scholar]
- 12. Sánchez‐Lozada LG, Tapia E, Avila‐Casado C, et al. Mild hyperuricemia induces glomerular hypertension in normal rats. Am J Physiol Renal Physiol. 2002;283:F1105–F1110. [DOI] [PubMed] [Google Scholar]
- 13. Sánchez‐Lozada LG, Tapia E, Santamaria J, et al. Mild hyperuricemia induces vasoconstriction and maintains glomerular hypertension in normal and remnant kidney rats. Kidney Int. 2005;67:237–245. [DOI] [PubMed] [Google Scholar]
- 14. Kang DH, Nakagawa T, Feng L, et al. A role for uric acid in the progression of renal disease. J Am Soc Nephrol. 2002;13(12):2888–2897. [DOI] [PubMed] [Google Scholar]
- 15. Ishani A, Grandits GA, Grimm RH, et al. Association of single measurements of dipstick proteinuria, estimated glomerular filtration rate, and hematocrit with 25‐year incidence of end‐stage renal disease in the multiple risk factor intervention trial. J Am Soc Nephrol. 2006;17:1444–1452. [DOI] [PubMed] [Google Scholar]
- 16. Chonchol MB, Shlipak MG, Katz R, et al. Relationship of uric acid with progression of kidney disease. Am J Kidney Dis. 2007;50:239–247. [DOI] [PubMed] [Google Scholar]
- 17. Moriarity JT, Folsom AR, Iribarren C, et al. Serum uric acid and risk of coronary heart disease: therosclerosis Risk in Communities (ARIC) Study. Ann Epidemiol. 2000;10:136–143. [DOI] [PubMed] [Google Scholar]
- 18. Alderman MH, Cohen H, Madhavan S, et al. Serum uric acid and cardiovascular events in successfully treated hypertensive patients. Hypertension. 1999;34:144–150. [DOI] [PubMed] [Google Scholar]
- 19. Chobanian AV, Bakris GL, Black HR, et al. The Seventh Report of the Joint National Committee on prevention, detection, evaluation, and treatment of high blood pressure. JAMA. 2003; 289(19):2560–2572. [DOI] [PubMed] [Google Scholar]
- 20. Iseki K, Ikemiya Y, Inoue T, et al. Significance of hyperuricemia as a risk factor for developing ESRD in a screened cohort. Am J Kidney Dis. 2004;44:642–650. [PubMed] [Google Scholar]
- 21. Matsumura K, Ohtsubo T, Oniki Hideyuki, et al. Gender‐related association of serum uric acid and left ventricular hypertrophy in hypertension. Circ J. 2006;70:885–888. [DOI] [PubMed] [Google Scholar]
- 22. Freedman DS, Williamson DF, Gunter EW, et al. Relation of serum uric acid to mortality and ischemic heart disease. The NHANES I Epidemiologic Follow‐up Study. Am J Epidemiol. 1995;141:637–644. [DOI] [PubMed] [Google Scholar]
- 23. Expert Panel on Detection, Evaluation, and Treatment of High Blood Cholesterol in Adults . Third Report of the National Cholesterol Education Program (NCEP) Expert Panel on Detection, Evaluation, and Treatment of High Blood Cholesterol in Adults (Adult Treatment Panel III) Final Report. Circulation. 2002;106;3143–3421. [PubMed] [Google Scholar]
- 24. American Diabetes Association . Standards of medical care in diabetes – 2006. Diab Care. 2006;29:S4–S85. [PubMed] [Google Scholar]
- 25. Alberti KG, Zimmet P, Shaw J. Metabolic syndrome: a new world‐wide definition: a consensus statement from the International Diabetes Federation. Diabet Med. 2006;23:469–480. [DOI] [PubMed] [Google Scholar]
- 26. Levey SA, Coresh J, Greene T, et al. Expressing the modification of diet in renal disease study equation for estimating glomerular filtration rate with standardized serum creatinine values. Clin Chem. 2007;53(4):766–772. [DOI] [PubMed] [Google Scholar]
- 27. Levey AS, Coresh J, Balk E, et al; National Kidney Foundation . National Kidney Foundation practice guidelines for chronic kidney disease: evaluation, classification, and stratification. Ann Intern Med. 2003;139:137–147. [DOI] [PubMed] [Google Scholar]
- 28. Myers GL, Miller WG, Coresh J, et al. Recommendations for improving serum creatinine measurement: a report from the Laboratory Working Group of the National Kidney Disease Education Program. Clin Chem. 2006;52:5–18. [DOI] [PubMed] [Google Scholar]
- 29. Sierra‐Johnson J, Romero‐Corral A, Somers VK, et al. ApoB/Apo A‐I ratio : an independent predictor of insulin resistance in US non‐diabetic subjects. Eur Heart J. 2007;28:2637–2643. [DOI] [PubMed] [Google Scholar]
- 30. McLaughlin T, Abbasi F, Cheal K, et al. Use of metabolic markers to identify overweight individuals who are insulin resistant. Ann Intern Med. 2003;139(10):802–809. [DOI] [PubMed] [Google Scholar]
- 31. Expert panel on detection, evaluation, and treatment of high blood cholesterol in adults . Executive Summary of The Third Report of The National Cholesterol Education Program (NCEP) Expert Panel on Detection, Evaluation, And Treatment of High Blood Cholesterol In Adults (Adult Treatment Panel III). JAMA. 2001;285(19):2486–2497. [DOI] [PubMed] [Google Scholar]
- 32. Vaziri ND, Freel RW, Hatch M. Effect of chronic experimental renal insufficiency on urate metabolism. J Am Soc Nephrol. 1995;6:1313–1317. [DOI] [PubMed] [Google Scholar]
- 33. Nicholls A, Snaith ML, Scott JT. Effect of oestrogen therapy on plasma and urinary levels of uric acid. BMJ. 1973;1:449–451. [DOI] [PMC free article] [PubMed] [Google Scholar]
- 34. Mazzali M, Kanellis J, Han L, et al. Hyperuricemia induces a primary renal arteriolopathy in rats by a blood pressure independent mechanism. Am J Physiol Renal Physiol. 2002;282:F991–F997. [DOI] [PubMed] [Google Scholar]
- 35. Siu YP, Leung KT, Tong MK, et al. Use of allopurinol in slowing the progression of renal disease through its ability to lower serum uric acid level. Am J Kidney Dis. 2006;47(1):51–59. [DOI] [PubMed] [Google Scholar]
- 36. Kanbay M, Ozkara A, Selcoki Y, et al. Effect of treatment of hyperuricemia with allopurinol on blood pressure, creatinine clearence, and proteinuria in patients with normal renal functions. Int J Urol. 2007;39(4):1227–1233. [DOI] [PubMed] [Google Scholar]
- 37. George J, Carr E, Davies J, et al. High‐dose allopurinol improves endothelial function by profoundly reducing vascular oxidative stress and not by lowering uric acid. Circulation. 2006;114:2508–2516. [DOI] [PubMed] [Google Scholar]
- 38. Thompson A, Daneson J. Associations between apolipoprotein B, apolipoprotein AI, the apolipoprotein B/AI ratio and coronary heart disease: a literature‐based metanalysis of prospective studies. J Intern Med. 2006;259(5):481–492. [DOI] [PubMed] [Google Scholar]
- 39. Jeppesen J, Hein HO, Suadicani P, et al. Low triglycerides‐ high high‐density lipoprotein cholesterol and risk of ischemic heart disease. Arch Intern Med. 2001;161(3):361–366. [DOI] [PubMed] [Google Scholar]
- 40. Hansson GK. Inflammation, atherosclerosis, and coronary artery disease. N Engl J Med. 2005;352(16):1685–1695. [DOI] [PubMed] [Google Scholar]
- 41. Kang DH, Park SK, Lee IK, et al. Uric acid‐induced C‐reactive protein expression: implication on cell proliferation and nitric oxide production of human vascular cells. J Am Soc Nephrol. 2005;16(12):3553–3562. [DOI] [PubMed] [Google Scholar]
- 42. Eriksson JW, Jansson PA, Carlberg Bo, et al. Hydrochlorothiazide, but not candesartan, aggravates insulin resistance and causes visceral and hepatic fat accumulation: the mechanisms for the diabetes preventing effect of candesartan (MEDICA) study. Hypertension. 2008;52(6):1030–1037. [DOI] [PubMed] [Google Scholar]
- 43. Franse LV, Pahor M, Di Bari M, et al. Serum uric acid, diuretic treatment and risk of cardiovascular events in the Systolic Hypertension in the Elderly Program (SHEP). J Hypertens. 2000;18:1149–1154. [DOI] [PubMed] [Google Scholar]