

Abstract
J Clin Hypertens (Greenwich). 2010;12:22–28. © 2009 Wiley Periodicals, Inc.
Blood pressure (BP) readings taken by Omron HEM‐907XL were compared with the results obtained using sphygmomanometer (HgS) in 509 individuals using 2002 Association for the Advancement of Medical Instrumentation (AAMI) criteria. With the exception of diastolic BP in youth ages 13 to 19 years (mean difference, −1.77 mm Hg; standard deviation, 8.65), the Omron device met the criteria. Agreement for hypertension (BP ≥140/90 mm Hg) was above chance (κ=0.68) and, compared with HgS, Omron underestimated the prevalence of hypertension by 2.65%. The Omron and HgS measurements were highly correlated (r=0.94 for systolic BP and r=0.83 for diastolic BP). Both increased systolic and diastolic BP decreased device agreement (β‐coefficient=−0.10872, P<.0001; β‐coefficient=−0.25981, P<.0001, respectively). The Omron device meets AAMI criteria with the exception of diastolic BP in youth ages 13 to 19 years. However, Omron underestimated the prevalence of hypertension and device agreement decreases with increased systolic and diastolic BP.
For many years the gold standard employed in the National Health and Nutrition Examination Survey (NHANES) has been the mercury sphygmomanometer (HgS). However, because of the increased environmental concerns about the disposal of mercury‐contaminated medical waste and the risk of spills from such devices, the HgS is being phased out in clinical settings. 1 Blood pressure (BP) taken by a mercury device may be subject to observer bias because it depends on the accurate detection of Korotkoff sounds with a stethoscope. Oscillometric devices are increasingly used for BP measurement in clinical settings because of their ease and safety and also because they are free of observer bias. 2 However, aside from observer bias, recent studies suggested that the differences in performance between the devices could be influenced by increased BP, arrhythmias, and stiff arteries due to atherosclerosis. 2 , 3 , 4 , 5 , 6
Although, the Omron HEM‐907 BP monitor (Schaumburg, IL) has been previously validated, 4 , 6 , 7 all past validation studies were performed using a small sample and in study settings. We undertook this study because accurate BP measurements are critical for the estimation of the national‐level prevalence of high BP for different age groups.
This study had 3 objectives: (1) to directly compare the measurement of BP using the Omron HEM‐907XL against the HgS in youth and adults; (2) to assess the effect of the classification of hypertension (Seventh Report of the Joint National Committee on Prevention, Detection, Evaluation, and Treatment of High Blood Pressure [JNC 7]) on the differences between the 2 device readings; 8 and (3) to examine the influence of increased BP (systolic and diastolic) on the difference between the 2 device readings controlling for age, sex, body mass index (BMI), BP cuff size, and examiner effects.
Methods
Study Population
The study participants were from NHANES, a national‐level health survey of the civilian noninstitutionalized US population. 9 Descriptions of the sample design and data collection methods are available on the NHANES Web site. 9 , 10 Survey participants were interviewed in their homes and examined in Mobile Examination Centers (MECs). After completing the MEC examination portion, the participants were asked to volunteer for the validation study, described as an additional optional study. No randomization was attempted and the sample was a “convenience” sample. The National Center for Health Statistics (NCHS) ethics review board approved the study.
Sample Selection
During survey years 2006 and 2007, a total of 701 individuals aged 13 years and older agreed to participate in the mercury and automated device validation study. Only 509 (73%) individuals met the inclusion criteria set by the Association for the Advance of Medical Instrumentation (AAMI) guidelines for adults. 11 Among the participants, 308 were men (61%) and 201 (39%) were women. For this analysis, age was categorized into 3 groups: 13 to 19 years, 20 to 49 years, and 50 years and older. Among the age groups, 90 (18%) individuals were 13 to 19 years old; 134 (26%) individuals were 20 to 49 years old; and 285 (56%) were 50 years and older. The mean age of the participants was 49.4 years (standard deviation [SD], 22.02; range, 13–91 years).
The mean arm circumference among the participants was 32.5 cm (SD, 5.05; range, 22.5–56 cm). Four percent had arm circumference <25 cm, whereas 25% had an arm circumference >35 cm. Eight percent of the HgS systolic‐measured BP readings were >160 mm Hg and 12% were <100 mm Hg. Three percent of the HgS diastolic readings were >100 mm Hg and 32% were <60 mm Hg. The mean radial pulse value of the participants was 70.8 beats per minute) (SD, 12.19; range 44–121 beats per minute). No rhythm disturbances were noticed among participants.
Measurements
The Omron HEM‐907XL is a digital upper arm electronic BP monitor designed to be used in a clinical setting. According to the manufacturer information, the XL version of HEM‐907 is an updated version of HEM‐907; specifically, it has been upgraded to allow inflation of a larger size cuff. The algorithm range was expanded to accept the measurement for the larger arm circumference while still maintaining its validated margin of error (±0.3%). The Omron HEM‐907XL automatic measurements are based on smart “inflate” technology: inflation is driven by a pumping system and deflation by an electromagnetic control valve allowing rapid air release. This oscillometric device measurement scale ranged from 0 mm Hg to 280 mm Hg. A special function (“hide” mode) conceals BP values from an individual’s view, reducing examinee anxiety.
A medical wall‐mounted HgS (Baumanometer; W.A. Baum, Co, Inc, Copiague, NY) was used as the standard comparison device. Four cuff sizes (child, adult, large adult, and thigh), also manufactured by Baumanometer, were shared by both devices, (ie, no cuffs were changed between device readings, and Omron‐specific cuffs were not used in this study).
Measurement of BP
A standardized protocol was used to train each technician. The initial training was further supported by a biannual retraining and frequent quality assurance visits. The training protocol for the mercury device was similar to that used for training the NHANES physicians who perform survey BP. 12
The measurements were taken in a quiet room with an ambient temperature between 58°F and 83°F (average=76°F). Participants were seated in a chair with back support, with both feet resting comfortably on the floor and both forearms supported on a level surface. Appropriate BP cuff size was selected according to the mid‐arm circumference of the examinee. After a 5‐minute rest, the study participants had their BP measured. The order of device use was assigned at random. Each individual randomly received Omron or HgS readings first. Both the HgS measurements and Omron measurements were repeated at 30‐second intervals. The Omron device was set on the hide mode feature. Once the measurements were captured, the 3 Omron readings were recorded by a third staff member blinded to the mercury readings.
For the HgS condition, 2 technicians simultaneously listened to the brachial pulse using a Y‐tube stethoscope, each observing the mercury column, and each separately recording the 3 HgS readings (systolic K1 and diastolic K5) while being masked from the Omron readings. The selection of the technician who applied the cuff and controlled the BP valve (HgS condition) was randomized. The 2 measuring devices underwent daily, weekly, and monthly rigorous quality‐control procedures.
A total of 8 observers were involved in the BP comparative study. One hundred percent of the recorded results obtained by the 2 technicians’ simultaneous readings of the mercury manometer agreed within 10 mm Hg, and 90% agreed within 5 mm Hg. The two technicians’ simultaneous readings were significantly and highly correlated for both systolic BP (SBP) and diastolic BP (DBP) readings (systolic, r=0.99; diastolic, r=0.96 [P<.0001], respectively). The mean difference between observers was 0.42 mm Hg (SD, 3.11) for SBP and 0.58 mm Hg (SD, 3.14) for DBP. The zero end digit preference was 21% for the HgS‐observed SBP and 27% for the HgS‐observed DBP.
Other Measurements
Individual age was obtained at examination time. Height in centimeters (mean, 68.97 cm; SD, 9.98) and weight in kilograms (mean, 80.53 kg; SD, 20.15) were measured in the MEC following a standard protocol. BMI was calculated as weight in kilograms divided by the square of height in meters (kg/m2) (mean, 28.05; SD, 6.17).
Statistical Analyses
A total of 9 systolic and diastolic readings were obtained in the study: 3 pairs of SBP and DBP readings by the Omron device and 6 pairs of SBP and DBP readings by the 2 technicians simultaneously reading the HgS device. The Association for the AAMI guidelines method 2 (American National Standards Institute [ANSI]/AAMI SP10:2002) was used to compare the two devices. 11 The guidelines require 3 pairs of systolic and diastolic readings per device, testing a wide range of ages, with a heterogeneous group of at least 85 participants in each age subcategory tested varying arm circumferences and each participants’s SBP and DBP reading averaged for test and comparison device. The mean difference of the averaged SBP and DBP results of the test device (Omron, 3 determinations) and the comparison device (HgS, 6 determinations), ie, Omron minus HgS, were compared with the mean and SD defined in Table I of the guidelines. Also, the guidelines require a graphic display of differences against the means for systolic‐ and diastolic‐paired measurements separately (Bland/Altman graph) and the difference between the 2 devices reading in absolute percentages within 5, 10, and 15 mm Hg. 11
Table I.
Mean (SD) and Range of Systolic and Diastolic Readings by BP Measurement Device and Age Group
| Device | No. | Systolic BP, mm Hg | Diastolic BP, mm Hg | ||
|---|---|---|---|---|---|
| HgS | Omron | HgS | Omron | ||
| Overall | 509 | 122.3 (17.9) 90.6–208.6 | 120.6 (16.9)* 85.6–207.3 | 69.8 (11.7) 35.3–102.0 | 68.1 (11.2)a 40.6–109.6 |
| Age group, y | |||||
| 13–19 | 90 | 110.7 (9.8) 94.4–138.3 | 110.1 (8.8) 94.6–137.6 | 61.4 (9.8) 39.2–88.4 | 59.6 (7.5) 45.0–89.6 |
| 20–49 | 134 | 114.9 (12.3) 92.3–159.0 | 114.2 (12.5) 85.6–156.6 | 71.4 (11.3) 46.3–99.6 | 69.5 (11.0)a 45.6–102.0 |
| 50+ | 285 | 129.3 (18.8) 90.6–208.6 | 126.9 (17.9)a* 89.6–207.3 | 71.5 (11.4) 35.3–102.0 | 70.1 (11.1)a 40.6–109.6 |
Abbreviations: BP, blood pressure; HgS, sphygmomanometer; SD, standard deviation. a P<.0001
We compared the devices across 3 age groups: 13 to 19 years, 20 to 49 years, and 50+ years. We calculated sensitivity and specificity as well as κ statistic to assess the agreement between the devices, where HgS was considered the gold standard for systolic‐defined hypertension (SBP ≥140 mm Hg), diastolic‐defined hypertension (DBP ≥90 mm Hg), and stage 1 and higher hypertension (BP ≥140/90 mm Hg). 8 The hypertension classification values were based on the HgS readings at the time of the method study and pertained only to individuals 18 years and older.
The correlation between systolic and diastolic readings by each device was assessed using the Pearson correlation coefficient. Dependent t tests were used for individual group comparisons. Multiple linear regression analyses were conducted to model the association of HgS systolic‐ and diastolic‐measured BP readings on the magnitude of the difference in readings between the 2 devices for SBP and DBP controlling for age, sex, BMI, observers (dummy coded), and cuff sizes (dummy coded). Finally, the effect of the order of reading (HgS/Omron or Omron/HgS) was tested using paired t test. The α level for a significant test was considered to be P<.05.
Results
Between‐Device Agreement
Table I presents the mean and SD of HgS and Omron readings for SBP and DBP. The overall mean Omron readings for both SBP and DBP were significantly lower than HgS (P<.0001). Among the age groups, the Omron SBP readings were significantly lower for patients 50 years and older (P<.0001) and the DBP readings (P<.0001) were significantly lower for patients 18 to 49 years and 50 years and older.
Table II presents the mean and the DS of the differences between Omron and HgS readings (Omron‐HgS) for both SBP and DBP. The calculated SD for the difference between the devices for DBP readings among youth ages 13 to 19 years did not meet AAMI SD criteria. Otherwise, all other device comparisons meet AAMI criteria.
Table II.
Meana and SDb Difference Between BP Devices (Omron Readings – Mercury Readings) and Cumulative Percentage of BP Differences Between Omron and HgS ≤5, 10, and 15 mm Hg
| No. | Systolic | Diastolic | |
|---|---|---|---|
| Subgroup | Mean (SD) | Mean (SD) | |
| Overall | 509 | −1.62 (6.14) | −1.64 (6.63) |
| Age group, y | |||
| 13–19 | 90 | −0.57 (5.51) | −1.77 (8.65)b |
| 20–49 | 134 | −0.74 (5.94) | −1.87(6.57) |
| 50+ | 283 | −2.37 (6.34) | −1.50 (5.94) |
| Percentage with an absolute difference between Omron and HgS | |||
| ≤5 mm Hg | ≤10 mm Hg | ≤15 mm Hg | |
| Systolic BP | |||
| Overall | 62.67 | 91.16 | 98.62 |
| Age group, y | |||
| 13–19 | 71.11 | 94.44 | 98.89 |
| 20–49 | 73.13 | 94.03 | 97.76 |
| 50+ | 55.09 | 88.77 | 98.95 |
| Diastolic BP | |||
| Overall | 57.43 | 86.93 | 98.02 |
| Age group, y | |||
| 13–19 | 41.86 | 74.42 | 93.02 |
| 20–49 | 52.59 | 85.93 | 100.0 |
| 50+ | 64.44 | 91.20 | 98.59 |
Abbreviations: BP, blood pressure; HgS, sphygmomanometer. a
 . bStandard deviation (SD) did not meet Association for the Advancement of Medical Instrumentation standards.
Also, Table II presents the cumulative percentages of the absolute percent differences between the 2 device measurements that were within 5, 10, and 15 mm Hg. For DBP, absolute agreement within 5 mm Hg between Omron and HgS was the lowest (and <50%) among youth ages 13 to 19 years.
Table III presents the agreement in the classification of an elevated SBP (≥140), DBP (≥90), and hypertension (BP ≥140/90 mm Hg) by the 2 devices (κ=0.68, 0.57, and 0.68, respectively). Although all agreements were above those to be expected by chance, agreement was the lowest for DBP. Across all hypertension subcategories, consistently more individuals were correctly identified as nonhypertensive (higher specificity) than correctly identified as hypertensive (relatively lower sensitivity). Across all hypertension subcategories, the HgS device identified a higher proportion of hypertensives than the Omron device (device difference=SBP 2.2%, DBP 1.55%, and hypertension 2.65%).
Table III.
Consistency of the Classification of Systolic Hypertension, Diastolic Hypertension, and Hypertension by Mercury and Omron Devices in Persons 18 Years and Older
| Classification | HgSa | Omron | % Difference | Sensitivity,% | Specificity,% | κ Statistics |
|---|---|---|---|---|---|---|
| Systolic BP ≥140 mm Hg | ||||||
| No | 378 | 388 | 2.2 | 68.42 | 96.30 | 0.68 |
| Yes | 76 | 66 | ||||
| Diastolic BP ≥90 mm Hg | ||||||
| No | 429 | 436 | 1.55 | 70.59 | 97.25 | 0.57 |
| Yes | 24 | 17 | ||||
| Hypertension (systolic/diastolic BP ≥140/90 mm Hg) | ||||||
| No | 369 | 381 | 2.65 | 67.86 | 95.93 | 0.68 |
| Yes | 84 | 72 | ||||
Abbreviations: BP, blood pressure; HgS, sphygmomanometer. aGold standard.
Multivariate Analyses
The BP values obtained using the 2 devices were highly correlated (r=0.94 for SBP, P<.0001; r=0.83 for DBP, P<.0001). Multiple linear regression analyses of the between‐device difference in systolic values adjusted for age, sex, BMI, cuff size, observer effect, and SBP (measured by HgS) and a similar model for between‐device difference in DBP were calculated. BP HgS values were significantly associated with the difference in device readings for SBP and DBP (β‐coefficient=−0.10872, P<.0001; β‐coefficient=−0.25981, P<.0001, respectively), suggesting that 1‐mm Hg increase in SBP corresponded to a −0.1‐mm Hg increase in the differences in systolic device readings. Similarly, a 1‐mm Hg increase in DBP corresponded to a −0.3‐mm Hg increase in the differences between device diastolic readings. Cuff sizes were not significantly associated with the discrepancy between the 2 devices for either systolic or diastolic readings (data not shown).
1, 2, 3, 4 demonstrate Bland–Altman plots showing the differences in SBP and DBP (HgS alone, averaged HgS, and Omron) against the corresponding average BP difference. All Figures showed some extreme values beyond 2 SDs but no discernible linear relationship could be ascertained. Calculating the Spearman rank correlation between the absolute difference and the means, the highest Spearman correlation was r=0.2 (HgS systolic alone) and the lowest was r=−0.005 (HgS diastolic alone).
Figure 1.
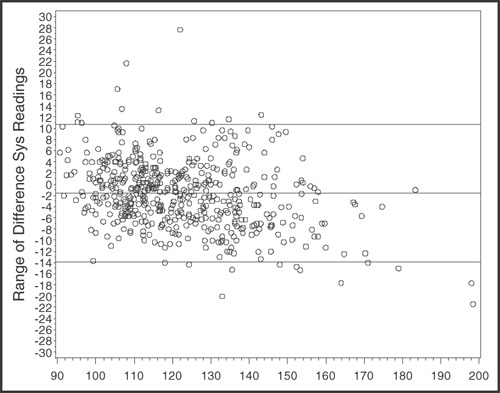
Mean 2 systolic (sys) blood pressure readings taken by mercury.
Figure 2.
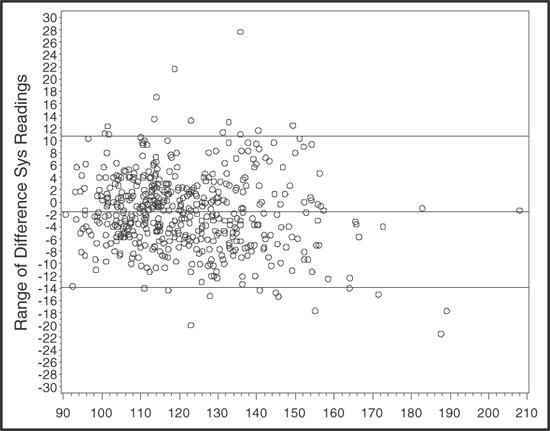
Mean Omron and mercury systolic (sys) blood pressure readings.
Figure 3.
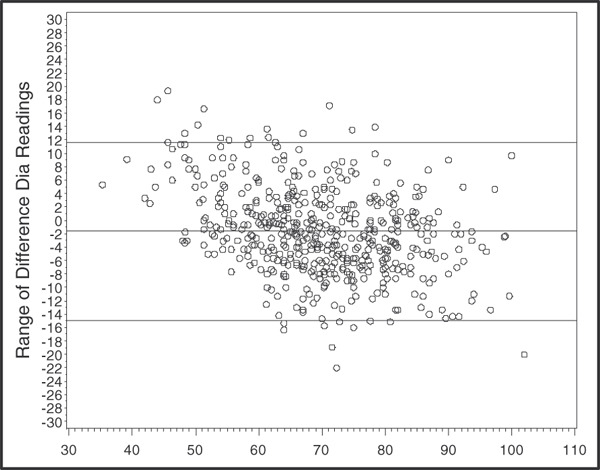
Mean 2 diastolic (dia) blood pressure readings taken by mercury.
Figure 4.
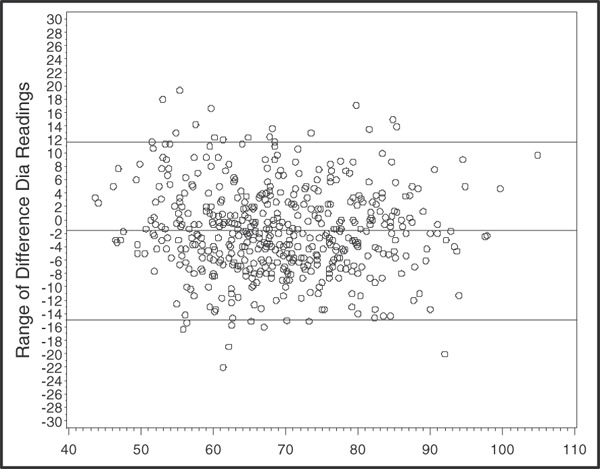
Mean Omron and mercury diastolic (dia) blood pressure readings.
Finally, we analyzed the order of randomized readings, and there was a statistically significant difference between the devices only for the case in which HgS was first (eg, HgS/Omron). Specifically, the mean values for HgS readings were SBP, 124 mm Hg (SD 19) and DBP 70 mm Hg (SD 12) and for the Omron readings were SBP, 121 mm Hg (SD 18) and DBP 68 mm Hg (SD 12), again showing significantly lower readings by Omron for both SBP and DBP (P<.0001 for both).
Discussion
The results of the study show that the Omron device, with one exception (DBP in youth ages 13–19), could be an acceptable device by AAMI criteria for both SBP and DBP measurement. Also, using the British Hypertension Society criteria, which require at least a grade B (≥50% of measurement differences ≤5 mm Hg, 75%≤10 mm Hg, and 90%≤15 mm Hg) for both SBP and DBP, the Omron device would receive grade A/B for both SBP and DBP, except for DBP in youth ages 13 to 19 years. 13 Although there is a beyond‐chance agreement between the 2 device readings for hypertension classification, the agreement was more likely to be for the absence of hypertension rather than the presence of hypertension. Increased SBP and DBP values resulted in an increased discrepancy of reading between devices, suggesting that limits of agreement widened at higher SBP and DBP levels.
Previous studies comparing the Omron 907 device with HgS consistently showed lower readings of both SBP and DBP with better agreement for SBP than DBP. 4 , 6 , 7 Indeed, one study suggested an underestimation of DBP by an average of 5 mm Hg. 6 The results of our study show an overall similar underestimation using the Omron device for both SBP (1.62±6.14 mm Hg) and DBP (1.64±6.63 mm Hg) averages and a greater underestimation for SBP (2.37±6.34 mm Hg) than DBP (1.50±5.94) in individuals 50 years and older. Because all the above studies were smaller in scope than our study, it is difficult to generalize beyond the suggestion that Omron device tends to underestimate BP readings when compared with an HgS standard.
Our finding that readings discrepancy increased with increased BP is in agreement with previous studies. 4 , 6 However, previous studies suggest that increased SBP values were associated with increased discrepancy between the Omron and mercury devices. 4 , 6 Our study suggests that both systolic and diastolic values are affected by increased BP values. This point is further emphasized by the higher percentage of individuals classified as hypertensive by the mercury device when compared with the Omron device.
Aside from human variability in reading a mercury device, other factors may contribute to our findings above, such as the fact that the physical basis for BP measurement using oscillometric devices differs from that of standard mercury measurements and therefore that systolic and diastolic pressure may not actually represent the same physiologic entity when measured using these 2 modalities. Another possibility suggested by White and colleagues 4 is that the increase discrepancy may be a function of the Omron algorithm, which decreases in precision in higher BP ranges.
Also, in our study, the order of BP measurement was not blinded to the study participant. This introduces the possibility of a “white coat effect,” which could be one possible reason for the findings that when the randomized order was HgS/Omron, the Omron readings were significantly lower than HgS, but this was not so when the order of readings was Omron first and then HgS. Whereas the Omron was in hide mode when automatically taking BP values, 2 observers took BP in HgS condition with mercury column tilted from view. Although the 2 observers never left the room for either randomization, the Omron‐first test sequence may have allowed the participants to better acclimate. Similar findings were reported by Myers and colleagues. 14
Recent studies showed that mid‐arm circumference increased significantly in recent years. 15 , 16 This has implications for the accuracy of BP measurements. Among study participants, 25% (n=125) had arm circumferences >35 cm. The calculated mean and SD for the difference between the devices for SBP and DBP readings among these individuals meet the AAMI 2002 criteria (mean −1.31, SD 6.13; mean −0.816, SD 6.69; respectively).
Both the strengths and the limitations of the study can be related to its setting. The study was carried out during 2 years of NHANES, echoing the recommendations of Jones and colleagues 2 who assessed the accuracy of automated devices under conditions of routine and frequent use.
Unlike traditional validation studies, the BP observers were not continuously monitored for observer agreement within 4 or 5 mm Hg, nor did they repeat any measures with a difference >4 or 5 mm Hg. The latter notwithstanding, observers were periodically retrained and observed taking BP frequently. As noted by Jones and others, oscillometric BP devices have problems obtaining BP readings in individuals with arrhythmias. 2 , 4 , 5 , 6 , 7 It is noteworthy to mention that our study did not assess the Omron device’s accuracy in a sample of participants who had atrial fibrillation or other arrhythmic conditions. Clearly, more studies are needed that include this population in their samples.
Conclusions
The Omron device was easy to use and passed the AAMI criteria, with the exception of DBP in youth ages 13 to 19 years. Increases in both SBP and DBP values decrease agreement between the devices. Overall, the Omron device tends to underestimate the prevalence of hypertension as measured by HgS by 2.65%; however, both devices were similar in classifying nonhypertension.
Acknowledgments
Acknowledgments and disclosures: The authors would like to express their gratitude to all involved and who made it possible to complete this validation study. They thank Carlene Grim, from Shared Care, Inc, and Dr Grace Willard, Doe Knight, Gunda Kube, Ruth Pressley, Jaimie Saltzer, and Belma Ybarra, from Westat, Inc. This validation study was supported by the National Heart, Lung and Blood Institute and the National Center for Health Statistics. The findings and conclusions of this report are those of the authors and do not necessarily represent the official position of the Centers for Disease Control and Prevention.
References
- 1. Protecting by degrees what hospitals can do to reduce mercury pollution. http://www.noharm.org/library/docs/Protecting_by_Degrees_2.pdf. Accessed March 24, 2009.
- 2. Jones DW, Appel LJ, Sheps SG, et al. Measuring blood pressure accurately: new and persistent challenges. JAMA. 2003;289:1027–1030. [DOI] [PubMed] [Google Scholar]
- 3. Ni H, Wu C, Prineas R, et al. Comparison of dinamap PRO‐100 and mercury sphygmomanometer blood pressure measurements in a population‐based study. Am J Hypertens. 2006;19:353–360. [DOI] [PubMed] [Google Scholar]
- 4. White WB, Anwar YA. Evaluation of the overall efficacy of Omron office digital blood pressure HEM‐907 monitor in adults. Blood Press Monit. 2001;6:107–110. [DOI] [PubMed] [Google Scholar]
- 5. Pavlik VN, Hyman DJ, Toronjo C. Comparison of automated and mercury column blood pressure measurements in health care settings. J Clin Hypertens (Greenwich). 2000;2:81–86. [PubMed] [Google Scholar]
- 6. Ombani S, Riva I, Giglio A, et al. Validation of Omron M5‐I and HEM‐907 automated blood pressure monitors in elderly individuals according to the International Protocol of the European Society of Hypertension. Blood Press Monit. 2007;12:233–242. [DOI] [PubMed] [Google Scholar]
- 7. El Assaad MA, Topouchian JA, Darne BM, et al. Validation of Omron HEM 907 device for blood pressure measurement. Blood Press Monit. 2002;7:237–2418. [DOI] [PubMed] [Google Scholar]
- 8. Chobanian AV, Bakris GL, Black HR, et al. The seventh report of the joint national committee on prevention, detection, evaluation, and treatment of high blood pressure: the JNC 7 report. JAMA. 2003;289:2560–2572. [DOI] [PubMed] [Google Scholar]
- 9. National Center for Health Statistics analytic guidelines [article on line]. 2004. http://www.cdc.gov/nchs/about/major/nhanes/nhanes20032004/analytical_guidelines.
- 10. National Center for Health Statistics, Centers for Disease Control and Prevention . National Health and Nutrition Examination Survey (NHANES) Questionnaire and Exam Protocol. http://www.cdc.gov/nchs/about/major/nhanes/questexam.htm [Google Scholar]
- 11. Association for the Advancement of Medical Instrumentation . American National Standard for Electronic or Automated Sphygmomanometers. Arlington VA: AAMI; 2002. [Google Scholar]
- 12. Ostchega Y, Prineas RJ, Paulose‐Ram R, et al. National Health and Nutrition Examination Survey 1999–2000: effect of observer training and protocol standardization and reducing blood pressure measurement error. J Clin Epidemiol. 2003;56:768–774. [DOI] [PubMed] [Google Scholar]
- 13. O’Brien E, Waeber B, Parati G, et al. Blood pressure measuring devices: recommendations of the European Society of Hypertension. BMJ. 2001;322:531–536. [DOI] [PMC free article] [PubMed] [Google Scholar]
- 14. Myers MG, McInnis NH, Fodor GJ, et al. Comparison between an automated and manual sphygmomanometer in a population survey. Am J Hypertens. 2008;21:280–283. [DOI] [PubMed] [Google Scholar]
- 15. Prineas RJ, Ostchega Y, Carroll M, et al. US demographic trends in mid‐arm circumference and recommended blood pressure cuffs for children and adolescents: data from the National Health and Nutrition Examination Survey 1988–2004. Blood Press Monit. 2007;12:75–80. [DOI] [PubMed] [Google Scholar]
- 16. Ostchega Y, Dillon C, Carroll M, et al. US demographic trends in mid‐arm circumference and recommended blood pressure cuffs: 1988–2002. J Hum Hypertens. 2005;19:885–891. [DOI] [PubMed] [Google Scholar]