

Abstract
J Clin Hypertens (Greenwich). 2010;12:456–461. ©2010 Wiley Periodicals, Inc.
Metabolic abnormalities and metabolic syndrome (MetS) increasingly have been linked to depression. The authors studied examined inpatients 35 years and older with major depressive disorder (MDD) to determine the prevalence of component metabolic abnormalities and the full MetS with age, treatment, and comorbid dementia. Data analysis involved retrospective cross‐sectional review from a nonprofit psychiatry inpatient service of all discharges 35 years and older with a diagnosis of MDD during a 3 year period (April 1, 2003 to March 31, 2006) (N=1718). Metabolic measures included waist circumference, lipid measurements, glucose, and hypertension diagnosis. Abnormal metabolic measures and MetS were highly prevalent in both young and old patients with MDD: one or more component was present in 87.6% of older (65–99 years old) and 79.9% of younger patients. Full MetS was present in 31.5% of older and 28.9% of younger patients (not significant, P=0.85). Metabolic abnormalities were not associated with atypical antipsychotics after controlling other variables. One‐quarter (n=79, 24.9%) of older inpatients had a dementia co‐diagnosis. Older patients with MDD and dementia had greater risk of elevated glucose while younger patients were more often hypertensive. Longitudinal studies are needed to determine the relationships of MDD with or without dementia with these highly prevalent abnormal metabolic measures and MetS.
Metabolic risk factors for cardiovascular disease, particularly metabolic syndrome (MetS) 1 , 2 (dyslipidemias, elevated glucose, increased blood pressure, obesity), are known to be associated with depressive syndromes. 3 , 4 , 5 , 6 , 7 , 8 Geriatric psychiatry has focused on the common metabolic comorbidities of depression, cognitive decline, and dementia in late life. 9 , 10 , 11 , 12 , 13 The vascular depression hypothesis proposes that vascular disease underlies depressive disorders in some older adults. 3 , 4 , 5 The Rotterdam Study found elevated rates of MetS components and extracoronary atherosclerosis associated with higher prevalence of depression in the elderly. 14 Less is known about the role of metabolic abnormalities in younger persons with depression.
Recent studies increasingly suggest the link between MetS and depression prior to old age. 7 , 15 , 16 , 17 Outpatients with lengthy major depressive illness had higher rates of MetS (36%) compared with the general population rate of 26.7%. 15 , 16 Nondepressed women and men with MetS at baseline were twice as likely to have depressive symptoms at 7 year follow‐up in a large, middle‐aged, population‐based Finnish sample 7 and the association of MetS and depression was confirmed independent of diabetes status in a large, heterogeneous, general population, nonpatient study. 18
While recent studies identified an association between depression and MetS, the reasons for this association are debated 19 and their interplay with additional aspects of chronic illness and function continues to need elucidation. 7 , 11 , 19 As yet, there is little to inform conclusions about which components of MetS may be most predictive of depression, potential mechanisms, directionality, and causality, and whether these associations vary by sex. Results from the Whitehall II Study suggest that MetS, particularly obesity and dyslipidemia, is predictive of depressive symptoms. 7 Sex differences were apparent with the finding of higher levels of depression developing in women with MetS compared with men 17 , 20 but the Whitehall study did not show the association to be sex‐specific. 7 Some research data suggest a bidirectional association between depression and MetS. The Cardiovascular Health Study 8 found that older adults who reported higher depressive symptoms were more likely to develop diabetes and that the increase was not explained by antidepressant use. Determination of these associations has become of more interest due to the finding that depression, even at an early age, is a risk factor for the later development of Alzheimer’s dementia. 21 , 22
This study examined the prevalence of MetS and its components among psychiatrically hospitalized adult patients with a clinical diagnosis of major depression. Associations among metabolic measures and demographic and treatment variables were determined. The investigators compared findings among inpatients with major depressive disorder (MDD) ages 35–64 with those ages 65–99.
Methods
The treatment setting was the inpatient psychiatry service of a private, not‐for‐profit urban facility that admits both insured and uninsured patients. Data were prospectively collected between April 1, 2003 and March 31, 2006 on all inpatients age ≥35 with a clinical diagnosis of MDD (N=1718). Data obtained from the medical records included demographic, clinical diagnoses, and treatment variables as well as metabolic measures. The Third Report of the National Cholesterol Education Program (NCEP) Expert Panel on Detection, Evaluation, and Treatment of High Blood Cholesterol in Adults (Adult Treatment Panel III) (ATP III) 1 metabolic measures were recorded when available for MetS: abdominal obesity (waist circumference [WC] in men: >120 cm [>40 in]; women: >88 cm [>35 in]); fasting glucose ≥110 mg/dL; triglycerides ≥150 mg/dL; high‐density lipoprotein cholesterol (men: <40 mg/dL; women: <50 mg/dL); diagnosis of hypertension (HTN) was substituted for blood pressure ≥130/≥85 mm Hg because blood pressure was not always recorded. MetS is defined as the presence of ≥3 of these 5 measures.
For some patients all metabolic measures were not available.
For patients with more than one admission during the study period, data from the last admission were used. Initial examination was performed of the distribution of variables by decades of age. Differences in variables by decade of age were insufficient to justify analyzing the data in this way and thus the age groups were split into 35–64 years old compared with ages 65–99.
Data were analyzed using SPSS 14.0 for Windows (SPSS Inc, Chicago, IL). 23 Analyses included descriptive statistics, chi‐square, and stepwise logistic regression (used to identify variables associated with MetS and with each metabolic measure). Logistic regressions were performed for the sample as a whole and for each age group separately in order to determine if different variables were associated with the metabolic measures among the age groups. Each regression was limited to patients who had information recorded on the dependent variable addressed. Independent variables are listed in Table I.
Table I.
Independent Variables Used in Regression Analyses
| Sex | Antipsychotic |
| Race: white, black, Latino | Atypical antipsychotic |
| Major depressive disorder with psychotic features | Typical antipsychotic |
| Substance use disorder | Concurrent antipsychotic |
| Anxiety disorder | Antidepressant |
| Dementia | Concurrent antidepressant |
| Personality disorder (any) | Selective serotonin reuptake inhibitor |
| Borderline personality disorder | Anticonvulsant |
| Thyroid disorder | Valproate |
| Asthma | Lithium |
| Benzodiazepine | |
| ≥2 Discharge psychotropics | |
| ≥3 Discharge psychotropics | |
| Length of stay >10 days | |
| Length of stay >12 days | |
| Length of stay >23 days |
For the regressions using the sample as a whole, age group was added as an independent variable. For the length of stay (LOS) variable, the upper quartile was used (12 days for the sample as a whole, 10 days for patients ages 35–64, and 23 days for patients ages 65–99).
Results
The distributions of demographic and diagnostic variables by age group are displayed in Table II and the treatment parameters and LOS data in the 2 groups are shown in Table III. The majority of the older age group (83.9%) was under age 85.
Table II.
Demographics and Diagnoses by Age Group
| Age 35–64, n=1401 | Age 65–99, n=317 | N=1718 | Statisticsa | |
|---|---|---|---|---|
| Sex (N/% female) | 861 (61.5%) | 210 (66.2%) | 1071 (62.3%) | χ2=2.53, P=.112 |
| Race/ethnicity | ||||
| White | 873 (62.3%) | 277 (87.4%) | 1150 (66.9%) | χ2=78.12, P<.001 |
| Black | 154 (11.0%) | 8 (2.5%) | 162 (9.4%) | |
| Latino | 319 (22.8%) | 21 (6.6%) | 340 (19.8%) | |
| Other | 55 (3.9%) | 11 (3.5%) | 66 (3.9%) | |
| Psychotic features | 500 (35.7%) | 136 (42.9%) | 636 (37.0%) | χ2=5.77, P=.016 |
| Substance use diagnosis | 716 (51.1%) | 44 (13.9%) | 760 (44.2%) | χ2=145.22, P<.001 |
| Anxiety disorder | 179 (12.8%) | 20 (6.3%) | 199 (11.6%) | χ2=10.56, P<.001 |
| Dementia | 20 (1.4%) | 79 (24.9%) | 99 (5.8%) | χ2=262.75, P<.001 |
| Personality disorder | ||||
| Any | 585 (41.8%) | 30 (9.5%) | 615 (35.8%) | χ2=11.729, P<.001 |
| Borderline | 171 (12.2%) | 2 (0.6%) | 173 (10.1%) | χ2=38.24, P<.001 |
| Thyroid disorder | 116 (8.3%) | 43 (13.6%) | 159 (9.3%) | χ2=8.60, P=.003 |
| Asthma | 241 (17.2%) | 23 (7.3%) | 264 (15.4%) | χ2=19.66, P<.001 |
| Diabetes mellitus | 201 (14.3%) | 64 (20.2%) | 265 (15.4%) | χ2=6.76, P=.009 |
| Hypertension | 340 (24.3%) | 159 (50.2%) | 499 (29.0%) | χ2=84.07, P<.001 |
| Cerebrovascular disease | 9 (0.6%) | 24 (7.6%) | 33 (1.9%) | χ2=65.87, P<.001 |
aDegrees of freedom (df)=1 for all χ2 except race/ethnicity where df=3.
Table III.
Medicationsa and Length of Stay by Age Group
| Age 35–64, n=1401 | Age 65–99, n=317 | N=1718 | Statistics b | |
|---|---|---|---|---|
| Antidepressant (any) | 1318 (94.1%) | 280 (88.3%) | 1598 (93.0%) | χ2=13.14, P<.001 |
| Selective serotonin reuptake inhibitor | 855 (61.0%) | 151 (47.6%) | 1006 (58.6%) | χ2=19.11, P<.001 |
| >1 Antidepressant | 278 (19.8%) | 80 (25.2%) | 358 (20.8%) | χ2=4.56, P=.033 |
| Antipsychotic (any) | 738 (52.7%) | 170 (53.6%) | 908 (52.9%) | χ2=0.09, P=.759 |
| Typical antipsychotic | 53 (3.8%) | 18 (5.7%) | 71 (4.1%) | χ2=2.34, P=.126 |
| Atypical antipsychotic | 711 (50.7%) | 159 (50.2%) | 870 (50.6%) | χ2=0.04, P=.849 |
| >1 Antipsychotic | 44 (3.1%) | 12 (3.8%) | 56 (3.3%) | χ2=0.34, P=.559 |
| Anticonvulsant | 328 (23.4%) | 30 (9.5%) | 358 (20.8%) | χ2=30.49, P<.001 |
| Divalproex | 59 (4.2%) | 4 (1.3%) | 63 (3.7%) | χ2=6.37, P=.012 |
| Lithium | 22 (1.6%) | 3 (0.9%) | 25 (1.5%) | χ2=0.70, P=.402 |
| Benzodiazepine | 449 (32.0%) | 103 (32.5%) | 552 (32.1%) | χ2=0.02, P=.879 |
| >2 Psychotropics | 630 (45.0%) | 129 (40.7%) | 759 (44.2%) | χ2=1.92, P=.166 |
| >3 Psychotropics | 279 (19.9%) | 48 (15.1%) | 327 (19.0%) | χ2=3.82, P=.051 |
| LOS: mean ± SD | 6.5±8.3 | 17.3±11.1 | 10.1±9.4 | t=13/29, P<.001 |
| LOS >10 days | 310 (22.1%) | 222 (70.0%) | 532 (31.0%) | χ2=277.51, P<.001 |
| LOS >12 days | 217 (15.5%) | 192 (60.6%) | 409 (23.8%) | χ2=289.51, P<.001 |
| LOS >23 days | 56 (4.0%) | 72 (22.7%) | 128 (7.5%) | χ2=131.32, P<.001 |
Abbreviation: SD, standard deviation. aMedications are those active at discharge. bDegrees of freedom (df)=1 for all χ2; df (unequal variance) for continuous length of stay (LOS)=399.47.
Compared with younger patients, older patients were more likely to be white, have MDD with psychotic features, a dementia diagnosis, a thyroid disorder diagnosis, a diabetes mellitus diagnosis, and a cardiovascular disease diagnosis (see Table II). Older patients were also more likely to receive >1 antidepressant concurrently and have a longer LOS.
All of the ATP criteria were available for 33.8% (581 of 1718) of the sample as a whole, 35.1% (492 of 1401) of the younger group and 28.1% (89 of 317) of the older patients. There were no significant differences in the rates at which the 2 age groups met ATP III criteria for MetS (ie, ≥3 criteria present); 31.5% of the older and 28.9% of the younger depressed patients (χ2=0.25, degrees of freedom [df]=1, P=.62). When examining the whole sample, Latinos and women were more likely to meet the criteria for MetS, as were those with asthma and patients discharged on more than one antidepressant (see Table IV). Meeting the criterion for at least one MetS measure was more likely for patients receiving more than 2 psychotropics (odds ratio [OR], 1.80; confidence interval [CI], 1.17–2.78) and less likely for those with a substance use diagnosis (OR, .66; CI, 0.43–0.99). Among the older patients women were 4 times as likely to meet the MetS criteria (OR, 4.07; CI, 1.10–12.09), and among the younger patients, meeting the criteria was more likely among Latinos (OR, 2.13; CI, 1.37–3.32), those discharged on more than one antidepressant (OR, 1.99; CI, 1.22–3.24), and those with a diagnosis of asthma (OR, 1.84; CI, 1.14–2.97). At least one MetS criterion was met in 87.6% of geriatric inpatients and in 79.9% of younger patients, (χ2=2.96, df=1, P=.085).
Table IV.
Metabolic Syndrome (MetS): Results of Regressions: Age 35–99
| Variable | MetS OR (CI) n=581 | WC OR (CI) n=646 | FBS OR (CI) n=1657 | Trig OR (CI) n=695 | HDL OR (CI) n=692 | HTN OR (CI) n=1718 |
|---|---|---|---|---|---|---|
| Age 65–99 | a | a | 1.79 (1.30–2.46) | 0.46 (0.29–0.74) | a | 2.58 (1.92–3.46) |
| Female | 1.50 (1.01–2.24) | 3.19 (2.26–4.51) | 0.64 (0.51–0.81) | 0.67 (0.48–0.92) | a | 0.71 (0.56–0.89) |
| White | a | a | 0.74 (0.58–0.91) | a | a | 0.75 (0.59–0.95) |
| Black | a | a | a | 0.40 (0.21–0.74) | a | a |
| Latino | 1.87 (1.22–2.86) | a | a | a | 1.99 (1.35–2.90) | a |
| Dementia | a | a | 1.68 (1.06–2.66) | a | a | 1.82 (1.16–2.88) |
| Substance use disorder | a | 0.61 (0.43–0.84) | a | a | a | a |
| Borderline personality | a | a | a | a | 2.02 (1.23–3.33) | 0.56 (0.33–0.93) |
| Asthma | 1.62 (1.02–2.58) | 1.96 (1.23–3.21) | 1.82 (1.34–2.46) | a | a | a |
| Thyroid disorder | a | a | a | a | a | 2.06 (1.42–2.97) |
| Antipsychotic (any) | a | 0.66 (0.47–0.92) | a | a | a | a |
| >1 Antidepressant | 1.78 (1.14–2.77) | a | a | a | 1.87 (1.27–2.76) | a |
| >2 Psychotropic | a | a | a | 1.39 (1.01–1.91) | a | a |
| Divalproex | a | a | a | a | a | 1.90 (1.10–3.28) |
| LOS >13 days | a | a | 1.46 (1.13–1.89) | 0.40 (0.18–0.90) | a | a |
Metabolic syndrome = positive on ≥3 criteria; waist circumference (WC) = increased WC (women >35 in, men >40 in; fasting blood sugar (FBS) = glucose ≥110 mg/dL; triglycerides (Trig) ≥150 mg/dL; high‐density lipoprotein (HDL) = decreased HDL cholesterol (women <50 mg/dL, men <40 mg/dL); hypertension (HTN) = HTN diagnosis, ≥1 = positive on ≥1 criteria.
Abbreviations: CI, confidence interval; LOS, length of stay; OR, odds ratio. aNot selected.
The Figure displays the percent of patients in each age group meeting the individual criteria. Older patients were more likely to have fasting blood sugar >110 mg/dL (χ2=27.71, df=1, P<.001) and a diagnosis of HTN (χ2=84/07, df=1, P<.001) and less likely to have triglycerides ≥150 mg/dL (χ2=14.46, df=1, P<.001). No significant differences were found between the 2 age groups on the WC or high‐density lipoprotein cholesterol criterion.
Figure.
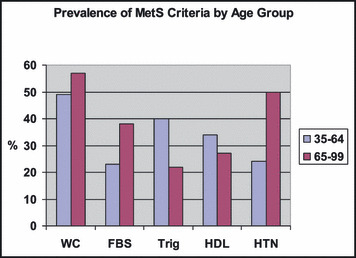
Prevalence of metabolic syndrome (MetS) criteria by age group. FBS indicates fasting blood sugar; HDL, high‐density lipoprotein cholesterol; HTN, hypertension; Trig, triglycerides; WC, waist circumference.
Receiving an atypical antipsychotic was not significantly associated with any metabolic abnormality after controlling for other variables. However, typical antipsychotics were associated with HTN for the younger group (OR, 2.01; CI, 1.10–3.67). Differences by sex were significant for WC, with women at increased risk on this measure for both older (OR, 4.70; CI, 1.77–12.48) and younger (OR, 3.14; CI, 2.16–4.56) age groups. An unexpected association of asthma with increased risk on the WC (OR, 2.03; CI, 1.23–3.34) and glucose (OR, 1.80; CI, 1.30–2.50) measures was found in younger patients but not in those ≥65.
Among the ages 35–64 group a clinical diagnosis of dementia was associated with HTN (OR, 4.08; CI, 1.63–10.22) and among the ages 65–99 group with elevated glucose (OR, 1.72; CI, 1.02–2.87). Nearly one‐quarter (n=79, 24.9%) of inpatients ≥65 had a clinical co‐diagnosis of dementia, and of these more than half (n=48) had a diagnosis of vascular dementia. There was not a significant difference in the risk of having ≥1 of the 5 ATP criteria when comparing the dementia group as a whole to nondemented patients (84.8% vs 80.3%). In the subgroup with vascular dementia (n=48), however, significantly more patients had at least one MetS measure (85.4%, n=41 vs 71.4%, 192 of 269, χ2=4.123, df=1, P=.042) compared to those without a dementia diagnosis.
Discussion
This study suggests that the association of MetS and its components with depression may begin at a young age. The findings emphasize the need for further studies that include younger age groups and control groups and that follow them longitudinally. In the present study we found that the proportion of depressed patients with any of the MetS criteria was high for both age groups as were the rates of full MetS (approximately 30%). While this and other studies are establishing the existence of multiple associations between depression and the metabolic abnormalities that comprise MetS, there is, as yet, little to support conclusions about how these measures may be related. Undoubtedly, there exists a wide array of factors including genetics, overall health status, stress, availability of and compliance with medical interventions, and other factors that interact with and increase the risk for depressive illness, dementia, cardiovascular and cerebrovascular disease, and increased morbidity and mortality. While much of the discussion of vascular depression has emphasized the role of cerebrovascular disease in late‐life depression, 3 , 4 , 14 , 24 , 25 it is important to consider whether actual cerebrovascular disease may or may not be the commonality between depression in younger and older subjects. 11 , 26
Relationships between depression and dementia are complex. Depression appears to represent an independent risk factor predisposing to developing dementia, but here too the mechanisms are far from clear. 21 While depressive symptoms that precede the onset of Alzheimer’s disease (AD) by a year or less probably represent early neurodegenerative symptoms of AD, 21 , 27 the finding of increased risk for AD associated with a history of depression years earlier is more challenging to interpret. 21 , 22 Among the possibilities hypothesized are that patients may be genetically predisposed to both AD and major depression, 21 , 28 that depression may be a proxy for lower neurological reserve, and that depression is toxic to the brain in ways that lead to vulnerability to dementia. 21 In any event, the presence of metabolic risk factors in persons with major depression suggests some common pathogenic mechanisms for the development of depression and dementia.
The presence in mid life of MetS, 29 HTN, dyslipidemias, 6 , 30 elevated glucose, increased blood pressure, and obesity 21 have been shown to increase the risk of dementia and AD later in life. 5 , 31 , 32 , 33 Furthermore, among nondemented older patients, those with MetS are more likely to go on to develop AD and the presence of metabolic risk factors appears to be associated with a more rapid deterioration. 13 , 34
Cerebrovascular risk factors, particularly elevated total cholesterol, may have negative effects on the course of MDD treatment. 26 , 35 MDD subjects with greater vascular burden appear to be a vulnerable group, prone to higher rates of treatment resistance and requiring closer clinical monitoring and more intensive antidepressant treatment. 26
For clinicians, the principal conclusion of this study is that metabolic risk factors comprising MetS are common among patients with MDD. The current attention to MetS and its components in psychiatric patients should include those with major depression and not be restricted to patients with a diagnosis of schizophrenia or to patients treated with atypical antipsychotics. Given the absence of etiologic data, more specific guidelines may not be possible at the present time.
Among the research questions raised by our findings are whether the associations between metabolic abnormalities and depression, metabolic abnormalities and dementia, depression and vascular disease, and depression and dementia can be interrupted. Since depression has been found to be a risk factor for cognitive disorders and dementia, our findings of high prevalence of metabolic abnormalities in younger depressives may suggest directions for future research, possibly leading to better treatment and possible prevention strategies for both depression and dementia.
References
- 1. National Institutes of Health . National Institutes of Health Third Report of the National Cholesterol Education Program Expert Panel on Detection, Evaluation, and Treatment of High Blood Cholesterol in Adults (Adult Treatment Panel III). Executive Summary . Bethesda, MD: National Institutes of Health, National Heart, Lung, and Blood Institute; 2001. NIH publication 01‐3670. [Google Scholar]
- 2. Grundy SM. Metabolic syndrome: a multiplex cardiovascular risk factor. J Clin Endocrinol Metab. 2007;92:399–404. [DOI] [PubMed] [Google Scholar]
- 3. Alexopoulos GS, Meyers BS, Young RC, et al. “Vascular depression” hypothesis. Arch Gen Psychiatry. 1997;54:915–922. [DOI] [PubMed] [Google Scholar]
- 4. Krishnan KR, Hays JC, Blazer DG. MRI‐defined vascular depression. Am J Psychiatry. 1997;154:497–501. [DOI] [PubMed] [Google Scholar]
- 5. Barnes DE, Alexopoulos GS, Lopez OL, et al. Depressive symptoms, vascular disease, and mild cognitive impairment: findings from the Cardiovascular Health Study. Arch Gen Psychiatry. 2006;63:273–279. [DOI] [PubMed] [Google Scholar]
- 6. Kivipelto M, Solomon A. Cholesterol as a risk factor for Alzheimer’s disease ‐ epidemiological evidence. Acta Neurol Scand. 2006;185(suppl):50–57. [DOI] [PubMed] [Google Scholar]
- 7. Akbaraly TN, Kivimaki M, Brunner EJ, et al. Association between metabolic syndrome and depressive symptoms in middle‐aged adults: results from the Whitehall II study. Diabetes Care. 2009;32:499–504. [DOI] [PMC free article] [PubMed] [Google Scholar]
- 8. Carnethon MR, Biggs ML, Barzilay JI, et al. Longitudinal association between depressive symptoms and incident type 2 diabetes mellitus in older adults: the cardiovascular health study. Arch Intern Med. 2007;167:802–807. [DOI] [PubMed] [Google Scholar]
- 9. Alexopoulos GS. Depression in the elderly. Lancet. 2005;365:1961–1970. [DOI] [PubMed] [Google Scholar]
- 10. Krishnan KR. Treatment of depression in the medically ill. J Clin Psychopharmacol. 2005;4(suppl 1):S14–S18. [DOI] [PubMed] [Google Scholar]
- 11. Turvey CL, Schultz SK, Beglinger L, et al. A longitudinal community‐based study of chronic illness, cognitive and physical function, and depression. Am J Geriatr Psychiatry. 2009;17:632–641. [DOI] [PMC free article] [PubMed] [Google Scholar]
- 12. Wadley VG, McClure LA, Howard VJ, et al. Cognitive status, stroke symptoms reports, and modifiable risk factors among individuals with no diagnosis of stroke or transient ischemic attack in the Reasons for Geographic and Racial Difference in Stroke (REGARDS) study. Stroke. 2007;38:1143–1147. [DOI] [PubMed] [Google Scholar]
- 13. Helzner EP, Luchsinger JA, Scarmeas N, et al. Contribution of vascular risk factors to the progression in Alzheimer Disease. Arch Neurol. 2009;66:343–348. [DOI] [PMC free article] [PubMed] [Google Scholar]
- 14. Tiermeier H, Van Dijck W, Hofman A, et al. Relationship between atherosclerosis and late‐life depression: the Rotterdam study. Arch Gen Psychiatry. 2004;61:369–376. [DOI] [PubMed] [Google Scholar]
- 15. Kinder LS, Carnethon MR, Palaniappan LP, et al. Depression and the metabolic syndrome in young adults: findings from the Third National Health and Nutrition Examination Survey. Psychosom Med. 2004;66:316–322. [DOI] [PubMed] [Google Scholar]
- 16. Heiskanen TH, Niskanen LK, Hintikka JJ, et al. Metabolic syndrome and depression: a cross‐sectional analysis. J Clin Psychiatry. 2006;67:1422–1427. [DOI] [PubMed] [Google Scholar]
- 17. Koponen H, Jokelainen J, Keinanen‐Kiukaanniemi S, et al. Metabolic syndrome predisposes to depressive symptoms: a population‐based 7‐years follow‐up study. J Clin Psychiatry. 2008;69:178–182. [DOI] [PubMed] [Google Scholar]
- 18. Dunbar JA, Reddy P, Davis‐Lameloise N, et al. Depression: an important comorbidity with metabolic syndrome in a general population. Diabetes Care. 2008;31:2368–2373. [DOI] [PMC free article] [PubMed] [Google Scholar]
- 19. Vaccarino V, McClure C, Johnson BD, et al. Depression, the metabolic syndrome and cardiovascular risk. Psychosom Med. 2008;70:40–48. [DOI] [PubMed] [Google Scholar]
- 20. Pulkki‐Raback L, Elovainio M, Kivimaki M, et al. Depressive symptoms and the metabolic syndrome in childhood and adulthood: a prospective cohort study. Health Psychol. 2009;28:108–116. [DOI] [PMC free article] [PubMed] [Google Scholar]
- 21. Green RC, Cupples LA, Kurz A, et al. Depression as a risk factor for Alzheimer’s disease: the MIRAGE Study. Arch Neurol. 2003;60:753–759. [DOI] [PubMed] [Google Scholar]
- 22. Jorm AF, Van Diujn CM, Chandra V, et al. Psychiatric history and related exposures as risk factors for Alzheimer’s disease: a collaborative re‐analysis of case‐control studies. EURODEM Risk Factors Research Group. Int J Epidemiol. 1991;20(suppl 2):S43–S47. [DOI] [PubMed] [Google Scholar]
- 23. Statistical Package for the Social Sciences. V 14 ed. Chicago IL: SPSS, Inc.; 2004. [Google Scholar]
- 24. Kales HC, Maixner DF, Mellow AM. Cerebrovascular disease and late‐life depression. Am J Geriatr Psychiatry. 2005;13:88–98. [DOI] [PubMed] [Google Scholar]
- 25. Steffens DC, Otey E, Alexopoulos GS, et al. Perspectives on depression, mild cognitive impairment and cognitive decline. Arch Gen Psychiatry. 2006;63:130–138. [DOI] [PubMed] [Google Scholar]
- 26. Iosifescu DV, Clementi‐Craven N, Fraguas R, et al. Cardiovascular risk factors may moderate pharmacological treatment effects in major depressive disorder. Psychosom Med. 2005;67:703–706. [DOI] [PubMed] [Google Scholar]
- 27. Zubenko GS, Zubenko WN, McPherson S, et al. A collaborative study of the emergence and clinical features of major depressive syndrome of Alzheimer’s disease. Am J Psychiatry. 2003;160:857–866. [DOI] [PubMed] [Google Scholar]
- 28. Lee HB, Lyketsos CG. Depression in Alzheimer’s disease: heterogeneity and related issues. Biol Psychiatry. 2003;54:353–362. [DOI] [PubMed] [Google Scholar]
- 29. Kivipelto M, Ngandu T, Laatikainen T, et al. Risk scores for the prediction of dementia risk in 20 years among middle aged people: a longitudinal, population‐based study. Lancet Neurol. 2006;5:735–741. [DOI] [PubMed] [Google Scholar]
- 30. Sjogren J, Mielke M, Gustafson D, et al. Cholesterol and Alzheimer’s disease‐‐is there a relation? Mech Ageing Dev. 2006;127:138–147. [DOI] [PubMed] [Google Scholar]
- 31. Yaffe K, Kanaya A, Lindquist K, et al. The metabolic syndrome, inflammation and the risk of cognitive decline. JAMA. 2004;292:2237–2242. [DOI] [PubMed] [Google Scholar]
- 32. Yaffe K, Barret‐Connor E, Lin F, et al. Serum lipoprotein levels, statin use, and cognitive function in older women. Arch Neurol. 2002;59:378–384. [DOI] [PubMed] [Google Scholar]
- 33. Kivipelto M, Ngandu T, Fratiglioni L, et al. Obesity and vascular risk factors at midlife and the risk of dementia and Alzheimer disease. Arch Neurol. 2005;62:1556–1560. [DOI] [PubMed] [Google Scholar]
- 34. Vanhanen M, Koivisto K, Moilanen L, et al. Association of metabolic syndrome with Alzheimer disease: a population‐based study. Neurology. 2006;67:843–847. [DOI] [PubMed] [Google Scholar]
- 35. Lyness JM, Caine ED, Cox C, et al. Cerebrovascular risk factors and 1‐year depression outcomes in older primary care patients. Am J Psychiatry. 2000;157:1499–1501. [DOI] [PubMed] [Google Scholar]