

Abstract
To determine whether a single‐point triglyceride (TG) concentration could estimate the 8‐hour postprandial lipemic (PPL) response, men and women performed baseline PPL (n=188) and postexercise PPL (n=92) trials. Correlations were generated between TG concentrations at baseline and at various time points after a high‐fat meal vs 8‐hour area under the TG curve (TG‐AUC) and peak TG level. Stepwise multiple regression and bootstrap simulations using TG level and additional predictor variables of sex, age, percentage of body fat, training status, and maximal oxygen consumption indicated that the 4‐hour TG concentrations accounted for >90% of the variance in TG‐AUC and peak TG responses during the PPL trials. Equations were confirmed by cross‐validation in healthy as well as at‐risk individuals with components of the cardiometabolic syndrome. Our data suggest that the 4‐hour TG value is highly related to the total 8‐hour PPL response and can be used for accurate estimation of PPL in a clinical or research setting.
Postprandial lipemia (PPL) is the elevated concentration of plasma triglycerides (TGs) that occurs following a meal. PPL responses are elevated in peripheral artery disease, 1 hypertension, 2 and coronary artery disease (CAD), 3 and it recently has been demonstrated that nonfasting TG levels measured 2 to 4 hours postprandially had the strongest association with cardiovascular events in an 11‐year follow‐up study. 4 Most individuals are hypertriglyceridemic after a moderate‐ or high‐fat meal, 5 , 6 , 7 and TG levels usually peak 4 to 6 hours after the meal. 6 , 7 , 8 Due to high‐fat diets and frequent feeding, TG levels are elevated during the majority of the day, exposing individuals to large atherogenic TG‐rich lipoproteins that can penetrate and reside in the subendothelial space, contributing to foam cell formation and promoting lipid accumulation in the vessel wall. 5 In fact, recent studies have demonstrated that small, dense low‐density lipoprotein particles 9 and oxidative modification of low‐density lipoprotein 10 are increased during the postprandial period. In addition, PPL is associated with elevated levels of systemic inflammation, 11 and the large TG‐rich particles formed during the postprandial period increase the risk of clot formation and thrombosis. 12 Furthermore, apolipoprotein composition, high‐density lipoprotein cholesterol levels, and endothelial function are negatively affected during the postprandial period. 13 , 14 , 15 , 16
Several factors are known to influence the PPL response, including age, 17 sex, 18 body composition, 19 aerobic capacity and training status, 6 , 20 and hypertriglyceridemia. 5 In addition, exercise prior to consumption of a high‐fat meal attenuates the PPL response in healthy and at‐risk individuals. 7 , 8 , 21 , 22 , 23 , 24 , 25 Thus, prior exercise should be considered when interpreting PPL results. In addition, PPL following exercise may be used as an adjunct to resting PPL when assessing fat handling.
Traditionally, PPL has been quantified by measuring the area under the TG concentration curve for 8 hours or by quantifying the peak TG concentration during the 8‐hour period. This process provides valuable information for health risk assessment, but the all‐day process can be a burden for both patient and technician. Attempts to limit blood collection required for PPL calculation are limited. Guerci and coworkers 26 reported that the measurement of TG concentrations at baseline and 4 and 8 hours after the high‐fat meal could be used to accurately predict the PPL response. However, this procedure still required multiple blood samplings, and the authors did not examine the effects of prior acute exercise. Our aim was to determine whether a single‐point TG concentration could be used to accurately estimate the 8‐hour PPL response with and without prior exercise. In addition, the accuracy of a regression equation using a single TG concentration to estimate the PPL response was evaluated and cross‐validated in both healthy individuals and at‐risk individuals with hypertriglyceridemia and other components of the cardiometabolic syndrome.
Methods
Participants
PPL trials from 8 previous studies conducted within the same laboratory were used to predict the PPL response. From these studies, 280 PPL trials (150 in men, 130 in women) were completed and used for analysis 6 , 8 , 21 , 23 , 24 , 27 , 28 (plus 1 unpublished data set). Of these, 188 baseline PPL trials (99 in men, 89 in women) and 92 exercise PPL (Ex‐PPL) trials (51 in men, 41 in women) were completed. Two hundred fifteen of the completed PPL trials were in untrained individuals, and 65 were in recreationally trained individuals (Table I). Training status was defined as exercising ≥3 d/wk (≥1000 kcal/wk).
Table I.
Descriptive Characteristics
| PPL Trials | Ex‐PPL Trials | Combined Trialsa | ||||
|---|---|---|---|---|---|---|
| Men (n=99) | Women (n=89) | Men (n=51) | Women (n=41) | Men (n=150) | Women (n=130) | |
| Age, y | 31.9±9.1 (19–53) | 28.0±9.4 (18–47) | 27.2±6.9 (19–45) | 26.7±8.1 (18–43) | 30.3±8.7 (19–53) | 27.6±9.0 (18–47) |
| Body weight, kg | 80.7±8.5b (60.9±103.8) | 69.1±11.5 (49.0–99.2) | 80.7±8.4b (60.9–96.1) | 68.7±12.9 (53.9–99.2) | 80.5±8.4b (60.9±103.8) | 69.0±11.9 (49.0–99.2) |
| Body fat, % | 17.7±5.7b (6.0–33.4) | 31.2±9.1 (14.8–46.9) | 15.6±5.1b (6.0–28.9) | 27.3±7.2 (14.8–43.2) | 17.0±5.6b (6.0–33.4) | 30.0±8.7 (14.8–46.9) |
| VO2max, mL/kg/min | 42.6±10.1b (20.3–62.9) | 29.4±9.8 (15.2–56.5) | 46.2±6.9b (31.3–62.9) | 34.5±5.3 (19.3–45.1) | 43.9±9.3b (20.3–62.9) | 31.0±8.6 (15.2–56.5) |
Abbreviations: Ex‐PPL, exercise PPL; PPL, postprandial lipemia; VO2max, maximal oxygen consumption. Values are mean ± SD (range). aPPL+Ex‐PPL. bSignificantly different than women (P<.05).
Prior to participation in the study, participants gave written informed consent as approved by the Health Sciences Institutional Review Board of the University of Missouri in accordance with the ethical standards of the University of Missouri Institutional Review Board. All participants were screened using a health history questionnaire and were determined to have normal fasting TG levels by an initial blood analysis. All participants were nonsmokers and all women were premenopausal. Participants were eliminated from the study if they had >1 major risk factor as defined by the American College of Sports Medicine guidelines for testing and prescription. 29
Cross‐Validation Groups
Two cross‐validation groups were utilized in the current report. In cross‐validation group 1, PPL trials (53 PPL, 66 Ex‐PPL) were completed by men (n=41) and women (n=78) with similar characteristics to the study group: age, 18 to 43 years; body weight, 70.0±1.1 kg; body fat, 21.3%±0.7%; and body mass index, 24.0±0.8 kg/m2. In cross‐validation group 2, PPL trials (36 PPL, 32 Ex‐PPL) were completed using the same protocol by men (n=46) and women (n=22). These individuals were of similar age as the original study group (19–45 years) but were overweight/obese (body mass index, 29.6±0.6 kg/m2) and had a larger body mass (86.4±1.8 kg) and a greater percentage body fat (27.2%±1.1%) than the original study group. In addition, approximately 95% of participants in cross‐validation group 2 had the cardiometabolic syndrome according to the International Diabetes Federation definition, 30 and all participants had at least 2 components, including hypertriglyceridemia (fasting TG ≥150 mg/dL). Individuals in cross‐validation group 1 were recruited from and completed testing procedures at Missouri State University; in cross‐validation group 2, participants were from the University of Texas‐San Antonio and the University of Missouri. Participants gave written informed consent as approved by the institutional review boards of the respective institutions.
Body Composition and Maximal Oxygen Consumption
Percentage of body fat was calculated using sex‐specific 3‐site skinfold measurements. 29 Each participant completed a maximal oxygen consumption (VO2max) test on a treadmill, as previously described by our group, 31 for baseline fitness assessment and to determine the intensity of exercise for the Ex‐PPL trials.
Baseline PPL Trials
Blood samples were collected following 48 hours of abstinence from exercise. When a series of fat challenge trials were given, each participant ingested a similar diet during each preparatory 24‐hour period. The high‐fat meal was given to each participant as breakfast after a 12‐hour overnight fast during which only water was consumed. The high‐fat meal was a standard meal in 3 studies 6 , 8 , 24 and was based upon body weight in 5 studies 21 , 23 , 27 , 28 (1 unpublished data set) and included approximately 100 g fat for a 70‐kg person. Venous blood samples were collected before and 2 hours, 4 hours, 6 hours, and 8 hours after the high‐fat meal, and participants were allowed to only drink water during the 8 hours. The cross‐validation groups followed similar PPL testing protocols. 21 , 23 , 27 , 28
Ex‐PPL Trials
Participants reported to the lab 13 hours prior to the high‐fat meal to complete an aerobic exercise session that consisted of treadmill exercise for 60 minutes at 60% VO2max (75% heart rate max) (∼600 kcal/session). Following the exercise session, individuals began the 12‐hour overnight fast during which only water could be consumed and returned to the laboratory the following morning to consume the previously described high‐fat meal.
Plasma TG Analysis and Quantification of the PPL Response
Plasma TG concentrations were measured during fasting conditions and to determine the PPL response to the high‐fat meal. Plasma TG was measured enzymatically using a diagnostic kit (Infinity, Thermo DMA, Inc. Louisville, CO), and measurements were made using Beckman spectrophotometers (models DU 530 and DU 2, Beckman Instruments Inc., Fullerton, CA) using known standards. In order to eliminate interassay variability, all samples from a single participant were analyzed together for each assay. For this procedure, the intra‐assay coefficient of variation was between 1.3% and 3.2% for each of the studies.
The PPL response was quantified as the total area under the TG curve (TG‐AUCtot) by using the trapezoidal method as described by Tai. 32 The incremental area under the TG curve (TG‐AUCinc) also was calculated using the trapezoidal method, but the baseline TG values were subtracted from each TG value before completing the calculations. 32 The PPL response also was quantified by the TG peak response (TG‐peaktot), defined as the greatest plasma TG concentration over the 8‐hour period, and the incremental TG peak response (TG‐peakinc), defined as the peak TG response minus the fasting (0‐hour) TG concentration.
Statistical Analysis
Statistical analysis was conducted using SPSS (SPSS/15.0; SPSS, Chicago, IL) and Stata (Stata 10, College Station, TX) software. Pearson correlations were used to determine relationships between TG concentrations at different time points, predictor variables, and PPL quantification measures. Stepwise regression analysis was then used to develop prediction equations for TG‐AUCtot, TG‐AUCinc, TG‐peaktot, and TG‐peakinc using different predictor variables: sex, age, weight, percentage body fat, training status, VO2max, and baseline and 4‐hour TG concentration (entry criteria into model was P=.05; removal was P=0.10). These prediction equations were created for baseline PPL responses, Ex‐PPL responses, and combined PPL responses. Bootstrap simulations (bootstrap sample size same as original data set, N=280, 500 repetitions) also were performed to calculate bootstrap standard errors and bootstrap z‐statistics for each of our PPL quantification measures. Each TG measurement and significant (P≤.05) predictor variables were included in the bootstrap regression analyses to determine whether the 4‐hour TG concentration was the greatest significant contributor to each PPL quantification measure and assess whether other predictor variables should be included in the models.
In order to assess the accuracy of the prediction equations with other sample populations, prediction equations were cross‐validated in healthy individuals and in individuals with hypertriglyceridemia and components of the metabolic syndrome. Multiple correlations between the predicted value and the actual value were calculated for TG‐AUCtot, TG‐AUCinc, TG‐peaktot, and TG‐peakinc measures in these data sets, and the cross‐validation standard error of the estimate (SEE) and the percentage SEE (SEE divided by each PPL quantification) were calculated.
Bland‐Altman plots were created to illustrate the magnitude of agreement between measured PPL responses and predicted PPL responses from the 8 studies. Homoscedasticity, or equal spread of prediction error, of the difference between methods was assessed to ensure accurate SEE and significance values. Predicted values between the baseline PPL prediction equation and Ex‐PPL equation were compared to the overall PPL response prediction equation through the use of dependent Student t‐tests.
Results
Descriptive statistics by trials are presented for men and women in Table I. The 4‐hour total TG concentration had the highest correlation with the TG‐AUCtot (r=0.95, P<.001) and TG‐peaktot (r=0.96, P<.001), and the 4‐hour incremental TG value had the highest correlation with the TG‐AUCinc (r=0.92, P<.001) and TG‐peakinc measures (r=0.92, P<.001) (Table II). Some predictor variables were modestly correlated to the PPL responses (Table III). Since the high‐fat meal was standard in some studies 6 , 8 , 24 and based upon body weight in other studies, 21 , 23 , 27 , 28 this variable was included as a control variable but was not significantly associated with PPL responses (data not shown).
Table II.
Pearson Correlations Among Triglyceride Concentrations at Different Time Points and PPL Responses
| 0 Hours | 2 Hours | 4 Hours | 6 Hours | 8 Hours | |
|---|---|---|---|---|---|
| TG‐AUCtot | 0.853 | 0.911 | 0.952 | 0.932 | 0.868 |
| TG‐peaktot | 0.790 | 0.907 | 0.962 | 0.876 | 0.796 |
| TG‐AUCinc | 0.722 | 0.918 | 0.881 | 0.613 | |
| TG‐peakinc | 0.744 | 0.922 | 0.733 | 0.454 |
Abbreviations: TG‐AUCinc, incremental area under the triglyceride curve; TG‐AUCtot, total area under the triglyceride curve; TG‐peakinc, incremental triglyceride peak response; TG‐peaktot, triglyceride peak response. Postprandial lipemia (PPL) and exercise PPL trials are combined (N=280). All r values are significant at P<.001.
Table III.
Simple Correlations (Pearson r) Among Predictor Variables and PPL Responses
| Predictors | ||||||
|---|---|---|---|---|---|---|
| Sexa | Age | Body weight | Percentage body fat | VO2max (mL/kg/min) | Training status | |
| TG‐AUCtot | −0.107 | −0.164b | 0.296b | 0.255b | −0.229b | 0.070 |
| TG‐peaktot | −0.112 | −0.160b | 0.272b | 0.223b | −0.200b | −0.082 |
| TG‐AUCinc | −0.217b | −0.091 | 0.239b | −0.007 | −0.047 | 0.033 |
| TG‐peakinc | −0.269b | −0.106 | 0.215b | −0.030 | −0.063 | −0.064 |
Abbreviations: TG‐AUCinc, incremental area under the triglyceride curve; TG‐AUCtot, total area under the triglyceride curve; TG‐peakinc, incremental triglyceride peak response; TG‐peaktot, triglyceride peak response; VO2max, maximal oxygen consumption. Postprandial lipemia (PPL) and exercise PPL trials are combined (N=280). aFemale sex was associated with a lower PPL response. b r values are significant at P≤0.05.
Equation Development
Separate regression equations for baseline PPL trials and Ex‐PPL trials were first developed using significant (P<.05) predictor variables (II, III). The 0‐hour and 4‐hour incremental TG concentrations, sex, and body weight were significant and included in the models for TG‐AUCinc and TG‐peakinc. The 4‐hour TG concentration accounted for 89%, 92%, 84%, and 85% of the variance in TG‐AUCtot, TG‐peaktot, TG‐AUCinc, and TG‐peakinc, respectively, in the baseline PPL trials. For the Ex‐PPL trials, the 4‐hour total TG concentration accounted for 94% of the variance in TG‐AUCtot and TG‐peaktot, while 4‐hour incremental TG concentrations accounted for ≥84% of the variance in TG‐AUCinc and TG‐peakinc.
Combined Equation
Results of t‐tests indicated that the predicted values from the combined PPL equation were not significantly different than the values obtained from the individual PPL equation (P>.05, data not shown) for each quantification of the PPL response. Thus, a regression equation using all trials (baseline and exercise) was calculated.
As with the separate baseline and Ex‐PPL models, the 4‐hour total TG concentration remained the highest predictor of each of the PPL variables, accounting for 91% of the variance in TG‐AUCtot (P<.001) and 93% of the variance in TG‐peaktot. In addition, the 4‐hour incremental TG value accounted for 84% of the variance in TG‐AUCinc and 85% of the variance in TG‐peakinc (Table IV). Baseline (0‐hour) TG concentration also was entered into the model for prediction of TG‐AUCtot, TG‐peaktot, and TG‐peakinc but contributed minimally to the overall R 2 and SEE for each variable (Table IV). Other predictor variables did not contribute significantly and did not enter the regression models. Figure 1 illustrates the very tight correlations and the nonbiased agreement between predicted PPL and actual PPL responses. Means and standard errors of actual and predicted values for each PPL measure are shown in Figure 2.
Table IV.
Predictive Equations for Postprandial Lipemic Responses (N=280 for Each Equation)
| Equation | R 2 | SEE | |
|---|---|---|---|
| TG‐AUCtot | 6.91 (4‐hour total TG)+130.66 | 0.91 | 116.5 |
| 4.43 (4‐hour total TG)+3.83 (0‐hour TG)+16.0 | 0.95 | 88.1 | |
| TG‐peaktot | 0.95 (4‐hour total TG)+19.6 | 0.93 | 17.5 |
| 0.84 (4‐hour total TG)+0.31 (0‐hour TG)+10.4 | 0.94 | 16.1 | |
| TG‐AUCinc | 4.49 (4‐hour total TG)+34.06 | 0.84 | 80.8 |
| TG‐peakinc | 0.87 (4‐hour total TG)+20.56 | 0.85 | 16.7 |
| 0.84 (4‐hour total TG)+0.14 (0‐hour TG)+10.4 | 0.86 | 16.1 |
Abbreviations: SEE, standard error of estimate; TG, triglycerides; TG‐AUCinc, incremental area under the triglyceride curve; TG‐AUCtot, total area under the triglyceride curve; TG‐peakinc, incremental triglyceride peak response; TG‐peaktot, triglyceride peak response. All equations are statistically significant at P<.001. TG concentrations are in mg/dL.
Figure 1.
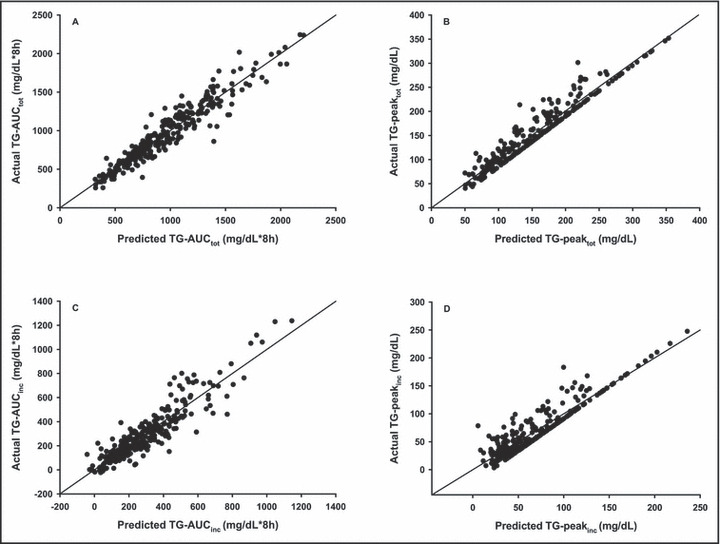
Relation between predicted postprandial lipemic (PPL) responses developed with the 4‐hour triglyceride (TG) equations from Table IV and the actual PPL responses (N=280). Each is statistically significant, r>0.94, P<.001. TG‐AUCtot indicates total area under the triglyceride curve; TG‐peaktot, triglyceride peak response; TG‐AUCinc, incremental area under the triglyceride curve; TG‐peakinc, incremental triglyceride peak response.
Figure 2.
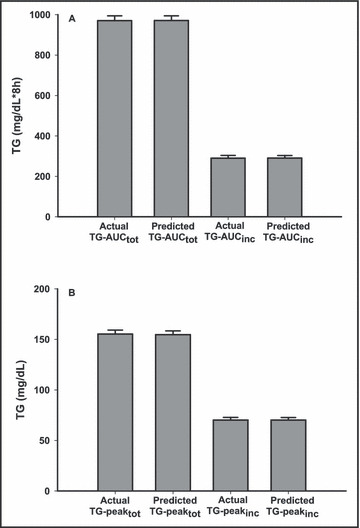
Actual vs predicted triglyceride (TG) responses (mean±SE) for (A) the area under the triglyceride curve (TG‐AUC) and (B) triglyceride peak response (TG‐peak) (mean±SE) utilizing the 4‐hour TG equations in Table IV . There were no significant differences between actual and predicted values (P>.05). TG‐AUCtot indicates total area under the triglyceride curve; TG‐AUCinc, incremental area under the triglyceride curve; TG‐peaktot, triglyceride peak response; TG‐peakinc, incremental triglyceride peak response.
Bland‐Altman plots indicated that 95% of the differences between actual measures and predicted measures fell within 2 standard deviations of the mean difference for TG‐AUCtot, TG‐AUCinc, TG‐peaktot, and TG‐peakinc (data not shown). The error scores clustered around zero on the y‐axis, indicating no fixed bias, and a lack of slope indicated no proportional bias in the predicted values. No clear patterns were detected by error data points, indicating homoscedasticity.
Bootstrap simulations were performed on the original data set to determine the estimated error of utilizing a single TG point to predict the 8‐hour PPL response to a larger study population. Estimates generated from the bootstrap simulations supported our findings from the multiple regression analyses. Bootstrap z‐statistics for the 4‐hour TG concentrations were significantly greater than the 0‐hour, 2‐hour, 6‐hour, or 8‐hour TG concentration for TG‐AUCtot (z=42.06 compared with 22.78, 26.90, 38.13, and 20.50, respectively), TG‐AUCinc, TG‐peaktot, and TG‐peakinc (data not shown), demonstrating that the 4‐hour TG value remained the greatest significant predictor of the PPL measures.
Cross‐Validation
Utilizing the 4‐hour TG prediction equations shown in Table IV, predicted values were calculated and compared with the actual PPL responses in cross‐validation groups 1 (n=119) and 2 (n=68). The developed equations with only the 4‐hour TG time point cross‐validated well (slope and intercept both were not significantly different from 1 and 0, respectively [P>.05]). The predicted measures were highly correlated with actual respective values in both cross‐validation groups (Table V). Due to the exaggerated PPL responses in cross‐validation group 2, the percentage SEE for each measure did not differ between cross‐validation groups. When utilizing equations with both the 4‐hour and 0‐hour TG levels (Table IV), correlational coefficients and SEEs for each PPL measure for both cross‐validation groups were only minimally improved (data not shown).
Table V.
Correlations Within Cross‐Validation Groups
| Cross‐Validation Group 1 (n=119) | Cross‐Validation Group 2 (n=68) | |
|---|---|---|
| TG‐AUCtot | ||
| r value | 0.97 | 0.88 |
| SEE | 111.9 | 306.5 |
| TG‐peaktot | ||
| r value | 0.98 | 0.87 |
| SEE | 14.3 | 51.7 |
| TG‐AUCinc | ||
| r value | 0.94 | 0.78 |
| SEE | 82.8 | 226.3 |
| TG‐peakinc | ||
| r value | 0.96 | 0.76 |
| SEE | 13.1 | 46.3 |
Abbreviations: SEE, standard error of estimate; TG‐AUCinc, incremental area under the triglyceride curve; TG‐AUCtot, total area under the triglyceride curve; TG‐peakinc, incremental triglyceride peak response; TG‐peaktot, triglyceride peak response. Group 1=healthy participants. Group 2=participants with hypertriglyceridemia and cardiometabolic syndrome risk factors. Correlational coefficients were generated between actual and predicted postprandial lipemic responses utilizing the 4‐hour triglyceride equations presented in Table IV. All r values are statistically significant at P<.001. The % SEE for each postprandial lipemic measure did not differ between groups.
Discussion
There is increasing evidence that TGs measured during the postprandial period provide disease risk predictive value beyond fasting concentrations. 4 , 5 , 33 , 34 It has been shown that TG levels are independent predictors of CAD in multivariate analyses including high‐density lipoprotein cholesterol, provided that a challenge test of TG metabolism such as PPL is used. 5 In addition, it has recently been recommended that assessment of specimens at specified postprandial times may have predictive value beyond fasting TG values. 33 Previous attempts have been made to determine significant predictors and to simplify the quantification of the PPL response to a high‐fat meal. Guerci and associates 26 attempted to simplify the estimate of TG‐AUCtot and TG‐AUCinc by measuring TG concentrations at 3 time points instead of the usual 5. Our multiple regression using a single time point appears to be as accurate as the methods previously described.
Although baseline (0‐hour) TG concentrations were highly correlated with each PPL measure, findings were consistent with previous reports 35 , 36 ; 4‐hour TG concentrations were more strongly correlated with each PPL measure and added predictability beyond the traditional measurement of baseline TG level. As in the present investigation, previous reports also have noted positive associations between the male sex 18 and age 17 with the PPL response. Previously, we found that PPL was related to body weight, percentage of body fat, and aerobic fitness. 19 , 20 We also previously reported the significant influence of training status on PPL responses, 6 but examination of the 8 data sets in the present study revealed no significant association between regular exercise training and the PPL response. This finding is supported by others. 37 Both obesity 19 , 38 and visceral adiposity 19 , 39 also have been shown to positively correlate with PPL; examination in a subset of PPL trials (n=218) demonstrated that although body mass index was significantly correlated with each PPL response, it did not contribute to the multiple regression models (data not shown).
We also examined the possibility that separate regression equations may be needed for the prediction of PPL either with or without the influence of a prior exercise session. Indeed, it is well established that the PPL response is significantly attenuated by as much as 50% after a single exercise session in healthy and at‐risk individuals. 7 , 8 , 21 , 22 , 23 , 24 , 25 These findings indicate that a session of exercise improves systemic TG clearance and likely reduces cardiovascular risk during the postprandial period. However, we found no significant differences between predicted PPL responses from the baseline PPL and Ex‐PPL equations when compared with the combined PPL prediction equations. This finding implies that although an acute exercise bout may reduce the TG concentrations after a high‐fat meal, the body’s removal of TGs continues to produce a similar‐shaped TG curve, suggesting that relevant factors may be similar in rest or exercise.
Cross‐validation was performed using 2 separate populations, one in healthy individuals and the second in an overweight and obese at‐risk population with elevated fasting TG concentrations and other characteristics of the cardiometabolic syndrome. The estimates produced by these equations were highly correlated to actual measures in the healthy population in cross‐validation group 1 (Table V). In agreement, Guerci and associates 26 also demonstrated high correlations from 3 time points to measure the PPL response. Perhaps more important, we also report similar high correlations in an at‐risk population. TG responses to a high‐fat challenge are exaggerated in obese compared with nonobese individuals 40 and in individuals with hypertriglyceridemia. 5 In the current study, despite slightly delayed TG clearance, the developed equations accurately predicted each of the PPL measures in the at‐risk cross‐validation group (Table V). The bootstrap estimates and the findings from cross‐validation with 2 distinct study populations suggest applicability of the equation in other settings and other populations.
Currently, PPL is not routinely measured as a risk factor for disorders such as the metabolic syndrome or CAD because of the difficulty of the procedure. The standard protocols are time‐consuming for both researchers and study participants. Participants must fast before and during the 8‐hour procedure, and researchers/clinicians must spend considerable time collecting and preparing blood samples. Reducing the number of blood samples may increase patient tolerance of the PPL procedure. In addition, simplifying the procedure can be more cost‐effective, and a shortened method allows health care providers a feasible protocol for a fat challenge test. The prognostic value of giving an oral fat challenge to examine TG metabolism may be similar to the routinely administrated oral glucose tolerance test for assessment of insulin resistance. It recently has been suggested that measurement of TG levels at defined collection points following a specified diet would be logistically practical and more definitive than measurement of fasting TG alone. 33 While there are preparatory conditions that were followed prior to the analyses in the current investigation, being able to estimate the entire postprandial response with one specified time point could provide additional risk factor assessment capabilities.
In conclusion, our findings suggest that the 4‐hour TG concentration is highly related to the total 8‐hour PPL response and can be used for accurate estimation of the postprandial response in healthy and at‐risk individuals. The abbreviated single‐point method could be a useful addition in clinical risk factor assessment.
Acknowledgments: The authors thank Richard Cox, PhD, Ray Bacon, PhD, and Lori Thombs, PhD, for their helpful suggestions on the statistical analyses. This work was supported by the Elizabeth Hegarty Foundation and University of Missouri‐Columbia Research Council.
References
- 1. Lupattelli G, Pasqualini L, Siepi D, et al. Increased postprandial lipemia in patients with normolipemic peripheral arterial disease. Am Heart J. 2002;143:733–738. [DOI] [PubMed] [Google Scholar]
- 2. Kolovou GD, Daskalova D, Iraklianou SA, et al. Postprandial lipemia in hypertension. J Am Coll Nutr. 2003;22:80–87. [DOI] [PubMed] [Google Scholar]
- 3. Parks EJ. Recent findings in the study of postprandial lipemia. Curr Atheroscler Rep. 2001;3:462–470. [DOI] [PubMed] [Google Scholar]
- 4. Bansal S, Buring JE, Rifai N, et al. Fasting compared with nonfasting triglycerides and risk of cardiovascular events in women. JAMA. 2007;298:309–316. [DOI] [PubMed] [Google Scholar]
- 5. Patsch JR, Miesenbock G, Hopferwieser T, et al. Relation of triglyceride metabolism and coronary artery disease. Studies in the postprandial state. Arterioscler Thromb. 1992;12:1336–1345. [DOI] [PubMed] [Google Scholar]
- 6. Ziogas GG, Thomas TR, Harris WS. Exercise training, postprandial hypertriglyceridemia, and LDL subfraction distribution. Med Sci Sports Exerc. 1997;29:986–991. [DOI] [PubMed] [Google Scholar]
- 7. Kolifa M, Petridou A, Mougios V. Effect of prior exercise on lipemia after a meal of moderate fat content. Eur J Clin Nutr. 2004;58:1327–1335. [DOI] [PubMed] [Google Scholar]
- 8. Zhang JQ, Thomas TR, Ball SD. Effect of exercise timing on postprandial lipemia and HDL cholesterol subfractions. J Appl Physiol. 1998;85:1516–1522. [DOI] [PubMed] [Google Scholar]
- 9. Koba S, Tsunoda F, Hirano T, et al. Postprandial changes in LDL phenotypes in patients with myocardial infarction. Eur J Clin Invest. 2005;35:171–179. [DOI] [PubMed] [Google Scholar]
- 10. Graner M, Kahri J, Nakano T, et al. Impact of postprandial lipaemia on low‐density lipoprotein (LDL) size and oxidized LDL in patients with coronary artery disease. Eur J Clin Invest. 2006;36:764–770. [DOI] [PubMed] [Google Scholar]
- 11. Esposito K, Ciotola M, Sasso FC, et al. Effect of a single high‐fat meal on endothelial function in patients with the metabolic syndrome: role of tumor necrosis factor‐alpha. Nutr Metab Cardiovasc Dis. 2007;17:274–279. [DOI] [PubMed] [Google Scholar]
- 12. Lefevre M, Kris‐Etherton PM, Zhao G, et al. Dietary fatty acids, hemostasis, and cardiovascular disease risk. J Am Diet Assoc. 2004;104:410–419; quiz 492. [DOI] [PubMed] [Google Scholar]
- 13. Hilpert KF, West SG, Kris‐Etherton PM, et al. Postprandial effect of n‐3 polyunsaturated fatty acids on apolipoprotein B‐containing lipoproteins and vascular reactivity in type 2 diabetes. Am J Clin Nutr. 2007;85:369–376. [DOI] [PubMed] [Google Scholar]
- 14. Zock PL. Postprandial lipoprotein metabolism‐‐pivot or puzzle? Am J Clin Nutr. 2007;85:331–332. [DOI] [PubMed] [Google Scholar]
- 15. Marchesi S, Lupattelli G, Schillaci G, et al. Impaired flow‐mediated vasoactivity during post‐prandial phase in young healthy men. Atherosclerosis. 2000;153:397–402. [DOI] [PubMed] [Google Scholar]
- 16. Pirro M, Lupattelli G, Siepi D, et al. Postprandial lipemia and associated metabolic disturbances in healthy and hyperlipemic postmenopausal women. Metabolism. 2001;50:330–334. [DOI] [PubMed] [Google Scholar]
- 17. Issa JS, Diament J, Forti N. Postprandial lipemia: influence of aging. Arq Bras Cardiol. 2005;85:15–19. [DOI] [PubMed] [Google Scholar]
- 18. Couillard C, Bergeron N, Prud’homme D, et al. Gender difference in postprandial lipemia: importance of visceral adipose tissue accumulation. Arterioscler Thromb Vasc Biol. 1999;19:2448–2455. [DOI] [PubMed] [Google Scholar]
- 19. Mekki N, Christofilis MA, Charbonnier M, et al. Influence of obesity and body fat distribution on postprandial lipemia and triglyceride‐rich lipoproteins in adult women. J Clin Endocrinol Metab. 1999;84:184–191. [DOI] [PubMed] [Google Scholar]
- 20. Merrill JR, Holly RG, Anderson RL, et al. Hyperlipemic response of young trained and untrained men after a high fat meal. Arteriosclerosis. 1989;9:217–223. [DOI] [PubMed] [Google Scholar]
- 21. Altena TS, Michaelson JL, Ball SD, et al. Single sessions of intermittent and continuous exercise and postprandial lipemia. Med Sci Sports Exerc. 2004;36:1364–1371. [DOI] [PubMed] [Google Scholar]
- 22. Zhang JQ, Ji LL, Nunez G, et al. Effect of exercise timing on postprandial lipemia in hypertriglyceridemic men. Can J Appl Physiol. 2004;29:590–603. [DOI] [PubMed] [Google Scholar]
- 23. Smith BK, Sun GY, Donahue OM, et al. Exercise plus n‐3 fatty acids: additive effect on postprandial lipemia. Metabolism. 2004;53:1365–1371. [DOI] [PubMed] [Google Scholar]
- 24. Thomas TR, Fischer BA, Kist WB, et al. Effects of exercise and n‐3 fatty acids on postprandial lipemia. J Appl Physiol. 2000;88:2199–2204. [DOI] [PubMed] [Google Scholar]
- 25. Zhang JQ, Ji LL, Fretwell VS, et al. Effect of exercise on postprandial lipemia in men with hypertriglyceridemia. Eur J Appl Physiol. 2006;98:575–582. [DOI] [PubMed] [Google Scholar]
- 26. Guerci B, Paul JL, Hadjadj S, et al. Analysis of the postprandial lipid metabolism: use of a 3‐point test. Diabetes Metab. 2001;27:449–457. [PubMed] [Google Scholar]
- 27. Altena TS, Michaelson JL, Ball SD, et al. Lipoprotein subfraction changes after continuous or intermittent exercise training. Med Sci Sports Exerc. 2006;38:367–372. [DOI] [PubMed] [Google Scholar]
- 28. Thomas TR, Liu Y, Linden MA, et al. Interaction of exercise training and n‐3 fatty acid supplementation on postprandial lipemia. Appl Physiol Nutr Metab. 2007;32:473–480. [DOI] [PubMed] [Google Scholar]
- 29. ACSM (ed.). American College of Sport Medicine. ACSM’s Guidelines for Exercise Testing and Prescription. 6th ed. Philadelphia, PA: Lippincott Williams & Wilkins; 2000. [Google Scholar]
- 30. Alberti KG, Zimmet P, Shaw J. Metabolic syndrome – a new world‐wide definition. A Consensus Statement from the International Diabetes Federation. Diabet Med. 2006;23:469–480. [DOI] [PubMed] [Google Scholar]
- 31. Thomas TR, Horner KE, Langdon MM, et al. Effect of exercise and medium‐chain fatty acids on postprandial lipemia. J Appl Physiol. 2001;90:1239–1246. [DOI] [PubMed] [Google Scholar]
- 32. Tai MM. A mathematical model for the determination of total area under glucose tolerance and other metabolic curves. Diabetes Care. 1994;17:152–154. [DOI] [PubMed] [Google Scholar]
- 33. Warnick GR, Nakajima K. Fasting versus nonfasting triglycerides: implications for laboratory measurements. Clin Chem. 2008;54:14–16. [DOI] [PubMed] [Google Scholar]
- 34. Ridker PM. Fasting versus nonfasting triglycerides and the prediction of cardiovascular risk: do we need to revisit the oral triglyceride tolerance test? Clin Chem. 2008;54:11–13. [DOI] [PubMed] [Google Scholar]
- 35. Sharrett AR, Heiss G, Chambless LE, et al. Metabolic and lifestyle determinants of postprandial lipemia differ from those of fasting triglycerides: The Atherosclerosis Risk In Communities (ARIC) study. Arterioscler Thromb Vasc Biol. 2001;21:275–281. [DOI] [PubMed] [Google Scholar]
- 36. Syvanne M, Talmud PJ, Humphries SE, et al. Determinants of postprandial lipemia in men with coronary artery disease and low levels of HDL cholesterol. J Lipid Res. 1997;38:1463–1472. [PubMed] [Google Scholar]
- 37. Herd SL, Lawrence JE, Malkova D, et al. Postprandial lipemia in young men and women of contrasting training status. J Appl Physiol. 2000;89:2049–2056. [DOI] [PubMed] [Google Scholar]
- 38. Vansant G, Mertens A, Muls E. Determinants of postprandial lipemia in obese women. Int J Obes Relat Metab Disord. 1999;23(suppl 1):14–21. [DOI] [PubMed] [Google Scholar]
- 39. Blackburn P, Lamarche B, Couillard C, et al. Contribution of visceral adiposity to the exaggerated postprandial lipemia of men with impaired glucose tolerance. Diabetes Care. 2003;26:3303–3309. [DOI] [PubMed] [Google Scholar]
- 40. Lewis GF, O’Meara NM, Soltys PA, et al. Postprandial lipoprotein metabolism in normal and obese subjects: comparison after the vitamin A fat‐loading test. J Clin Endocrinol Metab. 1990;71:1041–1050. [DOI] [PubMed] [Google Scholar]