Abstract
Significance
Optical coherence tomography (OCT) summary measures have been suggested as a way to detect progression in eyes with advanced glaucoma. Here, we show that these measures have serious flaws, largely due to segmentation errors. However, inspection of the images and thickness maps can be clinically useful.
Purpose.
To test the hypothesis that recently suggested global OCT measures for detecting progression in eyes with advanced progression are seriously affected by segmentation mistakes, and other errors, that limit their clinical utility.
Methods.
45 eyes of 38 patients with a 24-2 mean deviation (MD) worse than −12 dB had at least 2 spectral domain (SD) OCT sessions (0.8 to 4.4 years apart) with 3.5mm circle scans of the disc and cube scans centered on the fovea. Average (global) circumpapillary retinal nerve fiber layer thickness, GcRNFL, and ganglion cell plus inner plexiform layer thickness, GGCLP, were obtained from the circle and cube scan, respectively. To evaluate progression, ΔGcRNFL was calculated for each eye as the GcRNFL value at time 2 minus the value at time 1, and ΔGGCLP in a similar manner. The b-scans of the 6 eyes with the highest and lowest ΔGcRNFL and ΔGGCLP values were examined for progression as well as segmentation, alignment, and centering errors.
Results.
Progression was a major factor in only 7 of the 12 eyes with the most negative values of either ΔGcRNFL or ΔGGCLP, while segmentation played a role in 8 eyes, and was the major factor in all 12 eyes with the largest positive values. In addition, alignment (1 eye) and other (3 eyes) errors played a secondary role in 4 of the 6 eyes with most negative Δ GcRNFL values.
Conclusions.
For detecting progression of advanced glaucoma, common summary metrics have serious flaws, largely due to segmentation errors, which limit their utility in clinical and research settings.
Timely recognition of disease progression in advanced glaucoma is critical because these patients carry the greatest risk of becoming significantly visually impaired or even blind.1, 2 Yet, evaluating progression in such eyes is difficult because the standard functional and structural tests that inform treatment decisions in early stages of the disease face technical limitations in advanced disease. First, it has been shown that visual fields have reduced reproducibility with increased disease severity, especially when the 24-2 mean deviation (MD) is worse than −15dB.3-6 Second, the most commonly used optical coherence tomography (OCT) measure, average (global) circumpapillary retinal nerve fiber layer (cRNFL) thickness (GcRNFL), reaches a “floor” for 24-2 mean deviation losses worse than about −10 dB.7-11
With advances in OCT allowing for high resolution imaging of the macula, it has been suggested that retinal ganglion cell plus inner plexiform layer (GCLP) thickness could play an important role in detecting progression in eyes with advanced disease. In fact, recent studies have shown that average (global) GCLP thickness (GGCLP) outperforms GcRNFL in eyes with advanced glaucoma.12-15 Bowd et al. attributed this to the greater ganglion cell tissue remaining above the measurement floor as compared to RNFL.16 On the other hand, Lee et al. found preserved regions of cRNFL in eyes with GcRNFL levels below what is typically considered the floor value.17 Thus, in principle, GcRNFL can be used in conjunction with GGCLP in eyes with advanced glaucoma.
However, there are reasons to question the utility of both GcRNFL and GGCLP. These measures have errors due to, for example, segmentation of retinal layers on OCT images, that make them suboptimal for following progression.18-24 While these studies did not focus on advanced glaucoma, there are reasons to believe that these problems will be at least as serious in the case of eyes with advanced glaucoma. This is important because escalation of therapy in stable eyes can lead to vision-threatening consequences and missing true progression can lead to irreversible vision loss and quality of life.
In short, there is a need to better understand the factors affecting GcRNFL and GGCLP measures of progression in advanced glaucoma. Here we test the hypothesis that these global OCT measures for detecting progression in eyes with advanced progression are seriously affected by segmentation mistakes, and other errors, that limit their clinical utility.
METHODS
Participants
45 eyes of 38 patients (66±15.1 yrs, range: 22 to 83 yrs) were selected from a larger group of patients referred by glaucoma specialists based on a comprehensive ophthalmologic exam including medical history, visual acuity, intraocular pressure, slit lamp biomicroscopy, dilated fundoscopic exam, and visual fields. The inclusion and exclusion criteria for the selected 45 eyes in this study are as follows:
Inclusion criteria: Eyes were only included if they had at least 2 visits with reliable 24-2 visual fields and were classified as having advanced glaucoma based on 24-2 MD≤−12 dB (SITA-Standard, Humphrey Field Analyzer; Carl Zeiss Meditec, Inc., Dublin, CA) on the second visit. A visual field was considered reliable if it had fixation losses under 33%, false positives under 15%, and false negatives under 33%. The average 24-2 mean deviation of the visual fields on the first and second visit were −17dB (range: −26dB to −11dB) and −17dB (range: −28dB to −12dB), respectively. By the second visit, seven eyes were being followed with 10-2 visual fields only. For these eyes, the last 24-2 visual fields were used to confirm a MD≤−12 dB (average −21dB, range: −26dB to −15dB).
Exclusion criteria: Eyes with non-glaucomatous optic neuropathy or coexisting retinal pathology apart from epiretinal membranes were excluded. Eyes with epiretinal membranes were not excluded because they are common, and we wanted our sample to be as clinically relevant as possible. Eyes with a refractive error less than −6 diopters or greater than +3 diopters were excluded.
This research was reviewed by an independent ethical review board and conforms with the principles and applicable guidelines for the protection of human subjects in biomedical research. The institutional review boards approved the study methodology, which adheres to the tenets of the Declaration of Helsinki and to the Health Insurance Portability and Accountability Act. Written informed consent was obtained from all participants involved in the study.
Imaging and Global GCLP (GGCLP) and cRNFL (GcRNFL)
Each eye had at least 2 spectral domain OCT imaging sessions (called time 1 and time 2 below), on average 2.3 years apart (range: 0.8 to 4.4 years), with the Spectralis OCT instrument using the Glaucoma Module Premium Edition protocol (Heidelberg Engineering Inc., Heidelberg, Germany). The circle scans (average of 100 B-scans) of the disc and the 30°x25° cube scans of the macula (61 horizontal B-scans) were used in this study. Prior to imaging, standard keratometry values for each patient were collected using an automated biometry instrument (Zeiss IOL Master, Carl Zeiss Meditec AG., Jena, Germany). The corneal curvature of each eye was entered into the instrument database, and during imaging, the technician adjusted for axial length.
The GcRNFL was derived from the 3.5mm averaged circle scan and the GGCLP from a circular area 16° in diameter centered on the fovea of the cube scan. To evaluate progression, ΔGcRNFL and ΔGGCLP were calculated as the differences (Time 2 – Time 1) of the GcRNFL and GGCLP values.
Post-hoc Analysis of B-Scans
We hypothesized that several factors unrelated to progression can affect the values of GGCLP and GcRNFL. Based upon prior work these factors included segmentation errors, alignment of the images from two test days, and an apparent change in retinal thickness between the two dates.18-24
We expected alignment errors might have a relatively minor effect, as the Spectralis OCT incorporates eye tracking, which in principle should help ensure that the same location of the retina is scanned each time.24 In any case, we evaluated alignment based upon the location of blood vessel shadows in the supero-temporal and infero-temporal region of Time 1 and Time 2 circle b-scans. The most recent scan was considered misaligned if the same blood vessel was shifted by more than its measured width (see an example in Appendix Figure A1, available at [LWW insert link]).
We evaluated the quality of segmentation in each b-scan by inspecting the segmentation lines that demarcate the ILM and RNFL boundaries, respectively. A scan was considered poorly segmented if: 1) the segmentation lines clearly failed to identify their borders, and 2) the poorly segmented region was larger than 5 degrees. Appendix Figure A1, available at [LWW insert link], provides an example of a poorly segmented scan.
The third factor is what we have called an “apparent change in retinal thickness” (aΔRT).24 We were able to confirm the presence of this aΔRT artifact by placing line markers of equal length between the two scans. Those line markers were based upon the distance between a well-identified boundary (e.g. inner plexiform layer/outer plexiform layer) and another retinal or choroidal identifiable marker in the b-scan of Time 1. Appendix Figure A2, available at [LWW insert link], shows an example of an eye with aΔRT artifact between the two scans.
The b-scans of the 6 eyes with the highest and lowest ΔGcRNFL and ΔGGCLP values were examined for alignment, segmentation, and aΔRT errors. These 3 errors, as well as possible progression, were ranked by importance (e.g. 1, 2 and 3), as described in the Results.
Post-hoc Analysis of Progression
To evaluate progression, 4 of the authors (AT, ET, ME and DH) independently evaluated two OCT reports from both Time 1 and Time 2. One report was the commercially available circle scan report shown in Fig. 1. It includes a cpRNFL b-scan image (panels A and C) from the 3.5mm averaged circle scan, and the corresponding cpRNFL thickness profiles (B, D) with the nasal region of the disc at the center (i.e. TSNIT orientation). For the reports for Time 2 (panel D), the cpRNFL thickness profile of the baseline (Time 1) scan is shown in gray (black arrow). The other report was a version of a Heidelberg Hood Glaucoma Report (see Fig. 2), which is based upon our lab one-page OCT report.25 Note that this version of the report, shown in Fig. 2, is available in some locations outside the USA. Within the USA, it is for research purposes only and is not approved for clinical use.
Figure 1.
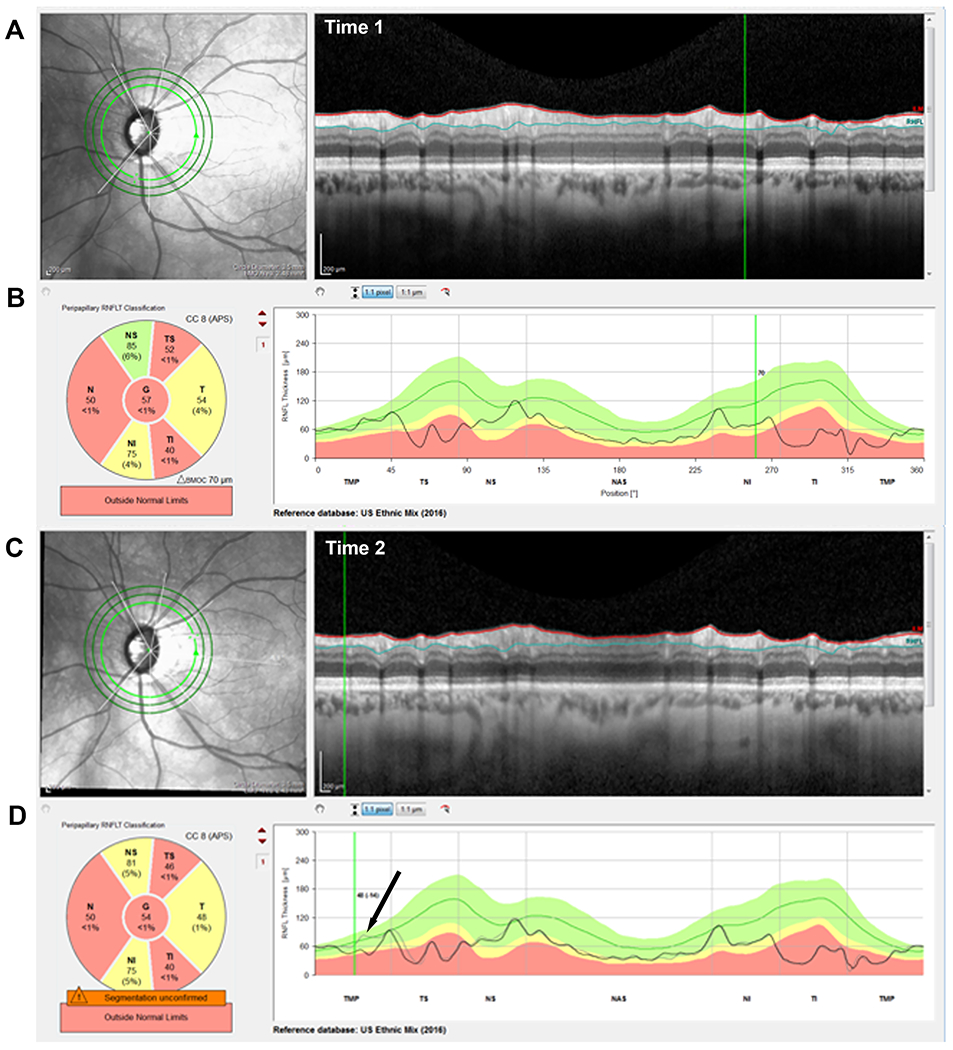
An example of a progressing eye. (A & C) The IR images and circle b-scans for time 1 & 2, respectively. (B & D) The cRNFL thickness profiles/curves for time 1 & 2, respectively. The black arrow in panel D indicates the region of progression, as shown by the difference between the gray (time 1) and black (time 2) curves and confirmed in the corresponding b-scans A & C.
Figure 2.
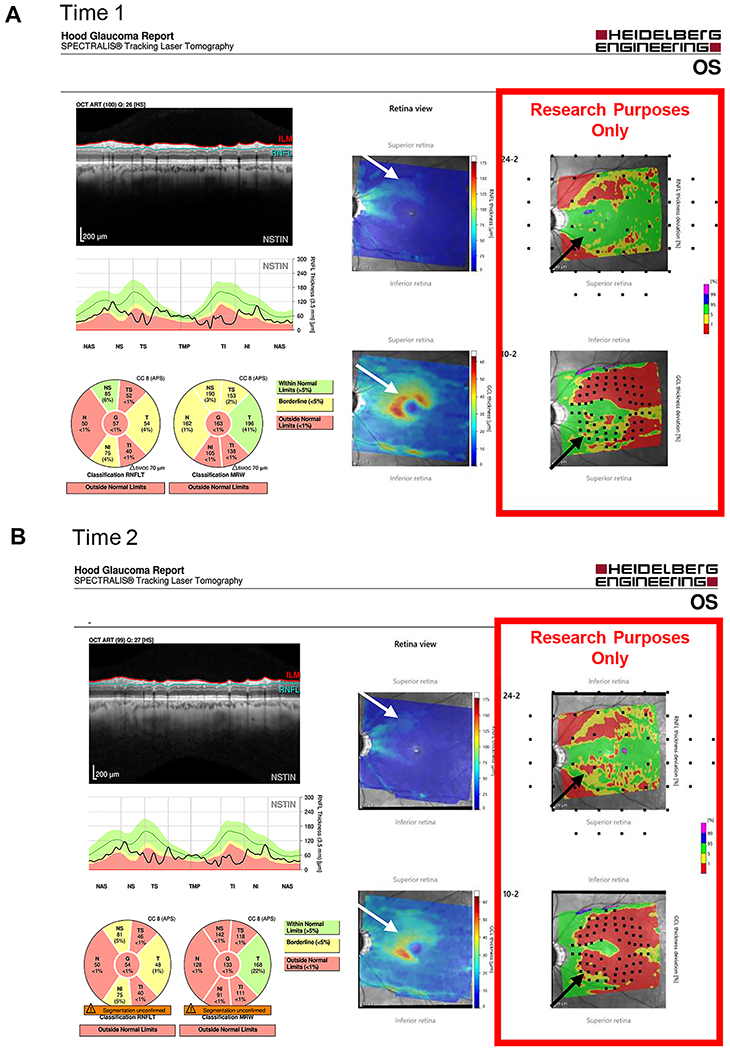
An example of a progressing eye. (A) A version of the Heidelberg Hood Glaucoma Report, available in some locations outside the USA, for time 1; and (B) for time 2. RNFL and RGC probability plots (red rectangles) deriving from the corresponding thickness plots are included. These are presented in field view, that is, with the inferior retina/superior visual field on top. Black and white arrows show regions of progression
Any differences in the diagnoses of progression between evaluators were adjudicated, and consensus was reached, through a collective qualitative evaluation of the two reports described above.
RESULTS
Figure 3 shows the ΔGcRNFL (panel A) and ΔGGCLP (panel B) values, that is the changes in GcRNFL and GGCLP between times 1 and 2. Each circle represents one of the 45 eyes, and the vertical black dashed line at zero indicates no change. For each eye, a negative value (i.e., to the left of this line), is consistent with progression, while a positive value is consistent with “improvement”. In any case, our purpose here was not to compare GcRNFL to GGCLP measures, nor to obtain an estimate of the number of False-Positives or False-Negatives. Rather, we sought to better understand the potential problems with these metrics. To this end, we examined the b-scans of individual eyes with the largest decreases (negative ΔGcRNFL and ΔGGCLP, solid black rectangles in Fig. 3) and the largest increases (positive ΔGcRNFL and ΔGGCLP, dashed black rectangles) in GcRNFL and GGCLP values.
Figure 3.
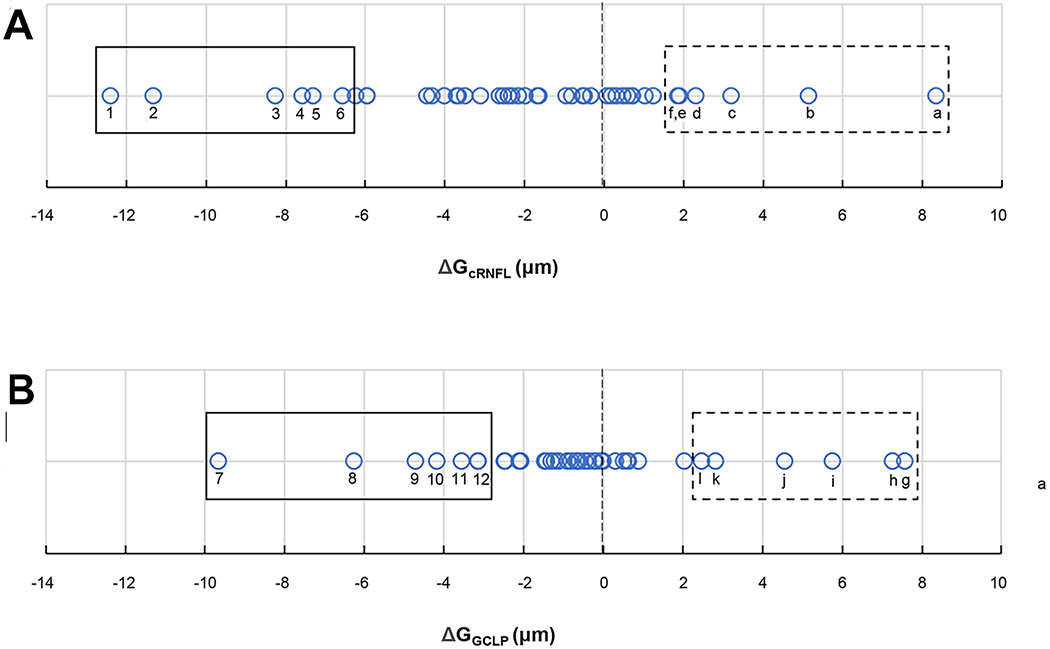
Distributions of (A) ΔGcRNFL and (B) ΔGGCLP values in microns, where each circle represents one eye.
ΔGcRNFL Analysis
The circumpapillary b-scans of the 6 eyes with the most negative and most positive ΔGcRNFL were examined. Causes for these extreme values included progression, segmentation errors, alignment errors, and scaling. These categories are listed in the columns of Table 1 and described further below. The first 12 rows are for the 12 eyes within the rectangles of Fig. 3A. The numbers in the columns indicate the primary (1), secondary (2), and tertiary (3) causes.
Table 1.
Factors contributing to 6 most negative and 6 most positive values of ΔGcRNFL and ΔGGCLP.
| ID | Progression | Segmentation | Alignment | Apparent Change in Retinal Thickness | Change in cRNFL or GCLP (um) | |
|---|---|---|---|---|---|---|
| ΔGcRNFL Extreme Negative Eyes |
1 | 1 | 2 | −12.4 | ||
| 2 | 2 | 1 | 3 | −11.3 | ||
| 3 | 1 | −8.3 | ||||
| 4 | 1 | −7.6 | ||||
| 5 | 1 | 2 | −7.3 | |||
| 6 | 1 | 2 | −6.6 | |||
|
| ||||||
| ΔGcRNFL Extreme Positive Eyes |
a | 1 | 8.5 | |||
| b | 1 | 5.1 | ||||
| c | 1 | 3.2 | ||||
| d | 1 | 2.3 | ||||
| e | 1 | 1.9 | ||||
| f | 1 | 1.9 | ||||
|
| ||||||
| ΔGGCLP Extreme Negative Eyes |
7 | 1 | 2 | - | −9.7 | |
| 8 | 1 | - | −6.3 | |||
| 9 | 1 | −4.7 | ||||
| 10 | 1 | 2 | −4.2 | |||
| 11 | 1 | −3.6 | ||||
| 12 | 1 | −3.1 | ||||
|
| ||||||
| ΔGGCLP Extreme Positive Eyes |
g | 1 | 7.6 | |||
| h | 1 | 7.3 | ||||
| i | 1 | 5.8 | ||||
| j | 1 | 4.5 | ||||
| k | 1 | 2.8 | ||||
| l | 1 | 2.5 | ||||
Extreme Negative Eyes
Progression appeared to be a factor in only 3 of the 6 eyes with the most negative ΔGcRNFL values (eyes 2,3,4), and the only factor in only 2 of these eyes. Figure 4 (ID 3) provides an example of the latter. A conclusion of “progression” was reached by first examining the red and blue segmentation lines in panels A and B of Fig. 4 to assess: 1. If the segmentation was accurate (i.e., included the RNFL between the red and blue lines); and 2. If these lines included the same structures in the b-scans for times 1 and 2. This was largely the case for the eye in Fig. 4. Second, the gray (time 1) and black (time 2) curves in panel C were examined for evidence of progression. The black horizontal arrows indicated the regions that appeared to be thinning between test times. In particular, the black (time 2) curve in the lower panel fell below the gray curve for nearly all regions except the temporal region (TMP) and a small portion of the superior temporal (TS) region. Finally, the associated regions on the b-scans (white horizontal arrows) were examined to confirm that the RNFL was indeed thinner at time 2. Again, this appeared to be the case for this eye, as the thickness of the cRNFL appears thinner on time 2 in the regions below the white arrows. The results for the other eye (ID 4) with progression as the only factor can be found in Appendix Figure A3, available at [LWW insert link].
Figure 4.
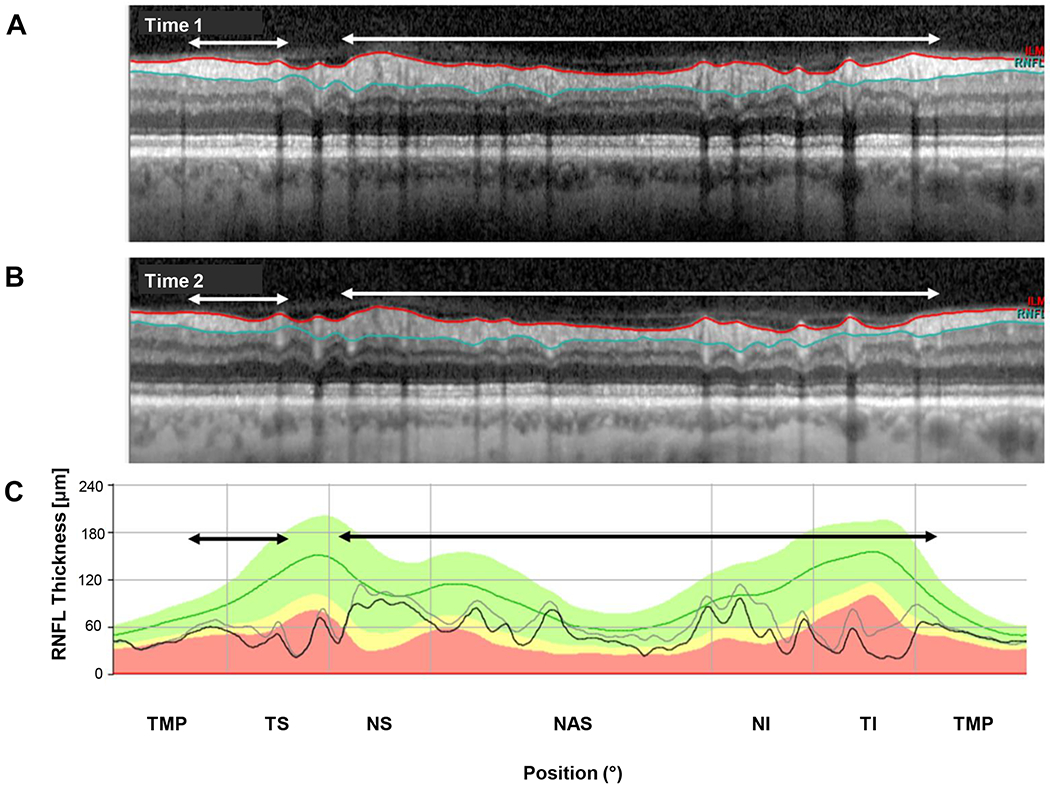
An example of progression. (A) The circumpapillary b-scan from time 1. (B) The b-scan for time 2. C. The cRNFL thickness profiles for the first (gray) and second (black) times. The black and white arrows show regions of progression. (Eye ID 3)
As expected, segmentation errors were common. They were the primary factor in 4 of the 6 eyes with large negative ΔGcRNFL values (eyes 1,2,5,6). Figure 5 shows the results for eye 2, the eye with the second most extreme negative ΔGcRNFL value. Notice that the segmentation lines in the time 2 scan (Fig. 5B), include less of the blood vessels, as compared to time 1 (white and black arrows). These errors in segmentation near the blood vessels were the major contributor to the −11.3 μm change. On the other hand, there was progression in this eye, and it contributed to the negative ΔGcRNFL in the region of the black and white rectangles, especially in region indicated with the red arrows. Notice that the black curve falls below the gray in the black rectangle in bottom panel, and the cRNFL is clearly thinning within this region as can be seen by inspecting the cRNFL in the white rectangles in the upper 2 panels. The results for the other 3 eyes (1,5,6) for which segmentation was the major factor can be found in Figs. 6, Appendix Figure A1, available at [LWW insert link] and Appendix Figure A2, available at [LWW insert link].
Figure 5.
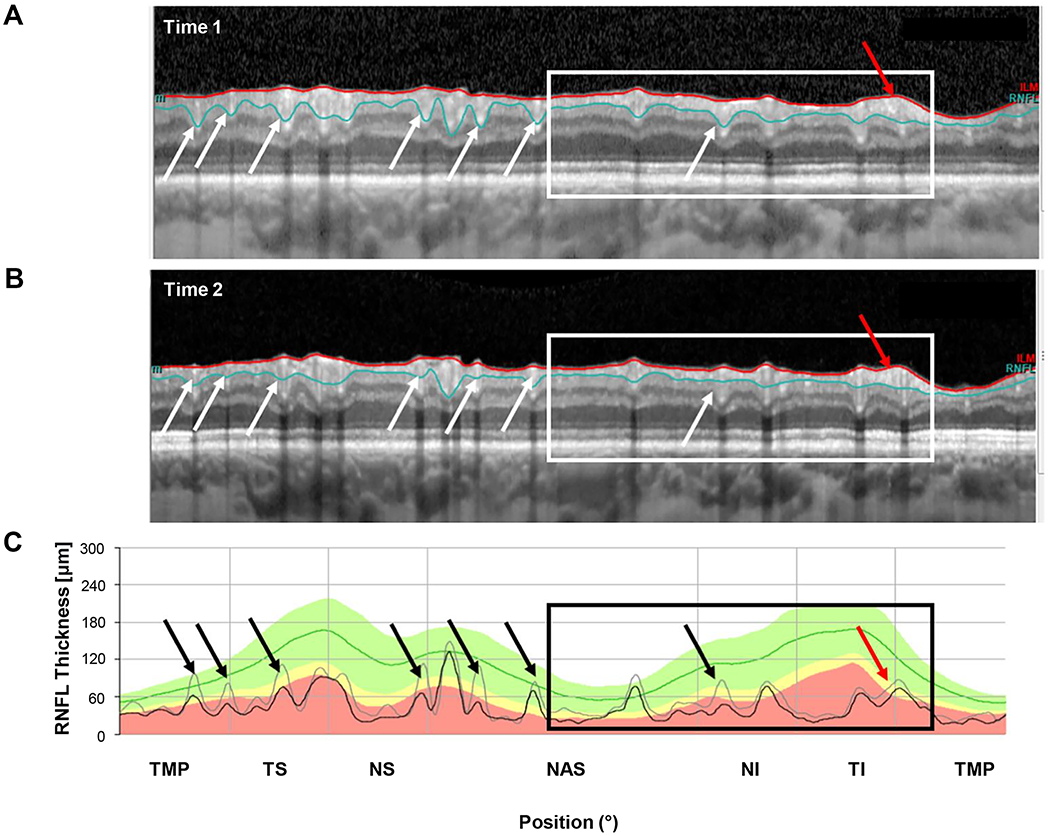
An example of segmentation errors. (A) The circumpapillary b-scan from time 1. (B) The b-scan for time 2. C. The cRNFL thickness profiles for the first (gray) and second (black) times. The black and white arrows show regions where there are segmentation errors (time 1 includes less of the blood vessels than time 2). Progression can also be seen in the region within the black and white rectangles., especially where indicated by the red arrow. (Eye ID 2)
Figure 6.
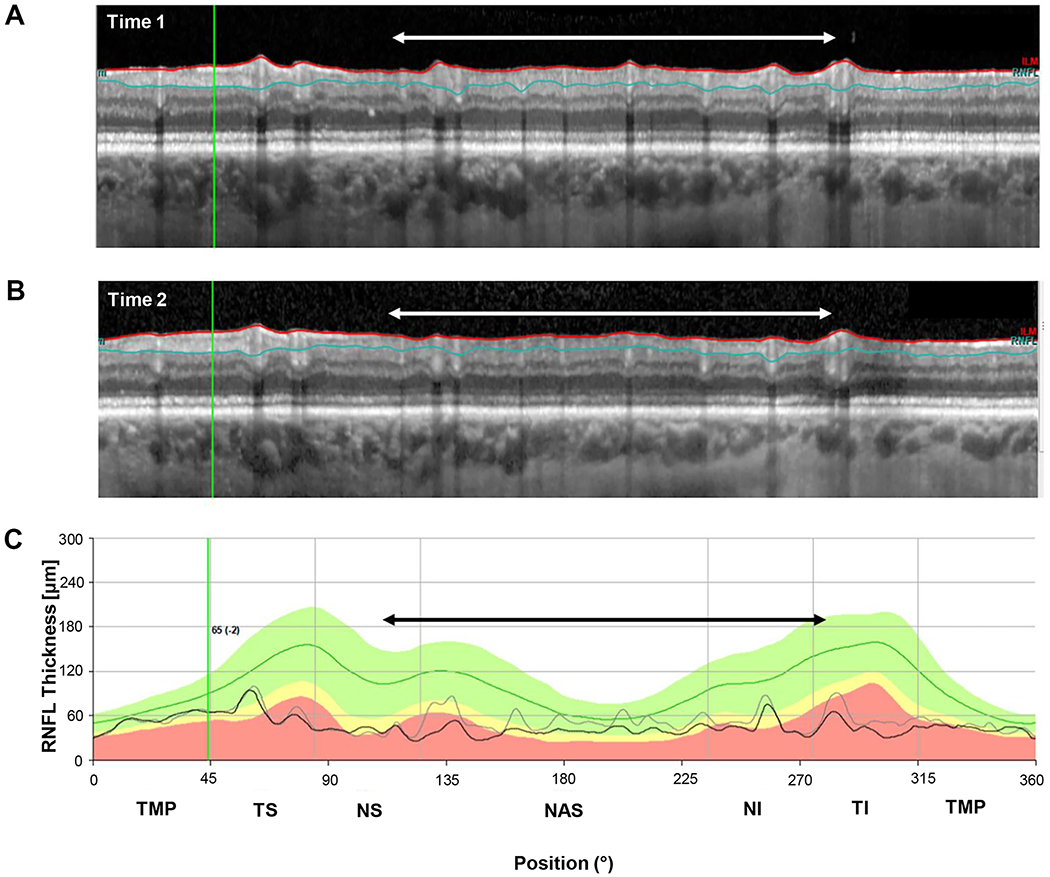
An example of segmentation errors. (A) The circumpapillary b-scan from time 1. (B) The b-scan for time 2. C. The cRNFL thickness profiles for the first (gray) and second (black) times. The black and white arrows show regions where there are segmentation errors (time 1 includes less of the GCLP than time 2). (Eye ID 5)
While segmentation and progression were by far the major factors contributing to the largest negative ΔGcRNFL values, two other factors, alignment and aΔRT played a lesser role. In general, the alignment was excellent, and appeared to be a factor in only eye 1, as illustrated in Appendix Figure A1, available at [LWW insert link], which also illustrates the method used to assess alignment. Further, 3 eyes had small changes in aΔRT, less than 5%. This is illustrated in the insets of Appendix Figure A2, available at [LWW insert link] (eye 6).
Extreme Positive Eyes
Segmentation was the most important factor in all of the 6 eyes with the largest positive ΔGcRNFL value. Figure 7 shows the cRNFL reports for the eye (a) with the largest positive change (+8.6 um) ΔGcRNFL value. In this example, the algorithm located the RNFL/GCL border consistently lower on Time 2.
Figure 7.
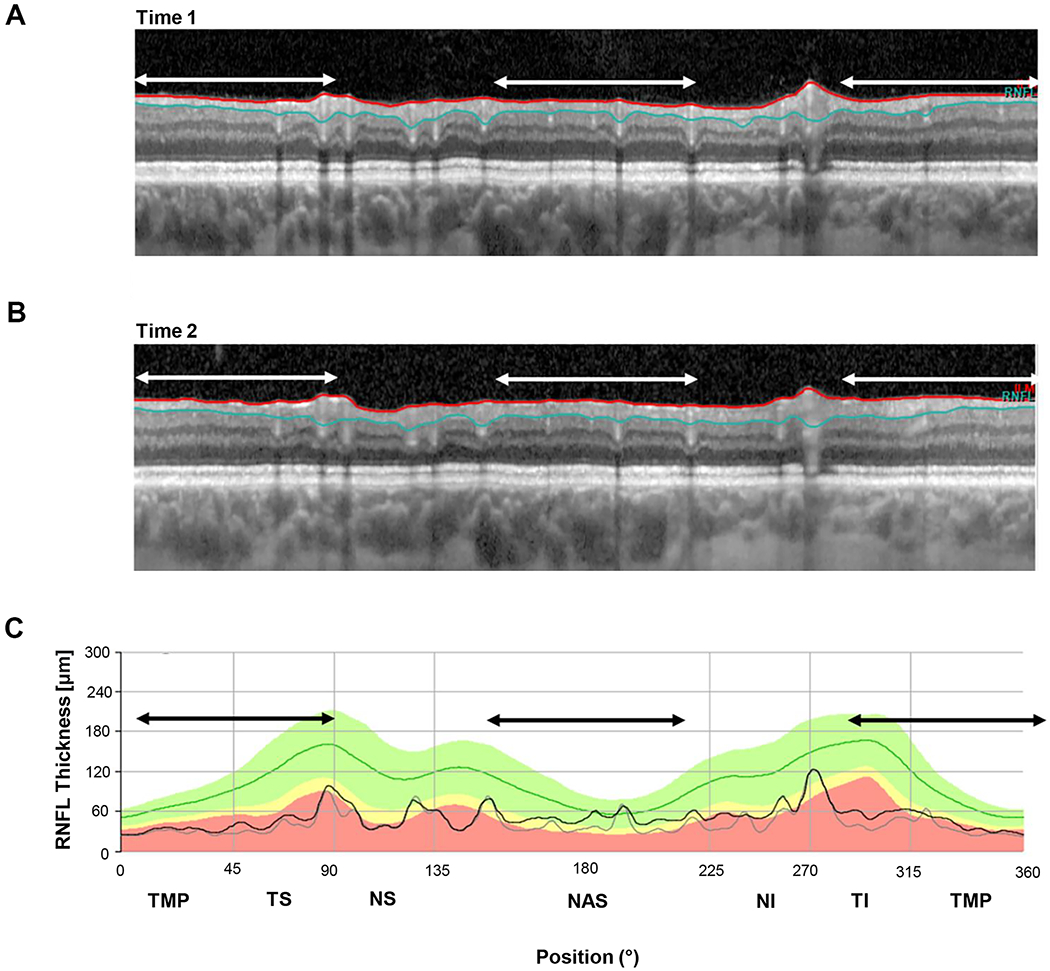
An example of segmentation errors. (A) The b-scan for time 1. (B) The b-scan for time 2. C. The cRNFL thickness profiles for the first (gray) and second (black) times. The black and white arrows indicate regions where there are segmentation errors. In this example, the algorithm located the RNFL/GCL border consistently lower on time 2. (Eye ID a)
ΔGGCLP Analysis
The individual b-scans of the cube scans of the 6 eyes with the most negative and 6 most positive ΔGGCLP values (within black solid and dashed rectangles, respectively) were also examined. As was the case for ΔGcRNFL, the primary causes for these extreme values included progression and segmentation errors (Table 1, lower 12 rows). Unlike the cRNFL analysis, none of the eyes in the GCLP analysis had aΔRT or alignment problems that could be discerned.
Extreme Negative Eyes
Progression was the primary reason for the negative ΔGGCLP value in 4 of the 6 eyes (eyes 7,8,10,12) with the most negative ΔGGCLP values. Figure 8A (eye 7) provides an example. The conclusion about progression was reached by first examining the b-scans through the fovea. In particular, the boundaries of GCLP layer determined by the segmentation algorithm (green and blue lines) were examined to assess if: 1. the segmentation was accurate, and 2. If the green and blue lines included the same structures in both b-scans. Both conditions were met in this case. Second, both b-scans were examined for evidence of GCLP thinning, as well as to rule out any other retinal pathology. See the insets and white vertical arrows for evidence of progressive thinning of GCLP in this case. Finally, the thickness maps, shown in the panels to the left, were used to help confirm the presence of GCLP thinning (white arrows). In addition, the images of the other b-scans in the cube scan were assessed in the same fashion, and particular attention was given to regions of obvious GCLP changes in thickness, as illustrated by the white arrow in Fig. 4B (left panel), which indicates a region that was thicker on the second test day.
Figure 8.
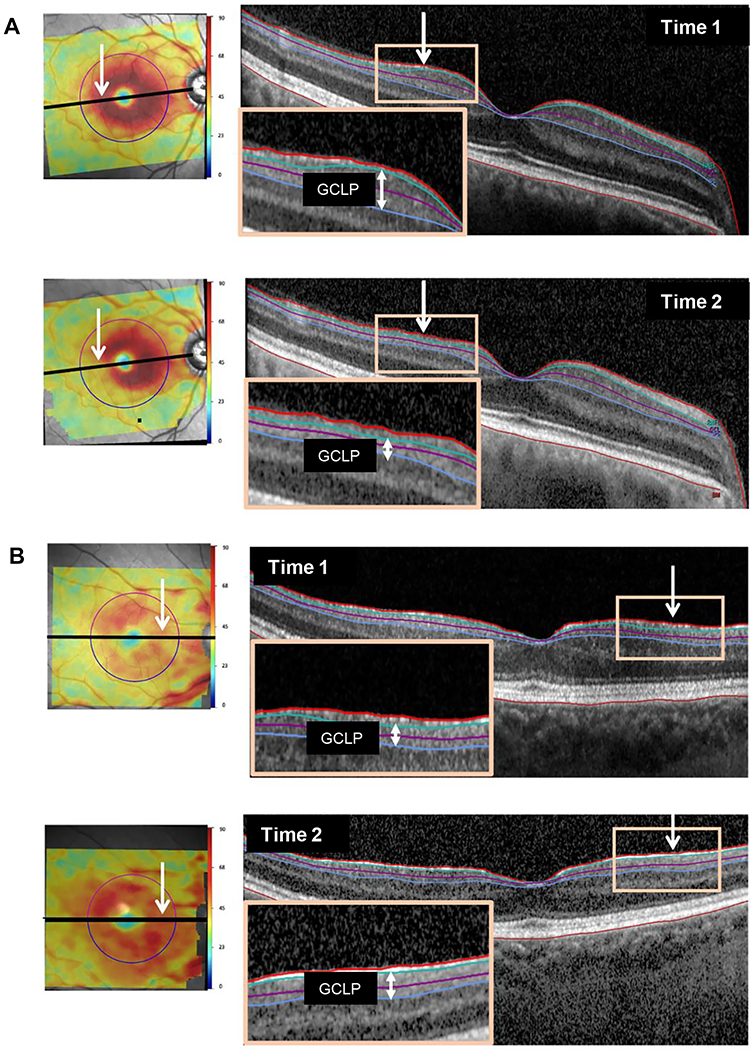
(A) An example of progression: macular thickness maps (left panels) for both times along with b-scans (right panels) through the fovea. Insets highlight thinning of the GCLP (vertical white arrows). (Eye ID 7). (B) An example of segmentation errors: same as panel A but with insets highlighting the segmentation errors. (Eye ID g)
Segmentation errors were a primary or secondary component in 4 of the 6 eyes (IDs 7, 9-11) with large negative changes.
Extreme Positive Eyes
Segmentation was the main factor in all 6 of the eyes with the most extreme ΔGGCLP values; Fig. 8B (eye g) shows an example. This eye had a ΔGGCLP value of +7.6 um, which was largely attributable to segmentation errors in the region of an epiretinal membrane. As is indicated by the orange boxes in Fig. 8B, the RNFL/GCL border (green line) appears higher in time 2 than time 1 because the segmentation lines are including only the epiretinal membrane and thus a portion of the scan included in the RNFL in time 1 is included in the GCLP in time 2. Eyes i and j had similar segmentation issues due to epiretinal membranes.
DISCUSSION
Global summary measures of OCT have been suggested as tools to detect progression in eyes with advanced glaucoma. Here, we show that these measures have serious flaws, largely due to segmentation errors. While the OCT is clearly valuable for helping to assess progression in early and moderate cases of glaucoma, it has been debated whether it can be used in advanced cases.26 Many clinicians believe that once global (average) cRNFL thickness (GcRNFL), falls below about 50 um, they cannot use ΔGcRNFL. Recently, studies have argued that changes in GCLP thickness (ΔGGCLP) may be a better measure, as the GCLP may have more tissue remaining above its “floor level” than the cRNFL.12-16 Based upon prior work, we hypothesized that both measures have limited utility due to errors such as segmentation and alignment.18-24 The evidence here supports this hypothesis. While alignment was not a serious concern, segmentation was. Further, these global measures can miss local changes as described below.
Alignment Problems
Alignment of images and centering of the disc and fovea have been shown to be major sources of error in interpreting OCT scans.19-24 As the OCT instrument used in this study attempts to register repeat scans in the same location, we expected alignment and centering to be less of a factor. In fact, it was a noticeable factor in only one eye (eye 1, Appendix Figure A1, available at [LWW insert link]). Further, in this case, it could have been avoided, if the operator chose to enable the follow-up capabilities of the OCT instrument. Instead, the operator mistakenly registered the second visit as a “new patient”. (Note the absence of a gray line in the cpRNFL thickness profile plot in Time 2. This indicates that the follow-up test was ‘treated’ as baseline.)
Errors of Segmentation
On the other hand, segmentation was a major problem as previously reported.18, 22-24 Consider first the (ΔGcRNFL) measure. Three (eyes 1,5,6) of the 6 eyes (Fig. 6, Appendix Figure A1, available at [LWW insert link] and Appendix Figure A2, available at [LWW insert link]) with the most extreme ΔGcRNFL values showed no sign of progression on the cRNFL scans or the RNFL or GCLP probability maps. Further, while eye 2 (Fig. 5) with the second largest negative ΔGcRNFL value (−11.3) did show progression, the region progressing (within white/black rectangles), contributed relatively less to the ΔGcRNFL than the region with segmentation mistakes. In addition, all of the extreme positive values were largely due to segmentation errors. Presumably they could just as easily have been negative values, as we have no evidence that scans taken at time 2 were different than scans at taken time 1 in eyes without errors or progression (e.g., healthy eyes). Note that the ΔGcRNFL in 3 of these eyes (a,b,c) exceeded 3um, a large value when you consider some clinicians look for changes of 5um or more for progression.27-29
Similarly, segmentation played a role in 10 of the 12 extreme ΔGGCLP values, including all 6 of the extreme positive values. To put this in perspective, note that 4 of the extreme positive ΔGGCLP values were greater than 4 um, while eye 12, with changes due largely to progression, had a value of −3.1. Figure 8B shows b-scans from eye g, which had one of the two most extreme positive values, 7.6 um. This change of 7.6 um, due largely, if not entirely, to segmentation was larger than the absolute value of all but one of the extreme negative values.
Further, segmentation alone can produce changes larger than those present in eyes with clear damage on GCLP thickness maps. [See clear change in GCLP thickness map in Appendix Figure A4, available at [LWW insert link], for eyes 12 and 8, with ΔGGCLP values of −3.1 and −6.3, respectively.] Thus, relatively local changes in GCLP will likely be missed.
Other Factors
Apparent Change in Total Retinal Thickness, aΔRT
A change in overall thickness contributed to 3 of the extreme ΔGcRNFL values. As previously discussed, it is not clear if these changes are due to physiological or non-physiological factors.24 It could be physiological in nature, due to, for example, IOP changes, which some studies have found affect retinal and choroidal thickness measures.30-32 By non-physiological factors, we refer to image acquisition, and for example, differences in patient positioning and plane of scanning across different visits. In any case, either the first or second scan could be slightly larger in the vertical dimension. Note also that it was not the most important factor in any of the 3 eyes.
Other Pathologies and Advanced Glaucoma
Epiretinal membrane, peripapillary atrophy, and retinal schisis are among the pathological conditions that affect segmentation.20 Each of these are more likely to occur with age and/or advanced glaucoma, and each can affect segmentation as seen in Fig. 8.
Limitations
There are two important limitations to be considered. First, the time between the first and last visit in our sample was short, although the average was 2.3 years (range: 0.8 to 4.4 years). In any case, 12 eyes did progress as indicated by the reference standard and these were missed by the global measures. Furthermore, this time span is clinically relevant because clinicians follow patients with advanced glaucoma annually at a minimum, if not more frequently. Second, some may contend that our results are not generalizable because we did not correct for segmentation as is suggested by the manufacturer. However, we intentionally chose not to correct segmentation because we wanted our sample to mimic that of a clinical practice. In any case, it is challenging and sometimes impossible to correct subtle segmentation errors in eyes with advanced glaucoma, given the extremely poor scan quality in some eyes with advanced disease and segmentation mistakes in multiple locations. (See Fig. 6 for example.) Most clinicians do not examine the scans to identify these errors let alone have the time or technical help to manually correct segmentation for every patient.
What Should be Done in the Clinic?
Summary metrics such as GcRNFL and GGCLP can be very misleading due to problems such as segmentation errors. As we and others have advised, clinicians should carefully inspect OCT b-scan images.18,20,22,24,33 Segmentation and other errors can be easily spotted on these images. However, these errors are not easy to correct. For example, although the commercial software allows the user to correct errors in cRNFL segmentation, it is very difficult to correct them in many eyes (e.g., see Figs. 5-8 and Appendix Figure A1, available at [LWW insert link]), even if the clinician had the time.
What are the alternatives for following eyes with advanced glaucoma in the clinic? Contrary to common belief, OCT cRNFL images can be used to detect preserved cRNFL in eyes with advanced glaucoma if inspection, rather than summary metrics in isolation, is employed.17 Further, with inspection it is possible to use cRNFL thickness to follow progression in many eyes with advanced glaucoma as seen for example in Figs. 4, 5 and Appendix Figure A3, available at [LWW insert link]. Likewise, while GGCLP can be very misleading, GCLP thickness maps (e.g., Fig. 8 and and Appendix Figure A4, available at [LWW insert link]) might also be clinically useful.
Supplementary Material
APPENDICES
Figure A1. An example of segmentation and alignment errors. (A) The b-scan for time 1. (B) The b-scan for time 2. (C) the cRNFL thickness profile for time 1. (D) The cRNFL thickness profile for time 2. The red solid vertical lines indicate the position of the major temporal vessels based on Time 1, while the dashed red line shows the position of the ‘shifted’ blood vessel on Time 2. The black and white arrows show regions where there are segmentation errors (Eye ID 1).
Figure A2. An example of an ‘apparent change in total retinal thickness’ (aΔRT) artifact. (A)The b-scan for time 1. (B) The b-scan for time 2. C. The cRNFL thickness profiles for the first (gray) and second (black) times. The insets (left panels) show the aΔRT error – the vertical white lines have the same length and indicate the distance from the inner plexiform layer/outer plexiform layer boundary to an identifiable marker in the choroid. In this example, the b-scan in time 1 is slightly magnified compared to the b-scan in time 2 (Eye ID 6).
Figure A3. An example of progression. (A) The circumpapillary b-scan from time 1. (B) The b-scan for time 2. (C) The cRNFL thickness profiles for the first (gray) and second (black) times. The black and white arrows show regions of progression (Eye ID 4).
Figure A4. Examples of clear change in the GCLP thickness map but ΔGGCLP values of only −3.1 and −6.3 respectively, showing that local changes in GCLP can be missed. (A) Eye ID 12. (B) Eye ID 8.
Contributor Information
Abinaya Thenappan, Columbia Vagelos College of Physicians and Surgeons, New York, New York.
Emmanouil Tsamis, Department of Psychology, Columbia University, New York, New York.
Zane Z. Zemborain, Department of Psychology, Columbia University, New York, New York.
Sol La Bruna, Department of Psychology, Columbia University, New York, New York.
Melvi Eguia, New York Eye and Ear Infirmary, New York, New York.
Devon Joiner, Department of Ophthalmology, Montefiore Medical Center, New York, New York.
Carlos Gustavo De Moraes, Bernard and Shirlee Brown Glaucoma Research Laboratory, Department of Ophthalmology, Edward S. Harkness Eye Institute, Columbia University Irving Medical Center, New York, New York.
Donald C. Hood, Department of Psychology, Columbia University, New York, New York; Bernard and Shirlee Brown Glaucoma Research Laboratory, Department of Ophthalmology, Edward S. Harkness Eye Institute, Columbia University Irving Medical Center, New York, New York.
REFERENCES
- 1.Coleman AL. Glaucoma. Lancet 1999;354:1803–10. [DOI] [PubMed] [Google Scholar]
- 2.de Moraes CG, Liebmann JM, Medeiros FA, Weinreb RN. Management of Advanced Glaucoma: Characterization and Monitoring. Surv Ophthalmol 2016;61:597–615. [DOI] [PubMed] [Google Scholar]
- 3.Artes PH, Iwase A, Ohno Y, et al. Properties of Perimetric Threshold Estimates from Full Threshold, SITA Standard, and SITA Fast Strategies. Invest Ophthalmol Vis Sci 2002;43:2654–9. [PubMed] [Google Scholar]
- 4.Wall M, Woodward KR, Doyle CK, Artes PH. Repeatability of Automated Perimetry: A Comparison between Standard Automated Perimetry with Stimulus Size III and V, Matrix, and Motion Perimetry. Invest Ophthalmol Vis Sci 2009;50:974–9. [DOI] [PubMed] [Google Scholar]
- 5.Gardiner SK, Swanson WH, Goren D, et al. Assessment of the Reliability of Standard Automated Perimetry in Regions of Glaucomatous Damage. Ophthalmology 2014;121:1359–69. [DOI] [PMC free article] [PubMed] [Google Scholar]
- 6.Gardiner SK. Effect of a Variability-Adjusted Algorithm on the Efficiency of Perimetric Testing. Invest Ophthalmol Vis Sci 2014;55:2983–92. [DOI] [PMC free article] [PubMed] [Google Scholar]
- 7.Hood DC, Anderson SC, Wall M, Kardon RH. Structure Versus Function in Glaucoma: An Application of a Linear Model. Invest Ophthalmol Vis Sci 2007;48:3662–8. [DOI] [PubMed] [Google Scholar]
- 8.Hood DC, Kardon RH. A Framework for Comparing Structural and Functional Measures of Glaucomatous Damage. Prog Retin Eye Res 2007;26:688–710. [DOI] [PMC free article] [PubMed] [Google Scholar]
- 9.Mwanza JC, Budenz DL, Warren JL, et al. Retinal Nerve Fibre Layer Thickness Floor and Corresponding Functional Loss in Glaucoma. Br J Ophthalmol 2015;99:732–7. [DOI] [PMC free article] [PubMed] [Google Scholar]
- 10.Hood DC, Anderson SC, Wall M, et al. A Test of a Linear Model of Glaucomatous Structure-Function Loss Reveals Sources of Variability in Retinal Nerve Fiber and Visual Field Measurements. Invest Ophthalmol Vis Sci 2009;50:4254–66. [DOI] [PMC free article] [PubMed] [Google Scholar]
- 11.Ye C, Yu M, Leung CK. Impact of Segmentation Errors and Retinal Blood Vessels on Retinal Nerve Fibre Layer Measurements Using Spectral-Domain Optical Coherence Tomography. Acta Ophthalmol 2016;94:e211–9. [DOI] [PubMed] [Google Scholar]
- 12.Lavinsky F, Wu M, Schuman JS, et al. Can Macula and Optic Nerve Head Parameters Detect Glaucoma Progression in Eyes with Advanced Circumpapillary Retinal Nerve Fiber Layer Damage? Ophthalmology 2018;125:1907–12. [DOI] [PMC free article] [PubMed] [Google Scholar]
- 13.Belghith A, Medeiros FA, Bowd C, et al. Structural Change Can Be Detected in Advanced-Glaucoma Eyes. Invest Ophthalmol Vis Sci 2016;57:511–8. [DOI] [PMC free article] [PubMed] [Google Scholar]
- 14.Sung KR, Sun JH, Na JH, et al. Progression Detection Capability of Macular Thickness in Advanced Glaucomatous Eyes. Ophthalmology 2012;119:308–13. [DOI] [PubMed] [Google Scholar]
- 15.Shin JW, Sung KR, Lee GC, et al. Ganglion Cell-Inner Plexiform Layer Change Detected by Optical Coherence Tomography Indicates Progression in Advanced Glaucoma. Ophthalmology 2017;124:1466–74. [DOI] [PubMed] [Google Scholar]
- 16.Bowd C, Zangwill LM, Weinreb RN, et al. Estimating Optical Coherence Tomography Structural Measurement Floors to Improve Detection of Progression in Advanced Glaucoma. Am J Ophthalmol 2017;175:37–44. [DOI] [PMC free article] [PubMed] [Google Scholar]
- 17.Lee SH, Joiner DB, Tsamis E, et al. OCT Circle Scans Can Be Used to Study Many Eyes with Advanced Glaucoma. Ophthalmology Glaucoma 2019;2:130–5. [DOI] [PMC free article] [PubMed] [Google Scholar]
- 18.Mansberger SL, Menda SA, Fortune BA, et al. Automated Segmentation Errors when Using Optical Coherence Tomography to Measure Retinal Nerve Fiber Layer Thickness in Glaucoma. Am J Ophthalmol 2017;174:1–8. [DOI] [PMC free article] [PubMed] [Google Scholar]
- 19.Vizzeri G, Bowd C, Medeiros FA, et al. Effect of Improper Scan Alignment on Retinal Nerve Fiber Layer Thickness Measurements Using Stratus Optical Coherence Tomograph. J Glaucoma 2008;17:341–9. [DOI] [PMC free article] [PubMed] [Google Scholar]
- 20.Liu Y, Simavli H, Que CJ, et al. Patient Characteristics Associated with Artifacts in Spectralis Optical Coherence Tomography Imaging of the Retinal Nerve Fiber Layer in Glaucoma. Am J Ophthalmol 2015;159:565–76.e2. [DOI] [PMC free article] [PubMed] [Google Scholar]
- 21.Han IC, Jaffe GJ. Evaluation of Artifacts Associated with Macular Spectral-Domain Optical Coherence Tomography. Ophthalmology 2010;117:1177–89.e4. [DOI] [PubMed] [Google Scholar]
- 22.Sun A, Tsamis E, Eguia MD, et al. Global Optical Coherence Tomography Measures for Detecting the Progression of Glaucoma Have Fundamental Flaws. Eye (Lond) 2021. [DOI] [PMC free article] [PubMed] [Google Scholar]
- 23.Asrani S, Essaid L, Alder BD, Santiago-Turla C. Artifacts in Spectral-Domain Optical Coherence Tomography Measurements in Glaucoma. JAMA Ophthalmol 2014;132:396–402. [DOI] [PubMed] [Google Scholar]
- 24.Eguia MD, Tsamis E, Zemborain ZZ, et al. Reasons Why OCT Global Circumpapillary Retinal Nerve Fiber Layer Thickness Is a Poor Measure of Glaucomatous Progression. Transl Vis Sci Technol 2020;9:22. [DOI] [PMC free article] [PubMed] [Google Scholar]
- 25.Hood DC, Raza AS, De Moraes CG, et al. Evaluation of a One-page Report to Aid in Detecting Glaucomatous Damage. Transl Vis Sci Technol 2014;3:8. [DOI] [PMC free article] [PubMed] [Google Scholar]
- 26.Abe RY, Diniz-Filho A, Zangwill LM, et al. The Relative Odds of Progressing by Structural and Functional Tests in Glaucoma. Invest Ophthalmol Vis Sci 2016;57:421–8. [DOI] [PMC free article] [PubMed] [Google Scholar]
- 27.Leung CK, Cheung CY, Weinreb RN, et al. Retinal Nerve Fiber Layer Imaging with Spectral-Domain Optical Coherence Tomography: A Variability and Diagnostic Performance Study. Ophthalmology 2009;116:1257–63, 63 e1-2. [DOI] [PubMed] [Google Scholar]
- 28.Tan BB, Natividad M, Chua KC, Yip LW. Comparison of Retinal Nerve Fiber Layer Measurement between 2 Spectral Domain OCT Instruments. J Glaucoma 2012;21:266–73. [DOI] [PubMed] [Google Scholar]
- 29.Thompson AC, Jammal AA, Medeiros FA. Performance of the Rule of 5 for Detecting Glaucoma Progression between Visits with OCT. Ophthalmology Glaucoma 2019;2:319–26. [DOI] [PMC free article] [PubMed] [Google Scholar]
- 30.Aydin A, Wollstein G, Price LL, et al. Optical Coherence Tomography Assessment of Retinal Nerve Fiber Layer Thickness Changes after Glaucoma Surgery. Ophthalmology 2003;110:1506–11. [DOI] [PMC free article] [PubMed] [Google Scholar]
- 31.Sarkar KC, Das P, Pal R, Shaw C. Optical Coherence Tomographic Assessment of Retinal Nerve Fiber Layer Thickness Changes before and after Glaucoma Filtration Surgery. Oman J Ophthalmol 2014;7:3–8. [DOI] [PMC free article] [PubMed] [Google Scholar]
- 32.Kara N, Baz O, Altan C, et al. Changes in Choroidal Thickness, Axial Length, and Ocular Perfusion Pressure Accompanying Successful Glaucoma Filtration Surgery. Eye (Lond) 2013;27:940–5. [DOI] [PMC free article] [PubMed] [Google Scholar]
- 33.Hood DC, De Moraes CG. Challenges to the Common Clinical Paradigm for Diagnosis of Glaucomatous Damage with OCT and Visual Fields. Invest Ophthalmol Vis Sci 2018;59:788–91. [DOI] [PMC free article] [PubMed] [Google Scholar]
Associated Data
This section collects any data citations, data availability statements, or supplementary materials included in this article.


