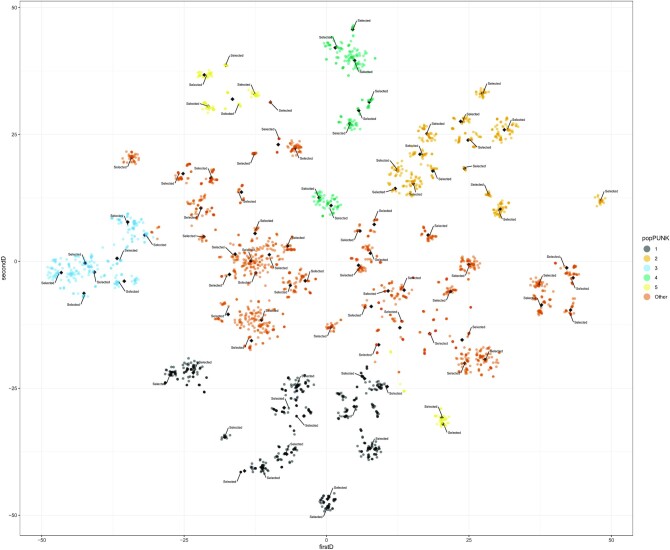
Figure 1.
T-sne plot of the isolate selection, based on Jaccard distances computed from the presence/absence of genes defined by Panaroo in 3,254 E. coli isolates. The 5 most predominant PopPUNK lineages are indicated with distinct colours; the rest of the lineages were merged into the category “Other” (in yellow). To showcase the pipeline, we fixed the number of centroids to 96, which corresponded to the maximum number of isolates that can be multiplexed in the same MinION flow cell. The final coordinates of the centroids (n = 96) used in k-means are indicated as black diamond points. For each centroid (n = 96), the isolate closest to its respective centroid has been marked as “Selected.” In total, we indicate 96 E. coli isolates spanning the genomic diversity inherent in the collection that could be selected for further long-read sequencing.

