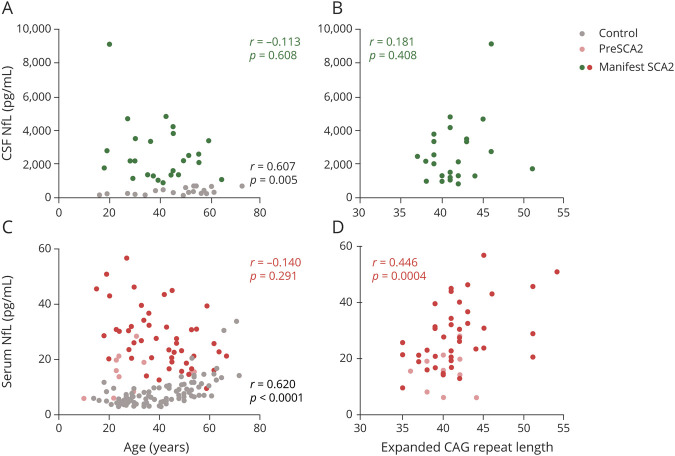
Figure 1. Assessments for Potential Confounding Variables for NfL.
(A and C) Correlations between age and (A) CSF neurofilament light (NfL) and (C) serum NfL. (B and D) Correlations between expanded CAG repeat length and (B) CSF NfL and (D) serum NfL. Correlations are represented by r and p values generated from Spearman rank correlation. The r and p values were generated from either controls only (gray) or individuals with spinocerebellar ataxia type 2 (SCA2) (colored) only. Only individuals with SCA2 were included in the association between expanded CAG repeat length and NfL because controls do not carry expanded CAG repeat.

