Abstract
Objective:
To propose a better statistical method of predicting postsurgery soft tissue response in Class II patients.
Materials and Methods:
The subjects comprise 80 patients who had undergone surgical correction of severe Class II malocclusions. Using 228 predictor and 64 soft tissue response variables, we applied two multivariate methods of forming prediction equations, the conventional ordinary least squares (OLS) method and the partial least squares (PLS) method. After fitting the equation, the bias and a mean absolute prediction error were calculated. To evaluate the predictive performance of the prediction equations, a leave-one-out cross-validation method was used.
Results:
The multivariate PLS method provided a significantly more accurate prediction than the conventional OLS method.
Conclusion:
The multivariate PLS method was more satisfactory than the OLS method in accurately predicting the soft tissue profile change after surgical correction of severe Class II malocclusions.
Keywords: Class II malocclusion, Surgical-orthodontic treatment, Multivariate PLS prediction
INTRODUCTION
At present, several software systems allow clinicians to manually manipulate digital representations of soft tissue projections. However, manual predictions have a limited application due to the relative complexity of the soft and hard tissue relationships. Therefore, it is upon precise mathematical definitions of hard and soft tissue relationships that the development of computer-aided forecasting must depend.
Computer programs attempting to predict soft tissue changes after surgery have been greatly improved by graphics and user interfaces. The algorithms for software programs should be based upon and derived from previous studies. Although the programs have been updated, the prediction results are still far from accurate.1–3 In addition, the underlying algorithms for currently available commercial programs are all unknown. Furthermore, there have been several common problems in previous publications, such as small sample sizes and incorporation of a limited number of both predictor and response variables.3–5 Additionally, the prediction methods have been too simple.3–6 A frequently used guide for soft tissue simulation is still based simply on the 1-to-1 correspondence ratio for a specific bone-to-soft tissue change. However, the ratio between bone and soft tissue changes varies extremely, lacks consistency across studies, and is inaccurate from patient to patient. For example, in relation to the forward positioning of the mandible, considerable variation in results has been reported for the proportional advancement of the lower lip.3 After mandibular advancement surgery, even without genioplasty, the lower lip-incisor ratios ranged from 13% to 108% and from 71% to 127% for soft tissue Pogonion and hard tissue Pogonion, respectively.2,7,8
When predicting soft tissue changes after surgery, by including as many predictors (independent variables) as possible, the multiple-regression method has been found to be significantly more accurate than a simple proportional analysis or a simple regression equation.3,9 However, regardless of the number of independent variables incorporated, this typical mode of analysis is unidirectional and univariate, including only a single response (dependent) variable. This technique has been referred to as the conventional ordinary least squares (OLS) method. However, the conventional OLS has a significant drawback in predicting soft tissue response, because soft tissue response is not simple. For example, a certain degree of vertical skeletal repositioning induces anteroposterior relocation as well, and vice versa. In addition, the soft tissue response at a specific point is highly dependent on its adjacent soft tissue response, and its neighboring points are also dependent on each other.1 Therefore, the location of adjacent response points should also be taken into account when applying a prediction method. A multivariate method is an equation that calculates multiple responses and considers the mutual relationship that may exist among the multiple response variables. In this respect, the multivariate approach, which involves multiple predictors and multiple response variables simultaneously, is more appropriate when predicting a soft tissue response.1
The partial least square (PLS) method developed in chemometrics is a comparatively new way of constructing prediction equations. When the number of predictor variables (p) far exceeds the number of observations (n), the conventional OLS method is not suitable for developing meaningful and robust results.1,10–13 Predicting soft tissue responses after surgery requires consideration of a number of variables, including the patient's age, sex, time after surgery, preoperative skeletal characteristics, preexisting soft tissue thickness and position, amount of surgical replacement at various skeletal landmarks, direction of surgical replacement, and so forth. As the PLS method becomes more established, its application to various biologic disciplines is becoming increasingly widespread, from bioinformatics and image analysis to dentistry.1,14–16
The aim of the present study is to propose a better statistical method of predicting postsurgery soft tissue response in Class II patients. The null hypothesis is that there is no difference in the soft tissue prediction accuracy and validity produced between the PLS and the conventional OLS methods.
MATERIALS AND METHODS
The institutional review board for the protection of human subjects reviewed and approved the research protocol (S-D20120019). The subjects consisted of 80 patients (59 women, average age of 24 years; and 21 men, average age of 24 years) who had undergone the surgical correction of a severe Class II malocclusion. From January 2001 through July 2012, the subjects were treated at the Department of Orthodontics, and surgery was performed at the Department of Oral and Maxillofacial Surgery, Seoul National University Dental Hospital. All subjects are of Korean ethnicity. Subjects had a mandibular surgery and/or a maxillary surgery. An inclusion criterion was a nonsyndromic skeletal Class II deformity. All patients were treated with fixed orthodontic appliances before and after surgery. During the preoperative orthodontic treatment, the incisor teeth were appropriately decompensated, and the arches were coordinated and stabilized. Postoperative orthodontic treatment was limited to completing the adjustment of the occlusion, and minimal incisor movement was required.
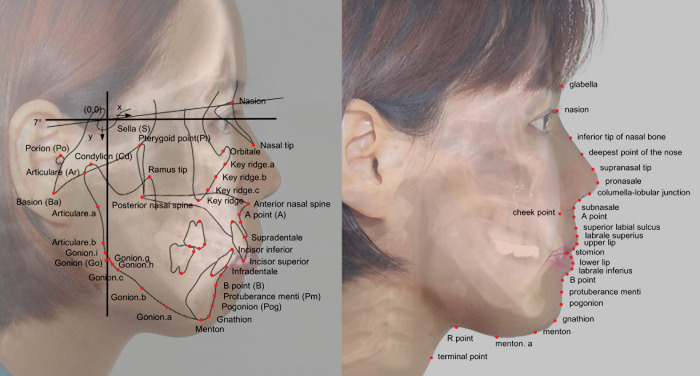
Lateral cephalograms were taken before surgery and after debonding for all patients. During imaging, the patient held the teeth in occlusion with lips relaxed. Preoperative lateral cephalograms were taken close to the time of surgical intervention. To ensure resolving of postoperative swelling, postoperative cephalograms were taken at least 4 months (average 10 months) after surgery. All cephalograms were traced by the first author and measured by a custom digitizing program with Microsoft Visual C# 2010 (Microsoft, Redmond, Wash). With its origin at Sella, the vertical reference was established perpendicular to Sella-Nasion +7°. Uppercase letters were used to demarcate hard tissue landmarks. Lowercase letters were used to indicate the soft tissue landmarks (Figure 1).
Figure 1.
Diagram showing the reference planes and cephalometric landmarks used in this study. The image is composed of the preoperative radiograph with the hard tissue landmarks. Soft tissue landmarks are on the follow-up cephalogram (red dots). Concerning the hard tissue landmarks, uppercase letters were used; for the soft tissue landmarks, lowercase letters were used.
A total of 228 predictor variables (X matrix) were entered into the prediction equation. The predictor variables included patient's age, sex, time after surgery, the direction and amount of facial asymmetry, type of mandibular surgery, type of maxillary surgery, existence of genioplasty, 78 presurgical skeletal measurements, 64 presurgical soft tissue measurements, and 78 variables with regard to the surgical skeletal repositioning in both anteroposterior and vertical directions. The 64 response variables (Y matrix) comprised the soft tissue changes in the 32 soft tissue landmarks in both the x- and y-axes. This study denoted boldface capital letters for matrices, eg, X, a size 80(N)subjects × 228(K)variables matrix of predictor variables, and Y, a size 80(N)subjects × 64(M)responses matrix of response variables; superscripts for transposed matrices, eg, XT; and boldface small characters for vectors, eg, x and y.
Two multivariate methods of forming prediction equations, the conventional ordinary least squares (OLS) method and the partial least squares (PLS) method, were calculated using 228 predictor variables and 64 response variables. The OLS method is the traditional and conventional multivariate linear regression method using forward variable selection. The prediction equation using the OLS solution can be written as Y = XBOLS + E, where E is an N × M matrix of residuals for Y, and BOLS is a K × M matrix solution of least squares coefficients; BOLS = (XTX)−1XTY by multivariate Gauss-Markov theorem.17 The PLS prediction equation may be written as Y = XBPLS + F, where F is an N × M matrix of residuals for Y, and BPLS is a K × M (size, 228 × 64) matrix of PLS prediction coefficients. In the equation itself, the PLS method resembles the stepwise OLS method, but, in contrast to the latter, it is applicable even if the variables are strongly intercorrelated (multicollinear) and contain significant noise, even if the number of variables is higher than the number of subjects. All predictors are included in the final solution; no variables have to be discarded, unlike in stepwise OLS.
When developing a prediction method, typically, the model is fit for part of the data (the training dataset), and the quality of the fit is judged by how well it predicts the other part of the data (the test set, also called the validation dataset). To evaluate the predictive performance of the prediction equations, the leave-one-out cross-validation method was used. For a more detailed algorithm for the validation method, please refer to previous literature.13,18,19
After fitting the equation, the bias was calculated as a mean difference. The difference between the actual result and the predicted position was calculated by subtracting the value for the predicted position from the actual position, Yactual − Ypredicted. Furthermore, the criterion of goodness-of-fit was defined as the mean absolute error, |Yactual − Ypredicted|.
Language R (http://www.r-project.org/),20 which is a free software environment for statistical computing, was used. Detailed codes of the multivariate OLS, modified PLS, and validation algorithm for use with language R is available upon request to the authors.
RESULTS
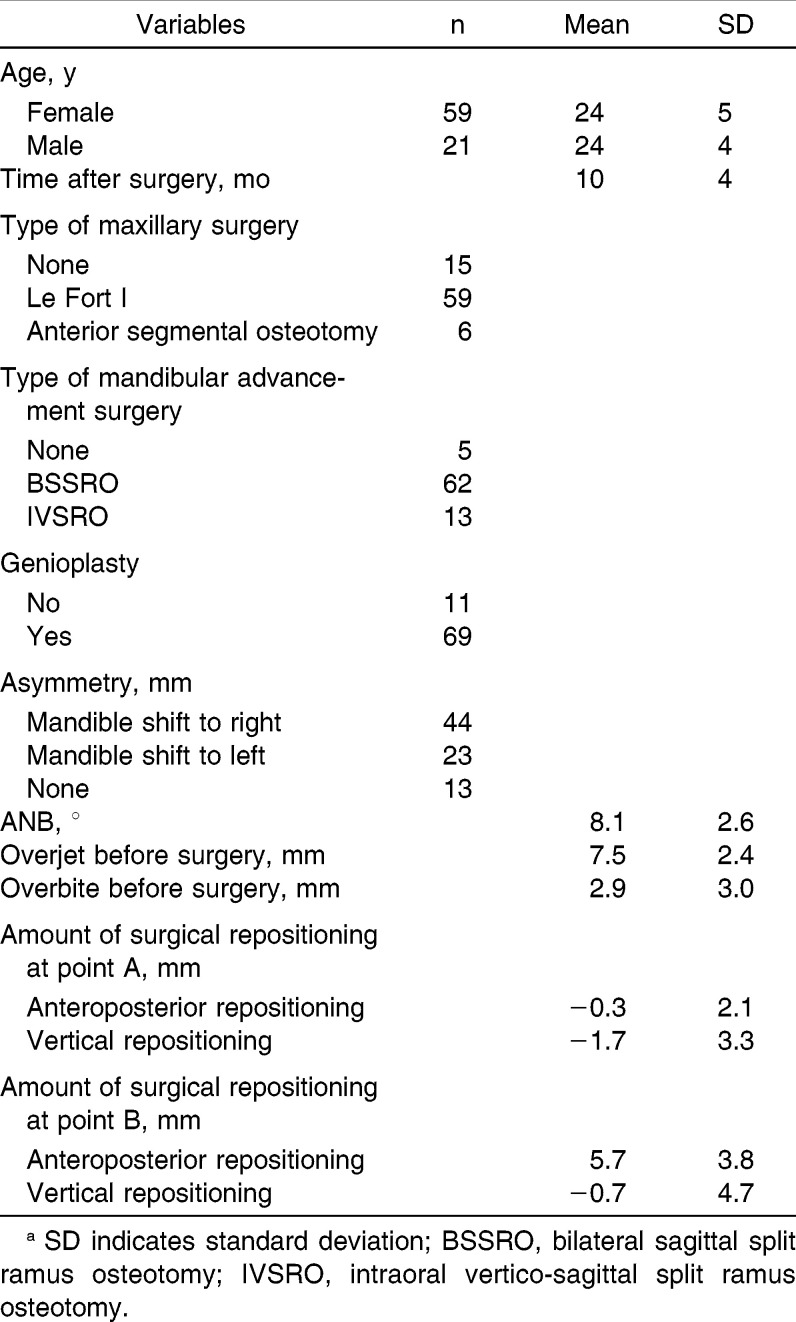
Table 1 provides further details of the subjects. The amount of surgical repositioning at point B was comparable to the amount of overjet before surgery. This may be due to the clinicians' aim to produce occlusions with normal overjet and overbite during surgical-orthodontic treatment.
Table 1.
The Subjects' Sex, Age, and Other Characteristicsa
The derived prediction method was successfully cross-validated. After fitting the prediction equations in the training dataset, errors (both bias and mean absolute error) were determined to be trivial to none by both the OLS and PLS methods (data not shown).
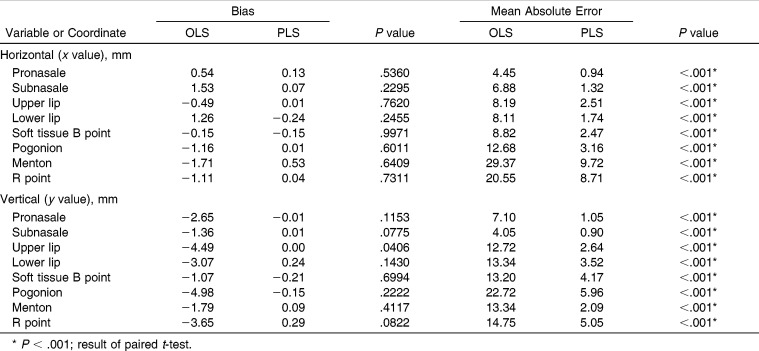
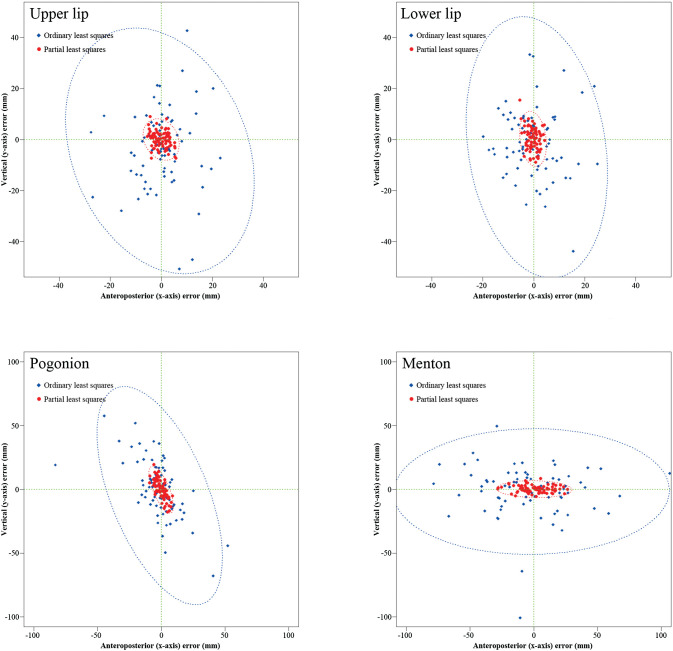
To concisely report results, eight soft tissue landmarks were chosen among the 32 landmarks shown in Figure 1. The results of the prediction errors after applying the prediction equations in the test dataset from the two methods are summarized in Table 2. After applying the prediction equations in the test dataset, the bias (the error with plus/minus sign) did not show a significant difference between the two methods. However, a comparison test between the means of the predicted and the actual soft tissue profile may not have been appropriate since underestimates and overestimates will cancel each other out, showing no significant difference between the means.1,21,22 Instead, as previously suggested,1,21 scattergrams and 95% confidence ellipses for several soft tissue landmarks were constructed to compare the error between the OLS and PLS methods (Figure 2). The ellipsoid satisfies (z − μ)TΣ−1(z − μ) ≤ χ2(α)2, where z is the two-dimensional (2D; x and y coordinates) vector for the error, μ is the mean vector for z, Σ−1 is the inverse matrix of the covariance matrix, and χ2(α)2 is the upper 95th percentile of a chi-square distribution with two degrees of freedom.17 The contour of an ellipse indicates the 95% confidence boundary. A negative value indicated the prediction was more posterior in the x-axis or more superior in the y-axis compared to the actual result. If any points are outside the ellipse, they can be called outliers.22 The sizes of the 95% confidence ellipses for the OLS method were significantly larger than the ellipse for the PLS method. This showed a superior predictive performance of the PLS method over the OLS method (Figure 2).
Table 2.
Comparison of Soft Tissue Prediction Errors Between Conventional Ordinary Least Squares (OLS) and Partial Least Squares (PLS) Prediction Methods
Figure 2.
Scattergrams and 95% confidence ellipses for the bias that were obtained from the OLS (blue) and PLS (red) prediction methods. The plots clearly indicate that the bias in both the x- and y-axes was greater in the OLS than in the PLS methods. Application of the equations to individuals may give rise to errors to this extent in 95% probability.
Absolute prediction errors after applying the prediction equation in the test sample showed significant differences for all the soft tissue landmarks between the two methods. The PLS method showed a significantly more accurate and higher predictive performance than the conventional OLS method in all response variables (Table 2).
DISCUSSION
We explored the complex relationship between bone and soft tissue responses by invoking an intricate multivariate statistical analysis, the PLS method. Unexplainable individual variations are inevitably always present. Therefore, it is unrealistic to expect perfect predictions. Furthermore, responses after surgery across individuals are not constant. Perfect accuracy is not available in practicality, but some methods are more accurate than others are. Orthodontics has problems that conventional statistical inferences cannot properly handle. Statistics is an utmost essential tool in finding clinically significant evidences for proper decision making procedures for both clinicians and researchers. Most familiar statistical tests in orthodontics, such as the t-test, analysis of variance, and regression analyses are all based on the conventional OLS method. The OLS models basically require the prerequisite condition of independence between the predictor variables, as well as normality and equality of variance among them. Orthodontics includes the dentition, skeletal configuration, and soft tissue responses. The relationships between teeth, dentition, jaw bone, and soft tissue are so correlated that a more sophisticated method that would be capable of considering the correlation between variables simultaneously, rather than the ordinary OLS testing method, is needed. There are a number of factors to consider when predicting the soft tissue response following orthognathic surgery, including the amount of surgical skeletal movement anteroposteriorly, the amount of skeletal movement vertically, the direction of the movement, the patient's age, and the patient's gender. Since anteroposterior skeletal anatomy is significantly related to vertical repositioning and vice versa, these highly correlated variables should be considered before predicting soft tissue results. In this respect, multivariate methods, such as the PLS method, enjoy large popularity in a wide range of fields in natural sciences. PLS is the preferred method for constructing a prediction equation when the factors are many and highly collinear or correlated. Applying the PLS method is even possible when the sample size is less than the number of variables.23,24
When applying the OLS method, if the number of factors gets too large, it is likely to result in a model with a prediction equation that fits the sampled data perfectly, but will fail to predict new data well. In fact, the OLS method demonstrated perfect accuracy when applied to a training dataset from which the prediction equation was formulated. However, when the prediction equation was applied to a real test dataset, the prediction error showed a significantly larger discrepancy than the PLS method. To restate, the OLS method was excellent when developing a prediction equation, but poor when applied to the real subject. This type of phenomenon is termed overfitting.13 Overfitting also occurred when we predicted the soft tissue response of single-jaw mandibular setback surgery for Class III patients.1 The same overfitting occurred for the Class II surgery patients in this study. The PLS method demonstrated significantly more accurate predictions than the conventional OLS method when applied to a real dataset through the leave-one-out validation method (Table 2). This may be because the OLS method assumes that all the predictor variables are independent, which is not the case, especially for the numerous dental and facial variables in the X and Y matrices. In practice, this condition of independence will never exactly be met.
Excluding or including an additional surgery, such as a genioplasty or maxillary surgery, has a great impact on the soft tissue profile changes. Therefore, in order to develop an accurate prediction method, most previous papers report ratios of only one specific maxillofacial surgical procedure because the more surgical procedures one adds, the more complex the soft tissue prediction becomes. A surgery, such as a maxillary surgery or a genioplasty, in addition to a mandibular surgery, would be considered to be a confounding variable that would interfere with an accurate soft tissue prediction.2,25,26
Koreans have a relatively high prevalence of Class II malocclusion, approximately one-fifth of Koreans, 20.3% among the general population.27 Over 36% of patients seeking orthodontic care in Koreans are Class II, and approximately 2.5% of those Class II patients receive surgical orthodontic treatment.28 Our study included both mandibular and maxillary surgery patients, and, nonetheless, showed considerable prediction accuracy. This prediction accuracy benefited from incorporating an increased number of skeletal and soft tissue landmarks. This is still a 2D assessment of three-dimensional (3D) structures and responses to 3D treatment. However, cephalometry is still a feasible standard for evaluating and predicting outcomes in routine orthognathic surgery cases.29 In the end, a 3D prediction model would be more useful afterwards. We are establishing the foundation for the 3D prediction model. By establishing 2D prediction, we will be able to expand easily into the 3D prediction model. However, currently, there is no standardized 3D cephalometric reference system. When that is established, we will be better able to formulate a 3D prediction model.
CONCLUSIONS
We conclude that the multivariate PLS method is significantly more accurate than the conventional OLS analysis in predicting the soft tissue change after Class II orthognathic surgery.
We also envision that, in the future, the resultant prediction algorithm can be used to provide an accurate surgical prediction for virtual planning and soft tissue simulation of Class II orthognathic surgeries.
ACKNOWLEDGMENTS
This work was supported by the Basic Science Research Program through the National Research Foundation of Korea (NRF) funded by the Korean Government (grant 2012-0007545). The authors thank Dr Michael G Woods, who reviewed and commented on the previous version of this paper.
REFERENCES
- 1.Suh HY, Lee SJ, Lee YS, et al. A more accurate method of predicting soft tissue changes after mandibular setback surgery. J Oral Maxillofac Surg. 2012;70:e553–e562. doi: 10.1016/j.joms.2012.06.187. [DOI] [PubMed] [Google Scholar]
- 2.Joss CU, Joss-Vassalli IM, Kiliaridis S, Kuijpers-Jagtman AM. Soft tissue profile changes after bilateral sagittal split osteotomy for mandibular advancement: a systematic review. J Oral Maxillofac Surg. 2010;68:1260–1269. doi: 10.1016/j.joms.2010.01.005. [DOI] [PubMed] [Google Scholar]
- 3.McCollum AGH, Gardener GJM, Evans WG, Becker PJ. Soft-tissue changes related to mandibular advancement surgery. Semin Orthod. 2009;15:161–171. [Google Scholar]
- 4.Ksiezycki-Ostoya BK, McCollum AGH, Becker PJ. Sagittal soft-tissue changes of the lower lip and chin associated with surgical maxillary impaction and consequent mandibular autorotation. Semin Orthod. 2009;15:185–195. [Google Scholar]
- 5.Naoumova J, Soderfeldt B, Lindman R. Soft tissue profile changes after vertical ramus osteotomy. Eur J Orthod. 2008;30:359–365. doi: 10.1093/ejo/cjn025. [DOI] [PubMed] [Google Scholar]
- 6.Shaughnessy S, Mobarak KA, Hogevold HE, Espeland L. Long-term skeletal and soft-tissue responses after advancement genioplasty. Am J Orthod Dentofacial Orthop. 2006;130:8–17. doi: 10.1016/j.ajodo.2004.11.035. [DOI] [PubMed] [Google Scholar]
- 7.Dolce C, Hatch JP, Van Sickels JE, Rugh JD. Five-year outcome and predictability of soft tissue profiles when wire or rigid fixation is used in mandibular advancement surgery. Am J Orthod Dentofacial Orthop. 2003;124:249–256. doi: 10.1016/s0889-5406(03)00446-3. [DOI] [PubMed] [Google Scholar]
- 8.Alves PV, Mazucheli J, Vogel CJ, Bolognese AM. How the lower face soft tissue changes after mandibular advancement or setback. J Craniofac Surg. 2008;19:593–598. doi: 10.1097/SCS.0b013e31816aaa79. [DOI] [PubMed] [Google Scholar]
- 9.Kneafsey LC, Cunningham SJ, Petrie A, Hutton TJ. Prediction of soft-tissue changes after mandibular advancement surgery with an equation developed with multivariable regression. Am J Orthod Dentofacial Orthop. 2008;134:657–664. doi: 10.1016/j.ajodo.2006.11.024. [DOI] [PubMed] [Google Scholar]
- 10.Martins JPA, Teofilo RF, Ferreira MMC. Computational performance and cross-validation error precision of five PLS algorithms using designed and real data sets. J Chemometr. 2010;24:320–332. [Google Scholar]
- 11.Zhou XF, Shao Q, Coburn RA, Morris ME. Quantitative structure-activity relationship and quantitative structure-pharmacokinetics relationship of 1,4-dihydropyridines and pyridines as multidrug resistance modulators. Pharm Res. 2005;22:1989–1996. doi: 10.1007/s11095-005-8112-0. [DOI] [PubMed] [Google Scholar]
- 12.Wehrens R. Chemometric With R Multivariate Data Analysis in the Natural Sciences and Life Sciences 1st ed. Heidelberg: Springer; 2011. [Google Scholar]
- 13.Hastie T, Tibshirani R, Friedman J. The Elements of Statistical Learning Data Mining Inference and Prediction 2nd ed. New York: Springer Verlag; 2009. [Google Scholar]
- 14.Abdi H. Partial least squares regression and projection on latent structure regression (PLS regression) Wiley Interdiscip Rev Comput Stat. 2010;2:97–106. [Google Scholar]
- 15.Chun H, Keles S. Sparse partial least squares regression for simultaneous dimension reduction and variable selection. J R Stat Soc Series B Stat Methodol. 2010;72:3–25. doi: 10.1111/j.1467-9868.2009.00723.x. [DOI] [PMC free article] [PubMed] [Google Scholar]
- 16.Lee D, Lee W, Lee Y, Pawitan Y. Super-sparse principal component analyses for high-throughput genomic data. BMC Bioinformatics. 2010;11:296. doi: 10.1186/1471-2105-11-296. [DOI] [PMC free article] [PubMed] [Google Scholar]
- 17.Johnson RA, Wichern DW. Applied Multivariate Statistical Analysis. Upper Saddle River, NJ: Pearson Prentice Hall; 2007. [Google Scholar]
- 18.Wold S. Cross-validatory estimation of number of components in factor and principal components models. Technometrics. 1978;20:397–405. [Google Scholar]
- 19.Shao J. Linear-model selection by cross-validation. J Am Stat Assoc. 1993;88:486–494. [Google Scholar]
- 20.R Development Core Team. R A Language and Environment for Statistical Computing. Vienna, Austria: R Foundation for Statistical Computing; 2013. [Google Scholar]
- 21.Donatelli RE, Lee SJ. How to report reliability in orthodontic research. Part 2. Am J Orthod Dentofacial Orthop. 2013;144:315–318. doi: 10.1016/j.ajodo.2013.03.023. [DOI] [PubMed] [Google Scholar]
- 22.Donatelli RE, Lee SJ. How to report reliability in orthodontic research. Part 1. Am J Orthod Dentofacial Orthop. 2013;144:156–161. doi: 10.1016/j.ajodo.2013.03.014. [DOI] [PubMed] [Google Scholar]
- 23.Mevik BH, Wehrens R. The pls package: principal component and partial least squares regression in R. J Stat Softw. 2007;18:1–24. [Google Scholar]
- 24.Tobias RD. An Introduction to Partial Least Squares TS509. Cary, NC: SAS Institute Inc; 2006. [Google Scholar]
- 25.Raschke GF, Rieger UM, Bader RD, Guentsch A, Schaefer O, Schultze-Mosgau S. Soft tissue outcome after mandibular advancement—an anthropometric evaluation of 171 consecutive patients. Clin Oral Invest. 2013;17:1415–1423. doi: 10.1007/s00784-012-0821-2. [DOI] [PubMed] [Google Scholar]
- 26.Joss CU, Joss-Vassalli IM, Berge SJ, Kuijpers-Jagtman AM. Soft tissue profile changes after bilateral sagittal split osteotomy for mandibular setback: a systematic review. J Oral Maxillofac Surg. 2010;68:2792–2801. doi: 10.1016/j.joms.2010.04.020. [DOI] [PubMed] [Google Scholar]
- 27.Lee SJ, Kim TW, Suhr CH. Recognition of malocclusion and orthodontic treatment. Korean J Orthod. 1994;24:193–198. [Google Scholar]
- 28.Jung MH. Age, extraction rate and jaw surgery rate in Korean orthodontic clinics and small dental hospitals. Korean J Orthod. 2012;42:80–86. doi: 10.4041/kjod.2012.42.2.80. [DOI] [PMC free article] [PubMed] [Google Scholar]
- 29.Rustemeyer J, Martin A. Soft tissue response in orthognathic surgery patients treated by bimaxillary osteotomy: cephalometry compared with 2-D photogrammetry. Oral Maxillofac Surg. 2013;17:33–41. doi: 10.1007/s10006-012-0330-0. [DOI] [PMC free article] [PubMed] [Google Scholar]


