

Abstract
Although many studies have unequivocally demonstrated the promise of understanding resilience to adversity and characterizing the consequences if stress is unabated, needed are dynamic theories and methods to enhance the rigor and interpretation of these assessments. From a dynamic systems perspective, the focus is not whether an individual possesses some fixed ability or unchangeable trait, but rather to understand the flexibility and responsiveness of stress regulation systems to daily hassles and adverse life events. A renewed interest in individual variability allows researchers to see trajectories of change over both short- and long-time scales to understand the developmental course. As a result, it is possible to answer questions, such as, how does the dysregulation in emotion caused by stress, to both within and between daily affect processes, relate to longitudinal trajectories (over time-scales of years) of dysfunction and disease? The overarching goal of the Notre Dame Study of Health & Well-being is to detail the types and qualities of contextual influences, in conjunction with dynamic psychobiological systems, to assess the precursors, concomitant influences and consequences of stress and resilience in the face of adversity on cognitive, health and well-being outcomes.
Keywords: resilience, Dynamic Systems, Stress Regulation
Resilience has been defined as the ability to bounce back from adversity (Block & Kremen, 1996); to resist, cope with, recover from, and succeed in the face of adverse life experiences (Masten & Powell, 2003), and to see difficulties as challenges to be mastered rather than threats to be endured (Kobasa & Puccetti, 1983). The NDHWB provides a unique opportunity for research on resistance to adversity and disease, given its extensive, longitudinally-assessed information on social and psychological stress, resilience resources, and emotional, cognitive and health functioning. Original assessments in the NDHWB include 10 annual waves of longitudinal data (including diverse measures of both acute and chronic forms of stress and potential resilience resources) available for tracking consistency and change in risk and adaptation over time, as well as 5 bursts of 56-day diary data (collected biennially). The use of multi-timescale assessments, for example, can inform how a system of emotion regulation at the daily level is disrupted in the context of stress or over time to produce dysregulation and disease later in life or alternatively, to identify the resilience factors that buffer stress and lead others to thrive. The challenge for combining multiple indicators, within and across major regulatory systems, and over time, is significant and complex. To address this gap, the NDHWB integrates sophisticated methodological and analytic techniques that are suited to the intricacies of this research, and provides an extensive basis of information to understand the complex dynamics of stress on health and the possible mediating and/or moderating effects of resilience resources.
Ranging from large-scale epidemiologic studies of SES to intensive investigations of micro daily stressors, there is strong consensus that individuals exposed to hardship are at heightened risk for developing a broad range of serious, sometimes fatal, health conditions. The study of resilience to stress focuses on the individual’s ability to identify and adapt to these challenging life circumstances and the psychological and physiological processes involved in this regulation (Monroe, 2008). To understand the link between stress and health, Figure 1 illustrates the pathways through which environmental demands, stress appraisal processes, and resilience resources result in stress physiology that can lead to adverse mental and physical health outcomes for some, but not all (Lupien et al., 2006; McEwen, 1988). In brief, physiological stress responses are essential for the mobilization of the resources needed to deal with a particular threat. When one deals with the stressor or it passes, the body’s systems return to baseline levels. Unfortunately, many individuals experience chronic stressors that, for some, can be particularly threatening and ultimately result in disability and disease. To test models from this general theoretical framework, we use multiple time-scale data to reveal patterns in emotion regulation, explore how the system is perturbed by stressful events, is reregulated by individual and contextual factors, and can ultimately influence downstream health and well-being outcomes. In this way, we investigate the role of stress in emotional and physiological dys-regulation and reveal how resilience resources counteract these adverse processes and allow others to be well.
Figure 1.

A model of the stress-outcome pathways incorporating resilience mechanisms that break the link between stress exposure and health outcomes (Adapted from Lupien, et al., 2006 and McEwen, 1988).
Notre Dame Study of Health & Well-being.
The NDHWB, started in 2005, includes 775 individuals in mid and later life who began participation in Year 1 (in Year 6, 229 young adults were added to the sample). The sample was derived from a list of eligible participants identified by Survey Sampling International (SSI) in the five county area surrounding the University of Notre Dame. SSI used information from census data and the Survey of Residential Households. First, participants received the global questionnaire packet in the mail, which they returned at their convenience in a postage-paid return envelope provided by the researchers. After returning the surveys, participants who consented were sent daily diary questionnaires in “batches” that were counterbalanced within and between people (i.e., the first week, followed by the next three weeks, followed by the next two weeks, etc.) to prevent forward- and back-filling. Daily diaries usually started within two or three weeks of completion of the global questionnaire and continued for eight weeks.
Age at Wave 1 (for the full sample) ranges from 18–91 (Mean 54; SD 13.5). Fifty-eight percent of these individuals are female; 84% are Caucasian, 10% African American, and the remainder are Asian, Hispanic, Native American, of mixed race, or did not report their race. Approximately half of the sample is married (52%), 10% are widowed, 20% are divorced, 16% are single, and 2% are separated. Three percent of the sample has less than a high school degree, 27.5% completed high school, 33.9% have vocational training/took some college classes, 22.5% have a college degree, and 13.7% have post college training. Income is fairly normally distributed, with 4.6% reporting less than $7,500 per year, 11% reporting between $7,500 and $14,999, 14% between $15,000 and $24,999, 21.4% between $25,000 and $39,999, 31.4% between $40,000 and 74,999, 9.2% between $75,000 and $99,999 and 8.4% making over $100,000 per year. This sample is representative of the region of the country from which it is drawn (U.S. Census Bureau: State and County QuickFacts). Individuals included in the expansion of the project (described below) come from the Mid- and Later Life Cohorts. They have at least seven years of questionnaire data, four bursts of daily diary data and are still participating in the study (the study was augmented with additional subjects over the 10-year span of the study; approximately 500 people are currently participating and 225 of the proposed 300 have been assessed). This study has been approved by the Institutional Review Board at the University of Notre Dame #19–09-5533.
Expanded Study to integrate physiological assessments of cognition, health and well-being.
Building upon the strong scaffolding afforded by the NDHWB, with a rich array of perceptual and emotional stress measures, we add physiological markers of stress (e.g., cortisol), biological sequelae of stress exposure (e.g., cholesterol levels, glucose tolerance, inflammatory markers, immune functioning), along with in-depth, in-person assessments of health, physiological functioning, and family history of relevant diseases (e.g., cardiovascular disease, diabetes). In addition, we collect assessments of executive functioning, attention, episodic memory, language, processing speed and memory using measures from the NIH Toolbox, and use a lab-based stress manipulation task to capture stress responses and recovery in “real” time. What is novel about the NDHWB is that we can identify the contextual influences that threaten and undermine the maintenance of stress resistance and elucidate the factors that support and promote its growth. We continue yearly assessments of key contextual influences in the ecological environment associated with risk (e.g., life events, caregiver stress, chronic strains, role proliferation, neighborhood and financial stress), resilience resources (e.g., personality, social support), with the proposed cognitive, health and well-being outcomes. Unless otherwise specified, all assessments are obtained twice, 2 years apart.
Health.
To provide comprehensive coverage of biological indicators of stress, we use a broad range of biomarkers that have established relevance for research on stress and disease (see Crimmins et al., 2008 for details). Assessment include a Heart Health Panel (29 indicators primarily comprised of Apolipoprotein B, a Lipid Panel, a Metabolic Panel, C - reactive protein, and Homocysteine), Hemoglobin A1c, Tumor Necrosis Factor-α, and Interleukin 6. In addition, we collect blood pressure and resting pulse rate, pulse pressure, waist-to-hip ratio, body mass index, peak expiratory flow, family health history, personal health history, health exam, range of motion, reflexes, grip strength, medication use, health service utilization, and gait/balance.
Cognitive Abilities.
To enhance comparison and ensure uniformity with other studies in the field, we use cognitive assessments from the NIH Toolbox: executive functioning, attention, episodic memory, language, processing speed, and working memory. The tests produce composite measures reflecting general cognitive functioning, crystallized intelligence and fluid abilities (see Gershon et al., 2010; Weintraub et al., 2013). Fluid abilities are critical for everyday life and are particularly sensitive to declining brain functions associated with aging. The Toolbox is assessed multiple times on these participants because it is important to assess co-varying changes in cognitive function associated with previous and concurrent stress regulation and resilience factors.
Cortisol.
Measurement of salivary cortisol is a simple, noninvasive index of free circulating levels of the stress hormone cortisol. In healthy participants, cortisol secretion typically follows a marked circadian rhythm. It is at its nadir in the evening and reaches its diurnal zenith in the morning, peaking 30–40 minutes after awakening (Pruessner, et al., 1997). Because of this diurnal rhythm, we collect three saliva samples over the course of the day to capture an individual’s daily hypothalamic-pituitary-adrenal (HPA) axis activity pattern. Peak cortisol after awakening, or the cortisol awakening response (CAR), is a reliable biological marker of adrenocortical activity (Pruessner et al., 1997; Wilhelm, Born, Kudielka, Scholtz & Wust, 2007; Wust et al., 2000). Data collection is three oral swabs per day (upon waking, 30–40 minutes later, and at bedtime) for 7 days. We also collect daily diary data, including assessments of perceived stress, emotional experiences, small life events, social resources, health/exercise and sleep during the same timeframe.
Stress Manipulation.
In order to assess the experience of stress in real time we used two experimental stress manipulations. First, the Math | Stroop (M|S) Stress Test is a computer-administered stress manipulation with two component parts—a mental arithmetic challenge and a Stroop color-word matching task. Before the test begins, two assessments of cortisol are taken (15 minutes apart) to establish a baseline and the person is fitted to the Biopac to assess physiological arousal during the stress task (e.g., heart rate, respiration, electrodermal activity). The computer sets the pace of the presentation such that subjects achieve a 67% correct response rate. Thus, if they perform poorly, the presentation rate slows and if they perform well, it increases. Second, using the Turner Math paradigm, we presented the subjects with addition or subtraction problems (see Turner et al., 1986). After the problem appears, the participant sees the equal sign (=) followed by an answer to that problem. The subject’s task is to determine whether that answer is correct or incorrect and signal his/her choice by pressing “Yes” or “No” on the keypad. Based on their performance, the computer program adjusts the level of difficulty; participants are told that their performance is evaluated in terms of both speed and accuracy. To enhance the social evaluative component of this task (one criteria for eliciting an HPA response), the experimenter wears a white lab coat, provides instructions in a professional, but unemotional way, provides no empathetic support, asks the subject not to speak during the task, and is obvious about taking notes regarding performance. The M|S is followed by a one-hour recovery period during which the Biopac continues to record for 15 minutes and saliva samples are taken every 15 minutes (5 samples). In addition, we collect subjective affect/stress assessments as part of the procedure.
Second, the Trier Social Stress Test (TSST) is a laboratory procedure that reliably induces stress in human research participants (Kirschbaum, Pirke, & Hellhammer, 1993). The first five-minute component is the anticipatory stress phase, during which the judges ask the participant to prepare a presentation. The participant can use paper and pen to organize their presentation, but this cue is unexpectedly taken from them when it is time to begin their speech. During the five-minute speech, the judges observe the participant without comment. If the participant does not use the entire time, the speaking judge asks him or her to continue until the entire five minutes are used. The speech is followed by the mental arithmetic component, during which the participant is asked to count backwards from 1,022 in steps of 13. If the subject makes a mistake, they must start again from the beginning. Finally, the same recovery/assessment described above, including the subjective affect/stress appraisals, occurs.
Data Structure.
As noted above, the NDHWB includes 10 waves of yearly data and 5 bursts of daily diary data in addition to the expanded data collection. The data are hierarchical, with days nested within waves, nested within people; therefore, within-person (across days and across waves) and between-person (person-level) data are included. We depict the conceptual 3-level model in Figure 2. At Level 1, daily data, such as daily stress, can be modelled using a variety of strategies, (e.g., regression; dynamic systems analysis including univariate and coupled differential equation models) at each wave for each person. Parameter values (denoted as Wave parameters in Fig 2) that govern the daily process, such as frequency and damping (described below), can be extracted from the differential equation model. At Level 2, the parameter values from Level 1 are treated as data and modelled across waves. For example, a growth curve model is used to investigate how the parameter values change across waves (McArdle & Nesselroade, 2014; Zhang, Hamagami, Wang, Grimm & Nesselroade, 2007). Importantly, the wave specific predictors can be included in the model directly. Level 1-parameter values, which govern the individual growth trajectory within waves, can be extracted for use at Level 2 (labelled Wave parameters in Fig 2). In Level 3, we can model the Person parameters. For example, we can 1) simply evaluate individual differences by looking at the variations of the parameter values; 2) investigate the factors that influence the individual parameters; and 3) predict the outcome variables of cognition, health, well-being or the stress response associated with the lab manipulation.
Figure 2.

The structure of the Notre Dame Study of Health & Well-being
Resilience from a Dynamic Perspective
We suggest three components to understanding resilience—1) capturing the dynamic nature of resilience, 2) understanding the context in which it transpires, and 3) the time scale at which it can be observed (Bergeman, Blaxton & Joiner, 2020). Related to this first component, dynamic markers of trajectories that represent the adaptive capacities of individuals (e.g., plasticity or resiliency), may well be better indicators of health outcomes than are specific behaviors of individuals, such as the amount of exercise, types of cognitive activity, personality attributes, diet, or health care utilization. Because many of the analytic and methodological techniques available for the study of human behavior are rigid, too little is known about how dynamic processes work in the course of the life trajectory. Thus, looking for a list of attributes that make up resilient behavior is the old way of thinking about factors that underlie performance on a behavior of interest. Given the breadth and longitudinal nature of the data available in the NDHWB, it is possible to compare the relative efficacy of using historically static methods to more dynamic approaches to understanding complex relationships among stress, emotion, resilience and health.
Dynamic systems are comprised of dynamic variables that change over time and characterize the relevant properties of the state of the system (see Thelen, 2005 for a review). Dynamic systems are composed of many, often heterogeneous, components that are free to combine in an infinite number of ways. When these components come together, they form patterns in time and space that are both coherent and complex. Dynamic properties of systems suggest that the state of a system at a particular point in time is contingent on its previous state, which in turn is the foundation for future states. In other words, behavior may arise in the moment, but the effects accrue over longer time scales as each change sets the stage for future transformation. Dynamical systems analysis (DSA) includes analytic strategies that allow researchers to capture the process of development over time by explicitly mapping parameters of change onto the aspects of functioning to which they correspond (Boker, 2001; Boker, 2002; Boker & Bisconti, 2006). Regulation (e.g., of emotion or physiological responses) is a dynamic process that can be captured using DSA of a time series to show the interactions of system components.
It is also expected that dynamic patterns of regulation themselves change over context and time. Individuals who show greater dysregulation, for example, are hypothesized to show suboptimal primary (e.g., inflammatory markers, immune functioning), secondary (e.g., lipid levels, glucose tolerance, body fat distribution, blood pressure) and tertiary (i.e., cardiovascular disease, diabetes, cognitive functioning, depression) outcomes (even when demographic characteristics, family history of disease, and health care utilization are controlled; Figure 1). Of particular interest here is that patterns in a system change when the structure becomes unstable due to internal (e.g., change in adaptive resources) or contextual (e.g., type and magnitude of the stressor) influences that disrupt the system. When this occurs, components may reorganize into a new, more stable state or may deteriorate due to dysfunction.
One example of our approach is to use DSA to model the effects of daily stress on daily affect (order parameters in the dynamic model include coupling of affect and stress and the damping of the affective response to the stress perturbations). It is expected that those who dissipate stress (e.g., are less sensitive or recover more quickly) will exhibit improved cognitive, health and well-being outcomes. One advantage of our approach is the plethora of data across time and timescale. Boker, Staples and Hu (2016) developed a framework for building and testing models of dynamic regulation by categorizing sources of differences between theories of dynamics. Thus, it is possible to study both the dynamics of change and change in dynamics. This approach contributes a novel way of capturing resilience as a dynamic process rather than a static or trait-like attribute. As such, it is an important contribution to the resilience literature.
In reference to our second component of understanding indicators of resilience, factors external to the system can also influence how stressful experiences affect the individual. One of the most reliable findings in the stress literature is the remarkable degree of heterogeneity in the stress response (McEwen & Stellar, 1993). Thus, not all individuals with high exposure to adversity develop psychological disorders or medical diseases; the individual’s adaptive assets influence these differences (Ong & Bergeman, 2005). Control parameters, which are external to the dynamic system, but influence the order parameters that represent the system, can also be included in dynamic systems analyses. These are attributes such as resilience resources (e.g., social support; personality), contextual influences (e.g., life events, caregiver stress, chronic strains, role proliferation, neighborhood and financial stress), as well as demographic influences (e.g., age, gender, education). Analyses of this type can answer questions such as, how are complex changes in health contoured by protective factors that may lift or change disadvantageous developmental pathways? Research has indicated that psychological resilience and supportive social resources help to regulate emotional and physical reactions to stress. As is depicted in Figure 1, the ability to regulate one’s stress response through coping mechanisms, interrupts the physiological stress pathway, minimizing the negative effects on the physiological indicators of health functioning, and ultimately protects against detrimental mental and physical health outcomes.
An important goal of our approach is the exploration of models that best embody patterns of regulation that represent characteristics of individuals who are resilient, and to explore the features of persons and environments that contribute to these qualities. Using DSA, we are able to assess a) the dynamic coupling between trajectories of stress and affect (i.e., stress reactivity/resistance), b) the return of negative affect to equilibrium (i.e., stress recovery), and c) the resilience resources that produce stress resistance and recovery, and hence reduce the detrimental physiological effects of stress. The order and control parameters derived from the DSA analyses, representing dynamic characteristics of individuals that can be used to predict the cognitive functioning, physiological dysregulation and health outcomes proposed in the NDHWB. Although our hypotheses remain broad, they represent a process-oriented depiction of the cascade of psychological and physiological changes associated with dysregulation in the adaptive stress system and the early and late consequences for health.
In the third component to understanding resilience, dynamic systems can operate at different timescales. For example, attributes like blood pressure, endocrine response, biorhythms, or emotional regulation across minutes or days reflect systems in micro-time that are different from attributes that result in change across years or situations (i.e., the macro-level developmental traits or outcomes that are produced, such as cardiovascular disease, personality, cognitive impairment). Our approach can: 1) expose the dynamic structure of the facets of the system itself, 2) suggest the emergence, collapse, decay or reemergence of that structure, and 3) demonstrate not only how the system adapts to disruption, but also how it performs across development and produces the outcomes of interest (Bergeman, et al., 2020; Hollenstein, Lichtwarck-Aschoff, & Potworowski, 2013). To capture stress, resilience resources and outcomes of interest, we collect data yearly, daily, and in “real” time through our stress manipulation. The ability to detect whether processes of dys-regulation due to stress work similarly across these different timescales and whether the resilience resources that can mitigate the potential detrimental effects work in the same ways is essential to understanding global indices of risk and resilience. This approach provides an important lens for understanding the confluence of how risk and resilience works in people’s lives.
Another problem in the current landscape of resilience research is that it is difficult, if not impossible, to capture psychological and physiological data on individuals while they are experiencing life challenges, especially if one wants to establish a baseline of behavior prior to the onset of the event. One way to solve this problem is to create a stressful experience to assess individual differences in the physiological response to stress (e.g., cortisol, heart rate, electrodermal activity) and the moderating factors that may be importantly involved. In our pilot work, we used the TSST and the M|S challenge tasks in controlled conditions for the purposes of improving prediction and identifying contributory, mediating, or moderating factors and mechanisms influencing resilience. Figure 3 depicts patterns of dys- and re-regulation in the HPA-axis response (cortisol) to the stress manipulation. Further analyses will assess similarities and differences across different timescales to capture and understand similarities and differences in how resilience works in contexts of immediate stress, daily hassles, chronic stress and major life events.
Figure 3.
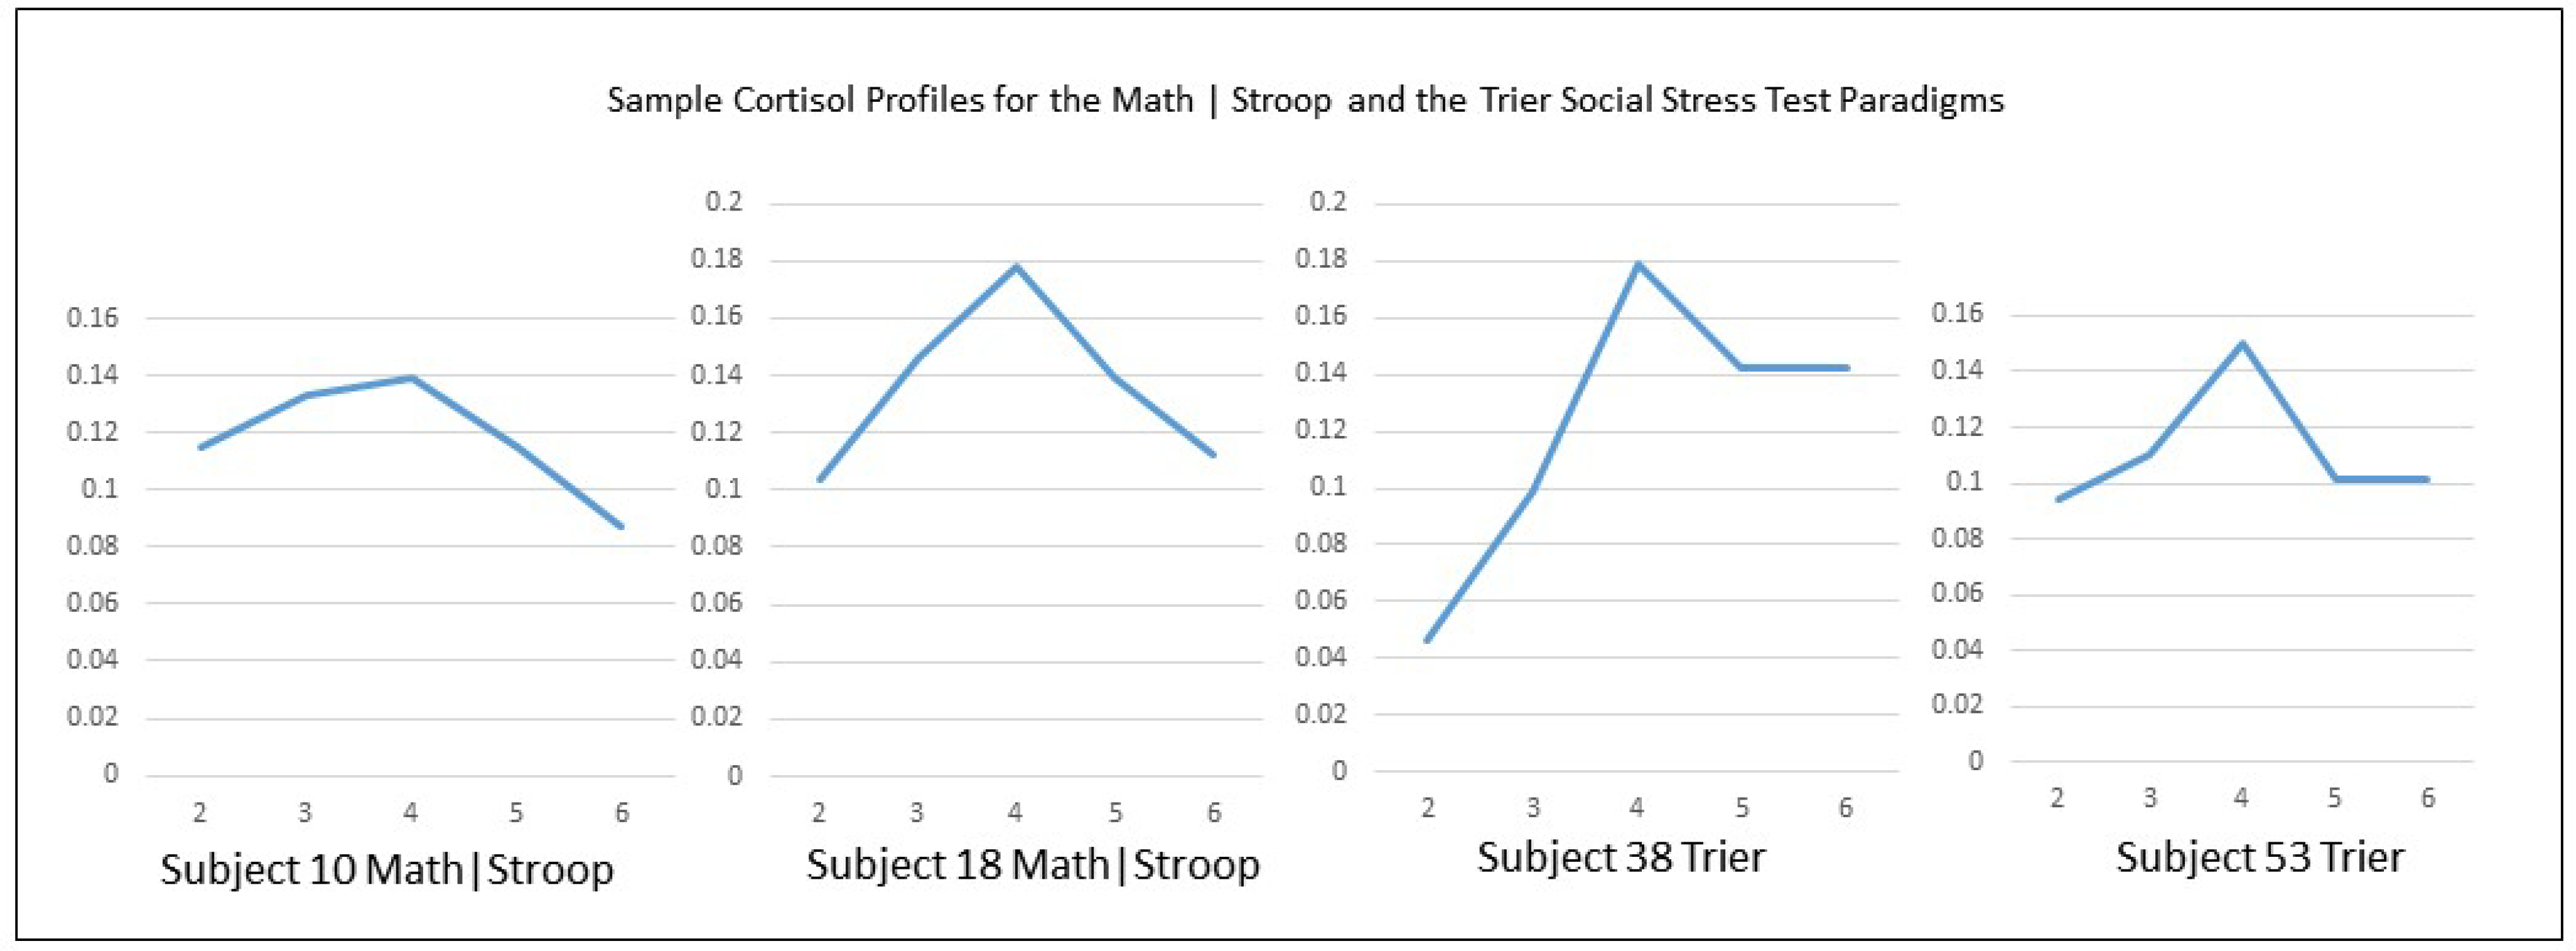
Sample cortisol profiles for participants in the Math | Stroop and the Trier Social Stress Test Paradigm.
Of particular interest is regulation/ dysregulation of autonomic and HPA responses. For example, does the oscillation of emotions experienced by the individual converge toward a stable state (Equilibrium) or away from it (Amplification)? What characteristics of the individual predict individual differences in these outcomes? Are feelings synchronized with heart rate and galvanic skin response? If they are, then such biofeedback signals could be used to alert individuals of their stress response and then control mechanisms can be engaged to help reduce or mitigate their effects. Ultimately, our interest is in the ability to use the wealth of stress and resilience data in the NDHWB to predict individual differences in the lab stress response, and to understand the effects of stress reactivity across time scales (immediate, daily, yearly) and contexts (experimental manipulation, daily hassles, major life events). For example, we can compare cortisol regulation during lab task to assess whether individuals who are better at regulating during a stressful situation also show better daily cortisol regulation in the face of daily hassles or small life events. In addition, we can assess whether the same resilience resources predict these regulation capacities. Using the dynamic, Adaptive Equilibrium models of stress regulation (Boker, et al., 2015; McKee, Neale, Rappaport, & Boker, 2018), we will be able to depict, compare, and explain these complex psychosocial-biological processes.
Examples of analyses and findings from the NDHWB
Annual Longitudinal Data in the NDHWB.
One interesting finding in the research literature is the relationship between depression and immune system functioning. A meta-analysis of nine cytokines in 24 studies found that basal levels of IL-6 and TNF-α were significantly related to depression (Dowlati, et al., 2010). It is unclear whether inflammation is triggered by stress and exacerbated by unhealthy lifestyle resulting in depression or whether depression produces change in the performance of the immune system. Although a test of these complex ideas is beyond the scope of this preliminary work, we were interested in looking at patterns of depression across the 10 waves of available data and the relationship with subsequent indicators of immune functioning and inflammation.
Using 10 years of longitudinal data, we performed Latent Growth Mixture Modeling (LGMM) using Mplus 8.0 (Muthén & Muthén, 2014) to identify the best fitting trajectory models for depressive symptoms (CES-D); we allowed variances of both the intercept and slope parameters to be freely estimated. Fit statistics for unconditional models with 2–4 classes were compared. The information criteria (AIC, BIC, SSABIC) decreased from 2 to 3 classes, which indicated increased fit, but increased with the 4-class solution. Entropy, as a measure of certainty in class membership, was high for the 2-class (.91) and 3-class (.87) solutions, but less favorable for the (.80) 4-class solution. The adjusted Lo-Mendell-Rubin (LRT) indicated significantly improved model fit from 1- to 2-classes and borderline significantly improved model fit from 2- to 3-classes (p = .06), but did not approach significance when comparing the 3- to 4-class solutions. The 3-class model was also determined to be the most theoretically relevant and coherent.
Examining the 3-class model further, the majority of the sample (77.8%) was assigned to a stable low depression trajectory characterized by a low intercept (M = 26.6, SE = .34, p ≤ .001) and a nonsignificant, flat slope (Est = .10, SE= .06, p = .11). The second largest class (17.3%) described a population with a consistently moderate depression symptoms, a moderate intercept (M = 41.8, SE = 1.47, p ≤ .001) and a significant, slightly declining slope (Est = −.43, SE = 0.46, p =.05). Finally, a third, smaller portion of the sample (4.9%) described a population characterized by a high intercept (M = 58.85, SE = 2.81, p ≤ .001), and a more variable and overall significantly declining slope (Est = −.80, SE = 0.37, p ≤ .05). Class membership was then used to predict the composite of immune/inflammatory markers (i.e., IL-6, TNF-α, C-RP, Homocysteine) controlling for age and gender (both n.s.). Results indicated a significant effect of depressive symptom class membership on immune functioning (F2,39=8.53 p=0.001) with an overall model fit of F4,39=4.76 p=0.003; the model accounted for 33% of the composite variance. Mean values by class: Class 1 (high depression) =8.24, Class 2 (moderate) =0.02, and Class 3 (low depression) =−0.22, with lower scores indicating better immune response.
Longitudinal Daily Data in NDHWB.
One important goal of our study is to model dynamic systems of stress regulation within individuals, across time scales and type of stress, to predict the cognitive, health and well-being consequences of stress exposure, to assess resilience resources both within and outside of the system, and to assess the short-term regulatory process associated with experimentally induced stress. One example for conceptualizing a dynamic system is the Damped Linear Oscillator, which consists of modeling both the individual’s general proclivity toward equilibrium, and the short-term fluctuations around this mean trend or the intraindividual variability (Boker, 2002). An analogy for this model is the trajectory of pendulum with friction makes as it swings back and forth— perturbed by force and returning to equilibrium over time. This model depicts self-regulation. First, we built models to estimate individual differences in equilibrium value and equilibrium change. In the NDHWB data, we estimated the equilibrium within each wave of the burst as a growth curve over the 56 days of data for that wave, with the intercept centered on the middle observation of the burst. For the short-term change in equilibrium, the time unit is months. Second, we modeled individual differences in parameters of dynamics, such as the frequency and damping of fluctuations. The residuals from the Positive Affect and Stress equilibrium estimation were time-delay embedded into a four dimensional space, and third order General Local Linear Approximation (Boker, Montpetit, Hunter & Bergeman, 2010) was used to estimate the zeroth, first, second and third derivatives of the burst data. In turn, we inputted these values into a coupled second-order linear differential equation SEM model using third-order constraints and age moderation of parameters.
Figure 4 is a path diagram of the dynamic relationship of stress, positive affect, and their confluence, both within and across time. Using stress as an example, the analyses revealed a significant fixed effect for frequency (η= −1.12 ±0.02; level of stress oscillation), but not for damping (ζ= −.004±0.008; representing the return to equilibrium). Beyond the fixed effects that portray the relationships in the sample as a whole, there are substantial random effects that represent individual differences in the frequency, damping and coupling parameters. This means that people differ in how quickly stress oscillates, their ability to damp their stress to equilibrium following a perturbation, and the strength of coupling between PA and stress. Of note, the standard deviations of long-term changes in frequency (sd(ηPAwave)= .16, sd(ηStresswave)=.19) are substantial even though the mean change of the sample is only slightly less than zero. Thus, some people have increasing amplitude fluctuations, whereas others are decreasing across time.
Figure 4.

A path diagram of the dynamic relationship of stress, positive affect, and their confluence, both within and across time.
In the third part of this preliminary analysis, we tested the moderation of regulation by wave, which is an estimate of how a participant’s short-term regulation changes over the 10-year period of the study. The change in equilibrium over the five waves was estimated using person-specific quadratic growth curves. For these long-term change estimates, the unit of time is years. For stress, there was a significant change in the frequency of oscillation, but not in the damping parameter, η= −0.04±0.005 and ζ= 0.002±0.004, respectively.
Finally, within individuals, internal or contextual factors may contribute to, or disrupt, this regulatory process. For example, attributes such as stress and negative affect are “coupled together” in our daily lives (Montpetit, Bergeman, Deboeck, Tiberio & Boker, 2010), and this link reflects the extent to which changes in fluctuations in the emotion system are sensitive to variability in stress exposure. A more complex dynamical systems model allows regulation in one part of a system to influence the regulation in another part of a system. This is a bivariate extension of the Damped Linear Oscillator model described above, in which the two trajectories not only regulate themselves, but influence one another as well. The coupling between stress and negative affect can be conceptualized as an indicator of stress reactivity. That is, to what extent are changes in fluctuations in the emotion system sensitive to fluctuations in stress exposure? The extent to which the systems are de-coupled in some individuals may reflect stress resistance, rather than reactivity. The relationship between stress and positive affect, may represent the ways in which positive affect may “undo” the detrimental effects of stress (Fredrickson, Mancuso, Branigan & Tugade, 2000). In our preliminary work, the γ parameter is significant and represents the proportional amount of positive affect that has an effect on the regulation of stress (γ= 0.10 ±0.01). In all, we see significant oscillation in positive affect and stress and positive coupling, but not damping in this system. We note that the residual variances are significant and suggests that there is more to predict in these data than is captured by the second-order linear differential equation. Given the small sample size in this preliminary analysis, it is important to replicate these results, as the sample grows larger.
One thing that was learned from preliminary analyses from the intensive longitudinal part of the this study is that although some of the variables (e.g., PA and Stress) are amenable to linear second-order coupled AER models, other variables (e.g., negative affect) do not have a dynamic that conforms to the assumptions of that model. This has led to ongoing development of new methods for analysis of the full data set as an important focus for future work. In one project, we create a method for estimating bifurcations (i.e., times when sudden shifts in dynamics occur; Moulder 2020 unpublished dissertation). A second project is aimed at estimating model-free symmetry breaking times (Sjobeck, Boker, Scheidt, & Tschacher, under review). We have noted that when symmetry-breaking events occur in simulated time series, estimates of damping can be substantially biased towards zero (McKee, Neale, & Boker, 2017). By understanding how to segment individuals’ time series into symmetry preserving segments, we will be able to better estimate regulatory damping as well as being able to use the timing of these symmetry breaking events in further prediction models. This leads to possible changes to our theoretical framework: it is possible that symmetry breaks are indicators of loss of resilience, or conversely symmetry breaks are themselves a form of adaptive regulation. We plan to pursue these possibilities!
In addition to affective systems, dynamic modeling of physiological systems are also of interest. For example, dysregulation in the circadian cortisol pattern has been linked to various negative health outcomes, including mood disorders such as depression and anxiety. This dysregulation can take several different forms. Numerous studies have found evidence that evening cortisol levels are elevated in depression (e.g., Young, Gallagher, & Porter, 2002). Although the CAR can be blunted in some cases of depression, indicating that general dysregulation in HPA axis activity (i.e., associated with either increases or decreases in cortisol) may be a marker for mood disruption (Pruessner et al., 2003), more often depression is associated with an elevated and more rapid increase in cortisol secretion upon awakening. Similar patterns of elevated CAR have been associated with states in healthy people, such as perceived stress and burnout (Pruessner, Hellhammer & Kirschbaum, 1999), perceived workload and worrying (Schlotz, Hellhammer, Schultz & Stone, 2004), and daily stressors (e.g., weekend vs. weekdays). Studies in older adults in particular have found relationships between the CAR and loneliness, fatigue, and other measures of energy and well-being (Adam, Hawkley, Kudielka & Cacioppo, 2006). Depression is thought to be associated with hypersecretion of salivary cortisol, which often results in a flat diurnal pattern of cortisol activity. Indeed, when cortisol remains consistently elevated throughout the day rather than showing the typical evening drop and morning rise, this is often associated with poor mental and physical health outcomes. Whether this abnormal pattern represents a marker of biological vulnerability to mood problems or a neuroendocrine “scar” of previous episodes is currently unclear. The data collection in the NDHWB, will help illuminate these issues. In addition, because cortisol is collected concurrently with daily diary assessments, it is possible to look at the synchrony between daily stress and indicators of physiological response, which provides a unique window into the resulting exposure to, and regulation of, stress.
In sum, we propose the study of risk and resilience in everyday life by utilizing statistical methodologies that are responsive to complex, dynamic changes over time. A major strength of our analytic approach is the ability to model processes that may simultaneously occur within individuals and across time scales and contexts. The contemporary statistical approaches that we adopt will enable us to address a variety of questions, including some that are difficult, if not impossible, to address with traditional methods. In particular, processes that involve patterns of change (e.g., cycles or rhythms), rate of change (e.g., duration or recovery), speed of change (e.g., nonlinear processes), and covariation in change (e.g., co-occurrence, lagged associations) are all ideally suited for study using dynamic systems analysis. The development of models of this type is fundamental to understanding the lived experience of individuals throughout the life course and the impact of stress on dysfunction, disorder and disease. The NDHWB also offers an excellent opportunity to develop other types of DSA models to fit the physiological processes of interest (see Bergeman & Deboeck, 2014; Boker, 2015; Boker et al., 2016; Boker, Moulder, & Sjobeck, 2020, Deboeck & Bergeman 2013). The additional value of being able to experimentally manipulate stress and model subsequent disruption to physiological systems affected by stress and the coping resources that differentiate the regulation of the stress response increases exponentially the value of this resource for understanding risk, resilience, and recovery.
The strengths of the NDHWB lie in its longitudinal nature and accomplishments to date, the content and quality of the emotional and psychophysiological data, the recognition of a broad array of psychological conditions that operate at different levels of influence, and the use of highly innovative methodologies and data analytic techniques to detect and track the changing configurations of stressors and protective resources that collectively reflect the stress process. Ultimately, along with longitudinal assessments of life stress in its many forms and qualities, assessments of stress-related physiology and disease must be investigated repeatedly over time to yield critical information about the cumulative processes that lead to disease. By good fortune and design, we have the requisite and rich life stress measures; by necessity, we now obtain the biological indicators of stress, assessments of cognitive functioning, and verified evidence of disease in a sample large enough to produce reliable results. This supplemental information on stress-related physiology and disease prevalence provides the next logical empirical step for investigating these longitudinal relationships, and for developing clues about the implications of antecedent stress with respect to resilience resources and individual differences in physiological markers of health. Use of the laboratory manipulations of stress, physiological and affective assessment of stress response and processes of re-regulation is a promising addition to the NDHWB.
In confluence, the proposed research provides an unprecedented opportunity to study with multiple methods the stressors to which adults are exposed, the resistance resources upon which they draw, and the emotional and physiological processes through which stress is manifested and eventually contributes to physiological dysregulation and disease across cognitive, psychological and physical health domains. Because the study includes different types of stressors (e.g., chronic, major life events, daily hassles, laboratory manipulation), psychological and physiological indicators of stress (dys)regulation, tool that allow for the assessment of regulation across multiple time scales (e.g., yearly, daily, moment-to-moment), personal (personality attributes) and contextual (social support) resilience resources, and the long term consequences on health and well-being, the NDHWB can fill many gaps in the resilience literature. This is an exciting new field of inquiry, which is expected to flourish in the coming years.
Acknowledgments
This research is supported by grants from the National Institute of Aging—National Institutes of Health [Grant # 1 R01 AG023571-A1-0, UG3AGO5703, UH3AGO57039 to C. S. Bergeman].
References
- Adam EK, Hawkley LC, Kudielka BM, & Cacioppo JT, 2006. Day-to-day dynamics of experience-cortisol associations in a population-based sample of older adults. Proc Natl Acad Sci U S A, 103 (45), 17058–63. [DOI] [PMC free article] [PubMed] [Google Scholar]
- Bergeman CS & Deboeck PR (2014) Trait Stress Resistance and Dynamic Stress Dissipation on Health and Well-being: The Reservoir Model. For a Special Issue of Research in Human Development: The Promise and Challenges of Integrating Multiple Time Scales in Adult Developmental Inquiry, Gerstorf Denis, Hoppmann Christiane, and Ram Nilam (eds.). Research in Human Development, 11 (2), 108–125 [DOI] [PMC free article] [PubMed] [Google Scholar]
- Bergeman CS, Blaxton J, & Joiner R (2020). Dynamic systems, contextual influences and multiple time-scales: Emotion regulation as a resilience resource. The Gerontologist 10.1093/geront/gnaa046 [DOI] [PMC free article] [PubMed] [Google Scholar]
- Block J & Kremen AM, (1996). IQ and ego-resiliency: Conceptual and empirical connections and separateness. Journal of Personality and Social Psychology, 70(2):349–61. Available from: 10.1037/0022-3514.70.2.349 [DOI] [PubMed] [Google Scholar]
- Boker SM (2001). Differential structural modeling of intraindividual variability. In: Collins L, Sayer A, (eds). New methods for the analysis of change, Washington, D. C.: American Psychological Association, p. 3–28. [Google Scholar]
- Boker SM (2002). Consequences of continuity: The hunt for intrinsic properties within parameters of dynamics in psychological processes. Multivariate Behavioral Research, 37, 405–422. [DOI] [PubMed] [Google Scholar]
- Boker SM (2015) Adaptive Equilibrium Regulation: A Balancing Act in Two Timescales. Journal of PersonOriented Research, 1:(1–2), 99–109. [DOI] [PMC free article] [PubMed] [Google Scholar]
- Boker SM & Bisconti TL (2006). Dynamical systems modeling in aging research. In: Bergeman CS, Boker SM, (eds.) Methodological issues in aging research, Mahwah, NJ: Erlbaum, p. 185–230 [Google Scholar]
- Boker SM, Moulder R, & Sjobeck G (2020) Constrained Fourth Order Latent Differential Equation Reduces Parameter Estimation Bias for Damped Linear Oscillator Models. Structural Equation Modeling 7:2 202–218. [DOI] [PMC free article] [PubMed] [Google Scholar]
- Boker SM, Montpetit MA, Hunter MD, & Bergeman CS, (2010). Modeling Resilience with Differential Equations, In Newell K & Molenaar P (Eds.) Learning and Development: Individual Pathways of Change, (pp 183–206) APA: Washington, DC. [Google Scholar]
- Boker SM, Staples A, & Hu Y (2016) Dynamics of Change and Change in Dynamics. Journal for Person Oriented Research, 2:1–2, 34–55. [DOI] [PMC free article] [PubMed] [Google Scholar]
- Crimmins E, Johnson M, Hayward M & Seeman T (2003). Age differences in allostatic load: an index of physiological dysregulation. Experimental Gerontology, (38), 731–734. [DOI] [PubMed] [Google Scholar]
- Deboeck PR, & Bergeman CS (2013). The reservoir model: Differential equation model of psychological capacity. Psychological Methods, 18, 237–256 [DOI] [PMC free article] [PubMed] [Google Scholar]
- Dowlati Y, Herrmann N, Swardfager W, Liu H, Sham L, Reim EK, & Lanctôt KL (2010) A meta-analysis of cytokines in major depression, Biol Psychiatry, 67(5), 446–57. [DOI] [PubMed] [Google Scholar]
- Fredrickson BL, Mancuso RA, Branigan C, & Tugade MM (2000). The undoing effect of positive emotions, Mot. Emot, 24, 237–258. [DOI] [PMC free article] [PubMed] [Google Scholar]
- Gershon RC, Cella D, Fox NA, Havlik RJ, Hendrie HC, & Wagster MV (2010). Assessment of neurological and behavioural function: the NIH Toolbox. The Lancet Neurology, 9(2), 138–139. [DOI] [PubMed] [Google Scholar]
- Hollenstein T, Lichtwarck-Aschoff A, & Potworowski G (2013). A Model of Socioemotional Flexibility at Three Time Scales. Emotion Review, 5(4):397–405. 10.1177/1754073913484181 [DOI] [Google Scholar]
- Kirschbaum C, Pirke K-M, & Hellhammer DH (1993). The ‘Trier Social Stress Test’- a tool for investigating psychobiological stress responses in a laboratory setting. Neuropsychobiology, 28, 76–81. [DOI] [PubMed] [Google Scholar]
- Kobasa SC & Puccetti MC (1983). Personality and social resources in stress resistance. Journal of Personality and Social Psychology, 45(4):839–50. Available from: 10.1037/0022-3514.45.4.839 [DOI] [PubMed] [Google Scholar]
- Lupien SJ, Ouellet-Morin I, Hupback A, Tu MT, Buss C, Walker D, Pruessner J, & McEwen BS (2006). Beyond the stress concept: Allostatic load – a developmental biological and cognitive perspective. In Cicchetti D & Cohen DJ (Eds.), Developmental psychopathology: Vol. 2. Developmental neuroscience (2nd ed., pp. 578–628). New York: Wiley & Sons. [Google Scholar]
- Masten A & Powell J (2003). A resilience framework for research, policy and practice. In: Luthar S, ed. Resilience and vulnerability: adaptation in context of childhood adversities. Cambridge:Cambridge University Press, p. 1–25. [Google Scholar]
- McArdle JJ, & Nesselroade J (2014). Longitudinal data analysis using structural equation modelling. Washington, DC: American Psychological Association. [Google Scholar]
- McEwen BS (1988). Stress, adaptation, and disease: Allostasis and allostatic load. Annals of the New York Academy of Sciences, 840, 33–44. [DOI] [PubMed] [Google Scholar]
- McEwen BS, & Stellar E. (1993) Stress and the Individual: Mechanisms Leading to Disease. Arch Intern Med, 153(18):2093–2101. doi: 10.1001/archinte.1993.00410180039004 [DOI] [PubMed] [Google Scholar]
- McKee KL, Neale MC, & Boker SM (2017) Modeling psychological dynamics with random events. Behavior Genetics 47:6, 675–676 [Google Scholar]
- McKee KL, Neale MC, Rappaport LM, & Boker SM (2018) Adaptive Equilibrium Regulation: Modeling Individual Dynamics on Multiple Timescales. Structural Equation Modeling. 25:6, pp 888–905. [DOI] [PMC free article] [PubMed] [Google Scholar]
- Moulder R (2020) Latent Multivariate Maximal Lyapunov Exponents. Unpublished doctoral dissertation, Department of Psychology, University of Virginia Online archive: 10.18130/v3-6f76-0y53 [DOI] [Google Scholar]
- Monroe SM (2008). Modern approaches to conceptualizing and measuring human life stress. Annual Review of Clinical Psychology, 4, 33–52. [DOI] [PubMed] [Google Scholar]
- Montpetit MA, Bergeman CS, Deboeck PR, Tiberio SS, & Boker SM, (2010) Resilience-asprocess: Negative affect, stress, and coupled dynamic systems. Psychology and Aging, 25, 361–340. [PMID: 20853969] [DOI] [PubMed] [Google Scholar]
- Muthén LK, & Muthén BO (2002). How to use a Monte Carlo study to decide on sample size and determine power. Structural Equation Modeling, 9, 599–620. [Google Scholar]
- Ong A & Bergeman CS (2005). Resilience and adaptation to stress in later life: Empirical perspectives and conceptual implications. Invited paper for Ageing International, 29, 219–246. [Google Scholar]
- Pruessner M, Hellhammer DH, Pruessner JC, & Lupien SJ (2003) Self- reported depressive symptoms and stress levels in healthy young men: associations with the cortisol response to awakening. Psychosomatic Medicine 65:92–99 [DOI] [PubMed] [Google Scholar]
- Pruessner M, Wolf OT, Hellhammer DH, Buske-Kirschbaum A, von Auer K et al. (1997). Free cortisol levels after awakening: A reliable biological marker for adrenocortical activity. Life Sciences, 61(26), 2539–2549. [DOI] [PubMed] [Google Scholar]
- Pruessner JC, Hellhammer DH, & Kirschbaum C, (1999). Burnout, perceived stress, and cortisol responses to awakening. Psychosomatic Medicine, 61 (2), 197–204. [DOI] [PubMed] [Google Scholar]
- Schlotz W, Hellhammer J, Schultz P, & Stone AA, (2004). Perceived work overload and chronic worrying predict weekend—weekday differences in the cortisol awakening response. Psychosomatic Medicine 66, 207–214. [DOI] [PubMed] [Google Scholar]
- Sjobeck G, Boker S, Scheidt C, & Tschacher W (under review) The Pairwise Approximate Spatiotemporal Symmetry (PASS) Algorithm: A Method for Segmenting Time Series Pairs. Psychological Methods. [DOI] [PubMed] [Google Scholar]
- Thelen E (2005) Dynamic Systems Theory and the Complexity of Change, Psychoanalytic Dialogues, 15:2, 255–283, DOI: 10.1080/10481881509348831 [DOI] [Google Scholar]
- Turner JR, Hewitt JK, Morgan RK, Sims J, Carroll D, & Kelly KA (1986). Graded mental arithmetic as an active psychological challenge, International Journal of Psychophysiology, 3, 307–309 [DOI] [PubMed] [Google Scholar]
- U.S. Census Bureau: State and County QuickFacts. http://quickfacts.census.gov/qfd/states/18/18141.html retrieved on 3/14/15 at 7:34AM.
- Weintraub S, Dikmen SS, Heaton RK, Tulsky DS, Zelazo PD, Bauer PJ, ... & Fox NA (2013). Cognition assessment using the NIH Toolbox. Neurology, 80(11 Supplement 3), S54–S64. [DOI] [PMC free article] [PubMed] [Google Scholar]
- Wilhelm I, Born J, Kudielka BM, Schlotz W, & Wust S, (2007) Is the cortisol awakening rise a response to awakening? Psychoneuroendocrinology 32, 358–366. [DOI] [PubMed] [Google Scholar]
- Wust S, Kumsta R, Treutlein J, Frank J, Entringer S, Schulze TG, & Rietschel M, (2009). Sex-specific association between the 5-HTT gene-linked polymorphic region and basal cortisol secretion. Psychoneuroendocrinology 34, 972–982. [DOI] [PubMed] [Google Scholar]
- Young AH, Gallagher P, & Porter RJ (2002) Elevation of the cortisol-dehydroepiandrosterone ratio in drug-free depressed patients. Am J Psychiatry 159:1237–1239. [DOI] [PubMed] [Google Scholar]
- Zhang Z, Hamagami F, Wang L, Grimm KJ, & Nesselroade JR (2007). Bayesian analysis of longitudinal data using growth curve models. International Journal of Behavioral Development, 31(4), 374–383. [Google Scholar]