

RNA vaccines are instrumental to a timely response to disease outbreaks and pandemics. However, drug development constantly copes with high attrition rates, leading to efficacy and safety‐related failures. Mathematical models are cost and time‐effective tools in guiding drug optimization strategies. Here, we extend a multicompartmental model of immunogenicity for therapeutic proteins 1 to provide a representation of the early events after the injection of an mRNA vaccine and suggest, through sensitivity analysis, properties to optimize.
Coronavirus disease 2019 (COVID‐19) has rapidly spread around the globe initiating a pandemic that has already claimed hundreds of thousands of lives. After the release of the sequence of the spike protein on January 11, 2020, few weeks were sufficient to generate spike‐encoding RNA vaccines and initiate testing. The unprecedented efforts (economical and scientific) lead the the Moderna mRNA vaccine on March 16, 2020, to enter phase I clinical trials, 2 soon followed by other candidates.
This astonishing response is, however, an exception, because pharmaceutical industry reports high attrition rates for traditional vaccines development, 3 as per new chemical entities, 4 with a market entry probability of 6%. 5 The most challenging step is the transition rate between phases II and III, which has an estimated probability of 21%. 5 Vaccine safety remains a crucial point in phase III clinical trials and, in some cases, as per the hepatitis B vaccine, the attrition rate is calculated to be 50% for the transition from phase III to regulatory submission. 5
The risk profiles and the recent need for a way to fast‐track vaccine candidates, even among the same company, call for strategies to minimize resources dispersion moving forward only the optimal candidates. 6
Systems biology and in particular quantitative systems pharmacology (QSP) has been proven to be instrumental in reducing in vitro – in vivo disconnections, by generating in silico tools capable of helping in go/no‐go decisions. 7
In this work, we developed a mathematical model for mRNA vaccine by adapting and extending a multiscale model of immunogenicity from Chen et al. 1 We maintained unvaried the description of the humoral immune response (T and B cell kinetics) in the draining lymph node, extending the model with a detailed representation of the early events following the injection of the delivery system carrying the mRNA, based on the work of Leonardelli et al. 2021. 8
As illustrated by the model diagram provided in Figure 1 and in the Supplementary Material, we considered the kinetics of four cell types to represent the early events: myeloid dendritic cells (mDCs), plasmacytoid dendritic cells (pDCs), monocytes, and neutrophils. For every cell type, we define a rate of migration inside () and outside () of the injection site compartment. These are in equilibrium with the death rate (, not shown in Figure 1) to maintain the cell number at steady‐state in the absence of the vaccine. The vaccine delivery is assumed to be instantaneous and its concentration will drive cell recruitment (). Furthermore, muscle cells surrounding the injection site will compete with the immune cells for the vaccine uptake ().
FIGURE 1.
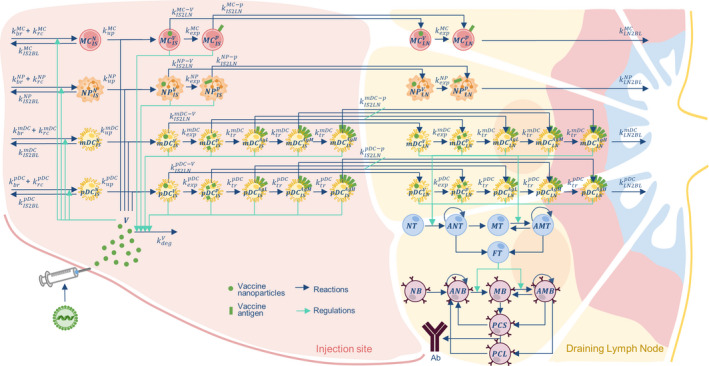
The mRNA vaccine model diagram. The model is composed of two compartments: injection site (IS) and draining lymph node (LN). The cells represented are: myeloid dendritic cells (mDCs); plasmacytoid dendritic cells (pDCs); monocytes (MCs); and neutrophils (NPs). Each cell is also identified by a subscript and superscript indicating, respectively, the compartment where they are located (IS or LN) and the cell phenotype: naïve (N), containing vaccine vector (V), expressing antigen protein (p) and presenting antigen at the membrane (low, medium, or high respectively: AgL, AgM, and AgH). In the LN we also find the adaptive response cells: naïve T (NT); memory T (MT); activated naïve T (ANT); activated memory T (AMT); functional T (FT); naïve B (NB); memory B (MB); activated naïve B (ANB); activated memory B (AMB); short and long‐lived plasma cells (respectively, PCS and PCL), which secrete antibody (Ab)
Cells recruited at the injection site can be found in four states: naïve, carrying the vector, expressing the protein, and presenting the antigen at different levels. We considered the uptake of the vector () to be cell‐specific, and independent of their state. Once the vector has been transported in the cytoplasm, it will be unpacked and the payload will be translated () with a rate that depends on the cellular machinery and is not affected by the compartments. The uptake of the vaccine and resultant expression of the antigen lead to the formation of two cell populations: and . The signaling cascades, activated by the maturation processes, trigger a migration toward the lymph node with different rates ( and ) specific to the cell type and their differentiation state.
To account for a progressive accumulation of the antigen on the cell membrane, we separated the antigen‐presenting cells (APCs; i.e., mDCs and pDCs) in three different populations according to the amount of expressed antigens: low (), medium (), or high (). The transition rate between two populations is defined by the transport rate (). Upon reaching the draining lymph node, the cells will continue to unpack the engulfed vector and express the antigen, and eventually migrate to the bloodstream ().
Because the model parameters necessary to quantitatively describe the early events and migration phenomena are not fully available, we used experimental data from Liang et al. 9 to estimate the missing ones (Supplementary Material). In this study, rhesus macaques were inoculated with a lipid nanoparticle carrying the mRNA and coding a fluorescent protein.
Naïve T cells (NT), once in contact with the APC, will become active (). Depending on the balance between APC and T, will undergo proliferation or differentiation. A similar activation process is accounted for memory T (MT), present in a second exposure, that will become active memory (). Although, in this case, the activation threshold is lower than the one for NT. The activation functions depend on the number of APC‐ cells in the different antigen level classes. The NT will be activated by or , whereas MT also with
and can further differentiate into either functional T helper (FT), which are responsible for B cell activation, or MT, which are tied to the secondary response. Proliferation and differentiation into and are based upon the relative amount of APC‐ cells among the antigen level classes.
Analogously, B cell activation, proliferation, and differentiation is a function of the balance among FT, B cells, and the availability of the free antigen. In our modelistic approximation, we considered the antigen as bound to the APCs membrane only. The complete set of equations and the model parameters is available in the Supplementary Material.
When calibrated with experimental data (as the one from Liang et al. 9 ), QSP models can be used to compare in silico how different optimization strategies affect the vaccine immune response, 10 guiding the mitigation of attrition risks. We explored, by sensitivity analysis (Table 1), different approaches to maximize the antibody titers, such as increasing translation of the mRNA and antigen accumulation on the membrane ( or ), co‐delivery with adjuvants altering immunogenicity (), and vaccine vector uptake (). These parameters were selected as their design is a crucial part of the vaccine development and because they can be tailored and systematically optimized to maximize the drug effect.
TABLE 1.
Sensitivities table. Cell colors highlight the sensitivities value from the lowest (gray) to the highest (dark blue)
|
|
|
|
|
|
|||||
|---|---|---|---|---|---|---|---|---|---|
|
|
|
|
|
|
|||||
|
|
|
|
|
|
|||||
|
|
|
|
|
|
|||||
|
|
|
|
|
|
The reported values represent the percentage of Ab increase at day 30 after a 50 µg injection, when increasing of 1% the considered parameter (). On the diagonal we reported the single sensitivities, while the other elements are the combination of two parameters ().
From the resulting sensitivities (Table 1), we observe the relative low impact of the antigen expression () if compared to optimizing the vector uptake rate (), adding adjuvants () or their combination. Interestingly this analysis suggests a minor synergy between and that provides benefits beyond additive. The sensitivities thus suggest prioritizing development strategies grounded on the delivery system, because this would result in a direct optimization of and parameters. These outcomes are, however, indicative of the current parametrization and could change when calibrating the system to a new vaccine.
QSP models, like the one herein presented, can guide in a cost/effective manner the go/no‐go decisions during vaccine development. In particular, different effects of the mRNA pharmacology on the antibody titers can be tested by sensitivity analysis. This can help fast tracking among different formulations the ones showing room for improvement, by forecasting a more efficient response and, thus, reducing attrition rates.
CONFLICT OF INTEREST
G.L., S.F., D.M., and E.S. were all employees of the GSK group of companies at the time of the study. G.S., L.L., S.P., and L.M. were employee of the “Fondazione The Microsoft Research – University of Trento Centre for Computational and Systems Biology (COSBI)” institute, which received financial remuneration for conducting the activities described in this study.
AUTHOR CONTRIBUTIONS
GS developed the mathematical model and wrote the manuscript. LL, GL, SF, and SP contributed to the phase of literature review and data collection and helped with the biological interpretation of the results. DM contributed to project supervision. LM and ES provided overall guidance of the project and share last authorship. All authors reviewed and approved the manuscript.
Supporting information
Supplementary Material
ACKNOWLEDGEMENTS
The authors would like to thank the GSK SAM Technology Platform Team and the Rockville Center for Vaccine Research R&D Leadership Team.
Selvaggio G, Leonardelli L, Lofano G, et al. A quantitative systems pharmacology approach to support mRNA vaccine development and optimization. CPT Pharmacometrics Syst Pharmacol. 2021;10:1448–1451. doi: 10.1002/psp4.12721
Funding information
The work was commissioned and funded by GlaxoSmithKline Biologicals.
Contributor Information
Emilio Siena, Email: emilio.x.siena@gsk.com.
Luca Marchetti, Email: marchetti@cosbi.eu, Email: luca.marchetti@unitn.it.
REFERENCES
- 1. Chen X, Hickling T, Vicini P. A mechanistic, multiscale mathematical model of immunogenicity for therapeutic proteins: Part 1‐theoretical model. CPT Pharmacometrics Syst. Pharmacol. 2014;3:133. [DOI] [PMC free article] [PubMed] [Google Scholar]
- 2. Jackson LA, Anderson EJ, Rouphael NG, et al. An mRNA vaccine against SARS‐CoV‐2 — preliminary report. N Engl J Med. 2020;383:1920‐1931. [DOI] [PMC free article] [PubMed] [Google Scholar]
- 3. Stephens P. Vaccine R&D: past performance is no guide to the future. Vaccine. 2014;32:2139‐2142. [DOI] [PubMed] [Google Scholar]
- 4. Waring MJ, Arrowsmith J, Leach AR, et al. An analysis of the attrition of drug candidates from four major pharmaceutical companies. Nat Rev Drug Discov. 2015;14:475‐486. [DOI] [PubMed] [Google Scholar]
- 5. Pronker ES, Weenen TC, Commandeur H, Claassen EHJHM, Osterhaus ADME. Risk in vaccine research and development quantified. PLoS One. 2013;8:57755. [DOI] [PMC free article] [PubMed] [Google Scholar]
- 6. Gouglas D, Le Thanh T , Henderson K, et al. Estimating the cost of vaccine development against epidemic infectious diseases: a cost minimisation study. Lancet Glob Heal. 2018;6:e1386‐e1396. [DOI] [PMC free article] [PubMed] [Google Scholar]
- 7. Azer K, Kaddi CD, Barrett JS, et al. History and future perspectives on the discipline of quantitative systems pharmacology modeling and its applications. Front Physiol. 2021;12:637999. [DOI] [PMC free article] [PubMed] [Google Scholar]
- 8. Leonardelli L, Lofano G, Selvaggio G, et al. Literature mining and mechanistic graphical modelling to improve mRNA vaccine platforms. Front Immunol. 2021;12:738388. [DOI] [PMC free article] [PubMed] [Google Scholar]
- 9. Liang F, Lindgren G, Lin A, et al. Efficient targeting and activation of antigen‐presenting cells in vivo after modified MRNA vaccine administration in rhesus macaques. Mol Ther. 2017;25:2635‐2647. [DOI] [PMC free article] [PubMed] [Google Scholar]
- 10. Pardi N, Hogan MJ, Porter FW, Weissman D. mRNA vaccines‐a new era in vaccinology. Nat Rev Drug Discov. 2018;17:261‐279. [DOI] [PMC free article] [PubMed] [Google Scholar]
Associated Data
This section collects any data citations, data availability statements, or supplementary materials included in this article.
Supplementary Materials
Supplementary Material