

Abstract
Evidence shows that chronic diseases are associated with COVID-19 severity and death. This study aims to estimate the fraction of hospitalizations and deaths from COVID-19 attributable to chronic diseases associated to poor nutrition and smoking among adults who tested positive to COVID-19 in Mexico.
We analyzed 1,006,541 adults aged ≥20 who tested positive for COVID-19 from March 23 to December 5, 2020. Six chronic diseases were considered: obesity, chronic obstructive pulmonary disease (COPD), hypertension, diabetes, cardiovascular disease, and chronic kidney disease (CKD). We calibrated the database using a bias quantification method to consider undiagnosed disease cases. To estimate the total impact of multiple diseases, we defined a multimorbidity variable according to the number of diseases. Risks of hospitalization and death were estimated with Poisson regression models and used to calculate population attributable fractions (PAFs).
Chronic diseases accounted for to 25.4% [95% CI: 24.8%–26.1%], 28.3% (95% CI: 27.8%–28.7%) and 15.3% (95% CI: 14.9%–15.7%) of the hospitalizations among adults below 40, 40–59, and 60 years and older, respectively. For COVID-19-related deaths, 50.1% (95% CI: 48.6%–51.5%), 40.5% (95% CI: 39.7%–41.3%), and 18.7% (95% CI, 18.0%–19.5%) were attributable to chronic diseases in adults under 40, 40–59, and 60 years and older, respectively.
Chronic diseases linked to poor nutrition and smoking could have contributed to a large burden of hospitalization and deaths from COVID-19 in Mexico, particularly among younger adults. Medical and structural interventions to curb chronic disease incidence and facilitate disease control are urgently needed.
1. Introduction
Chronic diseases have been associated with COVID-19 severity and death. Meta-analytical evidence shows that people with chronic obstructive pulmonary disease, diabetes mellitus, hypertension and cardiovascular disease experience a higher risk of developing severe COVID-19 (Mudatsir et al., 2020). Similarly, obesity, diabetes mellitus, hypertension, and cardiovascular disease have been associated with an increased risk of death (Noor and Islam, 2020). Yet, the population fraction of COVID-19 cases and complications attributable to chronic diseases remains understudied. Estimating the fraction of COVID-19 deaths attributable to chronic diseases could help to inform the heterogeneity in fatality rates observed across countries and to estimate the burden of disease potentially attributable to chronic diseases (Ioannidis, 2021; Zapata-Diomedi et al., 2018). In Mexico, prior population attributable fraction (PAF) estimates have shown that 1.1%, 14.3% and 16.8% of deaths from COVID-19 were attributable to diabetes, hypertension, and obesity, respectively among ambulatory patients (Peña et al., 2020). Estimating PAFs for different risk factors is informative, yet insufficient to capture the total burden of multiple chronic diseases (Rowe et al., 2004).
Few studies have estimated the impact of multiple chronic diseases or multimorbidity on COVID-19 (Lai et al., 2020; Hamer et al., 2020; Adams et al., 2020). Estimating the PAF for chronic diseases is challenging, as the PAF for each disease cannot be simply added, given their potential overlap (Rowe et al., 2004). A second challenge is misclassification bias, considering that a large proportion of the population who suffer chronic conditions may not have been diagnosed. For example, in Mexico 40% of the people with hypertension are unaware of their condition (Campos-Nonato et al., 2016). Most studies rely on self-reported disease diagnosis, misclassifying a large proportion of the population. To our knowledge, no study has attempted to estimate the impact of this bias on COVID-19 attributable fractions.
We aimed to estimate the fraction of hospitalizations and deaths from COVID-19 potentially attributable to chronic diseases associated with poor nutrition and smoking among patients positive to COVID-19 in Mexico considering obesity, chronic obstructive pulmonary disease (COPD), hypertension, diabetes, cardiovascular disease, and chronic kidney disease (CKD). These diseases were selected given their prevalence and the wide range of interventions available to reduce their impact through public policy or individual-level interventions (Secretaría de Salud, 2018; World Heart Federation, n.d.; Tamayo y Orozco and Lastiri Quirós, 2016; Instituto Nacional de Enfermedades Respiratorias, 2017). We also implemented bias quantification methods to consider the impact of misclassification induced by self-reported data.
2. Methods
Data was obtained from the publicly available COVID-19 national registry provided by the Health Ministry of Mexico (dataset Secretaría de Salud, 2020). The surveillance system contains information on all suspected cases of COVID-19, people with at least one major symptom (cough, fever, dyspnea, or headache) and one minor symptom (myalgia, arthralgia, odynophagia, chills, chest pain, rhinorrhea, anosmia, dysgeusia, conjunctivitis) (Comité Nacional para la Vigilancia Epidemiológica (CONAVE), 2020). The registry is based on the national hospital and sentinel surveillance systems, detailed elsewhere (Secretaría de Salud, 2020a). Briefly, all patients with a diagnosis of a severe acute respiratory infection are hospitalized and submitted to testing using reverse transcription polymerase chain reaction (PCR). For ambulatory patients, only a varying random sample of a minimum of 10% is tested by PCR analysis. PCR results and deaths are updated with varying time delays. Data available includes all clinical and epidemiological information obtained at the time of registry.
2.1. Data processing
For this analysis, we included individuals with a positive test for COVID-19 registered in the surveillance system during the community transmission phase of the pandemic (started March 23rd, with last update December 7th, 2020), with a sample size of 1,121,541subjects. We used December as the cut-off date to consider a period before vaccination in Mexico, which began on December 24th (Secretaría de Salud, 2020b), since vaccination is expected to change hospitalization and death risks. Subjects with missing values in obesity, hypertension, diabetes, COPD, cardiovascular disease, and CKD were excluded (n = 4619). We excluded subjects under 20 years (n = 47,831) because multimorbidity in that age group is rare. Still, we performed a sensitivity analysis in adolescents 12 to 19 years (Table A.7 in the appendix). We excluded patients registered fifteen days before the cut-off date (n = 48,852) to avoid death censoring. Finally, we excluded subjects that reported implausible delay times in seeking medical attention (n = 13,698): reported 0 days from symptom onset to healthcare admission but were admitted with a serious condition (death, pneumonia, or intensive care unit). The final sample presented 1,006,541 adults who tested positive for COVID-19 from March 23rd to November 24th, 2020. Supplementary Fig. A1 in the appendix shows a flowchart summarizing the exclusions considered.
2.2. Main outcomes
Two outcomes were defined: 1) hospitalization, refers to a COVID-19 case that required inpatient care; 2) death/fatality, defined as the death of a person who tested positive to COVID-19, as recorded in the database. Note that the “death” outcome is related to the case fatality rate since it is defined among diagnosed cases.
2.3. Dependent variable
Six diseases associated with poor nutrition or smoking were considered: obesity, COPD, hypertension, diabetes, cardiovascular disease, and CKD. Information was self-reported, obtained by the medical unit's epidemiologist when the person first sought medical attention. An individual could have more than one disease, which could lead to double-counting of preventable cases if fractions of each disease are simply added (Rowe et al., 2004). To estimate the overall burden of chronic diseases, we defined multimorbidity as the number of chronic diseases in four independent categories: no diseases, one disease, two diseases, or three or more diseases.
2.3.1. Quantitative bias analysis
Since chronic disease information was self-reported, we conducted a quantitative bias analysis for diabetes and hypertension to consider undiagnosed cases. We limited the analysis to these two diseases because, except for obesity, are the most prevalent chronic diseases in Mexico, and where data was available for bias quantification. We had data to adjust obesity prevalence, but as obesity is reversible, the adjustment would not be appropriate. First, we estimated the proportion of undiagnosed cases by age group for diabetes and hypertension by comparing the 2016 National Health and Nutrition Survey (ENSANUT-2016) self-reported data against a gold standard (HbA1c and fasting blood glucose for diabetes, and systolic and diastolic blood pressure for hypertension) (Romero-Martínez et al., 2017). The question used to assess self-reported diagnosis of diabetes or hypertension in ENSANUT-2016 was similar to the question used in the COVID-19 case-assessment format: “Has a doctor ever diagnosed you with [name of chronic disease]?”. Sensibilities from ENSANUT-2016 are summarized in Table A.1 in the appendix. We assumed a specificity of 100% for all diseases, because the effect of treatment could affect HbA1c or BP; thus, no means to validate a positive answer exist.
The adjusted prevalence of diabetes/hypertension by age groups was estimated with Rogan and Gladen's formula (Rogan and Gladen, 1978) (see the appendix for more details). Table A.2 in the appendix presents the prevalence of diabetes and hypertension before and after applying the adjustment formula. We used a sample balancing method “raking” to replicate the adjusted prevalence of diabetes and hypertension. Raking is a statistical method that adjusts a set of data so that its marginal (not adjusted) totals match control (adjusted) totals (Battaglia et al., 2009), which is a simpler way to estimate risk ratios and attributable fractions compared to prior methods of misclassification analysis (Lash et al., 2009). Raking was performed using the “survey” package on R Statistical Software (Lumley, 2004; Lumley, 2019; R Core Team. R: A, 2019) after eliminating missing data for diabetes, obesity and hypertension, and subjects under 20 years but before any other exclusions.
2.4. Covariates
Covariates included age (years), sex (male/female), state of residence (Mexico City as reference), cases recorded by type of epidemiological surveillance system (sentinel/no sentinel, given the differences in COVID-19 testing procedures), health system and delay in seeking medical attention. The health system was divided into five categories: 1) Mexican Institute of Social Security (IMSS)which provides care for formal workers, 2) Institute of Security and Social Services for State Workers (ISSSTE) that cares for State-affiliated employees, 3) private healthcare, 4) Health Secretary (SSA) and IMSS bienestar that provide care for the uninsured population, and 5) Other health systems such as the Red Cross, National System for the Integral Development of the Family, Mexican Petroleum's Health Services, National Defense Secretary, Marine Secretary, and University-based systems; under this label, we also included individuals with missing data (n = 10). Finally, we included delay in seeking medical attention (days) to capture the delay in receiving medical attention since the beginning of symptoms.
2.5. Statistical analysis
2.5.1. Risk estimation
We estimated the risk of hospitalization and death among patients positive to COVID-19 using Poisson regression models with robust standard errors. We adjusted each model for the main confounders: age, sex, state of residence (Mexico City as reference), type of surveillance system (sentinel/hospital), health system and delay in seeking medical attention. Survey weights were considered in Stata 14.0 to adjust for misclassification bias due to undiagnosed cases of diabetes and hypertension (College Station, TX) (StataCorp, 2015).
2.5.2. Estimation of the population attributable fraction
We assigned the estimated risks of death/hospitalization to the individuals in the sample, according to the number of diseases they had. Then, we estimated the proportion of hospitalizations and deaths potentially attributable to chronic diseases as follows (Taguri et al., 2012; Zepeda-Tello and Camacho-Garcia, 2017):
| (3) |
where w i and RR i denote the sampling weight and the relative risk of death/hospitalization of the i-th individual in the sample. PAFs compared the observed risks scenario to a counterfactual scenario where all individuals in the sample had zero diseases (relative risk = 1.0).
2.6. Sensitivity analyses
Four sensitivity analyses were performed. The first one aimed to assess the impact of misclassification bias by comparing our main scenario to a scenario where diabetes and hypertension were not adjusted for lack of diagnosis as informed by the National Health and Nutrition Survey. The second aimed to assess the impact of varying the number of diseases included in the multimorbidity variable: 1) three diseases: obesity, hypertension and diabetes; 2) nine diseases: obesity, COPD, hypertension, diabetes, cardiovascular disease, CKD, asthma, immunodeficiency, and other comorbidities. The third aimed to estimate the individual burden of each of the six diseases considered in the main analysis, and the fourth to estimate the burden of the six chronic diseases stratifying by inpatients and outpatients.
3. Results
Demographic and health-related characteristics of the population are presented in Table A.3 in the appendix. Obesity, hypertension, and diabetes were the most prevalent chronic diseases in all age groups. Individuals with no chronic diseases decreased from 76.2% among 20–39 years, to 46.5% among 40–59 and to 18% among 60 or older. In contrast, individuals with three or more diseases increased with age: from 1.3% among 20–39 years to 17.8% among 60 years and older.
Table 1 presents the risk of hospitalization and death among individuals by multimorbidity category and age group. Adults under 40 years with three or more diseases presented 5.1 times the risk of hospitalization (95% CI: 4.8–5.4) and 15.2 times the risk of death (95% CI: 13.5–17.2) experienced by disease-free individuals of the same age group. Adults aged 40–59 with three or more diseases compared to individuals from the same age group with no diseases presented 2.3 times the risk of hospitalization (95% CI: 2.3–2.4), and 3.7 times the risk of death (95% CI: 3.6–3.8). Adults aged 60 or older with three or more diseases presented 1.36 times the hospitalization risk (95% CI: 1.3–1.4), and 1.5 times the risk of death (95% CI: 1.47–1.54) of disease-free individuals from the same age group.
Table 1.
Risks of hospitalization and death among individuals with chronic diseases by age group.
| 20–39 years |
40–59 years |
≥60 years |
Total adults |
|
|---|---|---|---|---|
| IRRa (95% CI) | IRR (95% CI) | IRR (95% CI) | IRR (95% CI) | |
| Hospitalization | ||||
| No disease | REF | REF | REF | REF |
| 1 disease | 1.97 (1.92, 2.03) | 1.47 (1.45, 1.49) | 1.12 (1.11, 1.13) | 1.59 (1.57, 1.60) |
| 2 diseases | 3.43 (3.30, 3.57) | 1.90 (1.87, 1.93) | 1.24 (1.23, 1.26) | 1.95 (1.93, 1.97) |
| 3 o more diseases | 5.12 (4.82, 5.43) | 2.34 (2.3, 2.39) | 1.36 (1.34, 1.37) | 2.26 (2.23, 2.29) |
| Death | ||||
| No disease | REF | REF | REF | REF |
| 1 disease | 3.63 (3.39, 3.88) | 1.73 (1.68, 1.78) | 1.14 (1.12, 1.16) | 1.82 (1.79, 1.85) |
| 2 diseases | 8.39 (7.68, 9.16) | 2.51 (2.44, 2.59) | 1.29 (1.27, 1.32) | 2.37 (2.32, 2.41) |
| 3 o more diseases | 15.23 (13.53, 17.15) | 3.71 (3.58, 3.84) | 1.51 (1.47, 1.54) | 3.03 (2.96, 3.09) |
IRR. Incidence Risk Ratio. IRRs were adjusted for age, sex, state of residence (Mexico City as reference), type of surveillance system (sentinel/hospital), health system (IMSS/ ISSSTE/ private, SSA and IMSS welfare, other health system) and delay in seeking medical attention. Diseases included: obesity, chronic obstructive pulmonary disease, hypertension, diabetes, cardiovascular disease, and chronic kidney disease.
Fig. 1 shows the fraction of hospitalizations and deaths from COVID-19 potentially attributable to chronic diseases. Hospitalizations and deaths attributable to chronic diseases were higher in younger than older adults. In adults under 40 years, 25.4% of hospitalizations (95% CI: 24.8%–26.1%), and 50.1% of deaths (95% CI: 48.6%–51.5%) could have been avoided by preventing the six diseases associated with poor nutrition and smoking. In adults aged 40–59, chronic diseases contributed to 28.3% of hospitalizations (95% CI: 27.8%–28.7%) and 40.5% of deaths (95% CI: 39.7%–41.3%), while for adults 60 and older, 15.3% of hospitalizations (95% CI: 14.9%–15.7%) and 18.7% of deaths (95% CI: 18.0%–19.5%) could have been avoided.
Fig. 1.
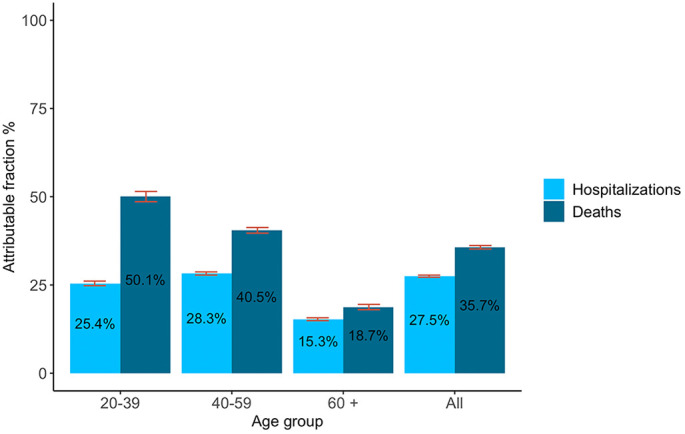
Fraction of hospitalizations and deaths from COVID-19 attributable to chronic diseases associated with poor nutrition and smoking.
Table 2 describes the sensitivity analyses conducted to understand the uncertainty around our estimates. Estimates calculated without adjusting for misclassification bias in diabetes and hypertension were smaller than our main scenario. Across all age groups and considering the six chronic diseases, 27.5% of all hospitalizations and 35.7% of all deaths could have been attributable to chronic diseases; yet, these estimates would have been 18.5% and 23.2% if unadjusted. The impact of misclassification adjustment was stronger for younger age groups. Varying our definition of multimorbidity, we observed that hospitalization and fatalities were largely explained by obesity, hypertension and diabetes: 26.0% of hospitalizations and 33.6% of deaths could have been prevented by preventing these three diseases; in contrast 27.5% and 35.7% could have been averted by preventing all six diseases associated with poor nutrition and tobacco. When considering nine chronic diseases, the PAF slightly increased for hospitalization (all ages: from 27.5% to 28.7%) and deaths (all ages: from 35.7% to 37.3%). Relative risk estimates for each scenario is presented in Table A.4 in the appendix.
Table 2.
Sensitivity analyses: Fraction of hospitalization and deaths attributable to chronic diseases under different scenarios.
| 20–39 years |
40–59 years |
≥60 years |
All ages |
|
|---|---|---|---|---|
| PAF % (95% CI) | PAF % (95% CI) | PAF % (95% CI) | PAF % (95% CI) | |
| Hospitalization | ||||
| Main scenario: | ||||
| Six chronic diseasesa (adjusted⁎) | ||||
| 25.4 (24.8, 26.1) | 28.3 (27.8, 28.7%) | 15.3 (14.9,15.7) | 27.5 (27.2, 27.8) | |
| Sensitivity analyses: | ||||
| Six chronic diseasesa | ||||
| 19.2 (18.6, 19.8) | 22.2 (21.8, 22.6) | 12.8 (12.2, 13.3) | 18.5 (18.3, 18.6) | |
| Three chronic diseasesb (adjusted⁎) | ||||
| 24.3 (23.6, 25.0) | 27.4 (27.0, 27.8) | 14.2 (13.5, 15.0) | 26.0 (25.7, 26.4) | |
| Nine chronic diseasesc (adjusted⁎) | ||||
| 27.1 (26.5, 27.8) | 29.2 (28.8, 29.6) | 16.0 (15.4, 16.7) | 28.7 (28.3, 29.0) | |
| Deaths | ||||
| Main scenario: | ||||
| Six chronic diseasesa (adjusted⁎) | ||||
| 50.1 (48.6, 51.5) | 40.5 (39.7, 41.3) | 18.7 (18.0, 19.5) | 35.7 (35.2, 36.2) | |
| Sensitivity analyses: | ||||
| Six chronic diseasesa | ||||
| 40.3 (38.8, 41.9) | 32.6 (31.9, 33.3) | 15.3 (14.6, 15.9) | 23.2 (22.9, 23.6) | |
| Three chronic diseasesb (adjusted⁎) | ||||
| 47.5 (45.9, 49.0) | 39.2 (38.4,39.9) | 18.0 (17.2, 18.0) | 33.6 (33.2, 34.1) | |
| Nine chronic diseasesc (adjusted⁎) | ||||
| 53.4 (52.0, 54.8) | 41.9 (41.1, 42.6) | 19.6 (18.7, 20.4) | 37.3 (36.8, 37.8) | |
All risks were adjusted for age, sex, state of residence (Mexico City as reference), type of surveillance system (sentinel/hospital), health system (IMSS/ ISSSTE/ private, SSA and IMSS welfare, other health system) and delay in seeking medical attention. Diseases included:
Obesity, hypertension, diabetes, cardiovascular disease, CKD and COPD.
Obesity, hypertension, diabetes.
Obesity, hypertension, diabetes, cardiovascular disease, CKD, COPD, asthma, immunodeficiency and other comorbidities.
Adjusted for misclassification bias in diabetes and hypertension.
4. Discussion
We aimed to estimate the proportion of hospitalizations and deaths from COVID-19 potentially attributable to chronic diseases. The six chronic diseases analyzed contributed to 28% of hospitalizations and 36% of deaths from COVID-19 among Mexican adults. The burden of chronic diseases on COVID-19 was higher in younger than older adults: 25% of hospitalizations and 50% of deaths could have been averted by preventing chronic diseases among adults aged 20–39 versus 15% of hospitalizations and 19% of deaths among adults 60 years or older.
Several studies in Mexico have estimated higher odds of COVID-19 severity or death in COVID-19 patients with chronic diseases (Denova-Gutiérrez et al., 2020; Hernández-Galdamez et al., 2020). A study in Mexico used a multimorbidity perspective to estimate the COVID-19 fatality (Monterrubio-Flores et al., 2021). In line with our study, authors found a higher fatality risk associated with chronic diseases at younger ages. Adults aged 20–39 years with three chronic diseases presented a 16.1 (95% CI: 13.8, 18.7) times higher fatality risk, adults aged 40–59 years presented 4.2 (95% CI: 4.0, 4.4), and adults aged 60–70 presented 1.6 (95% CI:1.6 1.7), compared to disease-free individuals of the same age group. Their results were consistent with ours: 15.2 (95% CI: 13.5, 17.15), 3.7 (95% CI: 3.6, 3.8) and 1.5 (95% CI: 1.5, 1.5) for adults aged 20–39, 40–59 and ≥ 60, respectively. Another study in Mexico estimated that obesity mediates half of the diabetes effect in the risk of dying from COVID-19 (Bello-Chavolla et al., 2020). This study shows that diseases are not independent and highlights the need of using strategies to evaluate synergies between chronic diseases.
In Mexico, one study estimated the PAF of chronic diseases on COVID-19 fatality using data from IMSS by November 2020 (Peña et al., 2020). They estimated that 2% of deaths from COVID-19 were attributable to diabetes, 7% to hypertension, and 8% to obesity among inpatients. This proportion changed to 1.1%, 14.3% and 16.8%, respectively, among outpatients. In a supplementary analysis, we estimated PAFs for each chronic disease without stratifying by inpatient/outpatient, obtaining higher estimates in comparison to that study: 12.8% of deaths were attributable to diabetes, 16.3% to hypertension, and 12.8% to obesity (Table A.5 in the appendix). Differences could be due to studying a longer period, adjusting for misclassification bias and including patients from all health systems, not only from IMSS. The small attributable fractions for CKD, cardiovascular and COPD could be explained by their small prevalence among positive cases. In another supplementary analysis, we estimated attributable fractions of chronic diseases among inpatients and outpatients (Table A.6 in the appendix). We found a higher proportion of deaths attributable to chronic diseases among outpatient (35.3%; 95% CI: 33.9–36.7) than inpatients (19.8%; 95% CI: 19.0–20.6). Differences could be explained by an overrepresentation of individuals with chronic diseases among inpatients compared to outpatients: people with chronic diseases are more likely to be hospitalized, even with mild symptoms, leading to an underestimation of the risk (Griffith et al., 2020). Despite important differences in methods, both studies concur in the potential impact that chronic diseases have on COVID-19 fatality.
The proportion of severe COVID-19 attributable to multimorbidity was studied in the UK, where 51% of severe COVID-19 cases were attributed to unhealthy behaviors (13% to smoking, 9% to physical inactivity, and 30% to overweight and obesity) (Hamer et al., 2020). In the US, this fraction was estimated in 36% (14% to smoking, 12% to physical activity, and 16% to diet) (Adams et al., 2020). In another US study, 63% of hospitalizations were attributable to the joint effects of diabetes, obesity, hypertension and heart failure. In our study, 27.5% of COVID-19 hospitalizations were attributable to six chronic diseases associated with smoking and poor nutrition. We considered different diseases and employed a multimorbidity approach to combine diseases and avoid double counting, which is likely the reason why our estimate is smaller.
Latin America has been heavily affected by COVID-19 fatality in young adults. Developing countries show a different pattern of fatality rate in comparison with developed countries, where COVID-19 deaths among young adults are rare (Chauvin et al., 2020). We found that up to 50% of COVID-19 fatalities were attributable to chronic diseases in younger adults, compared to 18.7% in adults 60 years of age and older. A recent study showed that the differential burden of deaths in young adults between developed and developing countries could be attributable to a lower recovery rate once infected, driven by chronic diseases and poorer healthcare access (Chauvin et al., 2020). We did not explore healthcare access in our analysis, and that could certainly contribute to a higher fatality rate. Future studies should explore other causes linked to increased fatality rates, such as quality of care.
The data used in our analysis was produced in the context of the epidemiological surveillance system of respiratory diseases in Mexico and, as we have shown, it is subject to several sources of bias that could affect the estimation of risk ratios and, consequently, the PAF. Data on chronic diseases is self-reported and a large proportion of the population in Mexico with chronic diseases has not yet been diagnosed. We used a bias quantification approach to adjust our estimates, producing an increase in the PAF from 18.5% to 27.5% for hospitalization and from 23.3% to 35.7% in deaths (Table 2). Unfortunately, we did not have information to adjust the misclassification for all diseases considered in our analysis. Thus, we are still likely underestimating the PAF (Hernández-Garduño, 2020), particularly given the large impact of obesity on COVID-19 that has been reported in the literature. We did not have information about chronic disease control, which could further increase fatality (Sardu et al., 2020; Holman et al., 2020). Our study could also be subject to selection bias. Our sample is composed mainly by subjects with severe COVID-19, since all severe cases of respiratory disease are subject to the COVID-19 test, while only a subsample of mild cases is tested. Then, the global association captures both the causal factors of COVID-19 and the imbalance in access to testing, among other biases; unfortunately, we did not have access to an estimate of the total number of mild respiratory disease, which could have allowed us to produce a better estimate. Also, we do not know the mortality coverage of the surveillance system. The death registry in Mexico has important delays, and a significant proportion of deaths have not been reported in the official COVID-19 registry, as evidenced by excess mortality estimates (Grupo interinstitucional para la estimación del exceso de mortalidad por todas las causas, 2020). It is difficult to predict the direction of this bias, as it will depend on whether the differential registry is informed by chronic diseases. While we tried to quantify the most salient biases in our analyses, future studies with better designs will be needed to avoid the pitfalls of registry data and improve our understanding of the link between chronic diseases and COVID-19 severity and mortality.
5. Conclusion
A sizable proportion of the hospitalizations and deaths from COVID-19 were associated with diseases caused by poor nutrition and tobacco use in Mexico, particularly among young adults. Mexico has been dealing with the double challenge of high demand for hospital services due to COVID-19 and treating chronic diseases. Individual efforts to control and reduce chronic diseases are direly needed in the short term. In the longer term, implementing structural interventions such as taxes on tobacco, sugary beverages, and high-energy foods of low nutritional value, warning labels, advertisement bans to non-nutritional food and beverages and smoke-free spaces could be critical to reduce the burden of chronic diseases and COVID-19.
Declaration of Competing Interest
The authors declare that they have no known competing financial interests or personal relationships that could have appeared to influence the work reported in this paper.
Acknowledgments
This work was supported by Bloomberg Philanthropies (https://www.bloomberg.org/; JRD received the grant). The funders had no role in study design, data collection and analysis, decision to publish, or preparation of the manuscript. Ethics approval was not required since the work used only publicly available data.
Footnotes
Supplementary data to this article can be found online at https://doi.org/10.1016/j.ypmed.2021.106917.
Appendix A. Supplementary data
Supplementary material
References
- Adams M., Katz D., Grandpre J., Shenson D. Reducing COVID-19 hospitalization risk through behavior change. medRxiv 2020.07.21.20159350; 2020 doi: 10.1101/2020.07.21.20159350. [DOI] [Google Scholar]
- Battaglia M.P., Hoaglin D.C., Frankel M.R. Practical considerations in raking survey data. Survey. Practice. 2009;2(5) [Google Scholar]
- Bello-Chavolla O.Y., Bahena-López J.P., Antonio-Villa N.E., Vargas-Vázquez A., González-Díaz A., Márquez-Salinas A., et al. Predicting mortality due to SARS-CoV-2: a mechanistic score relating obesity and diabetes to COVID-19 outcomes in Mexico. J. Clin. Endocrinol. Metab. 2020;105(8):2752–2761. doi: 10.1210/clinem/dgaa346. [DOI] [PMC free article] [PubMed] [Google Scholar]
- Campos-Nonato I., Hernández-Barrera L., Pedroza-Tobías A., Medina C., Barquera S. Hipertensión arterial en adultos mexicanos: prevalencia, diagnóstico y tipo de tratamiento. Ensanut MC. 2016;60:233–243. doi: 10.21149/8813. 3, (Salud Pública de México. 2018 May 4;60(3, may-jun) [DOI] [PubMed] [Google Scholar]
- Chauvin J.P., Fowler A., Herrera L.N. 2020 Nov. The Younger Age Profile of COVID-19 Deaths in Developing Countries. Washington, D.C. [Google Scholar]
- Comité Nacional para la Vigilancia Epidemiológica (CONAVE) Actualización de la Definición Operacional de Caso Sospechoso de Enfermedad Respiratoria Viral [Internet] 2020. https://www.gob.mx/cms/uploads/attachment/file/573732/Comunicado_Oficial_DOC_sospechoso_ERV_240820.pdf Available from:
- [dataset] Secretaría de Salud Datos Abiertos. Dirección General de Epidemiología [Internet]. 2020 http://www.gob.mx/salud/documentos/datos-abiertos-152127 Available from: [Google Scholar]
- Denova-Gutiérrez E., Lopez-Gatell H., Alomia-Zegarra J.L., López-Ridaura R., Zaragoza-Jimenez C.A., Dyer-Leal D.D., et al. The Association of Obesity, type 2 diabetes, and hypertension with severe coronavirus disease 2019 on admission among Mexican patients. Obesity. 2020;28(10) doi: 10.1002/oby.22946. [DOI] [PMC free article] [PubMed] [Google Scholar]
- Griffith G., Morris T.T., Tudball M., Herbert A., Mancano G., Pike L., et al. Collider bias undermines our understanding of COVID-19 disease risk and severity. medRxiv. 2020;11(1) doi: 10.1038/s41467-020-19478-2. 2020.05.04.20090506. [DOI] [PMC free article] [PubMed] [Google Scholar]
- Grupo interinstitucional para la estimación del exceso de mortalidad por todas las causas . Vol. 2. 2020. Boletín estadístico del exceso de mortalidad por todas las causas.https://coronavirus.gob.mx/wp-content/uploads/2020/09/Boleti%CC%81n_II_Exceso_Mortalidad_MX_24Sep2020.pdf Available from: [Google Scholar]
- Hamer M., Kivimäki M., Gale C.R., Batty G.D. Lifestyle Risk Factors for Cardiovascular Disease in Relation to COVID-19 Hospitalization: A Community-Based Cohort Study of 387,109 Adults in UK. medRxiv [Internet] 2020. http://medrxiv.org/content/early/2020/05/13/2020.05.09.20096438.abstract Jan 1;2020.05.09.20096438. Available from: [DOI] [PMC free article] [PubMed]
- Hernández-Galdamez D.R., González-Block M.Á., Romo-Dueñas D.K., Lima-Morales R., Hernández-Vicente I.A., Lumbreras-Guzmán M., et al. Increased risk of hospitalization and death in patients with COVID-19 and pre-existing noncommunicable diseases and modifiable risk factors in Mexico. Arch. Med. Res. 2020;51(7) doi: 10.1016/j.arcmed.2020.07.003. [DOI] [PMC free article] [PubMed] [Google Scholar]
- Hernández-Garduño E. Obesity is the comorbidity more strongly associated for Covid-19 in Mexico. A case-control study. Obes. Res. Clin. Pract. 2020;14(4) doi: 10.1016/j.orcp.2020.06.001. [DOI] [PMC free article] [PubMed] [Google Scholar]
- Holman N., Knighton P., Kar P., O’Keefe J., Curley M., Weaver A., et al. Risk factors for COVID-19-related mortality in people with type 1 and type 2 diabetes in England: a population-based cohort study. Lancet Diabetes Endocrinol. 2020;(10) doi: 10.1016/S2213-8587(20)30271-0. [DOI] [PMC free article] [PubMed] [Google Scholar]
- Instituto Nacional de Enfermedades Respiratorias Clínica de EPOC [Internet] 2017. http://www.iner.salud.gob.mx/interna/tabaquismo-clinEPOC.html Available from:
- Ioannidis J.P.A. Infection fatality rate of COVID-19 inferred from seroprevalence data. Bull. World Health Organ. 2021;90:19–33F. doi: 10.2471/BLT.20.265892. 1, (Jan 1;99(1) [DOI] [PMC free article] [PubMed] [Google Scholar]
- Lai A., Pasea L., Banerjee A., Denaxas S., Katsoulis M., Chang W.H., et al. Estimating excess mortality in people with cancer and multimorbidity in the COVID-19 emergency. medRxiv. 2020 doi: 10.1101/2020.05.27.20083287. [DOI] [Google Scholar]
- Lash T.L., Fox M.P., Fink A.K. Springer; New York, NY: 2009. Applying Quantitative Bias Analysis to Epidemiologic Data. [Google Scholar]
- Lumley T. Analysis of complex survey samples. J. Stat. Softw. 2004;9(1):1–19. [Google Scholar]
- Lumley T. 2019. Survey: analysis of complex survey samples. R package version 3.35–1. [Google Scholar]
- Monterrubio-Flores E., Ramírez-Villalobos M.D., Espinosa-Montero J., Hernandez B., Barquera S., Villalobos-Daniel V.E., et al. Characterizing a two-pronged epidemic in Mexico of non-communicable diseases and SARS-Cov-2: factors associated with increased case-fatality rates. Int. J. Epidemiol. 2021;50(2):430–445. doi: 10.1093/ije/dyab008. [DOI] [PMC free article] [PubMed] [Google Scholar]
- Mudatsir M., Fajar J.K., Wulandari L., Soegiarto G., Ilmawan M., Purnamasari Y., et al. Predictors of COVID-19 severity: a systematic review and meta-analysis. F1000Research. 2020;9:9. doi: 10.12688/f1000research.26186.1. [DOI] [PMC free article] [PubMed] [Google Scholar]
- Noor F.M., Islam MdM. Prevalence and associated risk factors of mortality among COVID-19 patients: a Meta-analysis. J. Community Health. 2020;45(6):1270–1282. doi: 10.1007/s10900-020-00920-x. [DOI] [PMC free article] [PubMed] [Google Scholar]
- Peña J.E., Rascón-Pacheco R.A., Ascencio-Montiel I.J., González-Figueroa E., Fernández-Gárate J.E., Medina-Gómez O.S., et al. Hypertension, diabetes and obesity, major risk factors for death in patients with COVID-19 in Mexico. Arch. Med. Res. 2020;52(4):443–449. doi: 10.1016/j.arcmed.2020.12.002. Epub 2020 Dec 16. [DOI] [PMC free article] [PubMed] [Google Scholar]
- R Core Team. R: A Language and Environment for Statistical Computing [Internet]. R Foundation for Statistical Computing. Vienna, Austria. 2019. https://www.R-project.org/ Available from:
- Rogan W.J., Gladen B. Estimating prevalence from the results of a screening test. Am. J. Epidemiol. 1978;107(1) doi: 10.1093/oxfordjournals.aje.a112510. [DOI] [PubMed] [Google Scholar]
- Romero-Martínez M., Shamah-Levy T., Cuevas-Nasu L., Méndez Gómez-Humarán I., Gaona-Pineda E.B., Gómez-Acosta L.M., et al. Vol. 59. 2017. Diseño metodológico de la Encuesta Nacional de Salud y Nutrición de Medio Camino 2016. Salud Pública de México. (3, may-jun) [DOI] [PubMed] [Google Scholar]
- Rowe A.K., Powell K.E., Flanders W.D. Why population attributable fractions can sum to more than one. Am. J. Prev. Med. 2004;26(3) doi: 10.1016/j.amepre.2003.12.007. [DOI] [PubMed] [Google Scholar]
- Sardu C., D’Onofrio N., Balestrieri M.L., Barbieri M., Rizzo M.R., Messina V., et al. Outcomes in patients with hyperglycemia affected by COVID-19: can we do more on glycemic control? Diabetes Care. 2020;43(7) doi: 10.2337/dc20-0723. [DOI] [PMC free article] [PubMed] [Google Scholar]
- Secretaría de Salud Instituto Nacional de Salud Pública, Instituto Nacional de Estadística y Geografía. Encuesta Nacional de Salud y Nutrición 2018: presentación de resultados. [Internet] 2018. https://ensanut.insp.mx/encuestas/ensanut2018/doctos/informes/ensanut_2018_presentacion_resultados.pdf Available from:
- Secretaría de Salud . 2020. Dirección General de Epidemiología: Lineamiento estandarizado para la vigilancia epidemiológica y por laboratorio de la enfermedad respiratoria viral. [Google Scholar]
- Secretaría de Salud Calendario de vacunación [Internet] 2020. http://vacunacovid.gob.mx/wordpress/calendario-vacunacion/#:~:text=El%2024%20de%20diciembre%20inici%C3%B3,de%20la%20Ciudad%20de%20M%C3%A9xico Available from:
- StataCorp Stata Statistical Software: Release 14. College Station, TX: StataCorp LP. 2015 [Google Scholar]
- Taguri M., Matsuyama Y., Ohashi Y., Harada A., Ueshima H. Doubly robust estimation of the generalized impact fraction. Biostatistics. 2012 Jul;1:13(3). doi: 10.1093/biostatistics/kxr038. [DOI] [PubMed] [Google Scholar]
- Tamayo y Orozco JA, Lastiri Quirós HSantiago. La enfermedad renal crónica en México. Hacia una política nacional para enfrentarla. [Internet]. México: Academia Nacional de Medicina de México. 2016. Available from: https://www.anmm.org.mx/publicaciones/ultimas_publicaciones/ENF-RENAL.pdf.
- World Heart Federation Enfermedades Cardiovasculares en México [Internet] https://www.world-heart-federation.org/wp-content/uploads/2017/05/Cardiovascular_diseases_in_Mexico__Spanish_.pdf Available from.
- Zapata-Diomedi B., Barendregt J.J., Veerman J.L. Population attributable fraction: names, types and issues with incorrect interpretation of relative risks. Br. J. Sports Med. 2018;52(4) doi: 10.1136/bjsports-2015-095531. [DOI] [PubMed] [Google Scholar]
- Zepeda-Tello R., Camacho-Garcia Formenti D. Potential Impact Fraction and Population Attributable Fraction for Cross-Sectional Data [Internet]. Mexico City: R Package. 2017. https://cran.r-project.org/web/packages/pifpaf/index.html Available from:
Associated Data
This section collects any data citations, data availability statements, or supplementary materials included in this article.
Supplementary Materials
Supplementary material