

Abstract
The genetic make-up of an individual contributes to the susceptibility and response to viral infection. Although environmental, clinical and social factors have a role in the chance of exposure to SARS-CoV-2 and the severity of COVID-191,2, host genetics may also be important. Identifying host-specific genetic factors may reveal biological mechanisms of therapeutic relevance and clarify causal relationships of modifiable environmental risk factors for SARS-CoV-2 infection and outcomes. We formed a global network of researchers to investigate the role of human genetics in SARS-CoV-2 infection and COVID-19 severity. Here we describe the results of three genome-wide association meta-analyses that consist of up to 49,562 patients with COVID-19 from 46 studies across 19 countries. We report 13 genome-wide significant loci that are associated with SARS-CoV-2 infection or severe manifestations of COVID-19. Several of these loci correspond to previously documented associations to lung or autoimmune and inflammatory diseases3–7. They also represent potentially actionable mechanisms in response to infection. Mendelian randomization analyses support a causal role for smoking and body-mass index for severe COVID-19 although not for type II diabetes. The identification of novel host genetic factors associated with COVID-19 was made possible by the community of human genetics researchers coming together to prioritize the sharing of data, results, resources and analytical frameworks. This working model of international collaboration underscores what is possible for future genetic discoveries in emerging pandemics, or indeed for any complex human disease.
Subject terms: Genetics, Genome-wide association studies, SARS-CoV-2, Viral infection
A global network of researchers was formed to investigate the role of human genetics in SARS-CoV-2 infection and COVID-19 severity; this paper reports 13 genome-wide significant loci and potentially actionable mechanisms in response to infection.
Main
The COVID-19 pandemic, caused by infection with SARS-CoV-2, has resulted in an enormous health and economic burden worldwide. One of the most remarkable features of SARS-CoV-2 infection is the variation in consequences, which range from asymptomatic to life-threatening, viral pneumonia and acute respiratory distress syndrome8. Although established host factors correlate with disease severity (for example, increasing age, being a man and higher body-mass index1), these risk factors alone do not explain all of the variability in disease severity observed across individuals.
Genetic factors contributing to COVID-19 susceptibility and severity may provide new biological insights into disease pathogenesis and identify mechanistic targets for therapeutic development or drug repurposing, as treating the disease remains a highly important goal despite the recent development of vaccines. Further supporting this line of inquiry, rare loss-of-function variants in genes involved in the type I interferon response may be involved in severe forms of COVID-199–11. At the same time, several genome-wide association studies that investigate the contribution of common genetic variation12–15 to COVID-19 have provided robust support for the involvement of several genomic loci associated with COVID-19 severity and susceptibility, with the strongest and most robust finding for severity being at the 3p21.31 locus12–16. However, much remains unknown about the genetic basis of susceptibility to SARS-CoV-2 and severity of COVID-19.
The COVID-19 Host Genetics Initiative (COVID-19 HGI) (https://www.covid19hg.org/)17 is an international, open-science collaboration to share scientific methods and resources with research groups across the world with the goal to robustly map the host genetic determinants of SARS-CoV-2 infection and the severity of the resulting COVID-19 disease. Here, we report the latest results of meta-analyses of 46 studies from 19 countries (Fig. 1) for COVID-19 host genetic effects.
Fig. 1. Geographical overview of the contributing studies to the COVID-19 HGI and composition by major ancestry groups.

Populations are defined as African (AFR), admixed American (AMR), East Asian (EAS), European (EUR), Middle Eastern (MID) and South Asian (SAS).
Meta-analyses of COVID-19
Overall, the COVID-19 HGI combined genetic data from 49,562 cases and 2 million controls across 46 distinct studies (Fig. 1). The data included studies from populations of different genetic ancestries, including European, admixed American, African, Middle Eastern, South Asian and East Asian individuals (Supplementary Table 1). An overview of the study design is provided in Extended Data Fig. 1. We performed case–control meta-analyses in three main categories of COVID-19 disease according to predefined and partially overlapping phenotypic criteria. These included (1) critically ill cases of COVID-19 defined as those individuals who required respiratory support in hospital or who died due to the disease; (2) cases of moderate or severe COVID-19 defined as those participants who were hospitalized due to symptoms associated with the infection; and (3) all cases with reported SARS-CoV-2 infection regardless of symptoms (Methods). Controls for all three analyses were selected as genetically ancestry-matched samples without known SARS-CoV-2 infection, if that information was available (Methods). The average age of the participants with COVID-19 across studies was 55 years (Supplementary Table 1). We report quantile–quantile plots in Supplementary Fig. 1 and ancestry principal component plots for contributing studies in Extended Data Fig. 2.
Extended Data Fig. 1. Analytical summary of the COVID-19 HGI meta-analysis.

Using the analytical plan set by the COVID-19 HGI, each individual study runs their analyses and uploads the results to the Initiative, who then runs the meta-analysis. There are three main analyses that each study can contribute summary statistics to: critically ill COVID-19, hospitalized COVID-19 and reported SARS-CoV-2 infection. The phenotypic criteria used to define cases are listed in the dark grey boxes, along with the numbers of cases (N) included in the final all-ancestries meta-analysis. Controls were defined in the same way across all three analyses as everybody that is not a case—for example, population controls (light grey box). Sensitivity analyses—not reported in this extended data figure—also included mild and/or asymptomatic cases of COVID-19 as control individuals. Sample number (N) of control individuals differed between the analyses due to the difference in the number of studies contributing data to these.
Extended Data Fig. 2. Projection of contributing studies samples into the same PC space.

We asked participating studies to perform a PC projection using the 1000 Genomes Project and Human Genome Diversity Project as a reference, with a common set of variants. For each panel (except for the reference), coloured points correspond to contributed samples from each cohort, whereas grey points correspond to the reference samples from the 1000 Genomes Project. Colour represents a genetic population that each cohort specified. As 23andMe, Genomics England 100,000 Genomes Project (GenomicsEngland100kgp), and Million Veterans Program (MVP) only submitted PCA images, we overlaid their submitted transparent images using the same coordinates, instead of directly plotting them. Populations are defined as African (AFR), admixed American (AMR), East Asian (EAS), European (EUR), Middle Eastern (MID) and South Asian (SAS), Oceanian (OCE).
Across our three analyses, we reported a total of 13 independent genome-wide significant loci associated with COVID-19 (the threshold of P < 1.67 × 10⁻⁸ is adjusted for multiple trait testing) (Supplementary Table 2), most of which were shared between two or more COVID-19 phenotypes. Two of these loci are in very close proximity within the 3p21.31 region, which was previously reported as a single locus associated with COVID-19 severity12–16 (Extended Data Fig. 3). Overall, we find six genome-wide significant associations for critical illness due to COVID-19, using data from 6,179 cases and 1,483,780 controls from 16 studies (Extended Data Fig. 4). Nine genome-wide significant loci were detected for moderate to severe hospitalized COVID-19 (including five of the six critical illness loci) from an analysis of 13,641 cases of COVID-19 and 2,070,709 controls across 29 studies (Fig. 2a, top). Finally, seven loci reached genome-wide significance in the analysis using data for all available 49,562 reported cases of SARS-CoV-2 infection and 1,770,206 controls, using data from a total of 44 studies (Fig. 2a, bottom). The proportion of cases with non-European genetic ancestry for each of the three analyses was 23%, 29% and 22%. We report the results for the lead variants at the 13 loci in different ancestry-group meta-analyses in Supplementary Table 3. We note that two loci, tagged by lead variants rs1886814 and rs72711165, had higher allele frequencies in southeast Asian (rs1886814; 15%) and East Asian genetic ancestry (rs72711165; 8%) whereas the minor allele frequencies in European populations were less than 3%. This highlights the value of including data from diverse populations for genetic discovery. We discuss the replication of previous findings and the new discoveries from these three analyses in the Supplementary Note.
Extended Data Fig. 3. Locus-zoom plots of the 3p21.31 region for reported SARS-CoV-2 infection.

a, A standard plot without exclusion. Here, the severity lead variant rs10490770 (chr. 3: 45823240T:C) is shown as a lead variant. b, Additional independent susceptibility signal(s) after excluding variants with r2 > 0.05 with rs10490770. The susceptibility lead variant rs2271616 (chr. 3: 45796521G:T) is highlighted.
Extended Data Fig. 4. Genome-wide meta-analysis association results for critical illness due to COVID-19.

The locus on chromosome 6 is the HLA locus, which was removed from the list of reported loci in Supplementary Table 2 due to the high heterogeneity in effect size estimated between studies included in the analysis. The locus on chromosome 7 was also not reported in Supplementary Table 2 due to missingness across studies—that is, the high number of studies in the meta-analysis that did not report summary statistics for this region. There are two association peaks on chromosome 19.
Fig. 2. Genome-wide association results for COVID-19.

a, Top, results of a genome-wide association study of hospitalized cases of COVID-19 (n = 13,641 cases and n = 2,070,709 controls). Bottom, the results of reported SARS-CoV-2 infections (n = 49,562 cases and n = 1,770,206 controls). Loci highlighted in yellow (top) represent regions associated with the severity of the COVID-19 manifestation—that is, increased odds of more severe COVID-19 phenotypes. Loci highlighted in green (bottom) are regions associated with susceptibility to a SARS-CoV-2 infection—that is, the effect is the same across mild and severe COVID-19 phenotypes. We highlight in red genome-wide significant variants that had high heterogeneity across contributing studies and that were therefore excluded from the list of loci found. b, Results of gene prioritization using different evidence measures of gene annotation. Genes in the LD region, genes with coding variants and eGenes (fine-mapped cis-eQTL variant PIP > 0.1 in GTEx Lung) are annotated if in LD with a COVID-19 lead variant (r2 > 0.6). V2G, highest gene prioritized by the V2G score of Open Target Genetics.
Variant effects on severity and susceptibility
We found no genome-wide significant sex-specific effects at the 13 loci. However, we did identify significant heterogeneous effects (P < 0.004) across studies for 3 out of the 13 loci (Methods), which probably reflects the differential ascertainment of cases (Supplementary Table 2). There was a small number of overlapping samples (n = 8,380 European ancestry; n = 745 East Asian ancestry) between controls from the genOMICC and the UK Biobank studies, but leave-one-out sensitivity analyses did not reveal any bias in the corresponding effect sizes or P values (Extended Data Fig. 5 and Supplementary Information).
Extended Data Fig. 5. Sensitivity analyses for overlapping controls in genomiCC and UK Biobank.

Comparison of the beta effect sizes (top) and unadjusted P values (bottom) of the 13 lead variants, using data from the COVID-19 critical illness meta-analysis in all the cohorts to leaving out genomiCC (cases, n = 4,354; controls, n = 1,474,655; total, n = 1,479,009), leaving out the UK Biobank (UKBB; cases, n = 5,870; controls, n = 1,155,203; total, n = 1,161,073) and leaving out both genomiCC and UK Biobank (cases, n = 4,045; controls, n = 1,146,078; total, n = 1,150,123) (from left to right, respectively). Top, dots and grey bars represent the beta effect size estimates ± standard error from the corresponding GWAS meta-analysis. Bottom, dots represent two-sided P values from the corresponding GWAS meta-analysis. Filled dots indicate variants that showed genome-wide significance in the full meta-analysis of critical illness due to COVID-19, and empty dots represent variants that were not significant for critical illness but were significant for either hospitalization due to COVID-19 or reported SARS-CoV-2 infection. Red dots represent variants that showed genome-wide significance in the leave-one-out analysis for genomiCC, UK Biobank or genomiCC and UK Biobank.
We next wanted to better understand whether the 13 significant loci were acting through mechanisms that increased the susceptibility to infection or that affected the progression of symptoms towards more severe disease. For all 13 loci, we compared the lead variant (strongest association P value) odds ratios (ORs) for the risk-increasing allele across our different COVID-19 phenotype definitions.
Focusing on the two better powered analyses: all cases with a reported SARS-CoV-2 infection and all cases hospitalized due to COVID-19, we find that four of the loci have similar odds ratios between these two analyses (Methods and Supplementary Table 2). Such consistency suggests a stronger link to susceptibility to SARS-CoV-2 infection rather than to the development of severe COVID-19. The strongest susceptibility signal was the previously reported ABO locus (rs912805253)12,13,15,16. Notably, and in agreement with a previously reported study15, we also report a locus within the 3p21.31 region that was more strongly associated with susceptibility to SARS-CoV-2 than progression to more severe COVID-19 phenotypes. rs2271616 showed a stronger association with a reported SARS-CoV-2 infection (P = 1.79 × 10⁻³⁴; OR (95% confidence interval (CI)) = 1.15 (1.13–1.18)) than hospitalization (P = 1.05 × 10⁻⁵; OR (95% CI) = 1.12 (1.06–1.19)). For this locus—which contains additional independent signals—the linkage-disequilibrium (LD) pattern is discordant with the P-value expectation (Extended Data Fig. 6 and Supplementary Note), pointing to a key missing causal variant or to a potentially undiscovered multi-allelic or structural variant in this locus.
Extended Data Fig. 6. Comparison of χ2 statistics and r2 values to the lead variant in the 3p21.31 region.

a–c, Data are shown for critical illness (a), hospitalization (b) and reported SARS-CoV-2 infection (c). The left blue peak in c, which is uncorrelated with the lead variants in the region, indicates that there are independent signals.
By contrast, 9 out of the 13 loci were associated with increased risk of severe symptoms with significantly larger odds ratios for hospitalized COVID-19 compared with the mildest phenotype of reported SARS-CoV-2 infection (eight loci were below the threshold of P < 0.004 (test for effect size difference) and, in addition, the lead variant rs10774671 had a clear increase in odds ratios despite not passing this threshold) (Supplementary Table 2). We further compared the odds ratios for these nine loci for critical illness due to COVID-19 versus hospitalized due to COVID-19, and found that these loci exhibited a general increase in effect risk for critical illness (Methods, Extended Data Fig. 7a and Supplementary Table 4), but the lower power for association analysis of critically ill COVID-19 means that these results should be considered as suggestive. Overall, these results indicated that these nine loci were more likely to be associated with progression of the disease and worse outcome from SARS-CoV-2 infection compared to being associated with susceptibility to SARS-CoV-2 infection.
Extended Data Fig. 7. Comparison of the effect sizes of lead variants between pairs of COVID-19 meta-analyses.

Comparison of effect sizes for the nine variants associated with severity of COVID-19 disease. a, Comparing hospitalized cases of COVID-19 versus population controls (n = 10,428 cases and n = 1,483,270 controls) and critically ill cases of COVID-19 versus population controls (n = 6,179 cases and n = 1,483,780 controls). b, Hospitalized cases of COVID-19 versus population controls (n = 5,806 cases and n = 1,144,263 controls) and hospitalized cases of COVID-19 versus non-hospitalized cases of COVID-19 (n = 5,773 cases and n = 15,497 controls). Sample sizes for hospitalized cases of COVID-19 versus population controls differ between a and b due to differences in the sampling of studies selected for the analysis. This selection included all studies that were able to contribute data to the respective analyses that the data were compared to (shown on the y axis) in each panel. Dots represent the effect size beta estimates, bars represent the 95% confidence interval of the estimates. Effect size estimates and P values for heterogeneity tests (Cochran’s Q, two-tailed test) are reported in Supplementary Table 3.
For some of these analyses, the controls were simply existing population controls without knowledge of SARS-CoV-2 infection or COVID-19 status, which may bias effect size estimates as some of these individuals may have either become infected with SARS-CoV-2 or developed COVID-19. We perform several sensitivity analyses (Extended Data Fig. 7b, Supplementary Note and Supplementary Table 4) in which we show that using population controls can be a valid and powerful strategy for host genetic discovery of infectious disease, and particularly those that are widespread and with rare severe outcomes.
Gene prioritization and association with other traits
To better understand the potential biological mechanism of each locus, we applied several approaches to prioritize candidate causal genes and explore additional associations with other diseases and traits. Of the 13 genome-wide significant loci, we found that nine loci implicated biologically plausible genes (Supplementary Tables 2, 5). Protein-altering variants in LD with lead variants implicated genes at six loci, including TYK2 (chromosome and cytogenetic band (chr.) 19p13.2) and PPP1R15A (chr. 19q13.33). The COVID-19 lead variant rs74956615T>A in TYK2, which confers risk for critical illness (OR (95% CI) = 1.43 (1.29–1.59), P = 9.71 × 10⁻¹²) and hospitalization due to COVID-19 (OR (95% CI) = 1.27 (1.18–1.36), P = 5.05 × 10⁻¹⁰) is correlated with the missense variant rs34536443:G>C (p.Pro1104Ala; r2 = 0.82). This is consistent with the primary immunodeficiency described with complete TYK2 loss of function3 as this variant is known to reduce function18,19. By contrast, this missense variant was previously reported to be protective against autoimmune diseases (Extended Data Fig. 8 and Supplementary Table 6), including rheumatoid arthritis (OR = 0.74, P = 3.0 × 10⁻⁸; UK Biobank SAIGE) and hypothyroidism (OR = 0.84, P = 1.8 × 10⁻¹⁰; UK Biobank). At the 19q13.33 locus, the lead variant rs4801778, which was significantly associated with a reported SARS-CoV-2 infection (OR (95% CI) = 0.95 (0.93–0.96), P = 2.1 × 10⁻⁸), is in LD (r2 = 0.93) with a missense variant rs11541192:G>A (p.Gly312Ser) in PPP1R15A.
Extended Data Fig. 8. PheWAS for genome-wide significant lead variants.
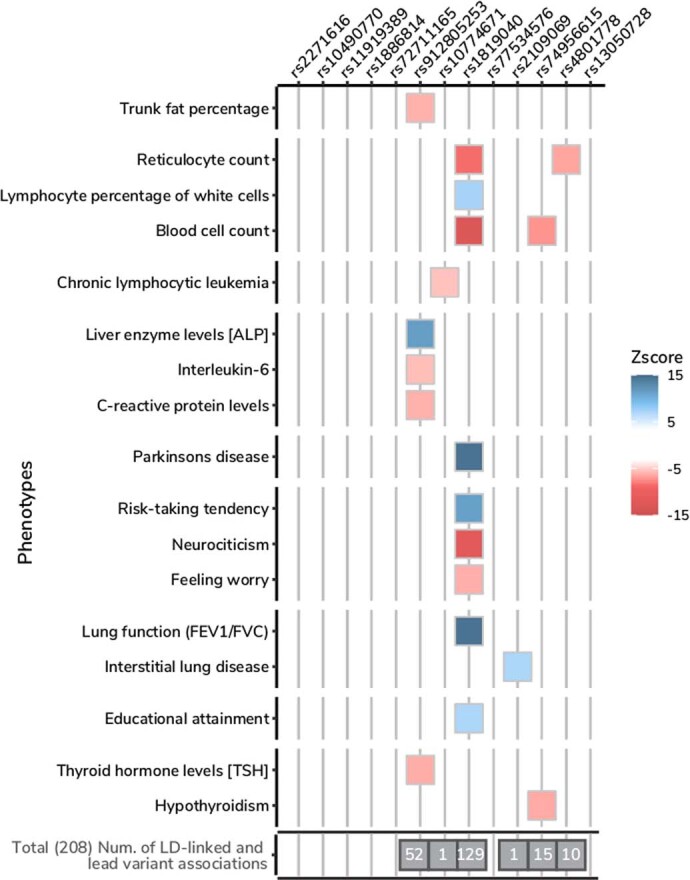
Selected phenotypes associated with genome-wide significant COVID-19 variants (see Supplementary Table 6 for a complete list). We report those associations for which a lead variant from a previous GWAS result was in high LD (r2 > 0.8) with the index COVID-19 variants. The colour represents the z-scores of correlated risk increasing alleles for the trait. The total number of associations for each COVID-19 variant is highlighted in the grey box.
A lung-specific cis-expression quantitative trait loci (cis-eQTLs) from GTEx v.820 (n = 515) and the Lung eQTL Consortium21 (n = 1,103) provided further support for a subset of loci (Supplementary Table 7), including FOXP4 (chr. 6p21.1) and ABO (chr. 9q34.2), OAS1/OAS3/OAS2 (chr. 12q24.13) and IFNAR2/IL10RB (21q22.11), where the COVID-19-associated variants modify gene expression in lung. Furthermore, our phenome-wide association study (PheWAS) analysis (Supplementary Table 6) implicated three additional loci related to lung function, with modest lung eQTL evidence—that is, the lead variant was not fine-mapped but significantly associated. An intronic variant rs2109069:G>A in DPP9 (chr. 19p13.3), which is positively associated with critical illness, was previously reported to be risk-increasing for interstitial lung disease (tag lead variant rs12610495:A>G (p.Leu8Pro); OR = 1.29, P = 2.0 × 10⁻¹²)5. The COVID-19 lead variant rs1886814:A>C in the FOXP4 locus is correlated (r2 = 0.64) with a lead variant of lung adenocarcinoma (tag variant is rs7741164; OR = 1.2, P = 6.0 × 10⁻¹³)6,22 and similarly with a lead variant reported for subclinical interstitial lung disease23. In severe COVID-19, lung cancer and interstitial lung disease, the minor, expression-increasing allele is associated with increased risk. We also found that intronic variants (chr. 1q22) and rs1819040:T>A in KANSL1 (chr. 17q21.31), associated with protection against hospitalization due to COVID-19, were previously reported for reduced lung function (for example, tag lead variant rs141942982:G>T; OR (95% CI) = 0.96 (0.95–0.97), P = 1.00 × 10⁻²⁰)7. Notably, the 17q21.31 locus is a well-known locus for structural variants containing a megabase inversion polymorphism (H1 and inverted H2 forms) and complex copy-number variations, in which the inverted H2 forms were shown to be positively selected in European individuals24,25.
Lastly, there are two loci in the 3p21.31 region with varying genes prioritized by different methods for different independent signals. For the severity lead variant rs10490770:T>C, we prioritized CXCR6 with the Variant2Gene (V2G) algorithm26, although LZTFL1 is the closest gene. The CXCR6 has a role in chemokine signalling27 and LZTFL1 has been implicated in lung cancer28. rs2271616:G>T, which is associated with susceptibility, tags a complex region including several independent signals (Supplementary Note) that are all located within the gene body of SLC6A20, which encodes a protein that is known to functionally interact with the SARS-CoV-2 receptor ACE229. However, none of the lead variants in the 3p21.31 region has been previously associated with other traits or diseases in our PheWAS analysis. Although these results provide supporting in silico evidence for candidate causal gene prioritization, further functional characterization is needed. Detailed locus descriptions and LocusZoom plots are provided in Supplementary Fig. 2.
Polygenic architecture of COVID-19
To further investigate the genetic architecture of COVID-19, we used results from meta-analyses including samples from European ancestries (sample sizes are described in the Methods and Supplementary Table 1) to estimate the heritability explained by common single-nucleotide polymorphisms—that is, the proportion of variation in the two phenotypes that was attributable to common genetic variants—and to determine whether heritability of COVID-19 phenotypes was enriched in genes that were specifically expressed in certain tissues30 from the GTEx dataset31. We detected low, but significant, heritability across all three analyses (<1% on observed scale, all P values were P < 0.0001) (Supplementary Table 8). The values are low compared to previously published studies14, but may be explained by differences in the reported estimate scale (observed versus liability), the specific method used, disease-prevalence estimates, phenotypic differences between patient cohorts or ascertainment of controls. Despite the low reported values, we found that heritability of a reported SARS-CoV-2 infection was significantly enriched in genes that were specifically expressed in the lung (P = 5.0 × 10⁻⁴) (Supplementary Table 9). These findings, together with the genome-wide significant loci identified in the meta-analyses, suggest that there is a significant polygenic architecture that can be better leveraged with future, larger, sample sizes.
Genetic correlation and Mendelian randomization
Genetic correlations (rg) between the three COVID-19 phenotypes was high, although lower correlations were observed between hospitalized COVID-19 and reported SARS-CoV-2 infection (critical illness versus hospitalized: rg (95% CI) = 1.37 (1.08–1.65), P = 2.9 × 10⁻²¹; critical illness versus reported SARS-CoV-2 infection, rg (95% CI) = 0.96 (0.71–1.20), P = 1.1 × 10⁻¹⁴; hospitalized versus reported SARS-CoV-2 infection: rg (95% CI) = 0.85 (0.68–1.02), P = 1.1 × 10⁻²²). To better understand which traits are genetically correlated and/or potentially causally associated with COVID-19 hospitalization, critical illness and reported SARS-CoV-2 infection, we chose a set of 38 disease, health and neuropsychiatric phenotypes as potential COVID-19 risk factors based on their clinical correlation with disease susceptibility, severity or mortality (Supplementary Table 10).
We found evidence (false-discovery rate (FDR) < 0.05) of significant genetic correlations between nine traits and hospitalized COVID-19 and reported SARS-CoV-2 infection (Fig. 3, Extended Data Fig. 9 and Supplementary Table 11). Notably, genetic liability to ischaemic stroke was only significantly positively correlated with critical illness or hospitalization due to COVID-19, but not with a higher likelihood of reported SARS-CoV-2 infection (infection rg = 0.019 versus hospitalization rg = 0.41, z = 2.7, P = 0.006; infection rg = 0.019 versus critical illness rg = 0.40, z = 2.49, P = 0.013).
Fig. 3. Genetic correlations and Mendelian randomization causal estimates between 38 traits and COVID-19 critical illness, hospitalization and reported SARS-CoV-2 infection.

Larger squares correspond to P values with higher significance, with genetic correlations (rg) or Mendelian randomization (MR) causal estimates significantly different from zero. The size of each coloured square indicates the magnitude of the P value, with P < 0.05 shown as a full-sized square, P = 0.05–0.1 as a large square, P = 0.1–0.5 as a medium square and P > 0.5 as a small square. Genetic correlations or causal estimates that are significantly different from zero at an FDR of 5% are marked with an asterisk. Two-sided P values were calculated using LDSC for genetic correlations and inverse-variance-weighted analysis for Mendelian randomization. ADHD, attention-deficit hyperactivity disorder; BMI, body mass index; CRP, C-reactive protein; eGFR, estimated glomerular filtration rate.
Extended Data Fig. 9. Genetic correlation with COVID-19 phenotypes.

Each column shows the genetic correlation results for the three COVID-19 phenotypes (European-ancestry analyses only): critical illness, hospitalization and reported SARS-CoV-2 infection. The traits that the genetic correlation is run against are listed on the left. Significant correlations (FDR < 0.05) are shown with their 95% confidence intervals in red, nominally significant correlations (P < 0.05) are in black and non-significant correlations are in grey. Two-sided P values were calculated using LDSC for genetic correlations and exact estimates, unadjusted standard errors and two-sided P values are available in Supplementary Table 11.
We next used two-sample Mendelian randomization to infer potentially causal relationships between these traits. After correcting for multiple testing (FDR < 0.05), eight exposure–COVID-19 trait pairs showed suggestive evidence of a causal association (Fig. 3, Extended Data Fig. 10, Supplementary Table 12 and Supplementary Fig. 3). Five of these associations were robust to potential violations of the underlying assumptions of Mendelian randomization. Corroborating our genetic correlation results and evidence from epidemiological studies, genetically predicted higher body-mass index (OR (95% CI) = 1.4 (1.3–1.6), P = 8.5 × 10⁻¹¹) and smoking (OR (95% CI) = 1.9 (1.3–2.8), P = 0.0012) were associated with increased risk of COVID-19 hospitalization, with body-mass index also being associated with increased risk of SARS-CoV-2 infection (OR (95% CI) = 1.1 (1.1–1.2), P = 4.8 × 10⁻⁷). Genetically predicted increased height (OR (95% CI) = 1.1 (1–1.1)), P = 8.9 × 10⁻⁴) was associated with an increased risk of reported SARS-CoV-2 infection, whereas a genetically predicted higher red-blood-cell count (OR (95% CI) = 0.93 (0.89–0.96), P = 5.7 × 10⁻⁵) was associated with a reduced risk of reported SARS-CoV-2 infection. Despite evidence of a genetic correlation between type II diabetes and COVID-19 outcomes, there was no evidence of a causal association in the Mendelian randomization analyses, which suggests that the observed genetic correlations are due to pleiotropic effects between body-mass index and type 2 diabetes. Further sensitivity analyses relating to sample overlap are discussed in the Supplementary Information.
Extended Data Fig. 10. Mendelian randomization sensitivity analyses.

Genetic correlations and Forest plots displaying the causal estimates for each of the sensitivity analyses used in the Mendelian randomization analysis for trait pairs that were significant at an FDR of 5%. Two-sided P values were estimated using IVW, WME, WMBE and MR-PRESSO analyses. RBC, red blood cell count.
Discussion
The COVID-19 HGI has brought together investigators from across the world to advance genetic discovery for SARS-CoV-2 infection and severe COVID-19 disease. We report 13 genome-wide significant loci associated with some aspect of SARS-CoV-2 infection or COVID-19. Many of these loci overlap with previously reported associations with lung-related phenotypes or autoimmune or inflammatory diseases, but some loci have no obvious candidate gene.
Four out of the thirteen genome-wide significant loci showed similar effects in the reported SARS-CoV-2 infection analysis (a proxy for disease susceptibility) and all-hospitalized COVID-19 (a proxy for disease severity). Of these, one locus was in close proximity to, yet independent of, the major genetic signal for COVID-19 severity at the 3p21.31 locus. Notably, this locus was associated with COVID-19 susceptibility rather than severity. The locus overlaps SLC6A20, which encodes an amino acid transporter that interacts with ACE2. Nonetheless, we caution that more data are needed to resolve the nature of the relationship between genetic variation and COVID-19 at this locus, particularly as the physical proximity, LD structure and patterns of association suggest that untagged genetic variation could drive the association signal in the region. Our findings support the notion that some genetic variants, most notably at the ABO and PPP1R15A loci, in addition to SLC6A20, can indeed affect susceptibility to infection rather than progression to severe COVID-19 once infected.
Several of the loci reported here—as noted in previous publications12,14—intersect with well-known genetic variants that have established genetic associations. Examples of these include variants at DPP9 and FOXP4, which show previous evidence of increasing risk for interstitial lung disease5, and missense variants within TYK2 that show a protective effect on several autoimmune-related diseases32–35. Together with the heritability enrichment observed in genes expressed in lung tissues, these results highlight the involvement of lung-related biological pathways in the development of severe COVID-19. Several other loci show no previously documented genome-wide significant associations, despite the high significance and attractive candidate genes for COVID-19 (for example, CXCR6, LZTFL1, IFNAR2 and OAS1/OAS2/OAS3 loci). The previously reported associations for the strongest association for COVID-19 severity at the 3p21.31 locus and monocytes count are likely to be due to proximity and not a true co-localization.
Increasing the global representation in genetic studies enhances the ability to detect novel associations. Two of the loci that affect disease severity were only discovered by including the four studies of individuals with East Asian ancestry. One of these loci—close to FOXP4—is common particularly in East Asian participants (32%) as well as admixed American participants in the Americas (20%) and Middle Eastern participants (7%), but has a low frequency in most European ancestries (2–3%) in our data. Although we cannot be certain of the mechanism of action, the FOXP4 association is an attractive biological target, as it is expressed in the proximal and distal airway epithelium36 and has been shown to have a role in controlling epithelial cell fate during lung development37. The COVID-19 HGI continues to pursue expansion of the datasets included in the analyses of the consortium to populations from underrepresented populations in upcoming data releases. We plan to release ancestry-specific results in full once the sample sizes allow for a well-powered meta-analysis.
Care should be taken when interpreting the results from a meta-analysis because of challenges with case and control ascertainment and collider bias (see Supplementary Note for a more detailed discussion on study limitations). Drawing a comprehensive and reproducible map of the host genetics factors associated with COVID-19 severity and SARS-CoV-2 requires a sustained international effort to include diverse ancestries and study designs. To accelerate downstream research and therapeutic discovery, the COVID-19 HGI regularly publishes meta-analysis results from periodic data freezes on the website https://www.covid19hg.org/ and provides an interactive explorer through which researchers can browse the results and the genomic loci in more detail. Future work will be required to better understand the biological and clinical value of these findings. Continued efforts to collect more samples and detailed phenotypic data should be endorsed globally, allowing for more thorough investigation of variable, heritable symptoms, particularly in light of the newly emerging strains of SARS-CoV-2, which may provoke different host responses that lead to disease.
Methods
Contributing studies
All of the participants were recruited following protocols approved by local Institutional Review Boards; this information is collected in Supplementary Table 1 for all 46 studies. All protocols followed local ethics recommendations and informed consent was obtained when required. Information about sample numbers, sex and age from for each contributing study is given in Supplementary Table 1. In total, 16 studies contributed data to the analysis of critical illness due to COVID-19, 29 studies contributed data to hospitalized COVID-19 analysis and 44 studies contributed to the analysis of all cases of COVID-19. Each individual study that contributed data to a particular analysis met a minimum threshold of 50 cases, as defined by the phenotypic criteria, for statistical robustness. The effective sample sizes for each ancestry group shown in Fig. 1 were calculated for display using the formula: ((4 × Ncase × Ncontrol)/(Ncase + Ncontrol)). Details of contributing research groups are provided in Supplementary Table 1.
Phenotype definitions
COVID-19 disease status (critical illness and hospitalization status) was assessed following the Diagnosis and Treatment Protocol for Novel Coronavirus Pneumonia38. The critically ill COVID-19 group included patients who were hospitalized owing to symptoms associated with laboratory-confirmed SARS-CoV-2 infection and who required respiratory support or whose cause of death was associated with COVID-19. The hospitalized COVID-19 group included patients who were hospitalized owing to symptoms associated with laboratory-confirmed SARS-CoV-2 infection.
The reported SARS-CoV-2 infection group included individuals with laboratory-confirmed SARS-CoV-2 infection or electronic health record, ICD coding or clinically confirmed COVID-19, or self-reported COVID-19 (for example, by questionnaire), with or without symptoms of any severity. Genetic-ancestry-matched control individuals for the three case definitions were sourced from population-based cohorts, including individuals whose exposure status to SARS-CoV-2 was either unknown or infection-negative for questionnaire/electronic-health-record-based cohorts. Additional information regarding individual studies contributing to the consortium are described in Supplementary Table 1.
Genome-wide association studies and meta-analyses
Each contributing study genotyped the samples and performed quality controls, data imputation and analysis independently, but following the consortium recommendations (information is available at https://www.covid19hg.org/). We recommended that genome-wide association study (GWAS) analyses were run using Scalable and Accurate Implementation of GEneralized mixed model (SAIGE)39 on chromosomes 1–22 and X. The recommended analysis tool was SAIGE, but studies also used other software such as PLINK40. The suggested covariates were age, age2, sex, age × sex and the 20 first principal components. Any other study-specific covariates to account for known technical artefacts could be added. SAIGE automatically accounts for sample relatedness and case–control imbalances. Quality-control and analysis approaches for individual studies are reported in Supplementary Table 1.
Study-specific summary statistics were then processed for meta-analysis. Potential false positives, inflation and deflation were examined for each submitted GWAS. Allele frequency plots against gnomAD 3.0 genomes were manually inspected for each study. Standard error values as a function of the effective sample size were used to find studies that deviated from the expected trend. Summary statistics passing this manual quality control were included in the meta-analysis. Variants with an allele frequency of >0.1% and an imputation INFO score of >0.6 were carried forward from each study. Variants and alleles were lifted over to genome build GRCh38, if needed, and harmonized to gnomAD 3.0 genomes41 by finding matching variants by strand flipping or switching the ordering of alleles. If multiple matching variants were included, the best match was chosen according to the minimum fold change in absolute allele frequency. Meta-analysis was performed using the inverse-variance-weighted (IVW) method on variants that were present in at least two-thirds of the studies contributing to the phenotype analysis. The method summarizes effect sizes across the multiple studies by computing the mean of the effect sizes weighted by the inverse variance in each individual study.
We report 13 meta-analysis variants that pass the genome-wide significance threshold after adjusting the threshold for multiple traits tested (P < 5 × 10⁻⁸/3). We report the unadjusted P values for each variant. We tested for heterogeneity between estimates from contributing studies using Cochran’s Q-test42,43. This is calculated for each variant as the weighted sum of squared differences between the effects sizes and their meta-analysis effect, the weights being the inverse variance of the effect size. Q is distributed as a χ2 statistic with k (number of studies) minus one degrees of freedom. Two loci reached genome-wide significance but were excluded from the significant results in Supplementary Table 2 due to heterogeneity between estimates from contributing studies and missingness between studies at chr. 6: 31057940–31380334 and chr. 7: 54671568–54759789; however, these regions are not excluded from the corresponding summary statistics in data release 5 (COVID-19 HGI (https://www.covid19hg.org/results/r5/) and GWAS Catalog (study code GCST011074)). For each of the lead variants reported in Supplementary Table 2, we aimed to find loci specific to susceptibility or severity by testing whether there was heterogeneity between the effect sizes associated with hospitalized COVID-19 (progression to severe disease) and reported SARS-CoV-2 infection. We used the Cochran’s Q measure42,43, calculated for each variant as the weighted sum of squared differences between the two analysis effect sizes and their meta-analysis effect with the weights being the inverse variance of the effect size. A significant P value of P < 0.004 ((0.05/13 loci) for multiple tests) indicates that the effect sizes for a particular variant are significantly different in the two analyses (Supplementary Table 2). For the nine loci, in which the lead variant effect size was significantly higher for hospitalized COVID-19, we carried out the same test again but comparing effect sizes from hospitalized COVID-19 with critically ill COVID-19 (Supplementary Table 4). Furthermore, we carried out the same test comparing meta-analysed hospitalized COVID-19 (population as controls) and hospitalized COVID-19 (SARS-CoV-2-positive but non-hospitalized as controls) (Supplementary Table 4). For these pairs of phenotype comparisons, we generated new meta-analysis summary statistics to use; including only those studies that could contribute data to both phenotypes that were under comparison.
Principal component projection
To project every GWAS participant into the same principal component (PC) space, we used pre-computed PC loadings and reference allele frequencies. For reference, we used unrelated samples from the 1000 Genomes Project and the Human Genome Diversity Project and computed PC loadings and allele frequencies for the 117,221 single-nucleotide polymorphisms (SNPs) that (1) are available in every cohort; (2) have a minor allele frequency of >0.1% in the reference; and (3) are LD-pruned (r2 < 0.8; 500-kb window). We then asked each cohort to project their samples using our automated script provided at https://github.com/covid19-hg/. It internally uses the PLINK244 --score function with the variance-standardize option and reference allele frequencies (--read-freq); so that each cohort-specific genotype/dosage matrix is mean-centred and variance-standardized with respect to reference allele frequencies, but not cohort-specific allele frequencies. We further normalized the projected PC scores by dividing the values by a square root of the number of variants used for projection to account for a subtle difference due to missing variants.
Gene prioritization
To prioritize candidate causal genes reported in full in Supplementary Table 2, we used various gene prioritization approaches using both locus-based and similarity-based methods. Because we only describe the in silico gene prioritization results without characterizing the actual functional activity in vitro or in vivo, we aimed to provide a systematic approach to nominate potential causal genes in a locus using the following criteria.
(1) The closest gene: a gene that is closest to a lead variant by distance to the gene body.
(2) Genes in the LD region: genes that overlap with a genomic range containing any variants in LD (r2 > 0.6) with a lead variant. For LD computation, we retrieved LD matrices provided by gnomAD v.2.1.141 for each population analysed in this study (except for admixed American, Middle Eastern and South Asian genetic ancestry populations, for whom data are not available). We then constructed a weighted-average LD matrix by per-population sample sizes in each meta-analysis, which we used as a LD reference.
(3) Genes with coding variants: genes with at least one loss-of-function or missense variant (annotated by VEP45 v.95 with GENCODE v.29) that is in LD with a lead variant (r2 > 0.6).
(4) eGenes: genes with at least one fine-mapped cis-eQTL variant (PIP > 0.1) that is in LD with a lead variant (r2 > 0.6) (Supplementary Table 5). We retrieved fine-mapped variants from the GTEx v.820 (https://www.finucanelab.org/) and eQTL catalogue46. In addition, we looked up significant associations in the Lung eQTL Consortium21 (n = 1,103) to further support our findings in lung with a larger sample size (Supplementary Table 7). We note that, in contrast to the GTEx or eQTL catalogue, we only looked at associations and did not fine-map our data to the Lung eQTL Consortium data.
(5) V2G: a gene with the highest overall V2G score based on Open Targets Genetics (OTG)26. For each variant, the overall V2G score aggregates differentially weighted evidence of variant–gene associations from several data sources, including molecular cis-QTL data (for example, cis-protein QTLs from ref. 47, cis-eQTLs from GTEx v.7 and so on), interaction-based datasets (for example, promoter capture Hi-C), genomic distance and variant effect predictions (VEP) from Ensembl. A detailed description of the evidence sources and weights used is provided in the OTG documentation (https://genetics-docs.opentargets.org/our-approach/data-pipeline)26.
Phenome-wide association study
To investigate the evidence of shared effects of 15 index variants for COVID-19 and previously reported phenotypes, we performed a phenome-wide association study. We considered phenotypes in OTG obtained from the GWAS catalogue (this included studies with and without full summary statistics, n = 300 and 14,013, respectively)48 and from the UK Biobank. Summary statistics for UK Biobank traits were extracted from SAIGE39 for binary outcomes (n = 1,283 traits) and Neale v.2 (n = 2,139 traits) for both binary and quantitative traits (http://www.nealelab.is/uk-biobank/) and FinnGen Freeze 4 cohort (https://www.finngen.fi/en/access_results). We report PheWAS results for phenotypes for which the lead variants were in high LD (r2 > 0.8) with the 13 genome-wide significant lead variants from our main COVID-19 meta-analysis (Supplementary Table 6). This conservative approach allowed spurious signals primarily driven by proximity rather than actual colocalization to be removed (see Methods).
To remove plausible spurious associations, we retrieved phenotypes for GWAS lead variants that were in LD (r2 > 0.8) with COVID-19 index variants.
Heritability
LD score regression v.1.0.149 was used to estimate the SNP heritability of the phenotypes from the meta-analysis summary statistic files. As this method depends on matching the LD structure of the analysis sample to a reference panel, the summary statistics of European ancestry only were used. Sample sizes were n = 5,101 critically ill cases of COVID-19 and n = 1,383,241 control participants, n = 9,986 hospitalized cases of COVID-19 and n = 1,877,672 control participants, and n = 38,984 cases and n = 1,644,784 control participants for the analysis of all cases—all including the 23andMe cohort. Pre-calculated LD scores from the 1000 Genomes European reference population were obtained online (https://data.broadinstitute.org/alkesgroup/LDSCORE/). Analyses were conducted using the standard program settings for variant filtering (removal of non-HapMap3 SNPs, the HLA region on chromosome 6, non-autosomal, χ2 > 30, minor allele frequency of <1%, or allele mismatch with reference). We additionally report SNP heritability estimates for the all-ancestries meta-analyses, calculated using European panel LD scores, in Supplementary Table 8.
Partitioned heritability
We used partitioned LD score regression50 to partition COVID-19 SNP heritability in cell types in our summary statistics for European ancestry only. We ran the analysis using the baseline model LD scores calculated for European populations and regression weights that are available online (https://github.com/bulik/ldsc). We used the COVID-19 summary statistics for European ancestry only for the analysis.
Genome-wide association summary statistics
We obtained genome-wide association summary statistics for 43 complex-disease, neuropsychiatric, behavioural or biomarker phenotypes (Supplementary Table 10). These phenotypes were selected based on their putative relevance to COVID-19 susceptibility, severity or mortality, with 19 selected based on the Centers for Disease Control list of underlying medical conditions associated with COVID-19 severity51 or traits reported to be associated with increased risk of COVID-19 mortality by OpenSafely52. Summary statistics generated from GWAS using individuals of European ancestry were preferentially selected if available. These summary statistics were used in subsequent genetic correlation and Mendelian randomization analyses.
Genetic correlation
LD score regression50 was also used to estimate the genetic correlations between our COVID-19 meta-analysis phenotypes reported using samples of only European ancestry, and between these and the curated set of 38 summary statistics. Genetic correlations were estimated using the same LD score regression settings as for heritability calculations. Differences between the observed genetic correlations of SARS-CoV-2 infection and COVID-19 severity were compared using a z-score method53.
Mendelian randomization
Two-sample Mendelian randomization was used to evaluate the potential for causal association of the 38 traits on COVID-19 hospitalization, on COVID-19 severity and reported SARS-CoV-2 infection using samples of only European ancestry. Independent genome-wide significant SNPs robustly associated with the exposures of interest (P < 5 × 10⁻⁸) were selected as genetic instruments by performing LD clumping using PLINK40. We used a strict r2 threshold of 0.001, a 10-Mb clumping window, and the European reference panel from the 1000 Genomes Project54 to discard SNPs in LD with another variant with a smaller P-value association. For genetic variants that were not present in the hospitalized COVID-19 analysis, PLINK was used to identify proxy variants that were in LD (r2 > 0.8). Next, the exposure and outcome datasets were harmonized using the R package TwoSampleMR55. Namely, we ensured that the effect of a variant on the exposure and outcome corresponded to the same allele, we inferred positive-strand alleles and dropped palindromes with ambiguous allele frequencies, as well as incompatible alleles. Supplementary Table 10 includes the harmonized datasets used in the analyses.
The global test from Mendelian randomization pleiotropy residual sum and outlier (MR-PRESSO)56 software was used to investigate overall horizontal pleiotropy. In brief, the standard IVW meta-analytic framework was used to calculate the average causal effect by excluding each genetic variant used to instrument the analysis. A global statistic was calculated by summing the observed residual sum of squares, that is, the difference between the effect predicted by the IVW slope excluding the SNP, and the observed effect of the SNP on the outcome. Overall horizontal pleiotropy was subsequently analysed by comparing the observed residual sum of squares, with the residual sum of squares expected under the null hypothesis of no pleiotropy. The MR-PRESSO global test was shown to perform well when the outcome and exposure GWASs are not disjoint (although the power to detect horizontal pleiotropy is slightly reduced by complete sample overlap). We also used the regression intercept in MR-Egger57 to evaluate potential bias due to directional pleiotropic effects. This additional check was used in Mendelian randomization analyses with an index surpassing the recommended threshold ()58. Contingent on the MR-PRESSO global test results we analysed the causal effect of each exposure on COVID-19 hospitalization by using a fixed-effect IVW meta-analysis as the primary analysis, or, if pleiotropy was present, the MR-PRESSO outlier-corrected test. The IVW approach estimates the causal effect by aggregating the single-SNP causal effects (obtained using the ratio of coefficients method—that is, the ratio of the effect of the SNP on the outcome over the effect of the SNP on the exposure) in a fixed-effects meta-analysis. The SNPs were assigned weights based on their inverse variance. The IVW method confers the greatest statistical power for estimating causal associations59, but assumes that all variants are valid instruments and can produce biased estimates if the average pleiotropic effect differs from zero. Alternatively, when horizontal pleiotropy was present, we used the MR-PRESSO outlier-corrected method to correct the IVW test by removing outlier SNPs. We conducted further sensitivity analyses using alternative Mendelian randomization methods that provide consistent estimates of the causal effect even when some instrumental variables are invalid, at the cost of reduced statistical power including: (1) Weighted median estimator (WME); (2) weighted mode-based estimator (WMBE); and (3) MR-Egger regression. Robust causal estimates were defined as those that were significant at an FDR of 5% and either (1) showed no evidence of heterogeneity (MR-PRESSO global test P > 0.05) or horizontal pleiotropy (Egger intercept P > 0.05); or (2) in the presence of heterogeneity or horizontal pleiotropy, the WME-, WMBE-, MR-Egger- or MR-PRESSO-corrected estimates were significant (P < 0.05). All statistical analyses were conducted using R v.4.0.3. Mendelian randomization analysis was performed using the ‘TwoSampleMR’ v.0.5.5 package55.
Website and data distribution
In anticipation of the need to coordinate many international partners around a single meta-analysis effort, we created the COVID-19 HGI website (https://covid19hg.org). We were able to centralize information, recruit partner studies, rapidly distribute summary statistics and present preliminary interpretations of the results to the public. Open meetings are held on a monthly basis to discuss future plans and new results; video recordings and supporting documents are shared (https://covid19hg.org/meeting-archive). This centralized resource provides a conceptual and technological framework for organizing global academic and industry groups around a shared goal. The website source code and additional technical details are available at https://github.com/covid19-hg/covid19hg.
To recruit new international partner studies, we developed a workflow in which new studies are registered and verified by a curation team (https://covid19hg.org/register). Users can explore the registered studies using a customized interface to find and contact studies with similar goals or approaches (https://covid19hg.org/partners). This helps to promote organic assembly around focused projects that are adjacent to the centralized effort (https://covid19hg.org/projects). Visitors can query study information, including study design and research questions. Registered studies are visualized on a world map and are searchable by institutional affiliation, city and country.
To encourage data sharing and other forms of participation, we created a rolling acknowledgements page (https://covid19hg.org/acknowledgements) and directions on how to contribute data to the central meta-analysis effort (https://covid19hg.org/data-sharing). Upon the completion of each data freeze, we post summary statistics, plots and sample size breakdowns for each phenotype and contributing cohort (https://covid19hg.org/results). The results can be explored using an interactive web browser (https://app.covid19hg.org). Several computational research groups carry out follow-up analyses, which are made available for download (https://covid19hg.org/in-silico). To enhance scientific communication to the public, preliminary results are described in blog posts by the scientific communications team and shared on Twitter. The first post was translated to 30 languages with the help of 85 volunteer translators. We compile publications and preprints submitted by participating groups and summarize genome-wide significant findings from these publications (https://covid19hg.org/publications).
Reporting summary
Further information on research design is available in the Nature Research Reporting Summary linked to this paper.
Online content
Any methods, additional references, Nature Research reporting summaries, source data, extended data, supplementary information, acknowledgements, peer review information; details of author contributions and competing interests; and statements of data and code availability are available at 10.1038/s41586-021-03767-x.
Supplementary information
This Supplementary Information file contains the following sections: New and replicated loci from COVID-19 HGI meta-analyses; Additional independent susceptibility signals at the 3p21.31 locus ; Sensitivity analysis for use of population controls; Sensitivity analysis for overlapping samples between cohorts in Mendelian randomization analyses; Supplementary discussion on study limitations; Supplementary References; and titles and summaries for Supplementary Tables 1-13 (see Excel file for Supplementary Tables).
Quantile-quantile plots for GWAS from all individual studies that contributed data. QQ-plots showing the expected -log10(P-values) on the x-axis and the observed unadjusted P-values values from two-tailed inverse variance weighted meta-analysis on the y-axis (red line showing no deviation from the expected) for each study contributing data to the analyses. Sample size of cases and controls is listed for each study in the plot title, as well as the median lambda value.
LozusZoom plots to visualise the meta-analysis results at the loci passing genome-wide significance. For each genome-wide significant locus in three meta-analyses: meta-analysis of critical illness, hospitalization, and reported infection, we showed 1) a manhattan plot of each locus where a color represents a weighted-average r2 value (see Methods) to a lead variant (unadjusted P-values from the two-tailed inverse variance weighted meta-analysis); 2) r2 values to a lead variant across gnomAD v2 populations, i.e., African/African-American (AFR), Latino/Admixed American (AMR), Ashkenazi Jewish (ASJ), East Asian (EAS), Estonian (EST), Finnish (FIN), Non-Finish Europeans (NFE), North-Western Europeans (NWE), and Southern Europeans (SEU); 3) genes at a locus; and 4) genes prioritized by each gene prioritization metric where a size of circles represents a rank in each metric. Note that the COVID-19 lead variants were chosen across all the meta-analyses (Supplementary Table 2; see Methods) and were not necessarily a variant with the most significant P-value from each inverse variance weighted meta-analysis.
Scatter and funnel plots for each for exposure - COVID-19 outcome pair. Scatter plots show the exposure variant effect size against the COVID-19 outcome variant effect size and corresponding standard errors. Funnel plots show the Mendelian randomization (MR) causal estimates for each variant against their precision, with asymmetry in the plot indicating potential violations of the assumptions of MR. Regression lines show the corresponding causal estimates fixed effect inverse-weighted (IVW, red-solid line) meta-analysis; MR-Egger regression (blue-dashed); Weighted median estimator (WME, green-dashed); weighted mode based estimator (WMBE, purple-dashed); and Mendelian Randomization Pleiotropy RESidual Sum and Outlier corrected (MR-PRESSO, orange-dashed). Variants highlighted in red were flagged as outliers by MR-PRESSO.
This file contains Supplementary Tables 1-13; see main Supplementary Information PDF for table titles and summaries.
This file contains the full authorship for the Covid-19 Host Genetics Initiative.
Acknowledgements
We thank the entire COVID-19 HGI community for their contributions and continued collaboration. The work of the contributing studies was supported by numerous grants from governmental and charitable bodies. Acknowledgements specific to contributing studies are provided in Supplementary Table 13. We thank G. Butler-Laporte, G. Wojcik, M.-G. Hollm-Delgado, C. Willer and G. Davey Smith for their extensive feedback and discussion.
Extended data figures and tables
Author contributions
Author contributions are provided within the author list.
Data availability
Summary statistics generated by the COVID-19 HGI are available at https://www.covid19hg.org/results/r5/ and are available in the GWAS Catalog (study code GCST011074). The analyses described here include the freeze-5 data. COVID-19 HGI continues to regularly release new data freezes. Summary statistics for non-European ancestry samples are not currently available due to the small individual sample sizes of these groups, but results for lead variants of 13 loci are reported in Supplementary Table 3. Individual level data can be requested directly from contributing studies, listed in Supplementary Table 1. We used publicly available data from GTEx (https://gtexportal.org/home/), the Neale lab (http://www.nealelab.is/uk-biobank/), Finucane lab (https://www.finucanelab.org), the FinnGen Freeze 4 cohort (https://www.finngen.fi/en/access_results) and the eQTL catalogue release 3 (http://www.ebi.ac.uk/eqtl/).
Code availability
The code for summary statistics lift-over, the projection PCA pipeline including precomputed loadings and meta-analyses are available on GitHub (https://github.com/covid19-hg/) and the code for the Mendelian randomization and genetic correlation pipeline is available on GitHub at https://github.com/marcoralab/MRcovid.
Competing interests
A full list of competing interests is supplied as Supplementary Table 13.
Footnotes
Peer review information Nature thanks Samira Asgari, Paul McLaren and Neneh Sallah for their contribution to the peer review of this work. Peer reviewer reports are available.
Publisher’s note Springer Nature remains neutral with regard to jurisdictional claims in published maps and institutional affiliations.
These authors contributed equally: Mari E. K. Niemi, Juha Karjalainen, Benjamin M. Neale, Mark Daly, Andrea Ganna
Lists of authors and their affiliations appear in the online version of the paper
Contributor Information
COVID-19 Host Genetics Initiative:
Mari E. K. Niemi, Juha Karjalainen, Rachel G. Liao, Benjamin M. Neale, Mark Daly, Andrea Ganna, Lea Davis, Sulggi Lee, James Priest, Alessandra Renieri, Vijay G. Sankaran, David van Heel, Patrick Deelen, J. Brent Richards, Tomoko Nakanishi, Les Biesecker, V. Eric Kerchberger, J. Kenneth Baillie, Francesca Mari, Anna Bernasconi, Stefano Ceri Baillie, Arif Canakoglu, Xiao Chang, Joseph R. Glessner, and Hakon Hakonarson
Extended data
is available for this paper at 10.1038/s41586-021-03767-x.
Supplementary information
The online version contains supplementary material available at 10.1038/s41586-021-03767-x.
References
- 1.Docherty AB, et al. Features of 20 133 UK patients in hospital with COVID-19 using the ISARIC WHO Clinical Characterisation Protocol: prospective observational cohort study. Br. Med. J. 2020;369:m1985. doi: 10.1136/bmj.m1985. [DOI] [PMC free article] [PubMed] [Google Scholar]
- 2.Zhou F, et al. Clinical course and risk factors for mortality of adult inpatients with COVID-19 in Wuhan, China: a retrospective cohort study. Lancet. 2020;395:1054–1062. doi: 10.1016/S0140-6736(20)30566-3. [DOI] [PMC free article] [PubMed] [Google Scholar]
- 3.Dendrou CA, et al. Resolving TYK2 locus genotype-to-phenotype differences in autoimmunity. Sci. Transl. Med. 2016;8:363ra149. doi: 10.1126/scitranslmed.aag1974. [DOI] [PMC free article] [PubMed] [Google Scholar]
- 4.Astle WJ, et al. The allelic landscape of human blood cell trait variation and links to common complex disease. Cell. 2016;167:1415–1429.e19. doi: 10.1016/j.cell.2016.10.042. [DOI] [PMC free article] [PubMed] [Google Scholar]
- 5.Fingerlin TE, et al. Genome-wide association study identifies multiple susceptibility loci for pulmonary fibrosis. Nat. Genet. 2013;45:613–620. doi: 10.1038/ng.2609. [DOI] [PMC free article] [PubMed] [Google Scholar]
- 6.Wang Z, et al. Meta-analysis of genome-wide association studies identifies multiple lung cancer susceptibility loci in never-smoking Asian women. Hum. Mol. Genet. 2016;25:620–629. doi: 10.1093/hmg/ddv494. [DOI] [PMC free article] [PubMed] [Google Scholar]
- 7.Shrine N, et al. New genetic signals for lung function highlight pathways and chronic obstructive pulmonary disease associations across multiple ancestries. Nat. Genet. 2019;51:481–493. doi: 10.1038/s41588-018-0321-7. [DOI] [PMC free article] [PubMed] [Google Scholar]
- 8.Buitrago-Garcia D, et al. Occurrence and transmission potential of asymptomatic and presymptomatic SARS-CoV-2 infections: a living systematic review and meta-analysis. PLoS Med. 2020;17:e1003346. doi: 10.1371/journal.pmed.1003346. [DOI] [PMC free article] [PubMed] [Google Scholar]
- 9.van der Made CI, et al. Presence of genetic variants among young men with severe COVID-19. J. Am. Med. Assoc. 2020;324:663–673. doi: 10.1001/jama.2020.13719. [DOI] [PMC free article] [PubMed] [Google Scholar]
- 10.Zhang Q, et al. Inborn errors of type I IFN immunity in patients with life-threatening COVID-19. Science. 2020;370:eabd4570. doi: 10.1126/science.abd4570. [DOI] [PMC free article] [PubMed] [Google Scholar]
- 11.Povysil, G. et al. Rare loss-of-function variants in type I IFN immunity genes are not associated with severe COVID-19. J. Clin. Invest. 147834 (2021). [DOI] [PMC free article] [PubMed]
- 12.Severe COVID-19 GWAS Group Genomewide association study of severe covid-19 with respiratory failure. N. Engl. J. Med. 2020;383:1522–1534. doi: 10.1056/NEJMoa2020283. [DOI] [PMC free article] [PubMed] [Google Scholar]
- 13.Shelton JF, et al. Trans-ancestry analysis reveals genetic and nongenetic associations with COVID-19 susceptibility and severity. Nat. Genet. 2021;53:801–808. doi: 10.1038/s41588-021-00854-7. [DOI] [PubMed] [Google Scholar]
- 14.Pairo-Castineira E, et al. Genetic mechanisms of critical illness in COVID-19. Nature. 2021;591:92–98. doi: 10.1038/s41586-020-03065-y. [DOI] [PubMed] [Google Scholar]
- 15.Roberts, G. H. L. et al. AncestryDNA COVID-19 host genetic study identifies three novel loci. Preprint at 10.1101/2020.10.06.20205864 (2020).
- 16.Kosmicki, J. A. et al. A catalog of associations between rare coding variants and COVID-19 outcomes. Preprint at 10.1101/2020.10.28.20221804 (2021).
- 17.COVID-19 Host Genetics Initiative The COVID-19 Host Genetics Initiative, a global initiative to elucidate the role of host genetic factors in susceptibility and severity of the SARS-CoV-2 virus pandemic. Eur. J. Hum. Genet. 2020;28:715–718. doi: 10.1038/s41431-020-0636-6. [DOI] [PMC free article] [PubMed] [Google Scholar]
- 18.Couturier N, et al. Tyrosine kinase 2 variant influences T lymphocyte polarization and multiple sclerosis susceptibility. Brain. 2011;134:693–703. doi: 10.1093/brain/awr010. [DOI] [PubMed] [Google Scholar]
- 19.Li Z, et al. Two rare disease-associated Tyk2 variants are catalytically impaired but signaling competent. J. Immunol. 2013;190:2335–2344. doi: 10.4049/jimmunol.1203118. [DOI] [PubMed] [Google Scholar]
- 20.GTEx Consortium The GTEx Consortium atlas of genetic regulatory effects across human tissues. Science. 2020;369:1318–1330. doi: 10.1126/science.aaz1776. [DOI] [PMC free article] [PubMed] [Google Scholar]
- 21.Hao K, et al. Lung eQTLs to help reveal the molecular underpinnings of asthma. PLoS Genet. 2012;8:e1003029. doi: 10.1371/journal.pgen.1003029. [DOI] [PMC free article] [PubMed] [Google Scholar]
- 22.Dai J, et al. Identification of risk loci and a polygenic risk score for lung cancer: a large-scale prospective cohort study in Chinese populations. Lancet Respir. Med. 2019;7:881–891. doi: 10.1016/S2213-2600(19)30144-4. [DOI] [PMC free article] [PubMed] [Google Scholar]
- 23.Manichaikul A, et al. Genome-wide association study of subclinical interstitial lung disease in MESA. Respir. Res. 2017;18:97. doi: 10.1186/s12931-017-0581-2. [DOI] [PMC free article] [PubMed] [Google Scholar]
- 24.Stefansson H, et al. A common inversion under selection in Europeans. Nat. Genet. 2005;37:129–137. doi: 10.1038/ng1508. [DOI] [PubMed] [Google Scholar]
- 25.Boettger LM, Handsaker RE, Zody MC, McCarroll SA. Structural haplotypes and recent evolution of the human 17q21.31 region. Nat. Genet. 2012;44:881–885. doi: 10.1038/ng.2334. [DOI] [PMC free article] [PubMed] [Google Scholar]
- 26.Ghoussaini M, et al. Open Targets Genetics: systematic identification of trait-associated genes using large-scale genetics and functional genomics. Nucleic Acids Res. 2021;49:D1311–D1320. doi: 10.1093/nar/gkaa840. [DOI] [PMC free article] [PubMed] [Google Scholar]
- 27.Xiao G, et al. CXCL16/CXCR6 chemokine signaling mediates breast cancer progression by pERK1/2-dependent mechanisms. Oncotarget. 2015;6:14165–14178. doi: 10.18632/oncotarget.3690. [DOI] [PMC free article] [PubMed] [Google Scholar]
- 28.Wei Q, et al. LZTFL1 suppresses lung tumorigenesis by maintaining differentiation of lung epithelial cells. Oncogene. 2016;35:2655–2663. doi: 10.1038/onc.2015.328. [DOI] [PMC free article] [PubMed] [Google Scholar]
- 29.Vuille-dit-Bille RN, et al. Human intestine luminal ACE2 and amino acid transporter expression increased by ACE-inhibitors. Amino Acids. 2015;47:693–705. doi: 10.1007/s00726-014-1889-6. [DOI] [PubMed] [Google Scholar]
- 30.Finucane HK, et al. Heritability enrichment of specifically expressed genes identifies disease-relevant tissues and cell types. Nat. Genet. 2018;50:621–629. doi: 10.1038/s41588-018-0081-4. [DOI] [PMC free article] [PubMed] [Google Scholar]
- 31.GTEx Consortium The Genotype-Tissue Expression (GTEx) pilot analysis: multitissue gene regulation in humans. Science. 2015;348:648–660. doi: 10.1126/science.1262110. [DOI] [PMC free article] [PubMed] [Google Scholar]
- 32.Eyre S, et al. High-density genetic mapping identifies new susceptibility loci for rheumatoid arthritis. Nat. Genet. 2012;44:1336–1340. doi: 10.1038/ng.2462. [DOI] [PMC free article] [PubMed] [Google Scholar]
- 33.Tsoi LC, et al. Large scale meta-analysis characterizes genetic architecture for common psoriasis associated variants. Nat. Commun. 2017;8:15382. doi: 10.1038/ncomms15382. [DOI] [PMC free article] [PubMed] [Google Scholar]
- 34.Langefeld CD, et al. Transancestral mapping and genetic load in systemic lupus erythematosus. Nat. Commun. 2017;8:16021. doi: 10.1038/ncomms16021. [DOI] [PMC free article] [PubMed] [Google Scholar]
- 35.Kichaev G, et al. Leveraging polygenic functional enrichment to improve GWAS power. Am. J. Hum. Genet. 2019;104:65–75. doi: 10.1016/j.ajhg.2018.11.008. [DOI] [PMC free article] [PubMed] [Google Scholar]
- 36.Lu MM, Li S, Yang H, Morrisey EE. Foxp4: a novel member of the Foxp subfamily of winged-helix genes co-expressed with Foxp1 and Foxp2 in pulmonary and gut tissues. Gene Expr. Patterns. 2002;2:223–228. doi: 10.1016/S1567-133X(02)00058-3. [DOI] [PubMed] [Google Scholar]
- 37.Li S, et al. Foxp1/4 control epithelial cell fate during lung development and regeneration through regulation of anterior gradient 2. Development. 2012;139:2500–2509. doi: 10.1242/dev.079699. [DOI] [PMC free article] [PubMed] [Google Scholar]
- 38.Wei P-F. Diagnosis and treatment protocol for novel coronavirus pneumonia (trial version 7) Chin. Med. J. (Engl.) 2020;133:1087–1095. doi: 10.1097/CM9.0000000000000819. [DOI] [PMC free article] [PubMed] [Google Scholar]
- 39.Zhou W, et al. Efficiently controlling for case–control imbalance and sample relatedness in large-scale genetic association studies. Nat. Genet. 2018;50:1335–1341. doi: 10.1038/s41588-018-0184-y. [DOI] [PMC free article] [PubMed] [Google Scholar]
- 40.Purcell S, et al. PLINK: a tool set for whole-genome association and population-based linkage analyses. Am. J. Hum. Genet. 2007;81:559–575. doi: 10.1086/519795. [DOI] [PMC free article] [PubMed] [Google Scholar]
- 41.Karczewski KJ, et al. The mutational constraint spectrum quantified from variation in 141,456 humans. Nature. 2020;581:434–443. doi: 10.1038/s41586-020-2308-7. [DOI] [PMC free article] [PubMed] [Google Scholar]
- 42.Evangelou E, Ioannidis JPA. Meta-analysis methods for genome-wide association studies and beyond. Nat. Rev. Genet. 2013;14:379–389. doi: 10.1038/nrg3472. [DOI] [PubMed] [Google Scholar]
- 43.Cochran WG. The combination of estimates from different experiments. Biometrics. 1954;10:101–129. doi: 10.2307/3001666. [DOI] [Google Scholar]
- 44.Chang CC, et al. Second-generation PLINK: rising to the challenge of larger and richer datasets. Gigascience. 2015;4:7. doi: 10.1186/s13742-015-0047-8. [DOI] [PMC free article] [PubMed] [Google Scholar]
- 45.McLaren W, et al. The Ensembl Variant Effect Predictor. Genome Biol. 2016;17:122. doi: 10.1186/s13059-016-0974-4. [DOI] [PMC free article] [PubMed] [Google Scholar]
- 46.Kerimov, N. et al. eQTL Catalogue: a compendium of uniformly processed human gene expression and splicing QTLs. Preprint at 10.1101/2020.01.29.924266 (2021). [DOI] [PMC free article] [PubMed]
- 47.Sun BB, et al. Genomic atlas of the human plasma proteome. Nature. 2018;558:73–79. doi: 10.1038/s41586-018-0175-2. [DOI] [PMC free article] [PubMed] [Google Scholar]
- 48.Buniello A, et al. The NHGRI-EBI GWAS Catalog of published genome-wide association studies, targeted arrays and summary statistics 2019. Nucleic Acids Res. 2019;47:D1005–D1012. doi: 10.1093/nar/gky1120. [DOI] [PMC free article] [PubMed] [Google Scholar]
- 49.Bulik-Sullivan BK, et al. LD Score regression distinguishes confounding from polygenicity in genome-wide association studies. Nat. Genet. 2015;47:291–295. doi: 10.1038/ng.3211. [DOI] [PMC free article] [PubMed] [Google Scholar]
- 50.Finucane HK, et al. Partitioning heritability by functional annotation using genome-wide association summary statistics. Nat. Genet. 2015;47:1228–1235. doi: 10.1038/ng.3404. [DOI] [PMC free article] [PubMed] [Google Scholar]
- 51.CDC. People with certain medical conditions. https://www.cdc.gov/coronavirus/2019-ncov/need-extra-precautions/people-with-medical-conditions.html (2021).
- 52.Williamson EJ, et al. Factors associated with COVID-19-related death using OpenSAFELY. Nature. 2020;584:430–436. doi: 10.1038/s41586-020-2521-4. [DOI] [PMC free article] [PubMed] [Google Scholar]
- 53..Zhou, T. et al. Educational attainment and drinking behaviors: Mendelian randomization study in UK Biobank. Mol. Psychiatry10.1038/s41380-019-0596-9 (2019). [DOI] [PMC free article] [PubMed]
- 54.1000 Genomes Project Consortium A map of human genome variation from population-scale sequencing. Nature. 2010;467:1061–1073. doi: 10.1038/nature09534. [DOI] [PMC free article] [PubMed] [Google Scholar]
- 55.Hemani G, et al. The MR-Base platform supports systematic causal inference across the human phenome. eLife. 2018;7:e34408. doi: 10.7554/eLife.34408. [DOI] [PMC free article] [PubMed] [Google Scholar]
- 56.Verbanck M, Chen C-Y, Neale B, Do R. Detection of widespread horizontal pleiotropy in causal relationships inferred from Mendelian randomization between complex traits and diseases. Nat. Genet. 2018;50:693–698. doi: 10.1038/s41588-018-0099-7. [DOI] [PMC free article] [PubMed] [Google Scholar]
- 57.Bowden J, Davey Smith G, Burgess S. Mendelian randomization with invalid instruments: effect estimation and bias detection through Egger regression. Int. J. Epidemiol. 2015;44:512–525. doi: 10.1093/ije/dyv080. [DOI] [PMC free article] [PubMed] [Google Scholar]
- 58.Bowden J, et al. Assessing the suitability of summary data for two-sample Mendelian randomization analyses using MR-Egger regression: the role of the I2 statistic. Int. J. Epidemiol. 2016;45:1961–1974. doi: 10.1093/ije/dyw220. [DOI] [PMC free article] [PubMed] [Google Scholar]
- 59.Slob EAW, Burgess S. A comparison of robust Mendelian randomization methods using summary data. Genet. Epidemiol. 2020;44:313–329. doi: 10.1002/gepi.22295. [DOI] [PMC free article] [PubMed] [Google Scholar]
Associated Data
This section collects any data citations, data availability statements, or supplementary materials included in this article.
Supplementary Materials
This Supplementary Information file contains the following sections: New and replicated loci from COVID-19 HGI meta-analyses; Additional independent susceptibility signals at the 3p21.31 locus ; Sensitivity analysis for use of population controls; Sensitivity analysis for overlapping samples between cohorts in Mendelian randomization analyses; Supplementary discussion on study limitations; Supplementary References; and titles and summaries for Supplementary Tables 1-13 (see Excel file for Supplementary Tables).
Quantile-quantile plots for GWAS from all individual studies that contributed data. QQ-plots showing the expected -log10(P-values) on the x-axis and the observed unadjusted P-values values from two-tailed inverse variance weighted meta-analysis on the y-axis (red line showing no deviation from the expected) for each study contributing data to the analyses. Sample size of cases and controls is listed for each study in the plot title, as well as the median lambda value.
LozusZoom plots to visualise the meta-analysis results at the loci passing genome-wide significance. For each genome-wide significant locus in three meta-analyses: meta-analysis of critical illness, hospitalization, and reported infection, we showed 1) a manhattan plot of each locus where a color represents a weighted-average r2 value (see Methods) to a lead variant (unadjusted P-values from the two-tailed inverse variance weighted meta-analysis); 2) r2 values to a lead variant across gnomAD v2 populations, i.e., African/African-American (AFR), Latino/Admixed American (AMR), Ashkenazi Jewish (ASJ), East Asian (EAS), Estonian (EST), Finnish (FIN), Non-Finish Europeans (NFE), North-Western Europeans (NWE), and Southern Europeans (SEU); 3) genes at a locus; and 4) genes prioritized by each gene prioritization metric where a size of circles represents a rank in each metric. Note that the COVID-19 lead variants were chosen across all the meta-analyses (Supplementary Table 2; see Methods) and were not necessarily a variant with the most significant P-value from each inverse variance weighted meta-analysis.
Scatter and funnel plots for each for exposure - COVID-19 outcome pair. Scatter plots show the exposure variant effect size against the COVID-19 outcome variant effect size and corresponding standard errors. Funnel plots show the Mendelian randomization (MR) causal estimates for each variant against their precision, with asymmetry in the plot indicating potential violations of the assumptions of MR. Regression lines show the corresponding causal estimates fixed effect inverse-weighted (IVW, red-solid line) meta-analysis; MR-Egger regression (blue-dashed); Weighted median estimator (WME, green-dashed); weighted mode based estimator (WMBE, purple-dashed); and Mendelian Randomization Pleiotropy RESidual Sum and Outlier corrected (MR-PRESSO, orange-dashed). Variants highlighted in red were flagged as outliers by MR-PRESSO.
This file contains Supplementary Tables 1-13; see main Supplementary Information PDF for table titles and summaries.
This file contains the full authorship for the Covid-19 Host Genetics Initiative.
Data Availability Statement
Summary statistics generated by the COVID-19 HGI are available at https://www.covid19hg.org/results/r5/ and are available in the GWAS Catalog (study code GCST011074). The analyses described here include the freeze-5 data. COVID-19 HGI continues to regularly release new data freezes. Summary statistics for non-European ancestry samples are not currently available due to the small individual sample sizes of these groups, but results for lead variants of 13 loci are reported in Supplementary Table 3. Individual level data can be requested directly from contributing studies, listed in Supplementary Table 1. We used publicly available data from GTEx (https://gtexportal.org/home/), the Neale lab (http://www.nealelab.is/uk-biobank/), Finucane lab (https://www.finucanelab.org), the FinnGen Freeze 4 cohort (https://www.finngen.fi/en/access_results) and the eQTL catalogue release 3 (http://www.ebi.ac.uk/eqtl/).
The code for summary statistics lift-over, the projection PCA pipeline including precomputed loadings and meta-analyses are available on GitHub (https://github.com/covid19-hg/) and the code for the Mendelian randomization and genetic correlation pipeline is available on GitHub at https://github.com/marcoralab/MRcovid.