

Abstract
Objective:
Cognitive dysfunction and structural brain abnormalities have been observed in obese versus lean individuals, but with variability across age and weight groups. The current study was designed to clarify the cognitive profile of obesity by examining performance across multiple cognitive domains in adults with wide-ranging age and weight status.
Method:
Participants (N = 732; 61% women; ages 18–88; BMI range 19–75) underwent assessment of cognitive functioning and relevant medical/demographic covariates. Neuropsychological tests were grouped by cognitive domain (via confirmatory factor analysis), and standardized scores were averaged into composite variables.
Results:
Hierarchical linear regression analyses revealed main effects for BMI on motor (ΔR2 = .02, β = −.15) and attention/processing speed (ΔR2 = .01, β = −.07), whereas a significant interaction between BMI and age was observed (ΔR2 = .01, β = −.08) for predicting executive functioning (p < .05). BMI was not independently associated with memory or language functioning and no interaction effects were observed for these variables. Although BMI was not independently related to executive dysfunction, a significant age × BMI interaction suggests that obesity-related executive deficits may increase with age.
Conclusions:
Overall, these findings may support an independent association between obesity and a frontal-subcortical pathology, though prospective studies are needed to further clarify this possibility.
Keywords: obesity, BMI, aging, cognitive function
Obesity throughout the life span is associated with increased mortality and a wide range of medical and psychiatric conditions, including ischemic heart disease, diabetes mellitus, hypertension, hyperlipidemia, sleep apnea, osteoarthritis, and depression (Adams et al., 2006; Cserjési, Luminet, Poncelet, & László, 2009; de Lusignan et al., 2006; Joshi, Day, Lubowski, & Ambegaonkar, 2005; Webber, 2001; Ogden, Yanovski, Carroll, & Flegal, 2007). Growing evidence also suggests that obesity may have a direct effect on the brain, as obesity has been associated with increased risk for Alzheimer’s disease (AD), vascular dementia (VaD), and stroke (Gustafson, Rothenberg, Blennow, Steen, & Skoog, 2003; Hassing et al., 2009; Kivipelto et al., 2005; Whitmer, Gunderson, Barrett-Connor, Quesenberry, & Yaffe, 2005; Whitmer, Gunderson, Quesenberry, Zhou, & Yaffe, 2007). Furthermore, elevated body fat and weight gain have been independently associated with longitudinal decline in cognitive performance prior to dementia onset (Sabia, Kivimaki, Shipley, Marmot, & Singh-Manoux, 2009).
Specific cognitive deficits have been demonstrated in younger adults and older adults without incipient dementia, with cognitive findings that implicate dysfunction of frontal-subcortical brain regions and circuitry, including attentional and executive dysfunction as well as reduced psychomotor and processing speed (Cournot et al., 2006; Fergenbaum et al., 2009; Gunstad et al., 2007). Recent research has extended these findings from healthy overweight adults to extremely obese persons seeking bariatric surgical intervention, citing reduced sustained attention, response inhibition, mental flexibility, and psychomotor speed in morbidly obese adults (Boeka & Lokken, 2008; Cserjési et al., 2009). Although the results of several investigations have failed to provide support for learning and memory dysfunction in association with obesity (Boeka & Lokken, 2008; Wolf et al., 2007), others have suggested that these abilities may be directly related to adiposity (Gunstad, Paul, Cohen, Tate, & Gordon, 2006; Gunstad, Lhotsky, Wendell, Ferrucci, & Zonderman, 2010).
Consistent with these findings, neuroimaging studies have begun to link obesity to pathological changes prior to the onset of dementia. Obesity has been associated with global brain atrophy (Gunstad et al., 2008; Ward, Carlsson, Trivedi, Sager, & Johnson, 2005), as well as structural and metabolic alterations of frontal and subcortical gray and white matter regions (Pannacciulli et al., 2006; Stanek et al., 2010; Taki et al., 2008; Volkow et al., 2009). However, findings are inconsistent across age groups. More specifically, metabolic and microstructural alterations (i.e., reduced fractional anisotropy) have been found in the white matter of younger adults (Gazdzinski, Kornak, Weiner, & Meyerhoff, 2008; Stanek et al., 2010), whereas macrostructural white matter changes (i.e., volume reduction, lesions) and temporal gray matter alterations have been demonstrated in elderly obese adults (Gustafson, Steen, & Skoog, 2004; Jagust, Harvey, Mungas, & Haan, 2005).
Obesity and the Aging Brain
Normal aging processes adversely impact frontal-subcortical brain regions and promote decline in abilities such as attention and executive function (Raz, 2000). More specifically, cognitive and neuroimaging evidence from individuals across the adult life span suggests that alterations in white matter integrity may be an important neuropathological marker of age-related deterioration (Brickman et al., 2006; Charlton, Schiavone, Barrick, Morris, & Markus, 2009; Yoshita et al., 2006), leading to generalized slowing as well as frontal systems cognitive dysfunction (Salthouse, Atkinson, & Berish, 2003; Zimmerman et al., 2006).
Obesity may involve a frontal-subcortical pattern of neuropsychological dysfunction similar to normal aging. Few studies have examined the possible interaction of body composition and age on neurocognitive performance, though notable differences occur in the cognitive profiles of younger versus older overweight persons. For instance, the association between elevated body fat and cognitive dysfunction may be limited to slower processing speed in young adults (mean age of 19; MacGregor, Fonken, Robottom, Hyunh, & Jorgensen, 2009), but also entails strong executive components in samples that include middle-aged to older adults (Fergenbaum et al., 2009; Gunstad et al., 2007). In older obese adults, however, alterations of the temporal lobe are evident, suggesting a cognitive profile in obesity that may vary as a function of age. Moreover, although subcortical cognitive dysfunction is found in samples containing younger overweight and obese adults (Cournot et al., 2006; Gunstad et al., 2007; MacGregor et al., 2009), white matter lesions appear to be specific to older adult samples (Gustafson et al., 2004; Jagust et al., 2005). Varied findings support the possibility that age might moderate the relationship between BMI and neuropathology. This interaction might present a pattern of frontal-subcortical cognitive impairment that begins with milder cognitive slowing and progresses into more severe deficits in executive function with age.
The Current Study
The present cross-sectional study was designed to clarify the neurocognitive profile of obesity, including the role of aging processes in obesity-related neuropsychological dysfunction. Independent and interactive associations between BMI, age, and multiple domains of cognitive performance were examined in a sample of 732 adults ranging from normal weight to morbidly obese. We hypothesized that BMI would be independently associated with reduced neurocognitive performance and this association would increase in magnitude with age.
Method
Overview
Data for the current study were extracted from two existing databases: The Brain Resource International Database (BRID; Gordon, 2003a, 2003b) and a study ancillary to the Longitudinal Assessment of Bariatric Surgery (LABS) dataset (Gunstad et al., 2011). The BRID is a quality-controlled database that contains demographic, psychiatric, medical, and cognitive data for healthy individuals across the life span. The LABS dataset contains demographic, psychiatric, medical, and cognitive data for a series of morbidly obese bariatric surgical candidates and medically and demographically similar obese individuals who have elected not to undergo surgical intervention. Neurocognitive test data from each database were obtained from the same standardized and quality-controlled computerized neuropsychological test battery. These data were combined to form the current study sample.
Participants
Data extracted from the BRID included healthy adult participants who were recruited from the community surrounding six sites (New York, Rhode Island, Holland, London, Adelaide, and Sydney). Original BRID exclusion criteria included history of neurologic (e.g., traumatic brain injury, dementia), medical (e.g., hypertension, diabetes, cardiac disease, sleep apnea, thyroid disorder), and psychiatric (for example, schizophrenia, mood disorder, ADHD, substance use disorder; assessed with the Somatic and Psychological Health Report; Hickie, Davenport, Naismith, & Scott, 2007) conditions that are known to influence cognition performance and/or brain structure.
Data extracted from the LABS dataset included morbidly obese adult participants who were recruited from LABS sites, including medical centers in New York, NY and Fargo, ND. English-speaking adults who medically qualified for bariatric surgery were eligible to participate. Original LABS exclusion criteria included current sensory deficits and psychiatric/neurological conditions known to produce cognitive deficits independent of obesity or its related medical conditions (e.g., schizophrenia, stroke, head injury, dementia, mood disorder, alcohol/drug abuse). The Structured Clinical Interview for DSM–IV–TR Disorders (SCID-I/P; First, Spitzer, Gibbon, & Williams, 2002) was used to screen potential participants for psychiatric disorders. Although the LABS dataset includes postoperative/serial assessment of cognitive and medical functioning, only baseline data were examined in the present study.
The combined study sample consisted of 732 participants (61% women; age range 18–88; BMI range 19–75) who underwent standardized assessment of cognitive functioning and relevant medical/demographic covariates. To provide an estimate of the level of cognitive impairment in the present sample, test performance was compared with normative data. Approximately 2%–12% of the total sample performed < 1.5 SD below mean normative performance on at least one cognitive subtest (approximately 4% for executive function, 5%–9% for memory, 11%–12% for motor function, and 4% for language functioning). See Table 1 for demographic and medical characteristics of study participants separated by data source.
Table 1.
Descriptive Statistics [M (SD)] for Demographic and Medical Characteristics and Neurocognitive Composite Variables
| BRID (n = 580) | LABS (n = 152) | Combined (n = 732) | |
|---|---|---|---|
| Gender (% female)* | 55% | 84% | 61% |
| Age (years)* | 47.66 (18.00) | 43.45 (11.28) | 46.79 (16.91) |
| Education*a | 5.14 (1.46) | 5.37 (0.97) | 5.19 (1.38) |
| BMI (kg/m2)* | 25.84 (4.97) | 45.23 (6.91) | 29.86 (9.56) |
| Hypertension (%)* | 0% | 51% | 11% |
| Type 2 diabetes (%)* | 0% | 26% | 6% |
| Sleep apnea (%)* | 0% | 31% | 6% |
| Attention/Processing speed*b | −0.03 (0.61) | 0.11 (0.56) | |
| Executive function*b | 0.43 (0.94) | −0.16 (1.12) | |
| Motor function*b | 0.06 (0.88) | −0.31 (0.97) | |
| Languageb | 0.02 (0.84) | −0.06 (0.82) | |
| Memoryb | 0.01 (0.76) | −0.02 (0.74) |
Note.
denotes a significant (p < .05) difference between BRID and LABS groups.
Education units are measured on the following scale: 1 = Less than 7th grade, 2 = 7th–9th grade, 3 = some high school, 4 = high school diploma or GED, 5 = some college, 6 = Bachelors degree, 7 = graduate or professional degree.
Neurocognitive composite variables have been standardized within the current sample (i.e., z-scores: M = 0, SD = 1).
Procedures
All participants provided informed consent prior to participation and local institutional review boards provided study approval. At each site, participants were asked to provide information regarding medical and psychiatric history and undergo computerized neuropsychological assessment. Participants’ body weight and height were measured and BMI was calculated using the following formula: [weight in pounds/(height in inches)2] × 703. At all sites, the test battery was administered in a fixed order using prerecorded instructions and a touch-screen computer. Testing was monitored by trained research team members and took approximately 45–60 minutes to complete.
Measures
IntegNeuro (Gordon, 2003a, 2003b) was used to assess functioning in multiple cognitive domains. This computerized test battery allows for highly standardized test administration across sites and studies and has been shown to have strong psychometric properties. In terms of reliability, test scores in all cognitive domains show strong 4-week reproducibility and test stability is not moderated by age (Williams et al., 2005). In terms of validity, strong convergent and divergent evidence has been reported for the IntegNeuro cognitive battery in healthy adults, relative to paper-and-pencil measures typically used in clinical practice (Paul et al., 2005). Moreover, similar patterns of age-related performance changes were noted. Furthermore, tests scores produced from the IntegNeuro battery have differentiated lean and otherwise healthy obese persons in similar studies (Gunstad et al., 2006; Gunstad et al., 2007). Specific tests within the computerized battery are listed below, by cognitive domain.
Attention and Processing Speed
Digit span.
This test was used to assess basic auditory attention and working memory. Participants were presented with a series of digits on the touch-screen, separated by a 1-s interval, and then immediately asked to enter the digits on a numeric keypad on the touch-screen, first in forward sequence and then in reverse order. The total number of correct trials forward and backward served as dependent variables.
Choice reaction time.
This test was used to assess sustained performance and reaction time (RT). Participants attended to the computer screen as one of four circles was illuminated momentarily and were then asked to touch that circle as quickly as possible. Twenty trials were administered with a random delay between trials of 2–4 seconds. Mean RT served as the dependent variable.
Switching of attention.
This test is a computerized adaptation of the Trail Making Test (Reitan, 1958). Participants were presented with a pattern of 25 numbers in circles and asked to touch them in ascending order. Next, an array of 13 numbers (1–13) and 12 letters (A–L) was presented and participants were asked to touch numbers and letters alternately in ascending order. The first part of this test was used to assess psychomotor speed and visual scanning and the second part was used to assess set-shifting abilities. Time to completion (in seconds) of the two tests served as dependent variables.
Verbal interference.
This speeded test was used to assess the ability to inhibit automatic and irrelevant responses, similar to the Stroop task (Golden, 1978). Participants were presented with colored words one at a time. Below each colored word was a response pad with the four possible words displayed in black and in fixed format. First the subject was required to identify the name of each word as quickly as possible after it is presented on the screen. Next the subject was required to name the color of each word as quickly as possible. Each part lasted for one minute. The dependent variable was the ratio of words correctly identified between the two trials (Trial 2 divided by Trial 1).
Executive Function
Maze task.
This task is a computerized adaptation of the Austin Maze (Walsh, 1991). Participants were presented with a grid (8 × 8 matrix) of circles and asked to identify the hidden path through the grid. Distinct auditory and visual cues were presented for correct and incorrect responses. The trial ended when the subject completed the maze twice without error or after 10 minutes has elapsed. Dependent variables included the number of maze errors and maze overruns (i.e., perseverative errors).
Motor Function
Motor tapping.
Participants were asked to tap a circle on the touch-screen with their index finger as quickly as possible for 60 seconds. Total number of taps with the dominant and nondominant hand served as dependent variables.
Language
Letter fluency.
This test asked individuals to generate words beginning with a given letter of the alphabet for 60 seconds. A different letter was used for each of the three trials. Total number of correct words generated across the three trials served as the dependent variable.
Category fluency.
Participants were asked to generate as many animal names as possible for 60 seconds. Total number of correct words served as the dependent variable.
Memory
Verbal list-learning.
Participants were read a list of 12 words a total of four times and asked to recall as many words as possible following each trial. Following presentation and recall of a distraction list, participants were asked to recall words from the original list. After a 20-min filled delay, participants were again asked to recall target words. Finally, a recognition trial comprised of target words and foils was completed. Three dependent variables were generated from this task: Learning (Trial 4 minus Trial 1 Recall), Delayed Recall, and Discrimination (true positives minus false positives on the recognition trial).
Data Analyses
Preliminary data analyses included examination of distribution properties for all study variables and a series of steps including: (a) truncating extreme values to the equivalent of 3 SD from the mean (Choice Reaction Time and Verbal Interference), and (b) square root transformation of variables (Maze Errors and Maze Overruns), employed as appropriate to address violations of the assumptions of normality. The predictor variable BMI was some-what positively skewed; however, skewness and kurtosis statistics fell within a range that is commonly acceptable for an approximate normal distribution (skewness = 1.37, kurtosis = 1.51; Curran, West, & Finch, 1996). Confirmatory factor analyses were used to empirically support grouping of neuropsychological tests by cognitive domain. Raw scores were converted to z-scores and averaged into composite variables according to the resulting factor model. Primary data analyses included examination of bivariate associations between BMI, age, and neurocognitive test performance, followed by a series of hierarchical linear regression models (based upon ordinary least-squares regression) designed to examine the main and interactive effects of BMI and age in predicting each cognitive domain. Demographic and clinical variables known to independently impact cognition (that is, years of education and presence or absence of hypertension, Type 2 diabetes, and sleep apnea) were employed as covariates in order to explore independent effects of BMI on cognitive functioning across domains. Independent age effects on cognition were examined within each analysis and these results are presented in Table 5; however, the present study did not focus on presumed age effects on cognitive function.
Table 5.
Main Effects of Age and BMI on Neurocognitive Composite Variables Controlling for Education, Hypertension, Type 2 Diabetes, and Sleep Apnea (n = 732)
| Age | BMI | |||||
|---|---|---|---|---|---|---|
| B | SE | β | B | SE | β | |
| Attention/Processing speed | −.021*** | .001 | −.595 | −.005* | .002 | −.074 |
| Executive function | −.20*** | .002 | −.342 | −.009 | .004 | −.083 |
| Motor function | −.009*** | .002 | −.176 | −.015** | .004 | −.154 |
| Language | −.009*** | .002 | −.172 | −.006 | .004 | −.063 |
| Memory | −.014*** | .002 | −.316 | −.002 | .003 | −.020 |
p < .05.
p < .01.
p < .001.
Results
Neurocognitive Composite Variables
The original model for neurocognitive composite variables included five domains. Tests were grouped by the primary cognitive domain that each is purported to measure, based on theory and supporting neuropsychological assessment literature (see Lezak, 1995). The first domain was comprised of tests tapping attention and processing speed: Digit Span Forward, Digit Span Backward, Choice Reaction Time, and Switching of Attention: Part 1. The second domain was comprised of tests tapping executive functioning: Maze Errors, Maze Overruns, Verbal Interference, and Switching of Attention: Part 2. The third domain was comprised of tests tapping motor functioning: Motor Tapping: Dominant Hand and Motor Tapping: Nondominant Hand. The fourth domain was comprised of tests tapping language functioning: Letter Fluency and Category Fluency. The fifth domain was comprised of tests tapping memory abilities: Learning, Delayed Recall, and Discrimination.
Confirmatory factor analyses (CFA) were run in Mplus 5.21. Parameters were estimated via maximum likelihood, as all variables met criteria for univariate normality. The hypothesized five-factor model did not fit the data well (χ2 = 608.74, df = 80, p < .001, CFI = .86, TLI = .82, RMSEA = .095, 90% CI [.088, .102], SRMR = .077, BIC = 27,386.53). Modification indices were consulted for potential respecification of the model, and these indicated that model fit would be improved if Switching of Attention: Part 2 and Verbal Interference were moved to the Attention/Processing Speed factor rather than the Executive Function factor. This respecification resulted in good model fit (χ2 = 263.98, df = 80, p < .001, CFI = .95, TLI = .94, RMSEA = .056, 90% CI [.049, .064], SRMR = .044, BIC = 27,041.76). Table 2 displays CFA results for the respecified model.
Table 2.
Standardized Model Results for Confirmatory Factor Analyses of Neurocognitive Test Variables
| λ | p | |
|---|---|---|
| Attention/Processing speed | ||
| Switching of attention Part 1 | .730 | <.001 |
| Switching of attention Part 2 | .829 | <.001 |
| Choice reaction time | .429 | <.001 |
| Verbal interference | .330 | <.001 |
| Digits forward | .352 | <.001 |
| Digits backward | .457 | <.001 |
| Executive Function | ||
| Maze errors | .979 | <.001 |
| Maze overruns | .963 | <.001 |
| Motor function | ||
| Motor tapping dominant hand | .845 | <.001 |
| Motor tapping nondominant hand | .635 | <.001 |
| Language | ||
| Letter Fluency | .524 | <.001 |
| Category fluency | .783 | <.001 |
| Memory | ||
| Learning | .324 | <.001 |
| Delayed recall | .848 | <.001 |
| Discrimination | .636 | <.001 |
The respecified five-factor model was also tested for invariance of factor loadings across men and women. A model in which parameters were allowed to be freely estimated was compared with a model in which parameters were fixed to be equal for both genders. The more restrictive model did not have significantly worse fit relative to the freely estimated model (Δχ2 = 6.02, df = 10, p = .814), suggesting model invariance across the genders.
The favored five-factor model resulted in a conceptually indicated and statistically supported grouping of neuropsychological tests by broad cognitive domain, which retained the original labels: Attention/Processing Speed, Executive Function, Motor Function, Language, and Memory. Results of CFA supported slight modification of the proposed groupings; however, this modification makes sense conceptually, in light of the speeded nature of the two tasks that were moved from Executive Function to Attention/Processing Speed (see Table 2). Intercorrelations among factors demonstrated distinct groupings (all rs < .63) and met conceptually based expectations (see Table 3).
Table 3.
Correlations Among Neurocognitive Domain Factors
| Attention/Processing speed | Executive function | Motor function | Language | Memory | |
|---|---|---|---|---|---|
| Attention/Processing speed | 1.00 | ||||
| Executive function | .59 | 1.00 | |||
| Motor function | .39 | .36 | 1.00 | ||
| Language | .62 | .39 | .36 | 1.00 | |
| Memory | .51 | .56 | .21 | .52 | 1.00 |
Note. All ps < .05.
Preliminary Analyses
Examination of zero-order correlations confirmed that age was inversely associated with each cognitive factor (age and Attention/Processing Speed r = −.62; age and Executive Function r = −.38; age and Motor Function r = −.17; age and Language r = −.23; age and Memory r = −.36; all ps < .001). Also as expected, education was positively associated with each cognitive factor (education and Attention/Processing Speed r = .28; education and Executive Function r = .22; education and Language r = .26; education and Memory r = .23; all ps < .001), with the exception of Motor Function (r = .03, p = 43).
Zero-order correlation analyses revealed significant associations between BMI and Motor Function (r = −.18, p < .001) and Executive Function (r = −.11, p < .01), but no other cognitive factor. These effects were similar after controlling for age and education (rs of −.18 and −.12, respectively). See Table 4 for full results of partial correlation analyses of BMI, neurocognitive, and medical variables.
Table 4.
Partial Correlations Between BMI, Medical Conditions, and Neurocognitive Test Performance Controlling for Age and Education (n = 732)
| BMI | Hypertension | Type 2 diabetes | Sleep apnea | |
|---|---|---|---|---|
| Attention/Processing speed | −.03 | .05 | −.01 | .04 |
| Executive function | −.12** | −.09* | −.12** | −.06 |
| Motor function | −.18*** | −.12** | −.15*** | −.08* |
| Language | −.07 | −.03 | −.06 | −.05 |
| Memory | −.07 | −.07 | −.09* | −.09* |
p < .05.
p < .01.
p < .001.
Main and Interactive Effects of Age and BMI on Neurocognitive Performance
Attention/processing speed.
Results of a hierarchical multiple regression analysis predicting Attention/Processing Speed from age and BMI while controlling for education, hypertension, Type 2 diabetes, and sleep apnea revealed significant overall model fit, R2 = .41, F(6, 725) = 82.74, p < .001. As expected, increased age significantly predicted poorer Attention/Processing Speed (β = −.60), and the addition of BMI to the model significantly improved overall model fit (ΔR2 = .003, Fchange = 4.16, p = .04). Higher BMI independently predicted poorer Attention/Processing Speed performance (β = −.07). See Table 5 for a depiction of main effects for all cognitive domains. Post hoc analyses of BMI main effects on individual tasks within the composite variable revealed a significant effect for only Digit Span Forward (β = −.16, p = .001).
The addition of an Age × BMI interaction term did not significantly improve model fit (ΔR2 = .001, Fchange = 0.87, p = .35), indicating that there was no Age × BMI interaction effect on attention and processing speed.
Executive function.
Results of a hierarchical multiple regression analysis predicting Executive Function from age and BMI while controlling for education, hypertension, Type 2 diabetes, and sleep apnea revealed significant overall model fit, R2 = .17, F(6, 725) = 25.14, p < .001. As expected, increased age significantly predicted poorer Executive Function (β = −.34), but BMI was not an independent predictor of Executive Function in this sample. The improvement to overall model fit with the addition of BMI failed to reach statistical significance (ΔR2 = .004, Fchange = 3.73, p = .054). The addition of an Age × BMI interaction term significantly improved model fit (ΔR2 = .005, Fchange = 4.30, β = −.08, p = .04), indicating an Age × BMI interaction on executive functioning, with higher BMI and age associated with poorer executive functioning. See Figure 1 for a graphical illustration of this interaction. Post hoc analyses of interaction effects on individual tasks within the composite variable revealed a significant age × BMI interaction effect for Maze Overruns (β = −.09, p = .04), but not for Maze Errors.
Figure 1.
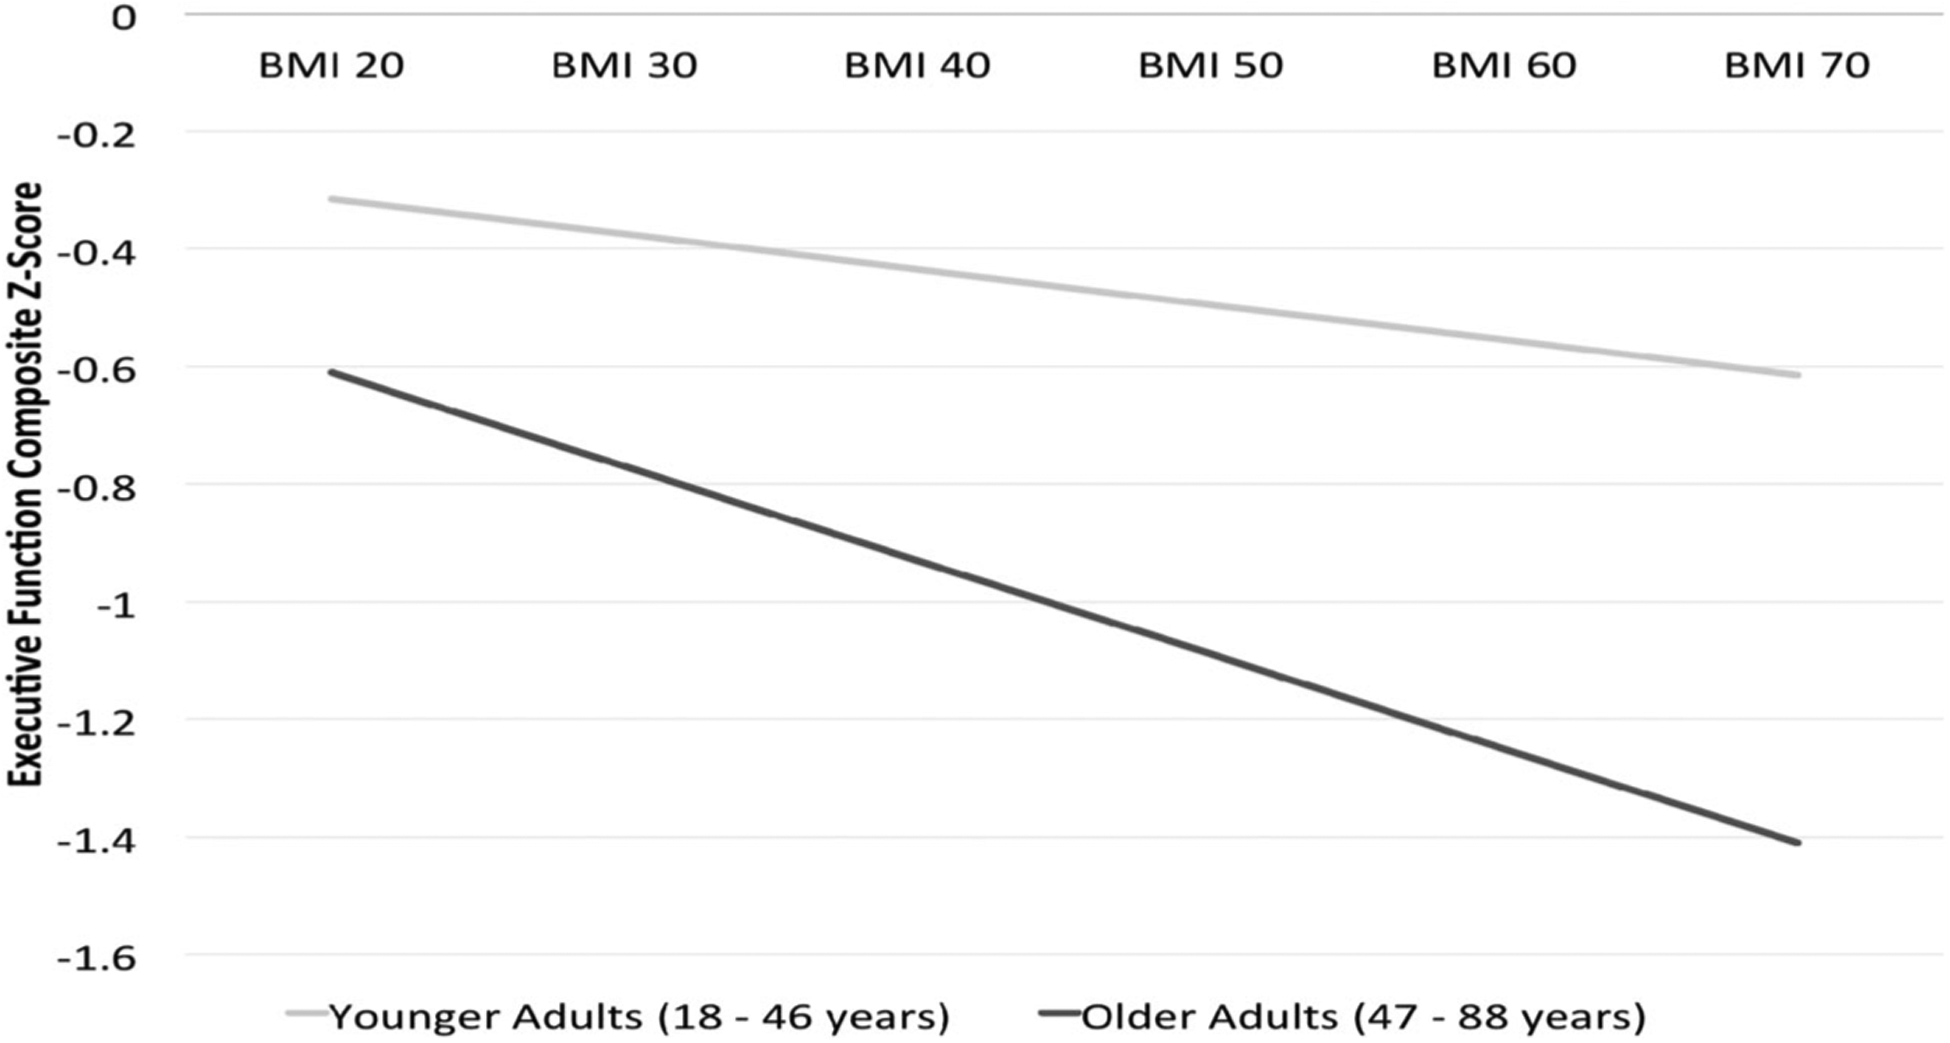
Graphical Representation of BMI × Age Interaction on Executive Function. Plot of the BMI × Age interaction effect on Executive Function in 732 adults (ΔR2 = .005, Fchange = 4.30, β = −.08, p = .04). A median split at 47 years of age was employed to classify the sample into younger adult (β = −.07, p = .26, n = 371) and older adult (β = −.14, p = .05, n = 361) groups for illustrative purposes. x-axis = BMI; y-axis = Executive Function (z-scores).
Motor function.
Results of a hierarchical multiple regression analysis predicting Motor Function from age and BMI while controlling for education, hypertension, Type 2 diabetes, and sleep apnea revealed significant overall model fit, R2 = .07, F(6, 725) = 8.95, p < .001. As expected, increased age significantly predicted poorer Motor Function (β = −.18, p < .001), and the addition of BMI to the model significantly improved overall model fit (ΔR2 = .02, Fchange = 11.39, p = .001). Higher BMI independently predicted poorer Motor performance (β = −.15). Post hoc analyses of BMI main effects on individual tasks within the composite variable revealed significant effects for both dominant (β = −.17, p < .001), and nondominant (β = −.12, p = .01) motor tapping performance. The addition of an Age × BMI interaction term did not significantly improve model fit (ΔR2 = 0, Fchange = 0.02, p = .88), indicating that there was no Age × BMI interaction effect on motor functioning.
Language.
Results of a hierarchical multiple regression analysis predicting Language from age and BMI while controlling for education, hypertension, Type 2 diabetes, and sleep apnea revealed significant overall model fit, R2 = .10, F(6, 725) = 13.82, p < .001. Increased age significantly predicted poorer Language performance (β = −.17). The addition of BMI to the model did not improve overall model fit (ΔR2 = .002, Fchange = 1.98, p = .16), indicating that BMI was not an independent predictor of Language. The addition of an Age × BMI interaction term also did not improve model fit (ΔR2 = 0, Fchange = 0.10, p = .76), indicating that there was no Age × BMI interaction on language functioning.
Memory.
Results of a hierarchical multiple regression analysis predicting Memory from age and BMI while controlling for education, hypertension, Type 2 diabetes, and sleep apnea revealed significant overall model fit, R2 = .15, F(6, 725) = 21.91, p < .001. Increased age significantly predicted poorer Memory performance (β = −.32). However, the addition of BMI to the model did not improve overall model fit (ΔR2 = 0, Fchange = 0.21, p = .65), indicating that BMI did not independently predict Memory performance. The addition of an Age × BMI interaction term did not significantly improve model fit (ΔR2 = .004, Fchange = 3.03, p = .08), indicating that there was no Age × BMI interaction on memory functioning.
Discussion
Results of the current study indicate that BMI was independently associated with decreased attention, processing speed, and fine motor speed across the adult life span. BMI was not independently related to executive dysfunction; however, a significant Age × BMI interaction emerged, suggesting that obesity-related executive deficits increased with age. Overall, these findings extend current understanding of the neurocognitive profile of obesity and may provide insight into the possible neuropathological processes underlying obesity-related cognitive dysfunction.
The current findings provide support for a frontal-subcortical pattern of cognitive dysfunction in obesity, suggesting an adverse effect on frontal brain regions and/or frontal-subcortical circuitry, which provides signaling loops between prefrontal cortical areas and deeper brain structures (Cummings, 1993). Importantly, these effects were statistically significant after controlling for the confounding effects of aging and comorbid disease processes. Further work is needed to examine this possibility, particularly work involving direct examination of subcortical pathways in longitudinal/prospective designs.
The current findings also provide support for an interaction between age and BMI-related processes on neurocognitive function. Specifically, a statistically significant interaction emerged between age and BMI on executive functioning, suggesting that the negative correlation between BMI and executive abilities increases with advancing age. This finding is consistent with past work (Gunstad et al., 2010) and may help in explaining the various cognitive profiles that have emerged across previous studies that have sampled from different age groups (Fergenbaum et al., 2009; Gunstad et al., 2007; MacGregor et al., 2009). As stated, similar neurocognitive and structural brain changes occur in obesity and normal aging and it is possible that this interaction represents the additive cognitive effects of these two distinct processes in obese individuals.
White Matter and Obesity-Related Cognitive Dysfunction
The classificatory term white matter typically refers to bundles of myelin-coated (i.e., lipoprotein) axons, which conduct neural impulses among cortical and subcortical gray matter regions, as well as the microvasculature surrounding and sustaining these fiber bundles (Filley, 2001). Many disease processes (e.g., multiple sclerosis, leukoencephalitis, microvascular disease) ultimately impact psychomotor and processing speed through functional or structural disruption of white matter via ischemic injury, toxin exposure, or inflammation and demyelination (Gold, Kovari, Hof, Bouras, & Giannakopoulos, 2007). One process implicated in normal aging is microvascular damage, likely mediated by endothelial dysfunction (Gates, Strain, & Shore, 2009). Functional disruption of the endothelial cell layer, which lines blood vessels and can be disrupted via multiple age-related mechanisms, can lead to inflammatory processes, dysregulation of vasodilatation and vasoconstriction, and atherosclerosis, which are all implicated in vascular disease (Esper et al., 2006).
The process by which obesity affects white matter function is not yet clear and does not appear to be readily visualized using conventional neuroimaging techniques, as there has been little evidence for white matter hyperintensities or volume loss in previous MRI studies in obesity. In fact, regional white matter volume has been shown to expand in younger obese adults and to decrease following diet-induced weight loss (Haltia et al., 2007). However, metabolic alterations indicative of white matter disruption in younger obese adults have also been demonstrated (Gazdzinski et al., 2008). Possible explanations for both white matter expansion and functional disruption include abnormal lipid accumulation as well as increased cellular water content (Haltia et al., 2007), which has been shown in other clinical populations (i.e., multiple sclerosis) to result from inflammation in white matter that otherwise appears normal on MRI (Wegner, Smith, & Matthews, 2004).
Although histopathologic research is needed to more fully appreciate the nature of white matter abnormalities in obesity, recent DTI studies provide evidence for microstructural abnormalities within the white matter that interact with aging processes (Stanek et al., 2010; Mueller et al., 2011), possibly resulting in the neurocognitive pattern demonstrated in the present study. Specifically, an age-independent, inverse association between BMI and fractional anisotropy, a measure of white matter integrity, was demonstrated in otherwise healthy adults along with a significant interaction effect between BMI and age on the microstructural integrity of specific white matter tracts (i.e., corpus callosum, fornix; Stanek et al., 2011).
Although this is only one speculative interpretation, these findings can be taken in sum to be consistent with the hypothesis that elevated BMI and/or adiposity throughout the life span exerts an independent effect on white matter integrity and function throughout the brain, resulting in attentional and motor slowing. In addition, elevated BMI may also make frontal-subcortical circuitry in particular more vulnerable to age-related microangiopathy, resulting in compounding pathology and executive dysfunction that is magnified by aging. Future neuropsychological research should be aimed at mapping the phenotypic expression (i.e., specific neurocognitive profile) of obesity and age-related mechanisms onto white matter abnormalities within an obese sample.
It is also possible that obesity duration or obesity severity may prove to be a more important factor than an interaction between obesity and aging in the neurocognitive profile suggested by the current findings. Notably, both attentional and executive dysfunctions have been observed in severely obese adolescents (Lokken, Boeka, Austin, Gunstad, & Harmon, 2009), suggesting the proclivity for frontal-subcortical dysfunction progressing from mental and motor slowing to higher order executive deficits may not be due to age. Rather, there may be an additional explanatory factor for the hypothesized predisposition of frontal-subcortical circuits to obesity-related dysfunction or a more complicated interaction between obesity duration and severity of obesity. Longitudinal data are needed to address these questions.
Limitations
The current findings and resulting conclusions must be interpreted in light of several limitations. Importantly, the current study only examined neurocognitive function, and discussion of potential mechanisms can only be speculative. Furthermore, the cross-sectional design of the present study limits interpretation of cognitive findings, especially in regards to causal links and mechanisms. Future studies are needed to elaborate on the evolving neurocognitive profile demonstrated in the current study. These should involve longitudinal observation of cognitive and structural brain abnormalities in obesity as well quasi-experimental studies to explore the neurocognitive consequences of weight change as well as corresponding physiological changes. Moreover, longitudinal studies are needed to address the issue of causality in the relationship between neurocognitive functioning and elevated BMI.
Mechanistic interpretations are also limited due to the limited information available regarding potential and preclinical risk for dementia in the current sample, which included adults up to 88 years of age. Despite exclusion criteria including previously diagnosed neurological/cognitive disorder, the current design did not involve strict exclusion of individuals with mild cognitive impairment (MCI) based on cognitive testing and clinical interview. Although many of the older adults in the current sample were members of the healthy participant group (the oldest participant in the LABS group was 66), it is possible that some portion of the sample may have been experiencing undiagnosed mild cognitive impairment or even a clinically undetectable prodromal stage of neurodegenerative disorder—although not diagnostic, up to 12% of the sample did perform at least 1.5 standard deviations below the mean of a normative sample on at least one cognitive subtest. This possibility might confound hypotheses made regarding the mechanisms for cognitive dysfunction related to BMI in this sample in several ways. Recent studies have demonstrated associations between midlife BMI and other components of the metabolic syndrome and risk for Alzheimer’s disease (Profenno, Porsteinsson, & Faraone, 2010), and also revealed evidence for more direct links between morbid obesity and Alzheimer’s-type neuropathology in the brains of deceased older adults, including obesity-related differences in the expression of tau protein and amyloid-β precursor protein (Mrak, 2009). Future studies are needed to determine the role of such pathological processes in associations between BMI and cognitive performance across the adult life span—a role that is likely to be complex. Studies that examine APOE genotypes in addition to cognitive and BMI status might be particularly valuable in investigating the mechanisms underlying the BMI by age interaction on executive functioning demonstrated in the current study. Additionally, prodromal stages of dementia are known to be associated with weight-loss prior to dementia diagnosis (Johnson, Wilkins, & Morris, 2006). Both late-life weight loss and sarcopenia, the loss of muscle mass specifically, are potentially confounding factors that should be directly addressed in future work. Future studies that specifically examine the potential moderating effect of sex may also help us to better understand the complexity of these relationships.
The current sampling method allowed for a wide range of age and BMI to address study hypotheses and increase generalizability of results; however, the strict exclusion criteria of the BRID (i.e., common medical and psychological conditions) may have produced a sample that was qualitatively different from the LABS sample in other ways. For instance, although we did statistically control for the presence of hypertension, diabetes, and sleep apnea in the LABS sample, the healthy BRID sample might also differ in other ways; they may be more physically fit, more health conscious, or less prone to physical and/or mental fatigue. These potential differences are difficult to statistically control and, thus, complicate interpretation of results by way of statistical artifacts.
Future studies that examine multiple obesity indices are also needed. Although BMI often functions as the gold standard in measurement of obesity, this particular index does not differentiate lean muscle mass from fat mass and may not provide an optimal measure of adiposity, particularly in healthy, nonobese adults or in elderly individuals with sarcopenia. Additionally, increasing evidence points to a distinction between the neurocognitive effects of elevated BMI and abdominal adiposity (Waldstein & Katzel, 2006). These disadvantages have led to a recent proposal of a novel measurement of body fat calculated from hip circumference and height measurements (Bergman et al., 2011), which may prove to be better related to neurocognitive functioning. Future studies should incorporate multiple obesity indices to more fully explore adiposity-related cognitive changes.
Multiple indices of executive functioning should also be examined in relation to obesity indices in future studies. Interpretation of the current findings is limited by the fact that only a single test of executive functioning was ultimately incorporated into the composite index—the Maze Task. Although it was hypothesized that Switching of Attention: Part 2 (thought to assess set-shifting) and Verbal Interference (thought to assess cognitive inhibition) would comprise the executive function composite index alongside Maze errors (thought to assess planning and nonverbal problem-solving) and Maze overruns (thought to assess perserveration), CFA results indicated that performance on the former two measures was a better fit for the factor conceptualized as an attention/processing speed index. The examination of other, nonspeeded measures designed to tap into additional facets of executive functioning (potentially including measures of verbal abstraction, reasoning, and concept formation, among others) would allow for a more comprehensive examination of executive dysfunction, including investigation of the possibility that various facets of executive functioning may be differentially associated with obesity. Similarly, the examination of multiple alternative operationalizations of other cognitive domains in the future might lead to a fuller understanding of the cognitive profile of obesity.
Conclusions
In summary, results of the current study indicated direct associations between elevated BMI and reduced attention and fine motor speed, as well as an interaction between age and BMI on executive functioning. These findings suggest important clinical implications for assessment, treatment, and management of obesity. The cognitive dysfunction associated with obesity may be modest, particularly in otherwise healthy individuals, as suggested by effect sizes that tend to range from small to moderate in the literature (e.g., Boeka & Lokken, 2008; Gunstad et al., 2007; the magnitude of effects in the current study was small). However, even mild dysfunction on objective cognitive tests administered in a structured environment may translate into more substantive difficulties in daily living (Lezak, 1995). For instance, individuals with poor planning, slowed processing, and reduced self-monitoring are likely to experience everyday difficulties in adhering to complex medication regimes or to weight-loss or health maintenance strategies. Consistent with this notion, recent work has found that executive function and memory performance predicted the amount of weight lost 12 months after bariatric surgery (Spitznagel et al., 2011). Such findings highlight the contribution of even subtle cognitive dysfunction to obesity-related outcomes, even in persons undergoing weight loss surgery.
Much more research is needed regarding the functional implications of reduced cognitive abilities in obesity to aid in the development and/or optimization of preventative and treatment strategies for obese individuals of various ages, as well as to more fully appreciate the psychological impact of obesity-related brain changes. Similarly, increased understanding of the specific mechanisms underlying these changes may eventually reduce the societal impact of this epidemic.
Acknowledgments
We acknowledge the data and support provided by BRAINnet (www.BRAINnet.net) under the governance of the BRAINnet Foundation. BRAINnet is the scientific network that coordinates access to the Brain Resource International Database for independent scientific purposes. We also thank the individuals who gave their time to participate in the database. We are also grateful to Martin Sellbom for statistical support. Data collection supported by DK075119. Article supported in part by HL089311.
Contributor Information
Kelly M. Stanek, University of Alabama
Gladys Strain, Weill Cornell Medical College.
Michael Devlin, Columbia University Medical Center.
Ronald Cohen, University of Florida College of Medicine and University of Florida Institute on Aging.
Robert Paul, University of Missouri-St. Louis.
John Gunstad, Kent State University and Summa Health System, Akron, Ohio.
References
- Adams KF, Schatzkin A, Harris TB, Kipnis V, Mouw T, Ballard-Barbash R, … Leitzmann MF (2006). Overweight, obesity, and mortality in a large prospective cohort of persons 50 to 71 years old. The New England Journal of Medicine, 355, 763–778. doi: 10.1056/NEJMoa055643 [DOI] [PubMed] [Google Scholar]
- Bergman RN, Stefanovski D, Buchanan TA, Sumner AE, Reynolds JC, Sebring NG, …Watanabe RM (2011). A better index of body adiposity. Obesity. Advanced online publication. doi: 10.1038/oby.2011.38 [DOI] [PMC free article] [PubMed] [Google Scholar]
- Boeka AG, & Lokken KL (2008). Neuropsychological performance of a clinical sample of extremely obese individuals. Archives of Clinical Neuropsychology, 23, 467–474. doi: 10.1016/j.acn.2008.03.003 [DOI] [PubMed] [Google Scholar]
- Brickman AM, Zimmerman ME, Paul RH, Grieve SM, Tate DF, Cohen RA, …Gordon E (2006). Regional white matter and neuropsychological functioning across the lifespan. Biological Psychiatry, 60, 444–453. doi: 10.1016/j.biopsych.2006.01.011 [DOI] [PubMed] [Google Scholar]
- Charlton RA, Schiavone F, Barrick TR, Morris RG, & Markus HS (2010). Diffusion tensor imaging detects age related white matter change over a 2 year follow-up which is associated with working memory decline. Journal of Neurology, Neurosurgery, and Psychiatry, 81, 13–19. doi: 10.1136/jnnp.2008.167288 [DOI] [PubMed] [Google Scholar]
- Cournot M, Marquié JC, Ansiau D, Martinaud C, Fonds H, Ferrières J, & Ruidavets JB (2006). Relation between body mass index and cognitive function in healthy middle-aged men and women. Neurology, 67, 1208–1214. doi: 10.1212/01.wnl.0000238082.13860.50 [DOI] [PubMed] [Google Scholar]
- Cserjési R, Luminet O, Poncelet AS, & László L (2009). Altered executive function in obesity. Exploration of the role of affective states on cognitive abilities. Appetite, 52, 535–539. doi: 10.1016/j.appet.2009.01.003 [DOI] [PubMed] [Google Scholar]
- Cummings JL (1993). Frontal-subcortical circuits and human behavior. Archives of Neurology, 50, 873–880. doi: 10.1001/archneur.1993.00540080076020 [DOI] [PubMed] [Google Scholar]
- Curran PJ, West SG, & Finch JF (1996). The robustness of test statistics to nonnormality and specification error in confirmatory factor analysis. Psychological Methods, 1, 16–29. doi: 10.1037/1082-989X.1.1.16 [DOI] [Google Scholar]
- de Lusignan S, Hague N, van Vlymen J, Dhoul N, Chan T, Thana L, , & Kumarapeli P (2006). A study of cardiovascular risk in overweight and obese people in England. European Journal of General Practice, 12, 19–29. doi: 10.1080/13814780600757260 [DOI] [PubMed] [Google Scholar]
- Esper RJ, Nordaby RA, Vilariño JO, Paragano A, Cacharrón JL, & Machado RA (2006). Endothelial dysfunction: A comprehensive appraisal. Cardiovascular Diabetology, 5, 4. [DOI] [PMC free article] [PubMed] [Google Scholar]
- Fergenbaum JH, Bruce S, Lou W, Hanley AJ, Greenwood C, & Young TK (2009). Obesity and lowered cognitive performance in a Canadian first nations population. Obesity, 17, 1957–1963. doi: 10.1038/oby.2009.161 [DOI] [PubMed] [Google Scholar]
- Filley CM (2001). The behavioral neurology of white matter. New York, NY: Oxford. [Google Scholar]
- First MB, Spitzer RL, Gibbon M, & Williams JBW (2002). Structured clinical interview for DSM-IV-TR Axis I disorders, research version, patient edition. (SCID-I/P) New York, NY: Biometrics Research, New York State Psychiatric Institute. [Google Scholar]
- Gates PE, Strain WD, Shore AC (2009). Human endothelial function and microvascular ageing. Experimental Physiology, 94, 311–316. doi: 10.1113/expphysiol.2008.043349 [DOI] [PubMed] [Google Scholar]
- Gazdzinski S, Kornak J, Weiner MW, & Meyerhoff DJ (2008). Body mass index and magnetic resonance markers of brain integrity in adults. Annals of Neurology, 63, 652–657. doi: 10.1002/ana.21377 [DOI] [PMC free article] [PubMed] [Google Scholar]
- Gold G, Kovari E, Hof PR, Bouras C, & Giannakopoulos P (2007). Sorting out the clinical consequences of ischemic lesions in brain aging: A clinicopathological approach. Journal of the Neurological Sciences, 257, 17–22. [DOI] [PubMed] [Google Scholar]
- Golden C (1978). Stroop color and word task: A manual for clinical and experimental uses. Wood Dale, IL: Stoelting. [Google Scholar]
- Gordon E (2003a). Integrative neuroscience. Neuropsychopharmacology, 28, .S2–S8. doi: 10.1038/sj.npp.1300136 [DOI] [PubMed] [Google Scholar]
- Gordon E (2003b). Integrative neuroscience in psychiatry: The role of a standardized database. Australasian Psychiatry, 11, 156–163. doi: 10.1046/j.1039-8562.2003.00533.x [DOI] [Google Scholar]
- Gunstad J, Lhotsky A, Wendell CR, Ferrucci L, & Zonderman AB (2010). Longitudinal examination of obesity and cognitive function: Results from the Baltimore Longitudinal Study of Aging. Neuroepidemiology, 34, 222–229. [DOI] [PMC free article] [PubMed] [Google Scholar]
- Gunstad J, Paul RH, Cohen RA, Spitznagel M, Tate D, Grieve S, & Gordon E (2008). Relationship between body mass index and brain volume in healthy adults. International Journal of Neuroscience, 118, 1582–1593. doi: 10.1080/00207450701392282 [DOI] [PubMed] [Google Scholar]
- Gunstad J, Paul RH, Cohen RA, Tate DF, & Gordon E (2006). Obesity is associated with memory deficits in young and middle-aged adults. Eating and Weight Disorders, 11, e15–e19. [DOI] [PubMed] [Google Scholar]
- Gunstad J, Paul RH, Cohen RA, Tate DF, Spitznagel MB, & Gordon E (2007). Elevated body mass index is associated with executive dysfunction in otherwise healthy adults. Comprehensive Psychiatry, 48, 57–61. doi: 10.1016/j.comppsych.2006.05.001 [DOI] [PubMed] [Google Scholar]
- Gunstad J, Strain G, Devlin MJ, Wing R, Cohen RA, Paul RH, … Mitchell JE (2011). Improved memory function 12 weeks after bariatric surgery. Surgery for Obesity and Related Diseases, 7, 465–472. [DOI] [PMC free article] [PubMed] [Google Scholar]
- Gustafson DR, Rothenberg E, Blennow K, Steen B, & Skoog I (2003). An 18-year follow-up of overweight and risk of Alzheimer disease. Archives of Internal Medicine, 163, 1524–1528. doi: 10.1001/archinte.163.13.1524 [DOI] [PubMed] [Google Scholar]
- Gustafson DR, Steen B, & Skoog I (2004). Body mass index and white matter lesions in elderly women. An 18-year longitudinal study. International Psychogeriatrics, 16, 327–336. doi: 10.1017/S1041610204000353 [DOI] [PubMed] [Google Scholar]
- Haltia LT, Viljanen A, Parkkola R, Kemppainen N, Rinne J, Nuutila P, … Kassinen V (2007). Brain white matter expansion in human obesity and the recovering effect of dieting. Journal of Clinical Endocrinology & Metabolism: Clinical and Experimental, 92, 3278–3284. doi: 10.1210/jc.2006-2495 [DOI] [PubMed] [Google Scholar]
- Hassing LB, Dahl AK, Thorvaldsson V, Berg S, Gatz M, Pedersen NL, & Johansson B (2009). Overweight in midlife and risk of dementia: A 40-year follow-up study. International Journal of Obesity, 33, 893–898. doi: 10.1038/ijo.2009.104 [DOI] [PMC free article] [PubMed] [Google Scholar]
- Hickie IB, Davenport TA, Naismith SL, & Scott EM (2001). SPHERE: A national depression project. SPHERE National Secretariat. Medical Journal of Australia, 175, S4–S5. [DOI] [PubMed] [Google Scholar]
- Jagust W, Harvey D, Mungas D, & Haan M (2005). Central obesity and the aging brain. Archives of Neurology, 62, 1545–1548. doi: 10.1001/archneur.62.10.1545 [DOI] [PubMed] [Google Scholar]
- Johnson DK, Wilkins CH, & Morris JC (2006). Accelerated weight loss may precede diagnosis in Alzheimer disease. Archives of Neurology, 63, 1312–1317. doi: 10.1001/archneur.63.9.1312 [DOI] [PubMed] [Google Scholar]
- Joshi AV, Day D, Lubowski TJ, & Ambegaonkar A (2005). Relationship between obesity and cardiovascular risk factors: Findings from a multi-state screening project in the United States. Current Medical Research and Opinion, 21, 1755–1761. doi: 10.1185/030079905X65231 [DOI] [PubMed] [Google Scholar]
- Kivipelto M, Ngandu T, Fratiglioni L, Viitanen M, Kåreholt I, Winblad B, … Nissinen A (2005). Obesity and vascular risk factors at midlife and the risk of dementia and Alzheimer disease. Archives of Neurology, 62, 1556–1560. doi: 10.1001/archneur.62.10.1556 [DOI] [PubMed] [Google Scholar]
- Lezak MD (1995). Neuropsychological assessment (3rd ed.). New York, NY: Oxford. [Google Scholar]
- Lokken KL, Boeka AG, Austin HM, Gunstad J, & Harmon CM (2009). Evidence of executive dysfunction in extremely obese adolescents: A pilot study. Surgery for Obesity and Related Diseases, 5, 547–552. doi: 10.1016/j.soard.2009.05.008 [DOI] [PubMed] [Google Scholar]
- MacGregor KL, Fonken L, Robottom M, Hyunh M, & Jorgensen R (2009, April). Body mass index is associated with neuropsychological performance in college students. Paper presented at the annual meeting of the Society of Behavioral Medicine, Montreal, Quebec. [Google Scholar]
- Mrak RE (2009). Alzheimer-type neuropathological changes in morbidly obese individuals. Clinical Neuropathology, 28, 40–45. [DOI] [PubMed] [Google Scholar]
- Mueller K, Anwander A, Moller HE, Horstmann A, Lepsien J, Busse F, … Plegar B (2011). Sex-dependent influences of obesity on cerebral white matter investigated by diffusion-tensor imaging. PLoS One, 6, e18544. [DOI] [PMC free article] [PubMed] [Google Scholar]
- Ogden CL, Yanovski SZ, Carroll MD, & Flegal KM (2007). The epidemiology of obesity. Gastroenterology, 132, 2087–2102. doi: 10.1053/j.gastro.2007.03.052 [DOI] [PubMed] [Google Scholar]
- Pannacciulli N, Del Parigi A, Chen K, Le DNT, Reiman EM, & Tataranni PA (2006). Brain abnormalities in human obesity: A voxel-based morphometric study. NeuroImage, 31, 1419–1425. doi: 10.1016/j.neuroimage.2006.01.047 [DOI] [PubMed] [Google Scholar]
- Paul R, Lawrence J, Williams W, Richards CC, Cooper N, & Gordon E (2005). Preliminary validity of Integneuro™: A new computerized battery of neurocognitive tests. International Journal of Neuroscience, 115, 1549–1567. doi: 10.1080/00207450590957890 [DOI] [PubMed] [Google Scholar]
- Profenno LA, Porsteinsson AP, & Faraone SV (2010). Meta-analysis of Alzheimer’s disease risk with obesity, diabetes, and related disorders. Biological Psychiatry, 67, 505–512. doi: 10.1016/j.biopsych.2009.02.013 [DOI] [PubMed] [Google Scholar]
- Raz N (2000). Aging of the brain and its impact on cognitive performance: Integration of structural and functional findings. In Craik FIM & Salthouse TA (Eds.), The handbook of aging and cognition (pp. 1–91). Mahwah, NJ: Lawrence Erlbaum Associates. [Google Scholar]
- Reitan R (1958). Validity of the Trail Making Test as an indicator of organic brain damage. Perceptual and Motor Skills, 8, 271–276. doi: 10.2466/PMS.8.7.271-276 [DOI] [Google Scholar]
- Sabia S, Kivimaki M, Shipley MJ, Marmot MG, & Singh-Manoux A (2009). Body mass index over the adult life course and cognition in late midlife: The Whitehall II Cohort Study. American Journal of Clinical Nutrition, 89, 601–607. doi: 10.3945/ajcn.2008.26482 [DOI] [PMC free article] [PubMed] [Google Scholar]
- Salthouse TA, Atkinson TA, & Berish DE (2003). Executive functioning as a potential mediator of age-related cognitive decline in normal adults. Journal of Experimental Psychology: General, 132, 566–594. doi: 10.1037/0096-3445.132.4.566 [DOI] [PubMed] [Google Scholar]
- Spitznagel MB, Garcia S, Miller LA, Strain G, Devlin M, Wing R, … Gunstad J (2011). Cognitive function predicts weight loss after bariatric surgery. Advance online publication. Surgery for Obesity and Related Diseases. doi: 10.1016/j.soard.2011.10.008 [DOI] [PMC free article] [PubMed] [Google Scholar]
- Stanek KM, Grieve SM, Brickman AM, Korgaonkar MS, Paul R, Cohen R, & Gunstad J (2011). Obesity is associated with reduced white matter integrity in otherwise healthy adults. Obesity, 19, 500–504. doi: 10.1038/oby.2010.312 [DOI] [PubMed] [Google Scholar]
- Taki Y, Kinomura S, Sato K, Inoue K, Goto R, Okada K, … Fukuda H (2008). Relationship between body mass index and gray matter volume in 1,428 healthy individuals. Obesity, 16, 119–124. doi: 10.1038/oby.2007.4 [DOI] [PubMed] [Google Scholar]
- Volkow ND, Wang GJ, Telang F, Fowler JS, Goldsein RZ, Alia-Klein N, … Pradhan K (2009). Inverse association between BMI and prefrontal metabolic activity in healthy adults. Obesity, 17, 60–65. doi: 10.1038/oby.2008.469 [DOI] [PMC free article] [PubMed] [Google Scholar]
- Waldstein SR, & Katzel LI (2006). Interactive relations of central versus total obesity and blood pressure to cognitive function. International Journal of Obesity, 30, 201–207. [DOI] [PubMed] [Google Scholar]
- Walsh K (1991). Understanding brain damage (2nd Ed.). Edinburgh, UK: Churchill Livingstone. [Google Scholar]
- Ward MA, Carlsson CM, Trivedi MA, Sager MA, & Johnson SC (2005). The effect of body mass index on global brain volume in middle-aged adults: A cross sectional study. BMC Neurology, 5, 23. doi: 10.1186/1471-2377-5-23 [DOI] [PMC free article] [PubMed] [Google Scholar]
- Webber J (2001). The comorbidities of obesity. Practical Diabetes International, 18, 293–296. doi: 10.1002/pdi.274 [DOI] [Google Scholar]
- Wegner C, Smith S, & Matthews PM (2004). Measuring and interpreting white matter volume changes in multiple sclerosis. In Filippi M, Comi G & Rovaris M (Eds.), Normal-appearing white and grey matter damage in multiple sclerosis (pp. 23–36). New York: Springer. [Google Scholar]
- Whitmer RA, Gunderson EP, Barrett-Connor E, Quesenberry CP, & Yaffe K (2005). Obesity in middle age and future risk of dementia: A 27 year longitudinal population based study. British Medical Journal, 330, 1360–1362. doi: 10.1136/bmj.38446.466238.E0 [DOI] [PMC free article] [PubMed] [Google Scholar]
- Whitmer RA, Gunderson EP, Quesenberry CP, Zhou J, & Yaffe K (2007). Body mass index in midlife and risk of Alzheimer disease and vascular dementia. Current Alzheimer Research, 4, 103–109. doi: 10.2174/156720507780362047 [DOI] [PubMed] [Google Scholar]
- Williams L, Simms E, Clark C, Paul RH, Rowe D, & Gordon E (2005). The test-retest reliability of a standardized neurocognitive and neurophysiological test battery: “Neuromarker”. International Journal of Neuroscience, 115, 1605–1630. doi: 10.1080/00207450590958475 [DOI] [PubMed] [Google Scholar]
- Wolf PA, Beiser A, Elias MF, Au R, Vasan RS, & Seshadri S (2007). Relation of obesity to cognitive function: Importance of central obesity and synergistic influence of concomitant hypertension. The Framingham Heart Study. Current Alzheimer Research, 4, 111–116. doi: 10.2174/156720507780362263 [DOI] [PubMed] [Google Scholar]
- Yoshita M, Fletcher E, Harvey D, Ortega M, Martinez O, Mungas DM, & Reed BR (2006). Extent and distribution of white matter hyperintensities in normal aging, MCI, and AD. Neurology, 67, 2192–2198. doi: 10.1212/01.wnl.0000249119.95747.1f [DOI] [PMC free article] [PubMed] [Google Scholar]
- Zimmerman ME, Brickman AM, Paul RH, Grieve SM, Tate DF, Gunstad J, … Gordon E (2006). The relationship between frontal gray matter volume and cognition varies across the healthy adult lifespan. The American Journal of Geriatric Psychiatry, 14, 823–833. doi: 10.1097/01.JGP.0000238502.40963.ac [DOI] [PubMed] [Google Scholar]