

Abstract

Nanoporous carbons (NPCs) are ideal materials for the dry process of flue gas desulfurization (FGD) due to their rich pore structure and high specific surface area. To study the effect of edge-functionalized NPCs on the physisorption mechanism of sulfur dioxide, different functional groups were embedded at the edge of NPCs, and the physisorption behavior was simulated using the grand canonical Monte Carlo method (GCMC) combined with density functional theory (DFT). The results indicated that the insertion of acidic oxygenous groups or basic nitrogenous groups into NPCs could enhance the physisorption of SO2. The influence of edge functionalization on the pore structure of NPCs is also analyzed. To further explore the interaction in the adsorption process, the van der Waals (vdW) interaction and electrostatic interaction between the SO2 molecule and the basic structural unit (BSU) were investigated. Simulated results showed that edge functionalization had limited influence on vdW interaction and did not significantly change the distribution characteristics of vdW interaction. According to the study on electrostatic interaction, edge functionalization was found to promote inhomogeneity of the surface charge of the adsorbent, enhance the polarity of the adsorbent, and thus enhance the physisorption capacity of SO2. More importantly, we provide an idea for studying the difference in adsorption capacity caused by different functional groups connected to carbon adsorbents.
1. Introduction
SO2 gas is one of the major gaseous pollutants in China and other developing countries.1 It mainly comes from fossil fuel emissions in thermal power plants and industrial processes. Without the flue gas desulfurization (FGD) process, it may cause acid rain and other natural disasters. According to a study of 74 cities in China, SO2 concentrations declined from 39.9 to 17.0 μg/m3 in 2013–2017 with FGD and coal utilization restrictions.2 Considering the serious consequences of SO2 emissions, how to effectively carry out the FGD is still an important research direction.3−7
Conventional FGD materials are mostly based on the ability of alkaline adsorbents to capture acidic gases, such as sodium hydroxide aqueous solution, limestone–gypsum, etc. However, the above conventional materials have some drawbacks, mainly the difficulty to recycle, probability of causing corrosion of the pipeline, and easy production of liquid or solid wastes. Economical and environmentally friendly FGD materials are of great significance for the energy conservation policy, environmental protection, and resource reuse, so the development of a new adsorbent has attracted wide interest. Some new adsorption materials, such as activated carbon, waste concrete powder (WCP), metal–organic frameworks (MOFs), carbon nanotubes (CNTs), porous aromatic frameworks (PAFs), etc., are considered for the adsorption of SO2.4,8−15 Compared with conventional adsorption materials, nanoporous carbons (NPCs) have attracted wide attention due to their higher specific surface area, more developed nanopores, lower preparation cost, and more stable adsorption efficiency. By comparing the correlation between saturated sulfur capacity of carbon materials and pore volume of different pore sizes, Sun et al.16 believed that micropores with the high specific surface area were beneficial to physisorption of SO2. Liu et al.17 measured the specific surface area of carbon materials by the Brunauer–Emmett–Teller (BET) method and found that the adsorption performance of carbon materials with a specific surface area less than 700 m2/g was mainly affected by their physical structures. On the other hand, the effect of embedding different functional groups in carbon materials on the removal of SO2 in flue gas was studied.
Notably, many researchers have found that adding proper functional groups to NPCs improves the ability to capture gases.18−21 For example, Raymundo-Piñero et al.19 found that the embedding of nitrogenous functional groups, especially pyridine nitrogen functional groups, could enhance the adsorption of acidic SO2 gas through experiments. Sun et al.20 found that the role of nitrogen doping is to change the local electron density of carbon materials, the polarity of carbon atoms, and the charge distribution of the carbon surface, which resulted in enhanced adsorption of SO2. Maurya et al.21 determined the effect of functional groups on the selective adsorption of SO2 in different compositions of SO2/N2. Note that Kandagal22 studied the effect of functional groups on the binding of methane by combining ab initio calculations and classical Monte Carlo simulations; the results showed that specific site functionalization could have a significant impact on the local adsorption characteristics. Additionally, some literature studies point out the edge-functional groups can significantly enhance gas binding, making the edges have more potential binding sites in materials containing high concentrations of edge carbon.23−25 Zhou et al.25 pointed out that edge functionalization could effectively improve the pore structure and morphological characteristics of NPCs in the investigation of the competitive adsorption of nanoporous carbon, indicating that the embedding position of functional groups had a significant impact on gas adsorption. However, the effect of edge-functional groups on NPCs for SO2 adsorption has not been studied to the best of our knowledge.
Accurate numerical simulation on a small scale helped the abovementioned researchers to investigate the microscopic nature that was difficult to explore through experimental methods. The GCMC method can give the adsorption isotherm of the material on the macroscopic scale, but it is still necessary to explore the deeper adsorption mechanism by employing quantum chemistry on the microscopic scale. Combining the GCMC method with DFT to study the structure and properties of materials will provide a way to explore the mechanism that affects physisorption.26
The main content of this paper revolves around the influence of edge-functionalized NPCs on the physisorption of SO2. We construct the structure of this study in the following steps: (1) construct a BSU of edge-functionalized NPCs, optimize its structure by DFT, and then carry out the GCMC simulation to predict the physisorption capacity of edge-functionalized NPCs for SO2; (2) calculate the pore parameters of NPCs and then study the effects of electrostatic interaction and vdW interaction on SO2 adsorption. The effects of electrostatic interaction and vdW interaction between the adsorbate and adsorbent on physisorption capacity are then evaluated by the energy decomposition method.
2. Computational Methods
As shown in Figure 1, the BSU of nonfunctionalized NPCs is constructed using coronene-shaped graphene. Four functional groups, hydrogen (−H), hydroxyl (−OH), amine (−NH2), and carboxyl (−COOH), are embedded at the edge of the BSU, respectively. Lu et al.27 indicated that these four functional groups could effectively enhance the gas adsorption capacity of NPCs. The results of geometric optimization analysis of BSUs show a low sensitivity for the selection of the basis set. The B3LYP hybrid function was selected for geometric optimization of carbon materials in previous studies.27,28 Therefore, the B3LYP hybrid function and 6-31G(d,p) basis set are selected to implement the geometric optimization of edge-functionalized BSUs.
Figure 1.

Hydrogen (−H), hydroxyl (−OH), amine (−NH2), and carboxyl (−COOH) are, respectively, modified on 12 carbon atoms at the edge of coronene-shaped graphene to form BSUs with different functional groups.
Electrostatic potential (ESP) analysis is a very effective method to reveal the electrostatic interaction among molecules. In the molecular system, ESP is defined as
| 1 |
where the two terms Vnuc(r) and Velec(r) represent the contributions of the nucleus and electrons, respectively; RA and r denote coordinates of nucleus A and the point charge, respectively; ZA is the charge of nucleus A and ρ(r′) is the electron density of the molecular system at the point r′.29
The van der Waals interaction and electrostatic interaction can be considered as complementary relations in the analysis of weak interactions. Following ESP, we defined vdW potential as
| 2 |
where Vrepul(r) and Vdisp(r) denote exchange-repulsion potential and dispersion-attraction potential in vdW potential, respectively, and RA and r denote nuclear coordinates of atoms A and B.30 Employing the geometric combination rule, the εAB (potential well) and RAB0 (equilibrium distance) terms are evaluated as
| 3 |
| 4 |
The above atomic nonbonded parameters are taken from the universal force field (UFF).31
By plotting ESP and vdW potential distributions, we can intuitively describe the electrostatic and vdW interaction characteristics of BSUs, which is conducive for us to get a general understanding of the weak interaction characteristics among study objects. The ESP and vdW potential analyses are carried out in Multiwfn.32 VMD software is employed for visualization of the obtained results.33
The stable configuration of a single SO2 molecule adsorbed on the BSU is set to the gas-framework interaction model. Symmetry adapted perturbation theory (SAPT) and the DFT method are widely adopted to analyze weak interactions.34−36 We divide the possible adsorption sites of BSU into edge sites and basal planes. The edge sites are located near the embedded functional groups of the BSU, and the molecules adsorbed on edge sites are approximately at the same level as the BSU. The basal planes are located in an area parallel to the level of the BSU.
Geometric optimization of adsorption configurations is at the B3LYP-D3/def2-SVP level. The conventional B3LYP hybrid function is not accurate in calculating dispersion in the research system, so it is necessary to increase the accuracy of the calculation using the B3LYP-D3 hybrid function with dispersion correction.37 In addition, the use of def2-SVP improved by adding polarization function based on def2-SV ensures the reliability of the calculation results.38
The weak interaction energy between the SO2 molecule and the BSU is decomposed into electrostatic interaction and vdW interaction in PSI4 code.39 The induction also belongs to the weak interaction energy, but its contribution in the physisorption process is generally less than the dispersion effect. The electrostatic and vdW interactions are mainly analyzed in this study without consideration of the effect of induction.40
For the construction of NPCs, the commonly used models are the slit-like pore model and the coronene-shaped graphitic BSU random structure model.41 The latter has successfully predicted the adsorption performance of NPCs for gas, and the calculated adsorption amount is in good agreement with the experimental results.42 Although this model is random, realizations of this structure can be constructed by different placements of the BSU, and the results (for the same density) appear to have nothing to do with the placement details.41 As far as this study is concerned, there is another advantage in choosing the random structure model; that is, the functional groups can be easily embedded in the BSU to form various modified NPC frameworks. NPCs are assumed as simulation boxes with periodic boundary conditions. By setting the density of all simulation boxes to 0.542 g/cm3, the number of BSUs added to the simulation boxes can be obtained by
| 5 |
where Mi represents the quality of a single BSU. The length of simulation boxes is between 30 and 45 Å to ensure the accuracy and efficiency of the calculation.43 After all of the parameters of the structure are determined, the Monte Carlo algorithm is used to continuously optimize the structure, and the simulation box with the lowest energy and the most stable state is obtained finally. All of the NPC modeling was carried out by Packmol software.44
To optimize the packing of NPC structures, we adopted the Monte Carlo method. First, we randomly placed the BSUs in the simulation box at 298 K. Then, BSUs will perform a Monte Carlo-type movement in the box to produce a new structure. We can thus calculate the acceptance probability of this new structure
| 6 |
Enew is the potential energy of the new structure and Eold is the potential energy of the old structure. k is the Boltzmann constant and T is the temperature. If Enew is greater than Eold, the new structure is accepted, otherwise rejected. Repeating these operations 10 000 times, we can finally get the optimized simulation box.
Every single simulation box consists of a set of BSUs as shown in Figure 2. The physisorption process in every single simulation box is simulated by the GCMC method. The Peng–Robinson equation of the state is chosen to calculate the gas-phase density and experimental fugacity.45
Figure 2.

(a) A series of BSUs. (b) NPCs-None, (c) NPCs-H, (d) NPCs-OH, (e) NPCs-NH2, and (f) NPCs-COOH are simulation boxes composed of corresponding BSUs.
Table 1 shows the parameter settings in the GCMC simulation. In addition, adsorbate molecules are inserted, deleted, reinserted, rotated, and moved at the same probability in each step.
Table 1. Parameter Settings for GCMC.
SO2 is modeled as a rigid molecule with three charged LJ interaction sites. The LJ potential parameters and atomic partial charge were reported by Potoff.48 For NPC frameworks, we use the rigid model. Information of LJ potential parameters was taken from the UFF.31 For the atomic partial charge of NPCs, generally speaking, the RESP charge is the most reliable method to calculate the charge. Multiwfn software is used to calculate the RESP charge of NPCs (see Figure S1 and Table S1).32 In summary, the atomic LJ potential parameters and atomic partial charges are shown in Table 2.
Table 2. Atomic LJ Potential Parameters and Partial Atomic Charges of Adsorbents and Adsorbates.
| gas
molecule models |
NPCs |
|||||
|---|---|---|---|---|---|---|
| atom | S(SO2) | O(SO2) | C | H | O | N |
| ε (K) | 73.80 | 79.00 | 29.13 | 22.12 | 34.72 | 34.75 |
| σ (Å) | 3.39 | 3.05 | 3.40 | 2.57 | 3.12 | 3.26 |
| Q (e) | +0.59 | –0.29 | ||||
All of the interaction parameters conform to the Lorentz–Berthelot (LB) mixing rule, which is defined as
| 7 |
| 8 |
It is worth noting that some researchers believed that the involvement of O2 and H2O would affect the adsorption of SO2 and found that the adsorption type can be approximately considered to be dominated by physisorption under anaerobic and anhydrous conditions.49,50 In this study, O2 and H2O are not added in the GCMC simulation to maintain that physisorption dominates the adsorption process. Ensuring the accuracy of the GCMC simulation, which is only applicable to systems with physisorption, the simulation of GCMC is carried out by RASPA2 software, and the simulation results are plotted as absolute adsorption isotherms.51
Parameters such as accessible surface area and available pore volume are obtained using the Düren and Sarkisov methods.52,53 The calculation method of the accessible surface area can be simply described as follows: the probe molecule rolls on the adsorbent framework, and the center position of the probe molecule is marked to obtain the trajectory around the entire adsorbent framework and then the accessible surface area is calculated as
| 9 |
| 10 |
where σ is the sum of the diameter of the adsorbent atom and the diameter of the probe atom, f is the fraction of the probe atom without overlapping points with other atoms in the structure, and the total accessible surface area Aabs is given by the sum of a single area ai related to each atom of the adsorbent.
The available pore volume is calculated by the Monte Carlo method. The probe molecule is randomly inserted into the porous material at first, and then the effectiveness of successful insertion is judged. If the interaction energy between the probe molecule and the adsorbent is negative, the insertion is effective. After repeating the insertions, the available pore volume is calculated as
| 11 |
where N is the total number of insertions, Nsuccess is the number of successful insertions, Nadsorbent is the total volume of adsorbent, V is the available pore volume of porous materials, and the Poreblazer software is employed to calculate the above pore parameters.54
3. Results and Discussion
3.1. Absolute Adsorption Isotherms
Maurya et al. studied the adsorption of pure SO2 on a bilayer graphene nanoribbon (GNRs) with different functional molar percentages at 303 K.21 As shown in Figure 3, we also calculated the excess adsorption isotherms of SO2 at 303 K and compared the results with those reported by Maurya et al.21
Figure 3.

Simulation results (this work and the report of Maurya et al.) of excess adsorption isotherms of SO2 at 303 K in carbon-based materials modified by (a) H, (b) OH, (c) NH2, and (d) COOH functional group, respectively.21
There is a minor difference in excess adsorption isotherms as shown in Figure 3. In addition to the differences in the model, we believe that the difference in the functional mole percentage can also cause a slight difference in the results. Obviously, for NPCs-OH, NPCs-NH2, and NPCs-COOH, the functional molar percentage is much larger than that of the materials reported by Maurya et al., which is one of the reasons why the adsorption is greater in the present work.21 In addition, Maurya et al. ignored the atomic charges of graphene.21 Compared with our work, the electrostatic interaction between adsorbate and adsorbent is smaller, which may lead to a smaller adsorption capacity. Of course, the force field parameters will also affect the simulation results, but in general, our results are roughly consistent with the results of previous reports of Maurya et al., which has proved the reliability of our method.21
By independently analyzing the absolute adsorption isotherms using the GCMC simulation at different temperatures, it can be found that the adsorption amount of SO2 in edge-functionalized NPCs decreases with the increase of temperature in Figure 4. It is generally believed that chemisorption is caused by the formation of chemical bonds between molecules, and the adsorption rate increases with the increase of temperature. Physisorption is caused by the weak intermolecular force, and the adsorption amount decreases with the increase of temperature. In summary, under the parameters of GCMC set in this study, physisorption is the main adsorption type. In addition, we can estimate the desorption temperature roughly according to the simulation results. When the temperature reaches 373 K, the adsorption capacity of SO2 is very small, and high desorption efficiency can be obtained theoretically. Determination of more accurate desorption temperatures needs repeated experiments.
Figure 4.

Absolute adsorption isotherms of SO2 in edge-functionalized NPCs at different temperatures (293, 313, and 373 K): (a) NPCs-None, (b) NPCs-H, (c) NPCs-OH, (d) NPCs-NH2, and (e) NPCs-COOH.
From the comparison of absolute adsorption isotherms of different edge-functionalized NPCs, the SO2 adsorptions of NPCs-OH, NPCs-NH2, and NPCs-COOH are remarkably higher than those of NPCs-H and NPCs-None, indicating that the physisorption capacity of NPCs for SO2 has been significantly enhanced by the modification of acidic oxygenous groups and basic nitrogenous groups at the edge of NPCs. Furthermore, it is found that the SO2 physisorption capacity of edge-functionalized NPCs follows the sequence: NPCs-NH2 > NPCs-COOH > NPCs-OH > NPCs-H. Figure S2 shows the number of adsorbed molecules versus cycles to illustrate that the systems have been sufficiently equilibrated. To ensure that all of the temperature and pressure conditions in the simulation are sufficiently equilibrated, we plotted the number of adsorbed molecules versus cycles as shown in Figure S2 (T = 298 K and P = 220 kPa).
The equilibrium configuration snapshots of SO2 gas at 10 kPa were provided in Figure 5 to further understand the gas distribution adsorbed on edge-functionalized NPCs. First, we find that most of the initial adsorption of SO2 occurs at the edge of the BSUs. In addition, edge functionalization enables some SO2 to be adsorbed near BSUs. In other words, adsorption active sites are added to the region where SO2 molecules cannot be absorbed in the past.
Figure 5.

Snapshots of (a) SO2 in (b) NPCs-None, (c) NPCs-H, (d) NPCs-OH, (e) NPCs-NH2, and (f) NPCs-COOH at T = 298 K and P = 10 kPa.
3.2. Pore-Size Distributions
Pore parameters have a great influence on the adsorption capacity of materials. Structure parameters used to evaluate pores are (1) available pore volume, (2) accessible surface area, (3) pore limiting diameter (DL) and maximum pore diameter (DM), (4) porosity, Φ (%), (5) pore-size distributions (PSDs).55 It is worth noting that the reported results are single realization of the optimized simulation box (Table 3).
Table 3. Pore Parameters with Different Functional Groups (Gas Probe Molecule = SO2).
| NPCs-None | NPCs-H | NPCs-OH | NPCs-NH2 | NPCs-COOH | |
|---|---|---|---|---|---|
| number of BSUs | 50 | 50 | 50 | 50 | 30 |
| dimensions (Å3) | 35.303 | 35.803 | 42.303 | 41.903 | 42.403 |
| available pore volume (cm3/g) | 1.25 | 1.28 | 1.34 | 1.40 | 1.33 |
| accessible surface area (m2/g) | 3516.24 | 3226.12 | 3312.96 | 3426.73 | 3462.18 |
| DL (Å) | 15.60 | 19.04 | 19.17 | 18.37 | 17.25 |
| DM (Å) | 20.31 | 22.36 | 24.30 | 27.06 | 24.48 |
| porosity, Φ (%) | 70.98 | 70.18 | 76.44 | 71.99 | 76.57 |
Compared with NPCs-None (1.25 cm3/g), the presence of −H (1.28 cm3/g), −OH (1.34 cm3/g), −NH2 (1.40 cm3/g), and −COOH (1.33 cm3/g) functional groups leads to the enlargement of the available pore volume. The changing trend of the available pore volume is the same as that of DL, DM, and porosity (Φ). In fact, by ignoring some other factors, the density of each model is the same, so the larger the functional groups connected, the less number of filled molecules (with the same volume), and as the distance between each molecule becomes longer, the pore size becomes larger.
The accessible surface area of all of the frameworks is within the range of activated and hypothetical high-surface-area carbons (2000–4600 m2/g), which is larger than that of carbon nanotubes (153–1315 m2/g).56,57 Compared with NPCs-None (3516.24 m2/g), the accessible surface area (3226.12–3462.18 m2/g) of NPCs with functional groups is slightly reduced. In general, the introduction of functional groups makes the available pore volume and pore size of NPCs expand, but it reduces the accessible surface area of NPCs. By analyzing the PSDs shown in Figure 6, the change of pore size can be further verified.
Figure 6.

PSDs of NPCs with different functional groups: (a) PSDs of NPCs-None, (b) PSDs of NPCs-H, (c) PSDs of NPCs-OH, (d) PSDs of NPCs-NH2, and (e) PSDs of NPCs-COOH.
Figure 6 shows that both NPCs-None and NPCs-H fall within the range of pore size of 15–23 Å, exhibiting a fairly dense pore structure. The PSDs of NPCs-OH (19–24.50 Å) and NPCs-COOH (17–24.50 Å), although estimated with different functional groups, exhibit similar pore sizes, indicating that they all have isolated large pores with broad PSDs. Particularly, NPCs-NH2 is within a pore-size range of 18–27.50 Å, with the broadest PSDs and the largest isolated pore.
3.3. Van der Waals Potential
The isosurface map and the color-filled plane map of the vdW potential of this system are shown in Figure 7. The region close to the BSU is fully enclosed by a green isosurface, indicating that the exchange-repulsion potential dominates the vdW potential in this area. The blue isosurface above and below the BSU indicates that the dispersion-attraction potential dominates the vdW potential in this area.
Figure 7.

vdW potential distribution of BSUs; the different types of figures on the left and right are the isosurface map and the color-filled plane map, respectively. In the isosurface map, green represents positive value and blue represents negative value. The color scale is in kcal/mol. Ar is chosen as the probe atom. (a) BSU-None, (b) BSU-H, (c) BSU-OH, (d) BSU-NH2, and (e) BSU-COOH.
As shown in Figure 7, the distribution of vdW potential for different BSUs is compared, and it is found that the region of dispersion attractive potential dominating vdW potential generally distributes in the basal planes of the BSU, and the strength of the vdW potential does not change significantly. In summary, the effect of edge functionalization on vdW potential is trivial, and the embedding of functional groups has a limited effect on the distribution and strength of the vdW potential.
It is generally believed that vdW interaction represents the weak interaction between two atoms of electrical neutrality, and the most direct relationship with the vdW potential is the geometric structure of the system, while the embedding of functional groups does not significantly change the geometric structure of the BSU. Consequently, the change of vdW potential distribution and strength is not obvious. In summary, edge functionalization has limited influence on the distribution and strength of the vdW potential of the BSU. In other words, the influence of vdW potential is not the main reason why edge-functionalized NPCs can improve the physisorption capacity of SO2.
3.4. SAPT Calculations
Figure 8 shows the decomposition of adsorption energy between BSUs and SO2 molecules. EvdW represents vdW interactions and Eele represents the electrostatic interactions. It is found that the EvdW (basal planes: 0.1000–9.1568 kcal/mol, edge sites: 1.4588–48.9754 kcal/mol) of the BSUs is positive in Figure 8a, which indicates the exchange-repulsion is the dominant factor in vdW interactions. Comparing the EvdW between the basal planes and edge sites, we find that the EvdW of edge sites is larger than that of the basal planes except for the NPCs without edge functionalization. In other words, SO2 molecules adsorbed on edge sites are affected by the larger vdW potential after edge functionalization, which is not conducive to adsorption.
Figure 8.

Components of the interaction energy between BSU and the SO2 molecule obtained from SAPT calculations: (a) vdW interaction between BSU and the SO2 molecule and (b) electrostatic interaction between BSU and the SO2 molecule.
On the other hand, the Eele (basal plane: −0.2124 to −13.8384 kcal/mol, edge sites: −2.7505 to −42.1327 kcal/mol) of the BSUs is negative in Figure 8b. Similarly, we further compare the Eele between the basal planes and edge sites, and it is found that the Eele of edge sites is larger than that of the basal planes, except for the NPCs without edge functionalization. That is to say, the SO2 molecules adsorbed on edge sites are affected by the larger electrostatic potential, which is favorable to adsorption.
Figure 8a,b shows similar trends, indicating that there is a certain correlation between van der Waals interaction and electrostatic interaction. Combining with the vdW potential distribution of the BSU, it is found that due to the enhancement of electrostatic interaction, the adsorption position of SO2 molecules may be closer to the BSU, causing it to go deeper into the vdW positive potential region.
Compared with the Eele (basal planes: −7.7899 to −13.8384 kcal/mol, edge sites: −8.4679 to −42.1327 kcal/mol) of other types of edge-functionalized BSUs, the Eele (basal planes: −4.0614 kcal/mol, edge sites: −2.7505 kcal/mol) of NPCs-None BSU and the Eele (basal planes: −0.2124 kcal/mol, edge sites: −5.5599 kcal/mol) of NPCs-H BSU are smaller, indicating that NPCs-None and NPCs-H restricted adsorption sites for SO2 molecules and their adsorption capacities are weaker. This conclusion is consistent with the results of the low adsorption amount of NPCs and NPCs-H in GCMC simulations.
By comparing the electrostatic interactions at all positions of the five adsorbents, it is found that the electrostatic interaction at the edge of NPCs-NH2 BSU is the strongest, which is about 15 times stronger than that of the NPCs-None BSU. This finding also adequately explains the results of the maximum adsorption amount of NPCs-NH2 in the GCMC simulation. By comparing the electrostatic interaction between NPCs-COOH and NPCs-OH, it is found that the former is stronger than the latter in both the basal planes and edge sites, which also explains that the adsorption capacity follows the sequence NPCs-COOH > NPCs-OH in the GCMC simulation.
In summary, edge-functionalized NPCs enhance the electrostatic effect on SO2 molecules and supplement the adsorption active sites, and the enhancement of the electrostatic effect is positively correlated with the adsorption amount of SO2.
In addition, we used Multiwfn software to calculate the total adsorption energy under the UFF force field. Figure 9a shows the total adsorption energy obtained from SAPT calculations, Figure 9b shows the total adsorption energy calculated based on the universal force field (UFF), and some differences cannot be ignored in the quantitative analysis of Figure 9a,b. The main reason is that the calculation based on the force field is subject to the simple function form of the force field, and its accuracy is still different from that of the DFT-based calculation. Importantly, the rankings of various BSUs’ adsorption capacities based on force field calculations are generally consistent with the DFT-based calculations, demonstrating the effectiveness of the force field and atomic charge we choose.
Figure 9.
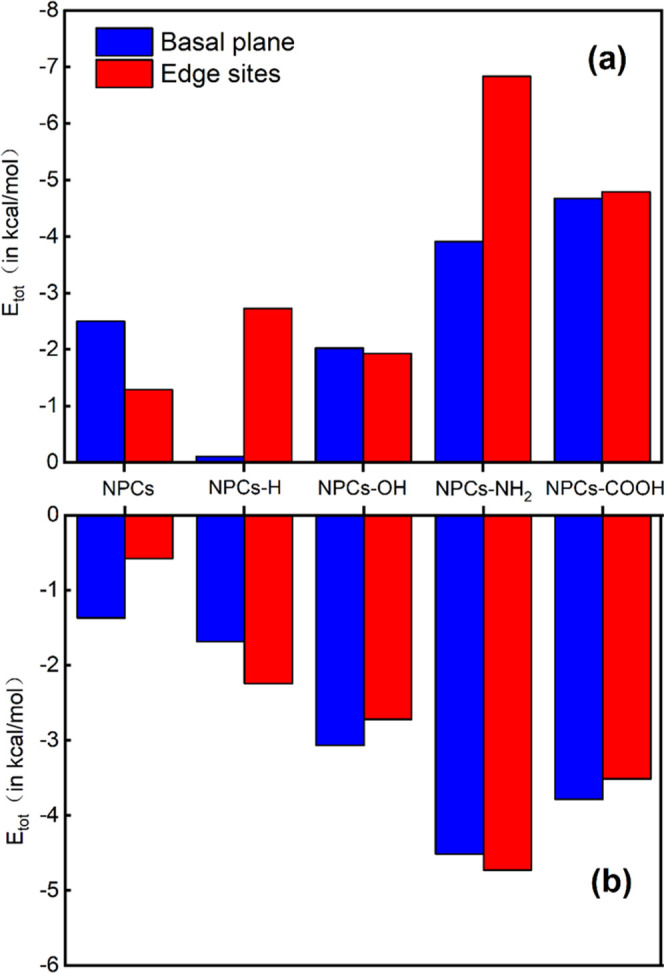
Total adsorption energy between BSUs and SO2 molecule: (a) total adsorption energy obtained from SAPT calculations and (b) total adsorption energy based on the universal force field (UFF).
3.5. Electrostatic Potential (ESP)
According to the above study, we find it necessary to investigate how edge functionalization causes changes in electrostatic interaction. We perform ESP analysis on the vdW surface with an electron density of 0.001 au (0.63 kcal/mol).58
As shown in Figure 10, the ESP of the whole surface of the BSU without edge functionalization is close to zero, and the charge distribution is relatively uniform. However, the ESP of the whole surface of the edge-functionalized BSU significantly deviates from zero, and the charge distribution is relatively nonuniform. We also find that the ESP on the surface of the H atom is generally positive and that on the surface of the O and N atoms is generally negative. The ESP on the surface of the SO2 molecule shows that the electrostatic potential on the surface of the O atom is negative and that on the surface of the S atom is positive. The electron distribution on the surface of the molecule is nonuniform, which could be regarded as a polar molecule.
Figure 10.

Distribution of ESP on the vdW surface with an electron density (ρ) of 0.001 au (0.63 kcal/mol). The color scale is given in kcal/mol. (a) BSU-None, (b) BSU-H, (c) BSU-OH, (d) BSU-NH2, (e) BSU-COOH, and (f) SO2.
To quantify the influence of edge functionalization on the polarity of BSUs, we calculated the molecular polarity index (MPI) of different BSUs, which is defined as
| 12 |
where A refers to the whole area of the vdW surface of the molecular system and V(r) is the value of the electrostatic potential at a point position r in space. The integration is carried out on the whole molecular vdW surface (S).59
Figure 11a shows the MPI of different BSUs. It is found that the MPI (3.5431 kcal/mol) of the BSU without edge functionalization is relatively small. The MPI (8.3623 kcal/mol) after embedding hydrogen and the MPI (8.0821 kcal/mol) after embedding hydroxyl increased by nearly four times, and the MPI (15.5773 kcal/mol) after embedding amino and the MPI (15.4510 kcal/mol) after embedding carboxyl increased by nearly six times, indicating that edge functionalization is very significant for the enhancement of the polarity of BSUs.
Figure 11.

(a) Molecular polarity index (MPI) of BSUs with different functional groups, (b) average strength and size of the positive electrostatic potential regions, and (c) average strength and size of the negative electrostatic potential regions.
It is worth noting that the MPI after embedding hydrogen and the MPI after embedding hydroxyl are approximately equal, indicating that both polarities are of little difference. However, the adsorption capacity for SO2 follows the sequence of NPCs-OH > NPCs-H from the results of the GCMC simulation, indicating that the adsorption capacities of the materials with similar polarity are still different. Similarly, the same conclusion can be obtained by analyzing the BSUs embedded in amino or carboxyl. To study the reasons for such difference, we analyzed the average strength and size of the positive and negative electrostatic potential regions of the above molecules.
Figure 11b shows the percentage of positive areas and the positive average values for different molecules. Figure 11c shows the percentage of negative areas and the negative average values for different molecules. It is found that the percentage of the positive area (51.22%) of the SO2 molecule is slightly larger than that of the negative area (48.78%), and the positive average value (28.9407 kcal/mol) is larger than the absolute average negative value (23.3097 kcal/mol), indicating that the SO2 molecule is easier to combine with negatively charged Lewis base.
By observing the BSUs with similar polarities, it is found that the negative average values of NPCs-H BSU and NPCs-OH BSU are similar, and the percentage of the latter (68.93%) is much larger than that of the former (55.76%) in negative areas; thus, it makes SO2 molecules easier to combine with the NPCs-OH BSU. When the percentages of negative areas of NPCs-NH2 BSU and NPCs-COOH BSU are similar, the average strength of the former negative electrostatic potential (20.4579 kcal/mol) is much larger than that of the latter (15.6548 kcal/mol), so NPCs-NH2 BSU is easier to combine with SO2 molecules.
4. Conclusions
The adsorption behavior of edge-functionalized NPCs at different temperatures and pressures is simulated by the GCMC method. The results show that the adsorption capacity follows the sequence: NPCs-NH2 > NPCs-COOH > NPCs-OH > NPCs-H > NPCs-None. Simulated results about the pore structure of NPCs show that the insertion of acidic oxygenous groups or basic nitrogenous groups will enlarge the pore size of NPCs, but it will also cause a slight reduction in the accessible surface area of NPCs. The SAPT calculation results show that the adsorption position of SO2 molecules is closer to the BSU due to the enhancement of electrostatic interaction, which causes the molecules to penetrate the vdW positive potential region and results in more adsorption active sites. It is also found that the enhancement of the electrostatic effect is positively correlated with the amount of SO2 adsorbed. By analyzing the distribution of electrostatic potential, the surface charge distribution of the edge-functionalized BSU is more nonuniform than that of the non-edge-functionalized BSU.
Acknowledgments
This work was supported by the National Key Research and Development Program of China (Grant No. 2017YFB0602901).
Supporting Information Available
The Supporting Information is available free of charge at https://pubs.acs.org/doi/10.1021/acsomega.1c05000.
Marked BSUs (Figure S1); number of adsorbed molecules versus cycles (Figure S2); and atomic partial charges by RESP charge analysis (Table S1) (PDF)
The authors declare no competing financial interest.
Supplementary Material
References
- Li J.; Wang Y.; Yin P.; Huang J.; Wu Z.; Cao R.; Wang L.; Zeng Q.; Pan X.; Li G.; Zhou M. The burden of sulfur dioxide pollution on years of life lost from chronic obstructive pulmonary disease: A nationwide analysis in China. Environ. Res. 2021, 194, 110503 10.1016/j.envres.2020.110503. [DOI] [PubMed] [Google Scholar]
- Huang J.; Pan X.; Guo X.; Li G. Health impact of China’s Air Pollution Prevention and Control Action Plan: an analysis of national air quality monitoring and mortality data. Lancet Planet. Health 2018, 2, e313–e323. 10.1016/S2542-5196(18)30141-4. [DOI] [PubMed] [Google Scholar]
- Du J.; Yue K.; Wu F.; Ma X.; Hui Z. Numerical investigation on the water vaporization during semi dry flue gas desulfurization in a three-dimensional spouted bed. Powder Technol. 2021, 383, 471–483. 10.1016/j.powtec.2021.01.044. [DOI] [Google Scholar]
- Xin Q.; An K.; Zhang Y.; Yun M.; Wang S.; Lin L.; Ye H.; Ding X.; Li H.; Zhang Y. Metal organic frameworks decorated membrane contactor constructing SO2-philic channels for efficient flue gas desulphurization. J. Membr. Sci. 2021, 620, 118908 10.1016/j.memsci.2020.118908. [DOI] [Google Scholar]
- Liu L.-c.; Zuo H.-b.; Liu W.-g.; Xu Z.-q. Preparation of calcium ferrite by flue gas desulfurization gypsum. J. Iron Steel Res. Int. 2021, 28, 1357–1365. 10.1007/s42243-021-00571-9. [DOI] [Google Scholar]
- Zhu J.; Zhao P.; Yang S.; Chen L.; Zhang Q.; Yan Q. Continuous SO2 absorption and desorption in regenerable flue gas desulfurization with ethylenediamine-phosphoric acid solution: A rate-based dynamic modeling. Fuel 2021, 292, 120263 10.1016/j.fuel.2021.120263. [DOI] [Google Scholar]
- Nowak P.; Muir B.; Solińska A.; Franus M.; Bajda T. Synthesis and Characterization of Zeolites Produced from Low-Quality Coal Fly Ash and Wet Flue Gas Desulphurization Wastewater. Materials 2021, 14, 1558 10.3390/ma14061558. [DOI] [PMC free article] [PubMed] [Google Scholar]
- Zhang Z.; Yang B.; Ma H. Aliphatic amine decorating metal–organic framework for durable SO2 capture from flue gas. Sep. Purif. Technol. 2021, 259, 118164 10.1016/j.seppur.2020.118164. [DOI] [Google Scholar]
- Takashina T.; Honjo S.; Ukawa N.; Oishi T. Effect of Limestone Concentration and Particle Size on SO2 Absorption in Wet FGD Process. J. Chem. Eng. Jpn. 2001, 34, 810–818. 10.1252/jcej.34.810. [DOI] [Google Scholar]
- Rahmani F.; Mowla D.; Karimi G.; Golkhar A.; Rahmatmand B. SO2 removal from simulated flue gas using various aqueous solutions: Absorption equilibria and operational data in a packed column. Sep. Purif. Technol. 2015, 153, 162–169. 10.1016/j.seppur.2014.10.028. [DOI] [Google Scholar]
- Liu D.; Quan X.; Zhou L.; Huang Q.; Wang C. Utilization of waste concrete powder with different particle size as absorbents for SO2 reduction. Constr. Build. Mater. 2021, 266, 121005 10.1016/j.conbuildmat.2020.121005. [DOI] [Google Scholar]
- Zhang D.; Jing X.; Sholl D. S.; Sinnott S. B. Molecular Simulation of Capture of Sulfur-Containing Gases by Porous Aromatic Frameworks. J. Phys. Chem. C 2018, 122, 18456–18467. 10.1021/acs.jpcc.8b03767. [DOI] [Google Scholar]
- Martínez-Ahumada E.; López-Olvera A.; Jancik V.; Sánchez-Bautista J. E.; González-Zamora E.; Martis V.; Williams D. R.; Ibarra I. A. MOF Materials for the Capture of Highly Toxic H2S and SO2. Organometallics 2020, 39, 883–915. 10.1021/acs.organomet.9b00735. [DOI] [Google Scholar]
- Guo L. J.; Feng X. F.; Gao Z.; Krishna R.; Luo F. Robust 4d–5f Bimetal–Organic Framework for Efficient Removal of Trace SO2 from SO2/CO2 and SO2/CO2/N2 Mixtures. Inorg. Chem. 2021, 60, 1310–1314. 10.1021/acs.inorgchem.0c03526. [DOI] [PubMed] [Google Scholar]
- Brandt P.; Xing S.-H.; Liang J.; Kurt G.; Nuhnen A.; Weingart O.; Janiak C. Zirconium and Aluminum MOFs for Low-Pressure SO2 Adsorption and Potential Separation: Elucidating the Effect of Small Pores and NH2 Groups. ACS Appl. Mater. Interfaces 2021, 13, 29137–29149. 10.1021/acsami.1c06003. [DOI] [PubMed] [Google Scholar]
- Sun F.; Gao J.; Zhu Y.; Chen G.; Wu S.; Qin Y. Adsorption of SO2 by typical carbonaceous material: a comparative study of carbon nanotubes and activated carbons. Adsorption 2013, 19, 959–966. 10.1007/s10450-013-9504-9. [DOI] [Google Scholar]
- Liu Q.; Guan J. S.; Li J.; Li C. SO2 removal from flue gas by activated semi-cokes. Carbon 2003, 41, 2225–2230. 10.1016/S0008-6223(03)00230-6. [DOI] [Google Scholar]
- Chen H.; Guo Y.; Du Y.; Xu X.; Su C.; Zeng Z.; Li L. The synergistic effects of surface functional groups and pore sizes on CO2 adsorption by GCMC and DFT simulations. Chem. Eng. J. 2021, 415, 128824 10.1016/j.cej.2021.128824. [DOI] [Google Scholar]
- Raymundo-Piñero E.; Cazorla-Amorós D.; Linares-Solano A. The role of different nitrogen functional groups on the removal of SO2 from flue gases by N-doped activated carbon powders and fibres. Carbon 2003, 41, 1925–1932. 10.1016/S0008-6223(03)00180-5. [DOI] [Google Scholar]
- Sun F.; Gao J.; Liu X.; Yang Y.; Wu S. Controllable nitrogen introduction into porous carbon with porosity retaining for investigating nitrogen doping effect on SO2 adsorption. Chem. Eng. J. 2016, 290, 116–124. 10.1016/j.cej.2015.12.044. [DOI] [Google Scholar]
- Maurya M.; Singh J. K. A grand canonical Monte Carlo study of SO2 capture using functionalized bilayer graphene nanoribbons. J. Chem. Phys. 2017, 146, 044704 10.1063/1.4974309. [DOI] [PubMed] [Google Scholar]
- Kandagal V. S.; Pathak A.; Ayappa K. G.; Punnathanam S. N. Adsorption on Edge-Functionalized Bilayer Graphene Nanoribbons: Assessing the Role of Functional Groups in Methane Uptake. J. Phys. Chem. C 2012, 116, 23394–23403. 10.1021/jp307039m. [DOI] [Google Scholar]
- Wood B. C.; Bhide S. Y.; Dutta D.; Kandagal V. S.; Pathak A. D.; Punnathanam S. N.; Ayappa K. G.; Narasimhan S. Methane and carbon dioxide adsorption on edge-functionalized graphene: A comparative DFT study. J. Chem. Phys. 2012, 137, 054702 10.1063/1.4736568. [DOI] [PubMed] [Google Scholar]
- Dasgupta T.; Punnathanam S. N.; Ayappa K. G. Effect of functional groups on separating carbon dioxide from CO2/N2 gas mixtures using edge functionalized graphene nanoribbons. Chem. Eng. Sci. 2015, 121, 279–291. 10.1016/j.ces.2014.07.057. [DOI] [Google Scholar]
- Zhou S.; Guo C.; Wu Z.; Wang M.; Wang Z.; Wei S.; Li S.; Lu X. Edge-functionalized nanoporous carbons for high adsorption capacity and selectivity of CO2 over N2. Appl. Surf. Sci. 2017, 410, 259–266. 10.1016/j.apsusc.2017.03.136. [DOI] [Google Scholar]
- Xiang Z.; Cao D.; Lan J.; Wang W.; Broom D. P. Multiscale simulation and modelling of adsorptive processes for energy gas storage and carbon dioxide capture in porous coordination frameworks. Energy Environ. Sci. 2010, 3, 1469–1487. 10.1039/C0EE00049C. [DOI] [Google Scholar]
- Lu X.; Jin D.; Wei S.; Zhang M.; Zhu Q.; Shi X.; Deng Z.; Guo W.; Shen W. Competitive adsorption of a binary CO2-CH4 mixture in nanoporous carbons: effects of edge-functionalization. Nanoscale 2015, 7, 1002–1012. 10.1039/C4NR05128A. [DOI] [PubMed] [Google Scholar]
- Yang F. H.; Yang R. T. Ab initio molecular orbital study of the mechanism of SO2 oxidation catalyzed by carbon. Carbon 2003, 41, 2149–2158. 10.1016/S0008-6223(03)00249-5. [DOI] [Google Scholar]
- Murray J. S.; Politzer P.. Electrostatic Potentials: Chemical Applications. In Encyclopedia of Computational Chemistry; Wiley, 1998. [Google Scholar]
- Lu T.; Chen Q. van der Waals potential: an important complement to molecular electrostatic potential in studying intermolecular interactions. J. Mol. Model. 2020, 26, 315 10.1007/s00894-020-04577-0. [DOI] [PubMed] [Google Scholar]
- Rappe A. K.; Casewit C. J.; Colwell K. S.; Goddard W. A.; Skiff W. M. UFF, a full periodic table force field for molecular mechanics and molecular dynamics simulations. J. Am. Chem. Soc. 1992, 114, 10024–10035. 10.1021/ja00051a040. [DOI] [Google Scholar]
- Lu T.; Chen F. Multiwfn: A multifunctional wavefunction analyzer. J. Comput. Chem. 2012, 33, 580–592. 10.1002/jcc.22885. [DOI] [PubMed] [Google Scholar]
- Humphrey W.; Dalke A.; Schulten K. VMD: Visual molecular dynamics. J. Mol. Graphics 1996, 14, 33–38. 10.1016/0263-7855(96)00018-5. [DOI] [PubMed] [Google Scholar]
- Szalewicz K. Symmetry-adapted perturbation theory of intermolecular forces. Wiley Interdiscip. Rev.: Comput. Mol. Sci. 2012, 2, 254–272. 10.1002/wcms.86. [DOI] [Google Scholar]
- Hohenstein E. G.; Sherrill C. D. Wavefunction methods for noncovalent interactions. Wiley Interdiscip. Rev.: Comput. Mol. Sci. 2012, 2, 304–326. 10.1002/wcms.84. [DOI] [Google Scholar]
- Patkowski K. Recent developments in symmetry-adapted perturbation theory. Wiley Interdiscip. Rev.: Comput. Mol. Sci. 2020, 10, e1452 10.1002/wcms.1452. [DOI] [Google Scholar]
- Grimme S.; Antony J.; Ehrlich S.; Krieg H. A consistent and accurate ab initio parametrization of density functional dispersion correction (DFT-D) for the 94 elements H-Pu. J. Chem. Phys. 2010, 132, 154104 10.1063/1.3382344. [DOI] [PubMed] [Google Scholar]
- Hill J. G. Gaussian basis sets for molecular applications. Int. J. Quantum Chem. 2013, 113, 21–34. 10.1002/qua.24355. [DOI] [Google Scholar]
- Parrish R. M.; Burns L. A.; Smith D. G. A.; Simmonett A. C.; DePrince A. E.; Hohenstein E. G.; Bozkaya U.; Sokolov A. Y.; Di Remigio R.; Richard R. M.; Gonthier J. F.; James A. M.; McAlexander H. R.; Kumar A.; Saitow M.; Wang X.; Pritchard B. P.; Verma P.; Schaefer H. F.; Patkowski K.; King R. A.; Valeev E. F.; Evangelista F. A.; Turney J. M.; Crawford T. D.; Sherrill C. D. Psi4 1.1: An Open-Source Electronic Structure Program Emphasizing Automation, Advanced Libraries, and Interoperability. J. Chem. Theory Comput. 2017, 13, 3185–3197. 10.1021/acs.jctc.7b00174. [DOI] [PMC free article] [PubMed] [Google Scholar]
- Emamian S.; Lu T.; Kruse H.; Emamian H. Exploring Nature and Predicting Strength of Hydrogen Bonds: A Correlation Analysis Between Atoms-in-Molecules Descriptors, Binding Energies, and Energy Components of Symmetry-Adapted Perturbation Theory. J. Comput. Chem. 2019, 40, 2868–2881. 10.1002/jcc.26068. [DOI] [PubMed] [Google Scholar]
- Kumar K. V.; Müller E. A.; Rodríguez-Reinoso F. Effect of Pore Morphology on the Adsorption of Methane/Hydrogen Mixtures on Carbon Micropores. J. Phys. Chem. C 2012, 116, 11820–11829. 10.1021/jp302749t. [DOI] [Google Scholar]
- Di Biase E.; Sarkisov L. Systematic development of predictive molecular models of high surface area activated carbons for adsorption applications. Carbon 2013, 64, 262–280. 10.1016/j.carbon.2013.07.061. [DOI] [Google Scholar]
- Guo Y.; Zeng Z.; Li L.; Su C.; Chen R.; Wang C.; Zhou K.; Xu X.; Li H. Competitive Adsorption of Methanol–Acetone on Surface Functionalization (-COOH, -OH, -NH2 and -SO3H):GCMC and DFT Simulations. ACS Appl. Mater. Interfaces 2019, 11, 34241–34250. 10.1021/acsami.9b10804. [DOI] [PubMed] [Google Scholar]
- Martínez L.; Andrade R.; Birgin E. G.; Martínez J. M. PACKMOL: A package for building initial configurations for molecular dynamics simulations. J. Comput. Chem. 2009, 30, 2157–2164. 10.1002/jcc.21224. [DOI] [PubMed] [Google Scholar]
- Peng D.-Y.; Robinson D. B. A New Two-Constant Equation of State. Ind. Eng. Chem. Fundam. 1976, 15, 59–64. 10.1021/i160057a011. [DOI] [Google Scholar]
- Ewald P. P. Die Berechnung optischer und elektrostatischer Gitterpotentiale. Ann. Phys. 1921, 369, 253–287. 10.1002/andp.19213690304. [DOI] [Google Scholar]
- Jones J. E. On the determination of molecular fields. —II. From the equation of state of a gas. Proc. R. Soc. London, Ser. A 1924, 106, 463–477. 10.1098/rspa.1924.0082. [DOI] [Google Scholar]
- Ketko M. H.; Kamath G.; Potoff J. J. Development of an Optimized Intermolecular Potential for Sulfur Dioxide. J. Phys. Chem. B 2011, 115, 4949–4954. 10.1021/jp2010524. [DOI] [PubMed] [Google Scholar]
- Lizzio A. A.; DeBarr J. A. Mechanism of SO2 Removal by Carbon. Energy Fuels 1997, 11, 284–291. 10.1021/ef960197+. [DOI] [Google Scholar]
- Gaur V.; Asthana R.; Verma N. Removal of SO2 by activated carbon fibers in the presence of O2 and H2O. Carbon 2006, 44, 46–60. 10.1016/j.carbon.2005.07.012. [DOI] [Google Scholar]
- Dubbeldam D.; Calero S.; Ellis D. E.; Snurr R. Q. RASPA: molecular simulation software for adsorption and diffusion in flexible nanoporous materials. Mol. Simul. 2016, 42, 81–101. 10.1080/08927022.2015.1010082. [DOI] [Google Scholar]
- Düren T.; Millange F.; Férey G.; Walton K.; Snurr R. Calculating Geometric Surface Areas as a Characterization Tool for Metal–Organic Frameworks. J. Phys. Chem. C 2007, 111, 15350–15356. 10.1021/jp074723h. [DOI] [Google Scholar]
- Sarkisov L.; Harrison A. Computational structure characterisation tools in application to ordered and disordered porous materials. Mol. Simul. 2011, 37, 1248–1257. 10.1080/08927022.2011.592832. [DOI] [Google Scholar]
- Sarkisov L.PoreBlazer[Source cord]. 2020. https://github.com/SarkisovGroup/PoreBlazer.
- Sing K. S. W. Reporting physisorption data for gas/solid systems with special reference to the determination of surface area and porosity. Pure Appl. Chem. 1982, 54, 2201–2218. 10.1351/pac198254112201. [DOI] [Google Scholar]
- Kuchta B.; Firlej L.; Mohammadhosseini A.; Boulet P.; Beckner M.; Romanos J.; Pfeifer P. Hypothetical High-Surface-Area Carbons with Exceptional Hydrogen Storage Capacities: Open Carbon Frameworks. J. Am. Chem. Soc. 2012, 134, 15130–15137. 10.1021/ja306726u. [DOI] [PubMed] [Google Scholar]
- Peigney A.; Laurent C.; Flahaut E.; Bacsa R. R.; Rousset A. Specific surface area of carbon nanotubes and bundles of carbon nanotubes. Carbon 2001, 39, 507–514. 10.1016/S0008-6223(00)00155-X. [DOI] [Google Scholar]
- Bader R. F. W.; Carroll M. T.; Cheeseman J. R.; Chang C. Properties of atoms in molecules: atomic volumes. J. Am. Chem. Soc. 1987, 109, 7968–7979. 10.1021/ja00260a006. [DOI] [Google Scholar]
- Liu Z.; Lu T.; Chen Q. Intermolecular interaction characteristics of the all-carboatomic ring, cyclo[18]carbon: Focusing on molecular adsorption and stacking. Carbon 2021, 171, 514–523. 10.1016/j.carbon.2020.09.048. [DOI] [Google Scholar]
Associated Data
This section collects any data citations, data availability statements, or supplementary materials included in this article.