Abstract
Boron-rich chalcogenides have been predicted to have excellent properties for optical and mechanical applications in recent times. In this regard, we report the electronic, optical, and mechanical properties of recently synthesized boron-rich chalcogenide compounds B12X (X = S and Se) using density functional theory for the first time. The effects of exchange and correlation functionals on these properties are also investigated. The consistency of the obtained crystal structure with the reported experimental results has been checked in terms of lattice parameters. The considered materials are mechanically stable, brittle, and elastically anisotropic. Furthermore, the elastic moduli and hardness parameters are calculated, which show that B12S can be treated as a prominent member of the hard materials family compared to B12Se. The origin of differences in hardness is explained on the basis of density of states near the Fermi level. Reasonably good values of fracture toughness and the machinability index for B12X (X = S and Se) are reported. The melting point, Tm, for the B12S and B12Se compounds suggests that both solids are stable, at least up to 4208 and 3577 K, respectively. Indirect band gaps of B12S (2.27 eV) and B12Se (1.30 eV) are obtained using the HSE06 functional. The energy gaps using local density approximation (LDA) and generalized gradient approximation (GGA) are found to be significantly lower. The electrons of the B12Se compound show a lighter average effective mass than that of the B12S compound, which signifies a higher mobility of charge carriers in B12Se. The optical properties such as the dielectric function, refractive index, absorption coefficient, reflectivity, and loss function are characterized using GGA-PBE and HSE06 methods and discussed in detail. These compounds possess bulk optical anisotropy, and excellent absorption coefficients in the visible-light region along with very low static values of reflectivity spectra (range of 7.42–14.0% using both functionals) are noted. Such useful features of the compounds under investigation show promise for applications in optoelectronic and mechanical sectors.
1. Introduction
Boron (B)-rich compounds having structural units of B12 closed cage clusters are novel systems attracting significant interest of the research community.1−6 Many interesting physical properties such as high hardness, useful electronic properties, low mass density, a very high melting point, and excellent thermal stability and chemical inertness of B-rich compounds have gained extra attention of the materials science and engineering research community in view of the potential technical applications.1,6 Among the B-rich compounds, the B-rich solids with icosahedral clusters1,6,7 structurally derived from α-rhombohedral boron (α-rh boron) offer some industrial potential candidate materials similar to boron carbide, boron sub-oxide and boron sub-phosphide, REB15.5CN, REB22C2N, and REB28.5C4 (RE = heavy rare-earth element, Y, and Sc). Recent discovery of B-rich compounds has received considerable research attention for the betterment of the physical properties in these days.1−3,5,7−14 Very recently, Cherednichenko et al.8 have synthesized 3D B-rich compounds B12S and B12Se using a chemical reaction process at a pressure of 6 GPa and a temperature of 2500 K. With the help of powder X-ray diffraction and Raman spectroscopy, it is found that the crystal structure belongs to rhombohedral symmetry with the space group R3̅m (no. 166). The stoichiometric ratio of the chalcogenides has been computed. Furthermore, only the bulk modulus of B12Se among all mechanical properties has been studied using the third-order Birch–Murnaghan equation of state so far.7 In 2021, Solozhenko15,16 measured the microhardness of 3D B-rich compounds B12S and B12Se experimentally using Vicker hardness (HV) and Knoop hardness (HK) methods and also studied the oxidation resistance by thermal analysis. The author reported that both chalcogenides belong to a family of hard compounds.
The structure of the B12 icosahedral boron network is also found in some other compounds similar to B12S and B12Se. For instance, the chalcogenide compounds B6S and B6Se have already been synthesized by a chemical reaction process at high pressures.1 A comprehensive theoretical study of the structural, electronic, mechanical, optical, and thermal properties of these two compounds has been reported recently, which demonstrated their potential for a variety of thermo-mechanical applications.1,6 The boron-rich compounds B12C3,9,10 B12O2,10,11 and B12As22 were also reported as very hard compounds with good mechanical strength, superior mechanical stability, and the ability to function in harsh environments. Furthermore, Korozlu et al.12 and Pan and Jia13 have reported the mechanical properties and in particular the hardness values of some B-rich compounds using various models. They concluded that most of the B-rich chalcogenide compounds are usually prominent members of hard and superhard families. Since the structure of boron-rich B12 icosahedra supports the unusual physical and chemical properties, better knowledge especially related to the physical properties of B12S and B12Se could help design new application-oriented tasks.
However, many decisive properties of B12S and B12Se compounds like electronic (band structure, density of states, charge density, and Mulliken population analysis), optical (dielectric function, absorption coefficient, photoconductivity, reflectivity, loss function, and refractive index), and mechanical (elastic stiffness constant, polycrystalline moduli, hardness, fracture toughness, machinability index, melting point, etc.) are still unexplored. Understanding these properties is a matter of prime interest in order to disclose the full potential of the compounds of interest for possible device applications.
In the present contribution, the structural, electronic, mechanical, and optical properties of newly synthesized B-rich chalcogenide compounds B12X (X = S and Se) have been investigated meticulously with the help of the first-principles method based on density functional theory (DFT) for the first time. The obtained results confirmed that B12X (X = S and Se) are indirect band gap semiconductors that are likely to be hard materials and can also be used as an optical absorber in photovoltaic devices as well as optical waveguides. We have also carried out a comparative analysis of the physical properties of B12X (X = S and Se) with other similar B-rich compounds, where available.
2. Theoretical Methodologies
In the present report, we focus on the analysis and discussion of the structural, electronic, optical, and mechanical properties of newly synthesized B-rich chalcogenide compounds B12X (X = S and Se). To carry out these tasks, a first-principles approach based on state-of-the-art density functional theory (DFT) has been employed.17,18 The high-throughput calculations are implemented in the CAmbridge Serial Total Energy Package (CASTEP) module.19 The choice of the pseudopotential is quite important in view of optimization of the crystal structure and its electronic structure, especially of the semiconductor materials.6,20,21 The exchange–correlation potentials are evaluated by using the functional form of Perdew–Burke–Ernzerhof (PBE) type within the generalized gradient approximation (GGA) and also of Ceperly and Alder–Perdew and Zunger (CA-PZ) type within the local density approximation (LDA).18,22,23 The optimizations for both chalcogenide crystal structures are done by the Broyden–Fletcher–Goldfarb–Shanno (BFGS) method24 using the following optimization input parameters: a plane wave basis set kinetic energy cutoff of 550 eV, a Monkhorst–Pack k-point mesh size25 of 6×6×3, an energy convergence threshold of 5 × 10⁻⁶ eV/atom, a maximum force of 0.01 eV/Å, a maximum stress of 0.02 GPa, and a maximum atomic displacement of 5 × 10⁻⁴ Å. Very often, the band gap estimation of semiconductor materials using local functionals like LDA and GGA does not match with experimental results and underestimates the actual values. The electronic band gaps of both title compounds, therefore, are calculated as accurately as possible by using the nonlocal hybrid functional HSE06 (Heyd–Scuseria–Ernzerhof).26−28 Elastic stiffness constants can be found by the “stress–strain” method supported by the CASTEP code.29 The optical properties such as the real part of the dielectric function [ε1(ω)], refractive index, absorption spectrum, loss function, reflectivity, and optical conductivity can be estimated following the Kramers–Kronig transformation relation from the imaginary part of the dielectric function, [ε2(ω)]. The following equations are used to estimate the aforementioned optical constants where the symbols bear the usual significances:19,29,30
3. Results and Discussion
3.1. Structural Properties
The crystal structures of two B-rich chalcogenide compounds B12S and B12Se are isostructural to α-rhombohedral boron (α-B12). The titled compounds contain 10 (ten) B12 icosahedra (a three-dimensional polyhedral rigid network) in the hexagonal unit cell in which eight icosahedral units are found at corner positions and the other two are placed on one of the main diagonals.8 The crystallographic lattice parameters of both chalcogenides under study are presented in Table 1, along with previously reported data. The optimized crystal structure of B12S as a prototype structure is depicted in Figure 1. It is obvious that the lattice constants and bond lengths of both studied compounds could be different due to the variation of the electronegativity and atomic number of the 6c site element (S/Se). In Table 1, there have been some minor variations of both lattice constants (a and c) in the literature data due to the variation of S/Se occupancy in the unit cell. It was reported that the level of occupancy of S atoms at the 6c site is 55% and that of Se at the 6c site is 52%, while all the boron atoms form B12 icosahedra having occupancies at 18h sites that are found to be 100%. These results reveal an excellent final reliability factor of the Rietveld refinement analysis as well as of the energy-dispersive X-ray spectroscopy data.8 However, the calculated lattice parameters using the LDA-CAPZ functional show fair agreement with other literature data compared to those obtained via GGA-PBE.
Table 1. Optimized Crystallographic Lattice Parameters, a and c (All in Å), and the Unit Cell Volume V (Å3) of Boron Sub-sulfide (B12S) and Boron Sub-selenide (B12Se) Compounds along with Literature Data.
| phase | a | c | V | occupancy (%) | functional | ref. |
|---|---|---|---|---|---|---|
| B12S | 5.8392 | 12.1115 | 357.6302 | 55 | LDA-CAPZ | this work |
| 5.9118 | 12.3155 | 372.7574 | 55 | GGA-PBE | this work | |
| 5.8196 | 11.9653 | 364.76 | 55 | exp. | (8) | |
| 5.8966 | 12.1135 | 100 | (8) | |||
| 5.80 | 11.90 | 50 | (31) | |||
| 5.810 | 11.94 | 48.5 | (32) | |||
| 5.8624 | 12.147 | 65 | (32) | |||
| 5.8379 | 12.036 | 59.9 | (14) | |||
| 5.8307 | 12.028 | 60.9 | (14) | |||
| 5.8273 | 12.025 | 62 | (14) | |||
| B12Se | 6.0237 | 12.1596 | 382.1013 | 52 | LDA-CAPZ | this work |
| 6.0786 | 12.3713 | 395.8673 | 52 | GGA-PBE | this work | |
| 5.9385 | 11.9144 | 385.42 | 52 | exp. | (8) | |
| 6.0496 | 12.1603 | 100 | (8) | |||
| 5.9041 | 11.947 | 46.9 | (5) |
Figure 1.
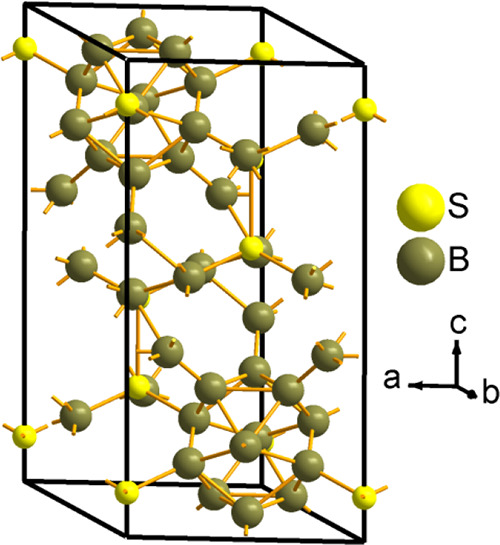
Schematic crystal structure of the B12S chalcogenide compound belonging to the rhombohedral symmetry with the space group R3̅m (no. 166). Two icosahedral units are found on one of the main diagonals. The B12Se chalcogenide compound is completely isostructural to B12S and is not shown here.
3.2. Electronic Properties, Charge Density, and Mulliken Population
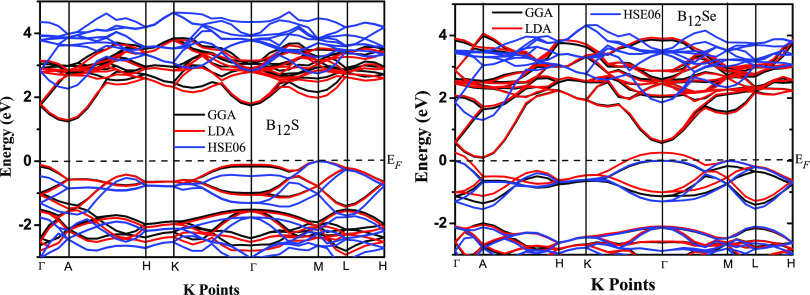
The electronic band structures (EBS) along high-symmetry directions of B12S and B12Se are illustrated in Figure 2. The Fermi level (EF) is set to 0 eV. In many semiconducting materials, band gap estimation using local functionals results in inaccurate values along with inappropriate positions of the valence band (VB) and the conduction band (CB), which lead the theoretical study far-off from the experimental results. The error might emanate from strong Coulomb correlations of the material. In most of the cases, the use of nonlocal functionals could be a fair solution to the aforementioned problem.27,28 In order to provide an accurate prediction of the EBS as well as the band gap, we have used both local functionals (LDA and GGA) and a nonlocal functional (HSE06) to model the exchange–correlation potential. At present, due to the lack of literature data, comparison of EBS results with any experimental and/or theoretical ones is not possible. All the results presented in this section will require experimental validation. However, as depicted from Figure 2, the bottom of the CB is at a fixed position at the A point of the Brillouin zone for both the compounds, while the top of the VB is located at different places: the M point and the Γ point for B12S and B12Se, respectively. This implies that both the chalcogenides should be indirect band gap semiconductors.
Figure 2.
Electronic band structures of boron-rich chalcogenide compounds B12S and B12Se along the high-symmetry directions using local (GGA and LDA) and nonlocal (HSE06) functionals. The black dashed horizontal lines denote the Fermi level (EF), which are set to 0 eV.
The value of the indirect band gap is very sensitive to the exchange and correlation functional as shown in Figure 2. The values of indirect band gaps (in eV) for B12S (B12Se) compounds using LDA, GGA, and HSE06 functionals are found to be 1.287 (0.0), 1.245 (0.093), and 2.271 (1.300), while those of minimum direct band gaps at the M point (Γ point) are 1.985 (1.495), 2.161 (1.564), and 2.746 (2.344), respectively. The band morphology was significantly affected by the chalcogenide element (X element). For instance, due to the replacement of the S element with Se in the B12S compound, all valence and conduction bands (in case of use of both local and nonlocal functionals) are shifted toward the EF with minor variation in the shape of the bands. Similar results were also reported in the B-rich chalcogenide B6X (X = S and Se) compounds.6 Furthermore, the top of the VB was shifted from the M point to the Γ point when the S element was substituted by the Se atom to form the compound B12Se. It is also seen that the bands along H–K and H–L directions for both compounds are much less dispersive than in any other direction. Furthermore, the bottom of the CB and the top of the VB based on the band morphology inspection inspire us to calculate the effective mass, which can predict the charge transport behaviors. The effective masses of electrons (me*) and holes (mh) for the CB and the VB have been calculated, respectively, using the following equation:33
where k is the wave vector, ε(k) is the eigenvalue of the energy band at the wave vector, k, and ℏ is the reduced Planck constant. It is obvious from the equation that the value of m* has an inverse relationship with the curvature of the electronic band dispersions. The calculated carrier effective masses (me*m and mhm), average effective masses (mdc and mdv) in the CB and VB, respectively, using HSE06 functionals, and band gaps (in eV) for boron sub-sulfide (B12S) and boron sub-selenide (B12Se) compounds are displayed in Table 2. The average effective masses mdc and mdv at the CB and the VB, respectively, are calculated using standard formulae that can be found elsewhere.33,34
Table 2. Carrier Effective Masses (me* and mh), Average Effective Masses (mdc and mdv) in the Conduction and Valence Bands, Respectively, Using HSE06 Functionals, and Band Gaps (eV) for Boron Sub-sulfide (B12S) and Boron Sub-selenide (B12Se) Compounds.
| parameters/approach | B12S | B12Se | ref. |
|---|---|---|---|
| me*(m0) | 0.98 A(A→Γ) | 0.96 A(A→Γ) | this |
| 1.07 A(A→H) | 0.59 A(A→H) | ||
| mdc(m0) | 1.02 | 0.75 | this |
| mh*(m0) | 1.85 M(M→Γ) | 3.50 Γ(Γ→M) | this |
| 2.04 M(M→L) | 3.24 Γ(Γ→Κ) | ||
| mdv(m0) | 1.94 | 3.37 | this |
| band gap (eV) (LDA-CAPZ) | 1.287 | 0.000 | this |
| band gap (eV) (GGA-PBE) | 1.245 | 0.093 | this |
| band gap (eV) (HSE06) | 2.271 | 1.300 | this |
The calculated effective masses of electrons (me*) at the A point along (A→Γ) and (A→H) directions in the CB for both compounds are different due to the difference in curvatures of the bands. Similar results are also found for holes in the VB as shown in Table 2. In the B12Se compound, the mdc has a light effective mass compared to that of the B12S compound, which originates from dispersive p orbitals of the B element in the former. In contrast to mdc, the mdv with a value of 3.37m0 at the Γ point for the B12Se compound is much heavier than 1.94m0 at the M point for the B12S compound. Here, m0 is the bare electron mass. This indicates that a less dispersive curvature (almost flat band) is formed at the Γ point in comparison to that at the M point. Note here that the top of the VB was shifted from the M to the Γ point with the replacement of the S atom with the Se element. It is known that the effective mass can predict the carrier mobility as well as the carrier concentration of a semiconductor material and is often used to predict the electrical conductivity of solids. A low value of mdc for B12Se should indicate a high carrier mobility as well as electrical conductivity under external stimuli.
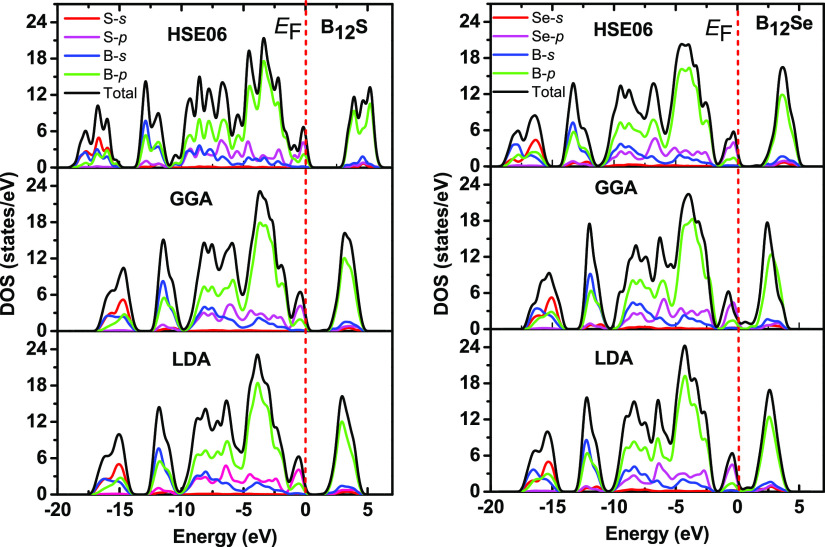
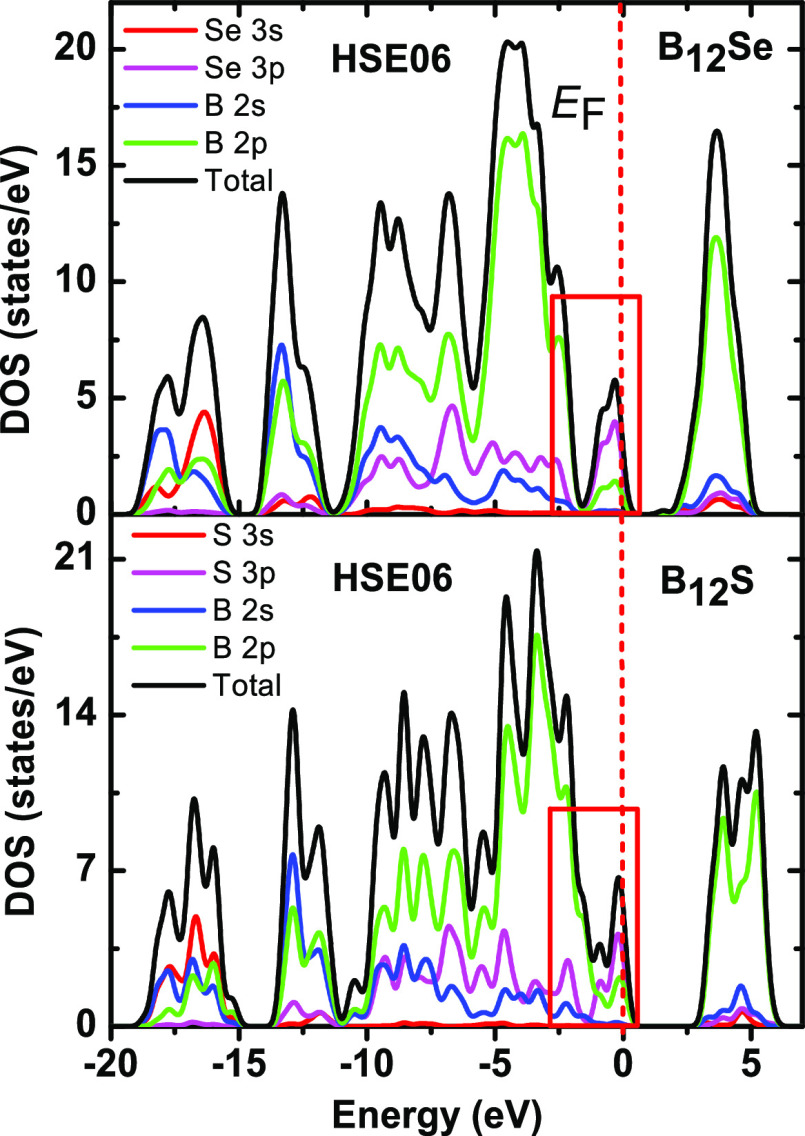
In order to extend the nature of the EBS, we have also studied the electronic energy density of states (total and partial density of states) of the titled compounds as shown in Figure 3. Considering the hybrid functional of HSE06, the lowest-energy parts of the CB for B12S (B12Se) at 2.30 (1.30) eV are formed by the strong hybridization of s and p orbitals of the B element, while hybridization between s and p orbitals of the S element has a minor contribution. On the other hand, the highest-energy parts of the VB in the vicinity of EF are mainly constructed by the hybridization of p orbitals of both B and S/Se elements.
Figure 3.
Density of states (total and partial) of boron-rich chalcogenide compounds B12S and B12Se using LDA, GGA, and HSE06 functionals. The red dashed vertical lines denote the Fermi level (EF) set to 0 eV.
It can be seen here from the PDOS plots that hybridization of B and Se p orbitals is much stronger than that between B and S orbitals, resulting in a shift of the lowest conduction band downward (lower energy). Similar qualitative features could be found for both the titled chalcogenides using LDA and GGA functionals to model the exchange and correlation effects.
The three-dimensional (3D) mapping images of charge density distributions of B12S and B12Se are depicted in Figure 4. It can be deduced from the figures that there are asymmetric charge distributions in the studied compounds owing to the difference in the electronegativity of S and Se atomic species. The depletion of charge density indicated by the blue color is found around S/Se atoms, while the accumulation of charge is pointed out by the red color as seen around the B atomic species. This reflects that the charge (electron) is shifted from the S/Se element to the B element, which is suggestive of ionic bonding. In addition to this, strong covalent bonds between B–B and B–S/Se atoms are found owing to the directional accumulation of charge. The charge density distributions in both studied compounds are different as seen from charge accumulation and depletion regions. In the B12Se compound, charge accumulation around B atoms and depletion around the Se element are more pronounced than those in the B12S compound. This suggests that the amount of charge transfer as well as bonding strength could be different in these boron-rich compounds,35 which is also confirmed from the study of Mulliken population analysis as shown in Table 3. The B and S/Se atoms have a negative and positive charge, respectively. The transfer of charge from S to B atoms in the B12S compound is 0.08|e|, while in the B12Se compound, it is from Se to B atoms and is 0.22|e| and 0.10|e| as indicated in Table 3. These results are consistent with the results of charge density distribution mapping.
Figure 4.
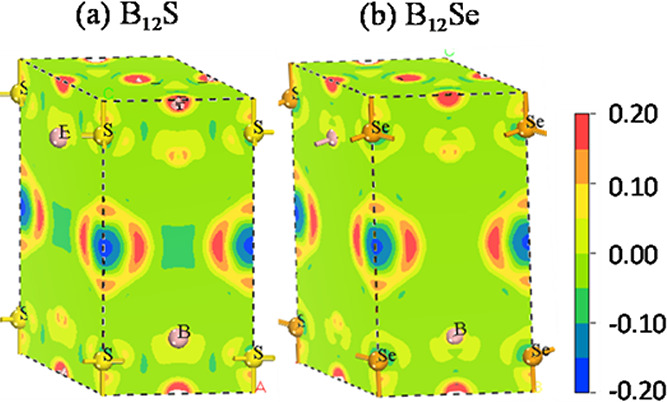
3D mapping images of charge density distributions of the titled chalcogenides: (a) B12S and (b) B12Se compounds. The adjacent scale shows the charge value (in the units of electronic charge) from −0.2 to +0.2.
Table 3. Estimated Mulliken Atomic Population of Boron-Rich Chalcogenides B12X (X = S and Se)a.
| compound | atom | s | p | total | charge (e) | EVC (e) |
|---|---|---|---|---|---|---|
| B12S | B | 0.83 | 2.17 | 3.00 | 0.00 | |
| B | 0.79 | 2.29 | 3.08 | –0.08 | ||
| S | 1.59 | 4.17 | 5.76 | 0.24 | 5.76 | |
| B12Se | B | 0.88 | 2.22 | 3.10 | –0.10 | |
| B | 0.85 | 2.36 | 3.22 | –0.22 | ||
| Se | 0.97 | 4.08 | 5.05 | 0.95 | 5.05 |
Here, EVC indicates the effective valence charge.
3.3. Optical Properties
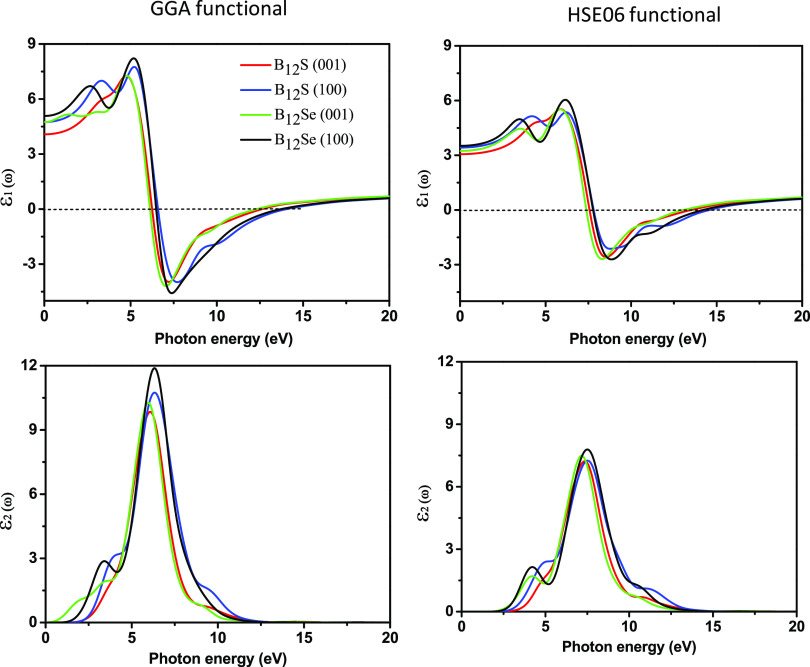
In order to evaluate the feasibility of a material for possible optoelectronic and photonic device applications as well as for the characterization of materials, especially semiconducting properties, it is of paramount importance to study various optical features first. Generally, the optical property is related to a material’s response when electromagnetic radiation, particularly visible light, is exposed on it. Some important optical devices such as LCD screens, screens for 3D movies, polarizers, and wave plates, to name a few, are fabricated based on the properties of optical anisotropy.6,20,36 Therefore, the optical properties along with anisotropy in a broad spectral range are of decisive interest to extend their application scope. In the present investigation, the optical properties as well as optical anisotropy of two titled compounds are studied in the photon energy range up to 15 eV for two polarization directions [100] and [001], for the first time. It is interesting to note here that the shapes of the spectrum and energy peak position for all optical properties are different and distinguishable with respect to the polarization direction of the incident electric field. The direction-dependent real [ε1(ω)] and imaginary [ε2(ω)] parts of the dielectric function for both compounds are illustrated in Figure 5. It is seen that large anisotropic behavior of both dielectric functions is observed in the IR, visible, and mid-UV region up to 12 eV. Particularly, the very strong anisotropic nature of these dielectric functions in the IR and visible region is crucially important for efficient light manipulation in many devices. Following the Penn model,37,38 the static value of the dielectric constant [ε1(0)] can be evaluated from the plasma energy (Ep), Fermi energy (EF), and energy band gap (Eg) as follows:
Figure 5.
Photon energy-dependent dielectric functions (real part [ε1(ω)] and imaginary part [ε2(ω)]) of boron sub-sulfide (B12S) and boron sub-selenide (B12Se) compounds along different polarization directions of electric fields using the GGA and hybrid HSE06 functionals.
The static value of [ε1(0)] that describes the index of refraction is also necessary to design many optical devices. For B12Se, the highest values of [ε1(0)] are calculated using the GGA (HSE06) functional and found to be 5.08 (3.51) and 4.75 (3.23) for the [100] and [001] polarizations, respectively, while the corresponding values are 4.75 (3.41) and 4.07 (3.05) for B12S for the [100] and [001] polarization directions, respectively. The [ε1(ω)] for both the compounds using the GGA (HSE06) functional gradually increased with photon energy, reaching the highest values of 7.75 (5.36) at 5.2 (6.2) eV for B12S and 8.20 (6.04) at 5.22 (6.16) eV for B12Se for the [100] direction and finally going to zero at around 6.5 (7.5) eV energy. The photon energy/frequency-dependent imaginary part of the dielectric constant [ε2(ω)] signifies the light absorption of the material. The values of [ε2(ω)] for B12S using the GGA (HSE06) functional started at incident photon energies of 1.9 (2.56) and 1.8 (2.77) eV along the [100] and [001] directions, respectively, and for B12Se, the values are 1.35 (2.40) and 1.0 (2.30) eV for the same. The major peaks observed in [ε2(ω)] for both chalcogenides arise due to the optical transition mainly from the highest energy of the valence band of S/Se p orbitals to the lowest energy of the conduction band of B p orbitals. The positions of prime peaks are varied along different polarization directions with photon energy, which is a clear signature of the optical anisotropy, as depicted in Figure 5.
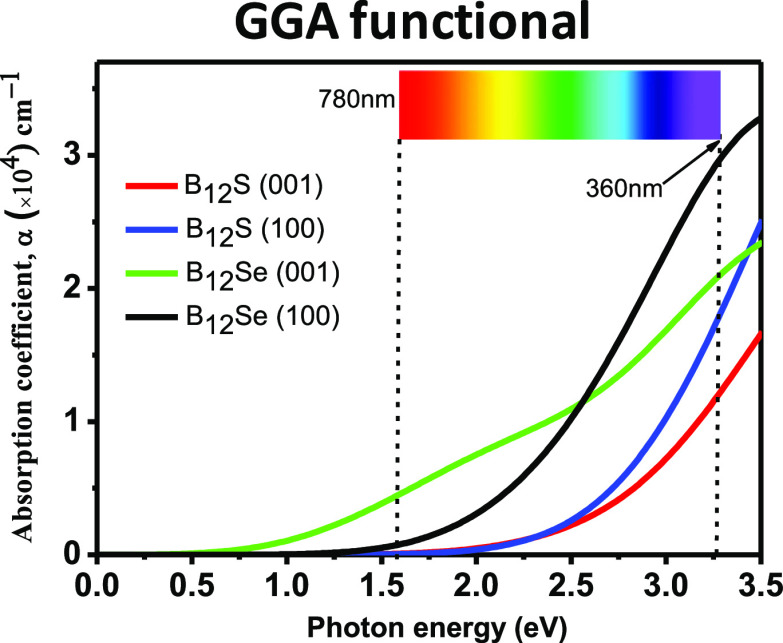
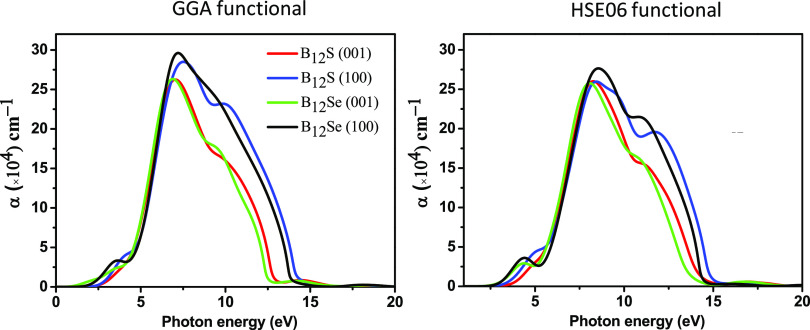
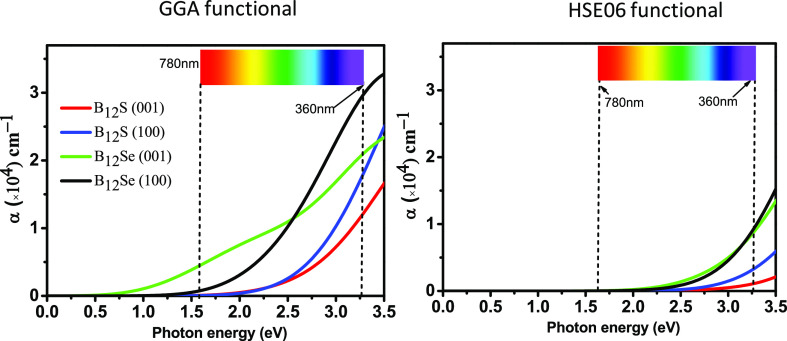
The optical absorption coefficient, α(ω), can be computed using the formula mentioned in the theoretical methodology (Section 2). Figure 6 shows the energy-dependent absorption coefficient curves for the two polarization directions [100] and [001]. It is noticed that the α(ω) revealed strong anisotropy along the [100] and [001] polarization directions, and in particular, large anisotropy in the absorption coefficient is observed in the visible and UV spectrum (up to ∼5.0 eV), and then, anisotropy is drastically reduced at an energy of around 8 eV. Interestingly, bulk absorption anisotropy is again observed in the deep-UV region within an energy range of 8.0–14.5 eV. Since the visible-light absorption coefficient as well as anisotropy is very important to design an optical device,36 we are more interested to put deep insight in this aspect. Figure 7 shows the enlarged spectrum in the visible region. It is obvious that the spectrum of α(ω) along the [100] directions has a blueshift in comparison to that along the [001] polarization directions for both the boron-rich semiconductors. This implies that strong visible-light absorption should be found along the in-plane direction.
Figure 6.
Computed optical absorption coefficients, α(ω), of boron sub-sulfide (B12S) and boron sub-selenide (B12Se) compounds for different polarization directions of the electric field using GGA and hybrid HSE06 functionals.
Figure 7.
Enlarged figures of absorption coefficient, α(ω), spectra in the visible spectrum for B12S and B12Se compounds using GGA and hybrid HSE06 functionals.
Therefore, the boron sub-sulfide (B12S) and boron sub-selenide
(B12Se) compounds as an optical absorber in photovoltaic
devices, for example, should be used parallel to the optical source
in order to achieve the best absorption efficiency.35 The major peaks of α(ω) using the GGA (HSE06)
functional are noticed at 7.56 (8.44) and 7.00 (8.26) eV for B12S, and they are at 7.16 (8.56) and 7.00 (8.06) eV for the
B12Se compound for the [100] and [001] directions, respectively.
The maximum value of α(ω) in the visible-light region
using the GGA (HSE06) functional is ∼3 × 10⁴ (1 × 10⁴) cm–1 for the B12Se compound. The optical band gap can also be determined for both
the studied chalcogenides using the well-known Tauc plot from absorption
coefficient spectra.39 An accurate estimation
of optical band gap energy is quite important to predict some features
such as the photophysical and photochemical properties of semiconducting
materials. On the other hand, wrong use of the Tauc plot to estimate
this band gap energy provides misinformation, and in particular, error
in estimation of the band gap can reflect the light absorption within
the sub-band gap energy.40 However, the
Tauc equation, which is based on the absorption coefficient, can be
written as follows:  where α, h, ν, A, and Eg signify the absorption
coefficient, Planck constant, frequency, a material-dependent coefficient,
and the band gap, respectively.39 The value
of parameter η depends on the nature of the band gap, and in
general, 1/2 and 2 are used for direct and indirect band gap semiconductors,
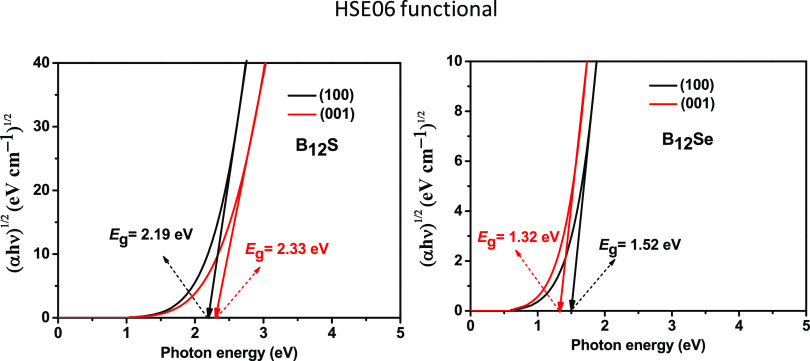
respectively. Figure 8 illustrates the optical band gap energy estimation using the Tauc
plot for both the chalcogenides under consideration. It is found that
the obtained optical band gaps for B12S and B12Se compounds are 2.19 (2.33) and 1.52 (1.32) eV, respectively, for
the [100] ([001]) direction calculated using the HSE06 functional.
The optical band gaps are consistent with those obtained from the
electronic band structure gaps as shown in Figure 2 and Table 2.
Figure 8.
Estimation of the optical band gap from the absorption coefficient, α(ω), spectrum using the Tauc plot for B12S and B12Se compounds using the hybrid HSE06 functional.
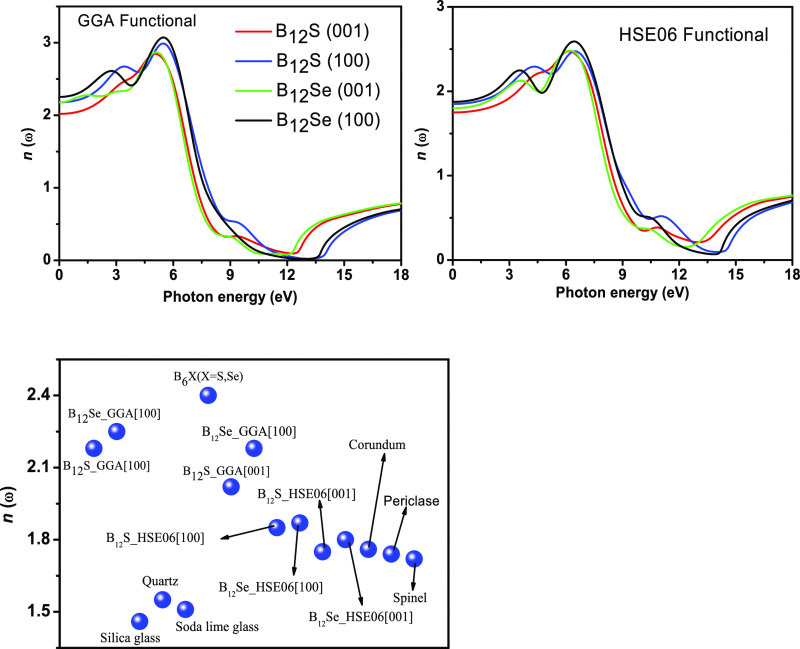
The refractive indices are also studied to further check the suitability of the two compounds in optoelectronic devices. When a light wave (photons) penetrates through a material, its electric field interacts with the electrons of solids and the real part of the refractive index measures how the velocity of the light wave is modified compared to its free-space value. It is seen in Figure 9 that the value of n is also dependent on the polarization directions of the incident electric fields as the static values of n(0) at zero frequency using the GGA (HSE06) functional along the [100] ([001]) direction are 2.17 (1.84) and 2.01 (1.75) for B12S and 2.25 (1.87) and 2.17 (1.80) for B12Se. Since the value of n is different in different directions, the effective refractive index must be dependent on the electric field direction of light. However, the variations of these values in the visible-light region are not that prominent, rather reasonably constant. The electric polarization-dependent value of n also suggests that a higher value of n[100] results due to the highest density of ions along these directions.36 The value of n considering the HSE06 functional is lower than those of B6X (X = S and Se),6 NaInSe2,20 MAX,41,42 and MAB43−45 but is slightly higher than those of some ceramic materials such as silica glass, quartz, and soda lime glass and, in some compounds, very close to those of corundum, periclase, and spinel.46 A comparison of n (at 0 eV) with some well-known optical waveguide materials is presented in the lower panel of Figure 9. This comparison implies that the titled compounds are likely to be useful as optical guides.
Figure 9.
Refractive index spectra, n, of B12S and B12Se compounds obtained using the GGA and hybrid HSE06 functionals as a function of incident photon energy. Lower panel: comparison of the static refractive index, n(0), of B12S and B12Se with some other well-known ceramic and optical waveguide materials.
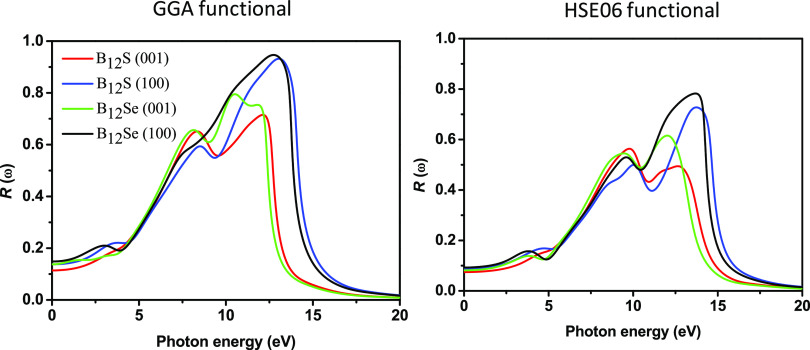
The reflectivity spectra of boron sub-sulfide and sub-selenide are estimated and plotted as a function of photon energy in Figure 10. It is found that the reflectivity spectrum is very sensitive in the IR-, visible-, and UV-light (up to 5.0 eV) regions when the electric field polarization is along the [100] and [001] directions. Like the anisotropic behavior of the absorption coefficient, the anisotropy of the reflectivity spectra was also drastically reduced in the photon energy range of 5.0–8.0 eV, and then, again, at higher energies, the anisotropic nature is prominently noticed. The starting values of the spectra for B12S are 0.0888 (0.14) and 0.0742 (0.113) for the [100] and [001] directions, respectively, calculated using the HSE06 (GGA) functional. On the other hand, the starting values for B12Se are 0.0925 (0.1483) and 0.0815 (0.1375) for the same. Polarization direction-dependent maximum reflectivity spectra are seen for both the functionals in the following sequence: B12Se[100] > B12S[100] > B12Se[001] > B12S[001] at various incident photon energies as shown in Figure 10.
Figure 10.
Reflectivity spectra of boron sub-sulfide (B12S) and boron sub-selenide (B12Se) compounds plotted as a function of photon energy.
The transparency T(ω) of any material can be estimated with the help of the absorption coefficient, α(ω), and reflectivity, R(ω), data as follows:33
ω and t are the light frequency and thickness of the material, respectively. Lower values of the absorption coefficient or the reflectivity result in the higher value of the transparency as indicated from the above equation. It is worth noticing from Figures 10 and 6 that the reflectivity spectra and absorption coefficients of both the compounds have the values of reflectivities and absorption coefficients of ∼10.0% and ∼1.0 × 104 cm–1, respectively, at least in the visible-light region. This indicates that the titled chalcogenide compounds are fairly transparent materials.
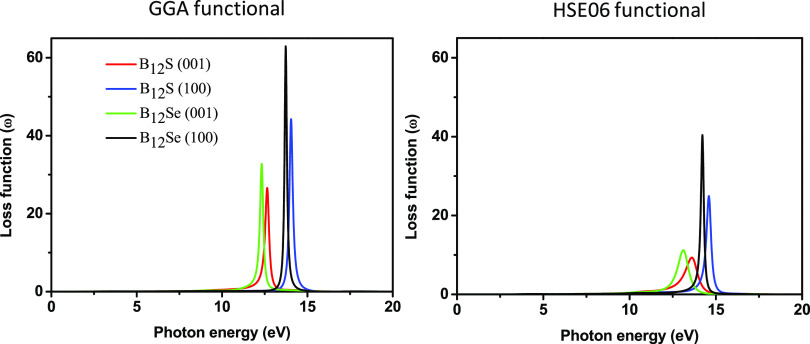
The loss function, L(ω), is related to the loss of energy of charged particles (e.g., electrons) when they travel through a material. It can be seen from Figure 11 that the energy loss of electrons is prominently seen in the mid-UV region (within the energy range of 12–15 eV for both the compounds). Very sharp peaks are attained at the plasma frequency. The plasma resonances using the GGA (HSE06) functional are at 14.04 (14.6) and 12.64 (13.60) eV for B12S and at 13.72 (14.22) and 12.31 (13.11) eV for B12Se, along the [100] and [001] polarization directions, respectively. Additionally, it can be seen that there are no L(ω) peaks in the range of 0–12 eV owing to the high value of [ε2(ω)].47 The imaginary part of the dielectric function is greatly suppressed at the plasma resonance.
Figure 11.
Photon energy-dependent loss functions of boron sub-sulfide (B12S) and boron sub-selenide (B12Se) compounds.
It is found that like other optical properties discussed herein, the energy loss function for both the compounds could be higher along with a larger plasmon energy when for the [100] polarization in comparison to that for the [001] direction. Prior to the present study, there has been no experimental and/or theoretical report concerning the optical properties of B12S and B12Se to validate our theoretical estimations. The results reported in this section will require future experimental verification.
3.4. Mechanical Properties and Hardness
In order to comprehend the mechanical behaviors of the two compounds, we have calculated the parameters characterizing mechanical properties such as elastic constants (Cij), elastic moduli, hardness parameters, brittle/ductile behavior, etc. The calculation of elastic constants Cij via the CASTEP code was performed using an efficient stress–strain method.48,49 The stress–strain relationship is usually expressed by the generalized Hooke’s law: σij = Cijklεkl. Here, the fourth-order elastic stiffness tensor Cijkl contains 81 components, and σij and εkl are the second-order stress tensor and strain tensor, respectively. The 6 × 6 matrix can be used to express the fourth-order tensor using the Voigt markers, the equation can be simplified to σi = Cijεj, as Cij = Cji, and the number of independent components in the elastic stiffness tensor can be reduced to 21. Due to the symmetry of the crystal structure, the number of single-crystal elastic constants is different for different crystal systems.
Since neither experimental nor theoretical data of the elastic properties of both the titled phases are available, thus, a comparison between the values obtained for different functionals can be useful to predict the reliability of our calculations. The values of elastic constants and elastic moduli show an opposite trend to that of the lattice constants, i.e., LDA (GGA) gives lower (higher) lattice constants that result in higher (lower) elastic parameters, as expected. It is also proven that LDA and GGA give higher and lower values of elastic constants, respectively.50 This inspires us to calculate the elastic properties using these functionals with the hope that the exact values of the elastic parameters for B12S and B12Se should remain within this limit. Table 4 enlists the obtained parameters used to describe the mechanical behaviors of the considered compounds. One of the decisive pieces of information that can be revealed from the obtained elastic constants (Cij) is the confirmation of the mechanical stability of the studied materials. The conditions of mechanical stability for hexagonal systems are as follows: C11 > 0, C11 > C12, C44 > 0, and (C11 + C12)C33 – 2(C13)2 > 0.51 It is obvious from Table 4 that the obtained values of Cij satisfy the mentioned criteria, and hence, both the compounds are mechanically stable. Some more useful information can be extracted from the values of Cij. As evident from Table 4, C11 is larger than C33 for both functionals. As C11 and C33 are directly related to atomic bonds along the x(y) and z axes, respectively, the atoms along the x(y) axis are bonded strongly compared to those along the z axis for both the phases. Table 4 reveals that C11 and C33 of B12S are larger than those of B12Se, indicating a higher resistance to axial deformation of B12S in comparison with B12Se. Another elastic constant, C44, usually used to measure the shear deformation resistance, is also much higher for B12S than that of B12Se, implying a higher shear deformation resistance of B12S compared to B12Se. The unequal values of C11 and C33 also reveal the difference in the atomic arrangements along the x(y) and z axes. Such an arrangement of atoms is desired for hexagonal systems to ensure the minimum energy of the system in the ground state; consequently, the density of atoms along the x(y) and z axes is different that results in different values of C11 and C33. In addition, C11 and C33 are larger than C12, C13, and C14, implying that shear deformation is easier than axial deformation for both the boron-rich phases. Moreover, the unequal values of C11 and C33 and C12, C13, and C14 reveal the anisotropy in the elastic moduli (Y, B, and G). Finally, the elastic constants are used to calculate the macroscopic elastic moduli and ratios such as the bulk modulus (B), shear modulus (G), Young’s modulus (Y), and Poisson’s ratio (υ) using the Voigt–Reuss–Hill (VRH) approximation.52−54 The required expressions for these calculations can be found elsewhere.6,55,56 The obtained values are listed in Table 4 from which it is seen that the B, G, and Y are 187, 148, and 351 GPa and 171, 96, and 243 GPa for B12S and B12Se, respectively, obtained using the GGA functional. As B, G, and Y measure the volume deformation resistance, shear deformation resistance, and stiffness of solids, B12S exhibits strong volume and shear deformation resistances as well as strong stiffness compared to B12Se.
Table 4. Calculated Stiffness Constants (GPa), Elastic Moduli (B, G, and Y; All in GPa), Poisson’s Ratio (υ), Pugh’s Ratio (G/B), Hardness Values (HChen, HMiao, and HMazhnik; All in GPa), and Fracture Toughness, KIC (MPam0.5), of Boron-Rich Chalcogenide B12X (X = S and Se) Compounds with a Hexagonal Structure.
| phase | C11 | C33 | C44 | C12 | C13 | C14 | B | G | Y | υ | G/B | HChen | HMiao | HMazhnik | KIC | |
|---|---|---|---|---|---|---|---|---|---|---|---|---|---|---|---|---|
| B12S | GGA | 463 | 352 | 119 | 108 | 54 | 30 | 187 | 148 | 351 | 0.18 | 0.79 | 25.29 | 30.89 | 20.32 | 4.27 |
| LDA | 487 | 371 | 121 | 124 | 61 | 35 | 201 | 151 | 362 | 0.19 | 0.75 | 23.93 | 30.24 | 19.27 | 4.55 | |
| B12Se | GGA | 386 | 313 | 86 | 151 | 46 | 56 | 171 | 096 | 243 | 0.26 | 0.56 | 11.69 | 15.13 | 11.57 | 3.13 |
| LDA | 437 | 336 | 99 | 134 | 51 | 36 | 183 | 126 | 307 | 0.22 | 0.68 | 18.88 | 23.52 | 14.56 | 3.80 |
Next, we discuss the brittle/ductile behavior of the studied compounds. Brittleness/ductility is a decisive property for application purposes. The related parameter can be obtained based on the Poisson’s ratio (υ) and Pugh’s ratio (G/B). The υ and G/B have an opposite tendency to their values owing to the interdependence of the polycrystalline elastic parameters. The Poisson’s ratio, used to measure the lateral structural deformation during the stretching or compression, is widely used to predict the ductility or brittleness of solids with a critical value of υ ∼0.26 (for brittle materials, υ < 0.26, and for ductile materials, υ > 0.26).57−60 As predicted from the calculated values in Table 4, B12S should behave as a brittle material, whereas for B12Se, the Poisson’s ratio has values of 0.26 and 0.22 using the GGA and LDA functionals, respectively. Thus, we can define B12Se as a quasi-brittle material. Again, for the Pugh’s ratio (G/B), the critical value used to separate ductile and brittle behavior is 0.57 [for brittle materials, G/B > 0.57, and for ductile materials, G/B < 0.57].61 Like the Poisson’s ratio, the Pugh’s ratio also classifies B12S as a brittle solid. For B12Se, G/B has values of 0.56 and 0.68 using the GGA and LDA functionals, respectively, which again directs us to define B12Se as a quasi-brittle material. It is encouraging to find that results from both the indicators are fully consistent with each other.
Furthermore, we have calculated the hardness parameters using three well-established models, namely, Chen et al.’s model,62 Miao et al.’s model,63 and Mazhnik and Oganov’s model64 using USPEX.65 The results are given in Table 4. As can be seen from Table 4, the hardness parameters are higher for B12S than those for B12Se. Among the mechanical characterizing parameters, C44 is assumed to be the best hardness predictor parameter.66 The value of C44 for B12S is 119 GPa using GGA, 121 GPa using LDA. These values are much higher than those of B12Se (86 GPa using GGA, 99 GPa using LDA). Therefore, higher values of hardness parameters are expected for B12S compared to B12Se. The higher hardness values of B12S compared to B12Se can also be explained on the basis of the DOS as shown in Figure 12. Red rectangles are drawn in the figure in which there is a large difference in the values of TDOS for B12S and B12Se. As seen, a peak in the DOS very close to the Fermi energy (EF) is decreasing to a certain value (2.30 states/eV), and then, there is an upturn to exhibit another peak in the lower-energy part for B12S. On the other hand, the peak close to EF is reduced to almost zero (0.38 states/eV), and then, the upturn exhibits another peak in the lower-energy part for B12Se. In this region, a strong hybridization between B 2p and S/Se 3p electronic orbitals is observed that leads to the formation of covalent bonds between B and S/Se atoms. The strength of this hybridization depends largely on the value of the density of states: when more states are involved in the hybridization, the covalent bond formed is stronger. Thus, the covalent bond formed between B and S in this region is much stronger than the covalent bond formed between B and Se atoms in this energy region. Therefore, a higher value of hardness is expected for B12S compared to B12Se, which is reflected well in the values presented in Table 4.
Figure 12.
Total and partial DOS for B12S and B12Se compounds as a function of electron energy. Red rectangles are drawn in the figure showing the difference in the values of DOS for both the compounds.
Now, we can compare the obtained values of hardness for titled compounds with some other B-rich compounds (ZrB12, HfB12, YB12, LuB12,WB12, and TiB12). Korozlu et al.12 have reported hardness values (using Gao et al.’s model67) of 40.1, 39.1, 36.5, and 32.3 GPa for ZrB12, HfB12,YB12, and LuB12, respectively. However, Pan and Jia13 have reported hardness values of 29.9 and 43.2 GPa for WB12 and TiB12, respectively, using Miao’s model. The hardness values of the above mentioned compounds are higher than those of our considered compounds. Some of them can be considered as superhard materials with hardness greater than 40 GPa (ZrB12 and TiB12), and the rest of them are considered as hard materials. We have also studied some B-rich compounds (B6X; X = S and Se) with hardness values of 33.60 and 35.57 GPa (using Chen’s formula) and categorized them as hard materials. Mazhnik and Oganov64 have also calculated the hardness of widely known hard materials such as B4C (32.6 GPa), B6O (35.5 GPa), β-SiC (34.8 GPa), SiO2 (30.0 GPa), WC (33.5 GPa), OsB2 (17.8 GPa), VC (26.5 GPa), Re2B (38.6 GPa), etc. It is seen that the calculated values of hardness for both the titled compounds using the aforementioned three models are significantly varied, ranging within 19–31 and 11–24 GPa for B12S and B12Se, respectively. Very recently, Solozhenko15 measured the microhardness of these compounds experimentally using Vicker hardness (HV) and Knoop hardness (HK) methods. The obtained values for B12S and B12Se compounds are 32 and 33 GPa using the HV method, whereas they are 26 and 22 GPa using the HK method, respectively. In our case, the calculated hardness using the HMiao model is reasonably consistent with experimental Knoop hardness values. Thus, by comparing the hardness values of the titled chalcogenides with those of the other mentioned compounds, we classify B12S as a potential hard material. However, the hardness of B12Se is slightly lower than those of all the other compounds, and it is likely to be a hard material.
For hard materials, fracture toughness (KIC) also carries significance like hardness for practical applications of solids.68 Fracture may occur within a solid under extreme conditions of external stress. In such cases, prior information regarding fracture toughness is crucially important because it provides the required guideline for use and gives a measure of the resistance of solids to stop the propagation of the induced fracture inside. A high value of fracture toughness is expected for hard materials for use in industrial purposes, and evaluation of the KIC receives significant scientific concerns.69−71 The obtained values of the hardness parameters inspire us to study the KIC of B12X (X = S and Se) using the formula KIC = V01/6 · G · (B/G)1/2.64 The calculated values of KIC are 4.27 and 3.13 MPam0.5 for B12S and B12Se, respectively, using the GGA, while they are 4.55 and 3.80 MPam0.5 obtained using the LDA. These values are higher than those of B6S (2.070 MPam0.5) and B6Se (2.072 MPam0.5).6 Moreover, Mazhnik and Oganov64 have also reported the KIC of superhard diamond (6.3 MPam0.5), WC (5.4 MPam0.5), and c-BN (5.4 MPam0.5), which are higher than those of B12S and B12Se. Overall, the fracture hardness values of boron-rich B12S and B12Se are reasonably high.
The hard materials are suitable for structural components in different sectors, but one of the great problems is their low level of machinability. A hard material with a higher machinability is a great combination for engineering applications. Thus, information regarding the machinability index (MI) calculated using the B/C44 ratio is crucial for predicting applications of hard materials.6,45 The obtained values of the MI are 1.57 (1.66) and 1.98 (1.85) for B12S and B12Se using the GGA (LDA) functional. These values are higher than those of B6S and B6Se. These values are also higher than those of some well-known machinable MAX phases,45 which predict that B12S and B12Se might be quite machinable.
The melting temperature, Tm, is estimated for both the studied chalcogenides using the following formula: Tm = 412 + (8.2 × C11).72 The obtained values of Tm are 4208 (4405) and 3577 (3995) K for B12S and B12Se compounds using the GGA (LDA) functional, respectively. These values are higher than those of B6S and B6Se.6 The compound B12S has a higher Tm than B12Se, and considering the computational uncertainty for using different functionals, it can be stated that the B12S and B12Se compounds should be stable at least up to 4208 and 3577 K, respectively, which are much higher values than the synthesis temperature of 2500 K.8 According to the Born criterion,73 the Tm of a material is related to the shear modulus (G) as well as the elastic stiffness constant C44. Melting of a material starts when G vanishes and the material becomes elastically unstable.74 Higher values of G and C44 correspond to the higher value of Tm. Our calculated values of Tm for both the compounds are consistent with the estimated G and C44 values as shown in Table 4.
3.5. Elastic Anisotropy
Elastic anisotropy should be taken into account for full description of the mechanical properties of solids, especially for hexagonal symmetry where the atomic arrangement varies largely along the a(b) and c axes. Moreover, it is also closely associated with unusual phonon modes, dislocation dynamics, precipitation, plastic deformation in solids, and microscale crack creation.75−77 Thus, information regarding elastic anisotropy of solids is very important for use in materials engineering and in crystal physics. Unfortunately, no unique method has been developed to measure the degree of anisotropy yet, and for this reason, we have used different models that are widely used.
First of all, we started with the
calculation of shear anisotropy factors that are defined for hexagonal
solids like B12S and B12Se as follows:  ,
, ,
, 78 for the {100},
{010}, and {001} planes in between ⟨011⟩ and ⟨010⟩,
⟨101⟩ and ⟨001⟩, and ⟨110⟩
and ⟨010⟩ directions, respectively. A unity (1) value
of A{100}, A{010}, and A{001} indicates the completely
isotropic nature otherwise. Values deviating from unity imply anisotropy.
The degree of deviation measures the level of anisotropy. The calculated
shear anisotropy factors are listed in Table 5, which shows that B12S and B12Se are anisotropic solids.
Table 5. Calculated Values of Different Anisotropy Indices: Shear Anisotropy Factors (A100, A010, and A001), Anisotropy in the Bulk Modulus (Ba and Bc), Compressibility (kc/ka), Percentage Anisotropy (AB and AG), and the Universal Anisotropy Index AU of Boron-Rich Chalcogenide B12X (X = S and Se) Compounds.
| phases | A100 | A010 | A001 | Ba | Bc | kc/ka | AB | AG | AU |
|---|---|---|---|---|---|---|---|---|---|
| B12S | 1.48 | 0.67 | 0.99 | 655 | 422 | 1.55 | 1.52 | 4.02 | 0.45 |
| B12Se | 1.90 | 0.73 | 1.39 | 614 | 368 | 1.67 | 2.11 | 19.52 | 2.46 |
The anisotropy in the bulk modulus and compressibility
are defined
as follows:  and
and  ,where Ba and Bc are bulk moduli along the a and c axes, Λ = 2(C11 + C12) + 4C13α + C33α2, and
  ,78 and
  , where ka and kc are the compressibilities along
the a and c axes, respectively.
The listed
values (Table 5) of Ba and Bc (Ba = Bc for isotropic
nature) and kc/ka (kc/ka =
1 for isotropic nature) confirmed the anisotropic nature of B12S and B12Se.
Chung and Buessem79 have introduced
the percentage anisotropy in compressibility and shear, which are
defined as follows:  and
and  . For isotropic solids, AB (AG) = 0; otherwise, anisotropic
nature is indicated. It is evident from Table 5 that both B12S and B12Se are slightly anisotropic.
The anisotropic nature of B12S and B12Se
is further revealed by calculating the universal anisotropy index, AU, using the relation80 , where V and R denote the upper
limit (Voigt, V) and lower limit
(Reuss, R) of bulk and shear moduli. The obtained
values of AU also confirmed that both
B12S and B12Se are mechanically anisotropic.
From the listed values of anisotropy constants as presented in Table 5, it is seen that
B12Se is more anisotropic than B12S.
In the second part of this section, we have assessed the degree of anisotropy graphically for the Young’s modulus, compressibility, shear modulus, and Poisson’s ratio and summarized those in Table 6. The study is completed by plotting the Young’s modulus, compressibility, shear modulus, and Poisson’s ratio in 2D and 3D using the ELATE code.81 The obtained 2D and 3D plots are presented in Figure 13a–d for B12S. Plots for B12Se are qualitatively similar and are not shown. Figure 13a demonstrates the anisotropic nature of the Young’s modulus (Y). As can be seen from the 2D plot, Y is isotropic in the xy plane but anisotropic in xz and yz planes. The maximum as well as minimum values are observed in the yz plane at different angles from the vertical or horizontal axis. The ratios between maximum and minimum values of Y are 1.69 and 3.22 for B12S and B12Se, respectively, i.e., B12Se is significantly more anisotropic than B12S as far as the Young’s modulus is concerned.
Table 6. The Minimum and the Maximum Values of the Young’s Modulus (Y), Compressibility (K), Shear Modulus (G), and Poisson’s Ratio (υ) of B12S and B12Se Compounds.
| phases | Ymin. (GPa) | Ymax. (GPa) | AY | Kmin. (TPa–1) | Kmax. (TPa–1) | AK | Gmin. (GPa) | Gmax. (GPa) | AG | υmin. | υmax. |
|---|---|---|---|---|---|---|---|---|---|---|---|
| B12S | 265.16 | 448.71 | 1.69 | 1.52 | 2.37 | 1.55 | 105.76 | 190.17 | 1.79 | 0.006 | 0.340 |
| B12Se | 119.67 | 385.62 | 3.22 | 1.63 | 2.72 | 1.66 | 43.30 | 160.36 | 3.70 | –0.23 | 0.85 |
Figure 13.
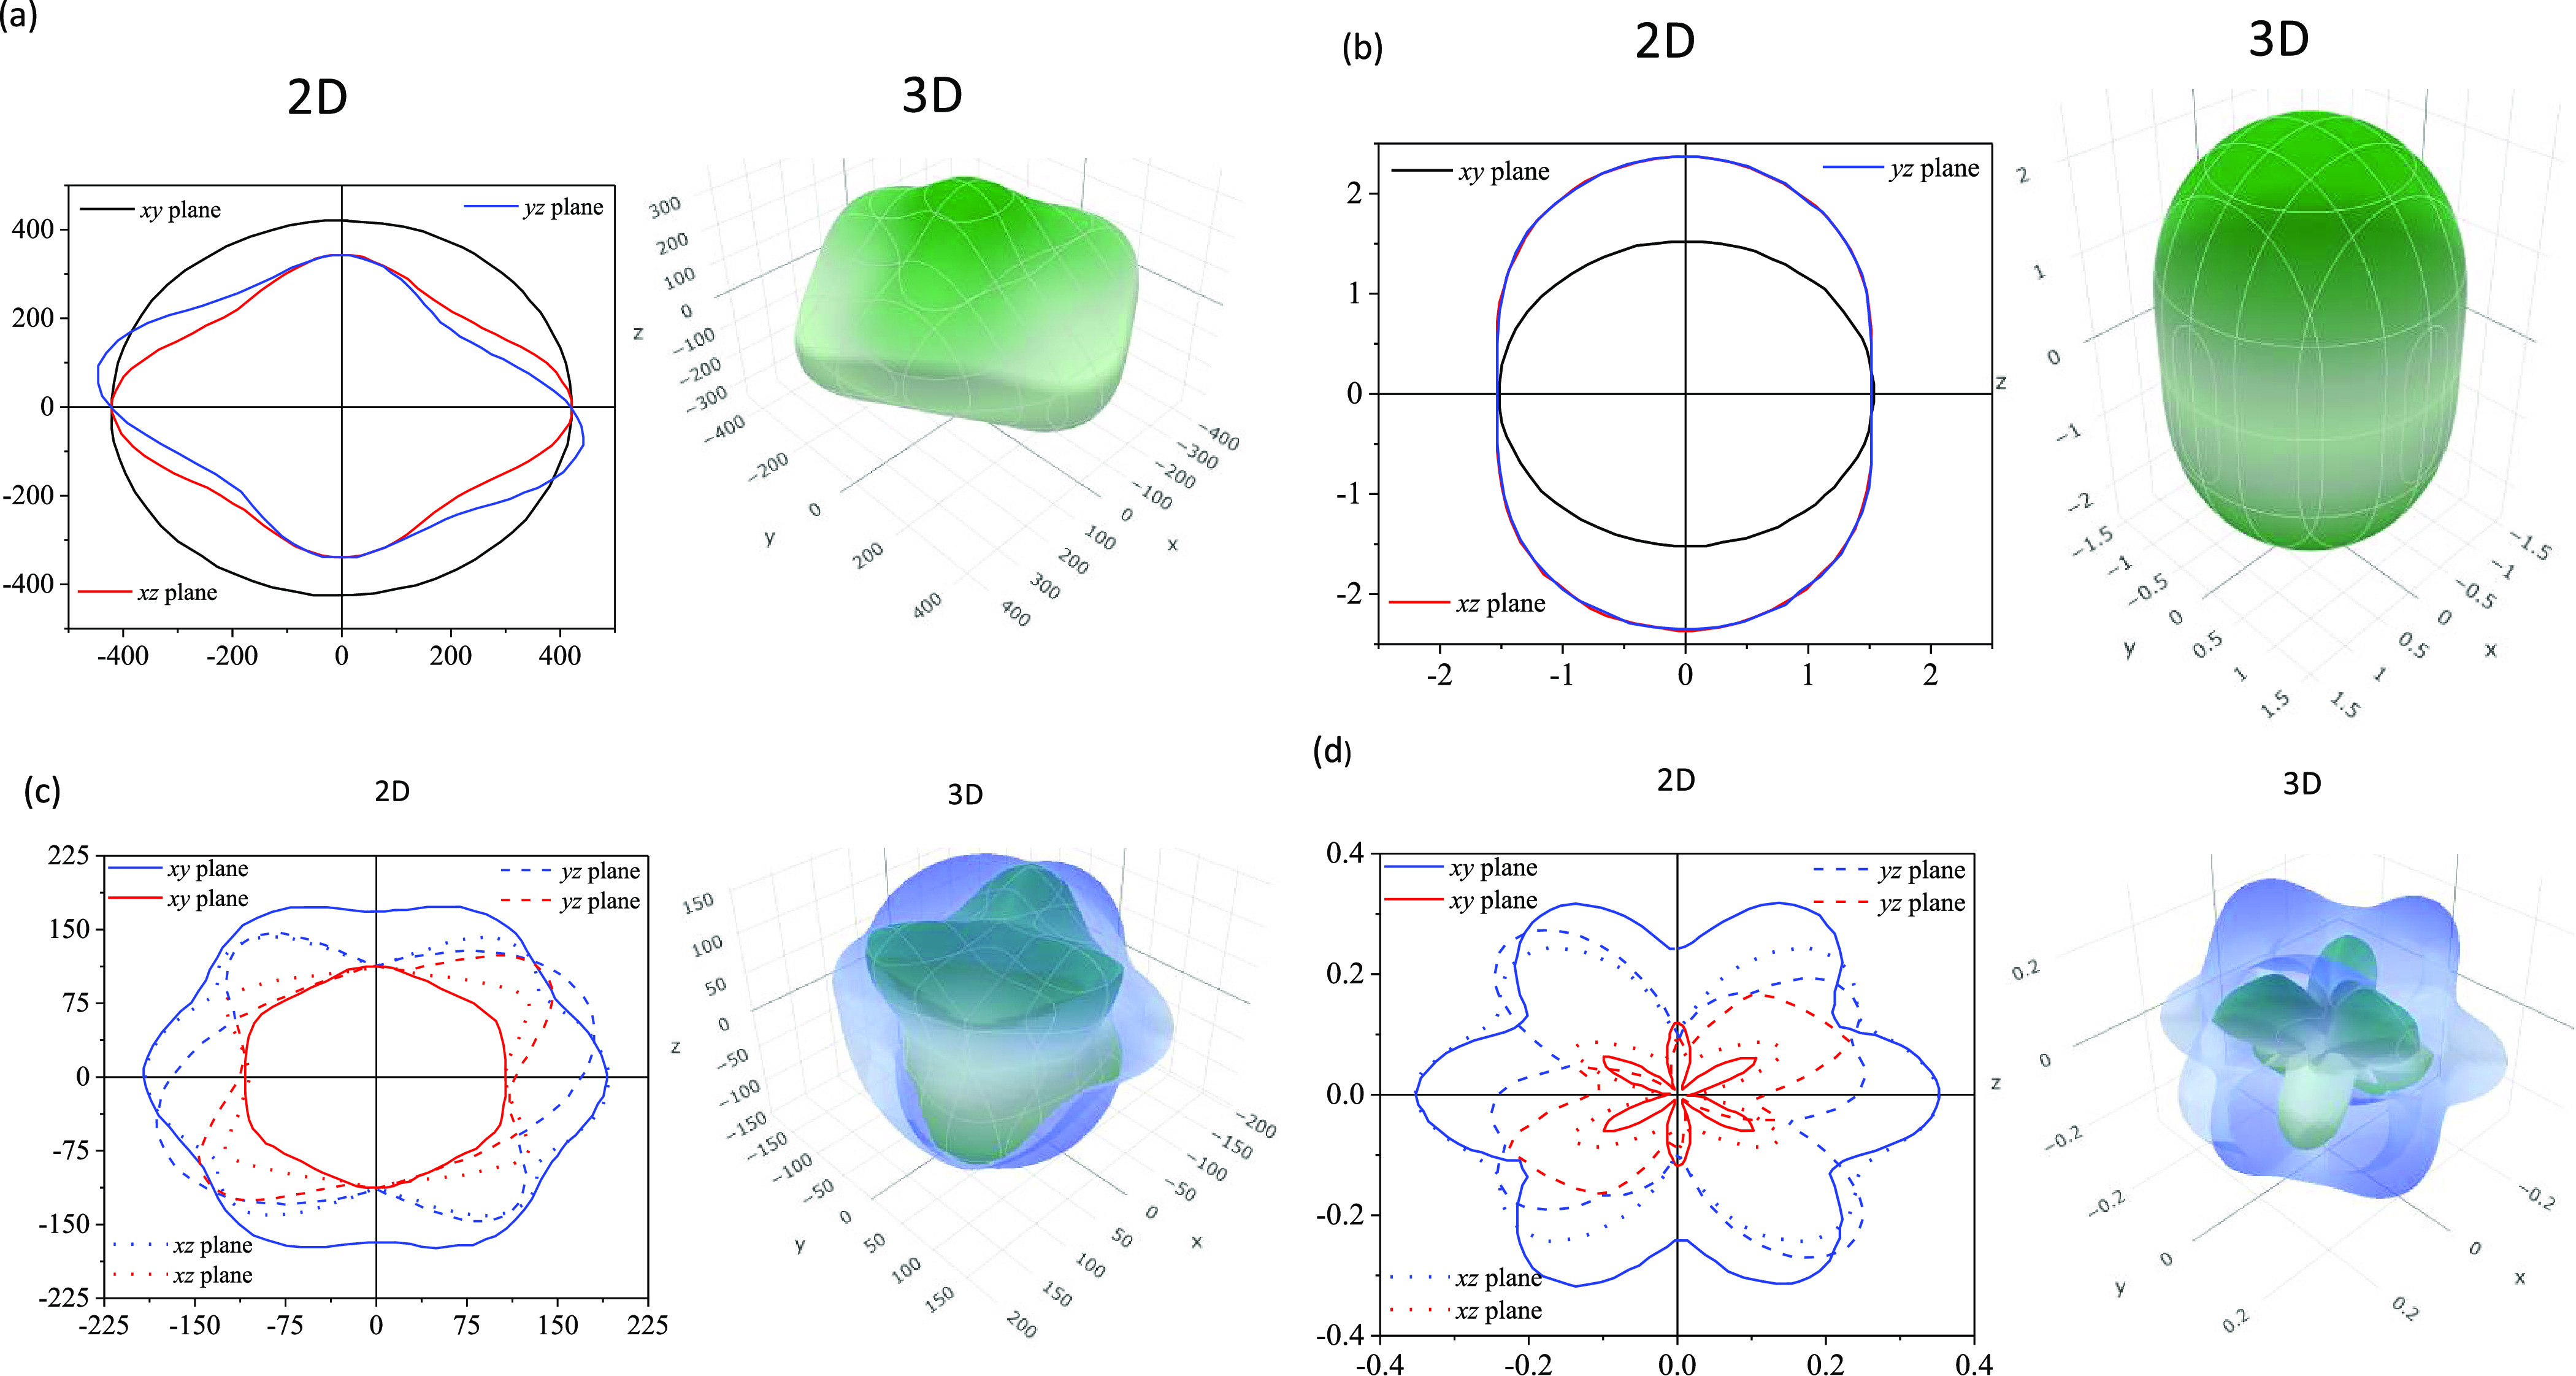
2D view and 3D view of (a) Young’s modulus (Y), (b) compressibility (K), (c) shear modulus (G), and (d) Poisson’s ratio (υ) for the chalcogenide B12S indicating the degree of anisotropy.
Figure 13b illustrates the anisotropic nature of compressibility (K), which is isotropic in the xy plane like Y. Both xz and yz planes exhibit similar anisotropic nature as well as degree in the anisotropy. For both the planes, the maximum of K lies on the vertical axis and minimum on the horizontal axis. The ratios between maximum and minimum values of K are 1.55 and 1.66 for B12S and B12Se, respectively, i.e., B12Se is slightly more anisotropic than B12S for compressibility.
Figure 13c displays a complex anisotropy feature in the shear modulus (G), different from Y and K. The G is not isotropic in any plane but exhibits two values for each point of the planes. The blue color indicates the maximum values, while the red color indicates the minimum values. The maximum of G is obtained on the horizontal axis of both xy and xz planes for both the compounds. For the yz plane, the maximum of G lies at some angle above the positive horizontal axis as well as at some angle below the negative horizontal axis for B12S. The maximum and minimum values of G lie almost midway of both horizontal and vertical axes in the yz plane for B12Se. The ratios between maximum and minimum values of G are 1.79 and 3.70 for B12S and B12Se, respectively, i.e., B12Se is significantly more anisotropic than B12S for G. The Poisson’s ratio reveals a similar type of anisotropy to G, with two curves for each plane but much more complex than that of G. For this case, the maximum and minimum values are also revealed by the outer and inner curves at each angle as shown in Figure 13d.
4. Conclusions
Density functional theory, incorporating different exchange–correlation functionals, is employed to characterize the structural, electronic band structure, and optical (dielectric function, refractive index, absorption coefficient, reflectivity, and loss function) properties of boron sub-sulfide (B12S) and boron sub-selenide (B12Se) compounds. Details of the mechanical properties such as different elastic moduli, Pugh’s ratio, Poisson’s ratio, various anisotropy parameters, fracture toughness, melting point, and machinability index have been estimated and discussed for the first time. The band gap is indirect in nature, and its value is exchange–correlation functional-sensitive. Large anisotropy in optical properties in the visible-light range to mid-UV is observed. The absorption coefficient for electric field polarization along the [100] direction of B12Se at the visible region is found to be 3.25 × 104 cm–1 that makes it competitive with renowned absorbance materials used in solar cell devices. The static value of the refractive index is comparable with some commercialized compounds such as corundum, silica glass, quartz, and soda lime glass. The lowest reflectivity spectrum starts with a value of 0.0742 (7.42%) for B12S and 0.0815 (8.15%) for the B12Se compound for the [001] polarization using the HSE06 functional. Such a pronounced absorption coefficient and a very low value of reflectivity spectra along with bulk optical anisotropy at the visible-light region are crucially important to design many optical devices such as LCD screens, screens for 3D movies, polarizers, wave plates, etc. Moreover, tunable band gaps of 2.27 and 1.30 eV for B12S and B12Se, respectively, using the HSE06 functional in the visible-light region also augur well for solar cell device application although a thorough efficiency calculation is required. In view of the mechanical properties, the studied compounds have strongly anisotropic characteristics with a weak brittle nature confirmed from the shear to bulk modulus ratio and the Poisson’s ratio. The calculated values of fracture toughness are 3.13 and 3.80 MPam0.5, at least, for B12S and B12Se, respectively, indicating high degrees of resistance to limit the propagation of the induced fracture in these two solids. The values of mechanical hardness using Miao’s model are 31 and 24 GPa using the LDA functional for B12S and B12Se, respectively, which are in reasonable agreement with experimental values. The origin of these high hardness values is successfully explained by considering the hybridization-dependent density of state values at the valence band near the Fermi level. Almost all the results disclosed in this work are novel in nature and should act as useful references for further investigations. We believe that our predicted results will inspire both experimentalists as well as theorists for further study of the physical properties of B12S and B12Se in the near future.
Acknowledgments
Authors are grateful to the Department of Physics, Chittagong University of Engineering & Technology (CUET), Chattogram 4349, Bangladesh, for providing the computing facilities for this work.
The authors declare no competing financial interest.
Notes
The datasets generated during the current study are available from the corresponding authors on a reasonable request.
References
- Cherednichenko K. A.; Mukhanov V. A.; Wang Z.; Oganov A. R.; Kalinko A.; Dovgaliuk I.; Solozhenko V. L. Discovery of New Boron-Rich Chalcogenides: Orthorhombic B6X (X=S, Se). Sci. Rep. 2020, 10, 9277. 10.1038/s41598-020-66316-y. [DOI] [PMC free article] [PubMed] [Google Scholar]
- Cherednichenko K. A.; Le Godec Y.; Solozhenko V. L. Equation of State of Boron Subarsenide B12As2 to 47 GPa. High Pressure Res. 2018, 38, 224–231. 10.1080/08957959.2018.1476507. [DOI] [Google Scholar]
- Emin D. Icosahedral Boron-Rich Solids. MRS Online Proc. Libr. 1987, 40, 55. 10.1063/1.881112. [DOI] [Google Scholar]
- Xia K.; Ma M.; Liu C.; Gao H.; Chen Q.; He J.; Sun J.; Wang H.-T.; Tian Y.; Xing D. Superhard and Superconducting B6C. Mater. Today Phys. 2017, 3, 76–84. 10.1016/j.mtphys.2017.12.003. [DOI] [Google Scholar]
- Bolmgren H.; Lundström T. The Crystal Structure of a New Boron Selenide, B12Se2–xBx. J. Alloys Compd. 1993, 202, 73–76. 10.1016/0925-8388(93)90520-W. [DOI] [Google Scholar]
- Hossain M. M.; Ali M. A.; Uddin M. M.; Islam A. K. M. A.; Naqib S. H. Origin of High Hardness and Optoelectronic and Thermo-Physical Properties of Boron-Rich Compounds B6X (X = S, Se): A Comprehensive Study via DFT Approach. J. Appl. Phys. 2021, 129, 175109. 10.1063/5.0047139. [DOI] [Google Scholar]
- Cherednichenko K. A.; Godec Y. L.; Solozhenko V. L. Equations of State of New Boron-Rich Selenides B6Se and B12Se. arXiv:2106.04317 [cond-mat] 2021, 267. 10.1080/08957959.2021.1961765. [DOI] [Google Scholar]
- Cherednichenko K. A.; Mukhanov V. A.; Kalinko A.; Solozhenko V. L. High-Pressure Synthesis of Boron-Rich Chalcogenides B12S and B12Se. arXiv:2105.04450 [cond-mat] 2021, 162874. 10.1016/j.jallcom.2021.162874. [DOI] [Google Scholar]
- Lee S.; Bylander D. M.; Kleinman L. Elastic Moduli of B12 and Its Compounds. Phys. Rev. B 1992, 45, 3245–3247. 10.1103/PhysRevB.45.3245. [DOI] [PubMed] [Google Scholar]
- Enyashin A. N.; Ivanovskii A. L. Structural, Elastic, and Electronic Properties of Icosahedral Boron Subcarbides (B12C3, B13C2), Subnitride B12N2, and Suboxide B12O2 from Data of SCC-DFTB Calculations. Phys. Solid State 2011, 53, 1569. 10.1134/S1063783411080117. [DOI] [Google Scholar]
- Wang B.; Fan Z.; Zhou Q.; Xu X.; Feng M.; Cao X.; Wang Y. First Principles Calculations of the Vibrational Properties of Icosahedral Solid Boron Oxygen B12O2. Phys. B 2011, 406, 297–303. 10.1016/j.physb.2010.10.073. [DOI] [Google Scholar]
- Korozlu N.; Colakoglu K.; Deligoz E.; Aydin S. The Elastic and Mechanical Properties of MB12 (M=Zr, Hf, Y, Lu) as a Function of Pressure. J. Alloys Compd. 2013, 546, 157–164. 10.1016/j.jallcom.2012.08.062. [DOI] [Google Scholar]
- Pan Y.; Jia Y. First-Principles Study of Structure and Mechanical Properties of TMB12(TM = W and Ti) Superhard Material under Pressure. J. Mater. Res. 2019, 34, 3554–3562. 10.1557/jmr.2019.275. [DOI] [Google Scholar]
- Sologub O.; Matsushita Y.; Mori T. An α-Rhombohedral Boron-Related Compound with Sulfur: Synthesis, Structure and Thermoelectric Properties. Scr. Mater. 2013, 68, 289–292. 10.1016/j.scriptamat.2012.10.044. [DOI] [Google Scholar]
- Solozhenko V.Hardness of New Boron-Rich Chalcogenides B12S and B12Se. 2021, 10.33774/chemrxiv-2021-4pn07. [DOI]
- Solozhenko V. L.Oxidation Resistance of Hard Boron-Rich Chalcogenides B6X and B12X (X = S, Se). 2021, 10.33774/chemrxiv-2021-nxv20. [DOI]
- Hohenberg P.; Kohn W. Inhomogeneous Electron Gas. Phys. Rev. 1964, 136, B864–B871. 10.1103/PhysRev.136.B864. [DOI] [Google Scholar]
- Perdew J. P.; Burke K.; Ernzerhof M. Generalized Gradient Approximation Made Simple. Phys. Rev. Lett. 1996, 77, 3865–3868. 10.1103/PhysRevLett.77.3865. [DOI] [PubMed] [Google Scholar]
- Segall M. D.; Lindan P. J. D.; Probert M. J.; Pickard C. J.; Hasnip P. J.; Clark S. J.; Payne M. C. First-Principles Simulation: Ideas, Illustrations and the CASTEP Code. J. Phys.: Condens. Matter 2002, 14, 2717–2744. [Google Scholar]
- Hossain M. M.; Hossain M. A.; Moon S. A.; Ali M. A.; Uddin M. M.; Naqib S. H.; Islam A. K. M. A.; Nagao M.; Watauchi S.; Tanaka I. NaInX2 (X = S, Se) Layered Materials for Energy Harvesting Applications: First-Principles Insights into Optoelectronic and Thermoelectric Properties. J. Mater. Sci.: Mater. Electron. 2021, 32, 3878–3893. 10.1007/s10854-020-05131-7. [DOI] [Google Scholar]
- Ali M. A.; Anwar Hossain M.; Rayhan M. A.; Hossain M. M.; Uddin M. M.; Roknuzzaman M.; Ostrikov K.; Islam A. K. M. A.; Naqib S. H. First-Principles Study of Elastic, Electronic, Optical and Thermoelectric Properties of Newly Synthesized K2Cu2GeS4 Chalcogenide. J. Alloys Compd. 2019, 781, 37–46. 10.1016/j.jallcom.2018.12.035. [DOI] [Google Scholar]
- Kohn W.; Sham L. J. Self-Consistent Equations Including Exchange and Correlation Effects. Phys. Rev. 1965, 140, A1133–A1138. 10.1103/PhysRev.140.A1133. [DOI] [Google Scholar]
- Ehrenreich H.; Cohen M. H. Self-Consistent Field Approach to the Many-Electron Problem. Phys. Rev. 1959, 115, 786–790. 10.1103/PhysRev.115.786. [DOI] [Google Scholar]
- Fischer T. H.; Almlof J. General Methods for Geometry and Wave Function Optimization. J. Phys. Chem. 1992, 96, 9768–9774. 10.1021/j100203a036. [DOI] [Google Scholar]
- Monkhorst H. J.; Pack J. D. Special Points for Brillouin-Zone Integrations. Phys. Rev. B 1976, 13, 5188–5192. 10.1103/PhysRevB.13.5188. [DOI] [Google Scholar]
- Park S.; Lee B.; Jeon S. H.; Han S. Hybrid Functional Study on Structural and Electronic Properties of Oxides. Curr. Appl. Phys. 2011, 11, S337–S340. 10.1016/j.cap.2010.09.008. [DOI] [Google Scholar]
- Schira R.; Latouche C. DFT and Hybrid-DFT Calculations on the Electronic Properties of Vanadate Materials: Theory Meets Experiments. New J. Chem. 2020, 44, 11602–11607. 10.1039/D0NJ02316G. [DOI] [Google Scholar]
- Feng J.; Xiao B. Effective Masses and Electronic and Optical Properties of Nontoxic MASnX3 (X = Cl, Br, and I) Perovskite Structures as Solar Cell Absorber: A Theoretical Study Using HSE06. J. Phys. Chem. C 2014, 118, 19655–19660. 10.1021/jp506498k. [DOI] [Google Scholar]
- Clark S. J.; Segall M. D.; Pickard C. J.; Hasnip P. J.; Probert M. I. J.; Refson K.; Payne M. C. First Principles Methods Using CASTEP. Z. Kristallogr. Cryst. Mater. 2005, 220, 567–570. 10.1524/zkri.220.5.567.65075. [DOI] [Google Scholar]
- Hadi M. A.; Vovk R. V.; Chroneos A. Physical Properties of the Recently Discovered Zr2(Al1–xBix)C MAX Phases. J. Mater. Sci.: Mater. Electron. 2016, 27, 11925–11933. 10.1007/s10854-016-5338-z. [DOI] [Google Scholar]
- Matkovich V. I. Interstitial Compounds of Boron. J. Am. Chem. Soc. 1961, 83, 1804–1806. 10.1021/ja01469a008. [DOI] [Google Scholar]
- Lundström T. Structure and Bulk Modulus of High-Strength Boron Compounds. J. Solid State Chem. 1997, 133, 88–92. 10.1006/jssc.1997.7320. [DOI] [Google Scholar]
- Gao J.; Zeng W.; Tang B.; Zhong M.; Liu Q.-J. Optical, Electronic, and Mechanical Properties of p-Type Conductive Oxide BaBiO3: A Density Functional Theory Study. Chem. Phys. Lett. 2020, 761, 138054. 10.1016/j.cplett.2020.138054. [DOI] [Google Scholar]
- Green M. A. Intrinsic Concentration, Effective Densities of States, and Effective Mass in Silicon. J. Appl. Phys. 1990, 67, 2944–2954. 10.1063/1.345414. [DOI] [Google Scholar]
- Wang J.; Shu H.; Zhao T.; Liang P.; Wang N.; Cao D.; Chen X. Intriguing Electronic and Optical Properties of Two-Dimensional Janus Transition Metal Dichalcogenides. Phys. Chem. Chem. Phys. 2018, 20, 18571–18578. 10.1039/C8CP02612B. [DOI] [PubMed] [Google Scholar]
- Benzie P. W.; Elston S. J.. Optics of Liquid Crystals and Liquid Crystal Displays. In Handbook of Visual Display Technology; Chen J., Cranton W., Fihn M., Eds.; Springer: Berlin, Heidelberg, 2012; pp. 1365–1385, 10.1007/978-3-540-79567-4_85. [DOI] [Google Scholar]
- Penn D. R. Wave-Number-Dependent Dielectric Function of Semiconductors. Phys. Rev. 1962, 128, 2093–2097. 10.1103/PhysRev.128.2093. [DOI] [Google Scholar]
- Liton M. N. H.; Roknuzzaman M.; Helal M. A.; Kamruzzaman M.; Islam A. K. M. F. U.; Ostrikov K.; Khan M. K. R. Electronic, Mechanical, Optical and Photocatalytic Properties of Perovskite RbSr2Nb3O10 Compound. J. Alloys Compd. 2021, 867, 159077. 10.1016/j.jallcom.2021.159077. [DOI] [Google Scholar]
- Tauc J.; Menth A. States in the Gap. J. Non-Cryst. Solids 1972, 8-10, 569–585. 10.1016/0022-3093(72)90194-9. [DOI] [Google Scholar]
- Makuła P.; Pacia M.; Macyk W. How To Correctly Determine the Band Gap Energy of Modified Semiconductor Photocatalysts Based on UV–Vis Spectra. J. Phys. Chem. Lett. 2018, 9, 6814–6817. 10.1021/acs.jpclett.8b02892. [DOI] [PubMed] [Google Scholar]
- Roknuzzaman M.; Hadi M. A.; Ali M. A.; Hossain M. M.; Jahan N.; Uddin M. M.; Alarco J. A.; Ostrikov K. First Hafnium-Based MAX Phase in the 312 Family, Hf3AlC2: A First-Principles Study. J. Alloys Compd. 2017, 727, 616–626. 10.1016/j.jallcom.2017.08.151. [DOI] [Google Scholar]
- Ali M. S.; Islam A. K. M. A.; Hossain M. M.; Parvin F. Phase Stability, Elastic, Electronic, Thermal and Optical Properties of Ti3Al1–xSixC2 (0≤x≤1): First Principle Study. Phys. B 2012, 407, 4221–4228. 10.1016/j.physb.2012.07.007. [DOI] [Google Scholar]
- Ali M. A.; Hadi M. A.; Hossain M. M.; Naqib S. H.; Islam A. K. M. A. Theoretical Investigation of Structural, Elastic, and Electronic Properties of Ternary Boride MoAlB. Phys. Status Solidi B 2017, 254, 1700010. 10.1002/pssb.201700010. [DOI] [Google Scholar]
- Ali M. A.; Hossain M. M.; Islam A. K. M. A.; Naqib S. H. Ternary Boride Hf3PB4: Insights into the Physical Properties of the Hardest Possible Boride MAX Phase. J. Alloys Compd. 2021, 857, 158264. 10.1016/j.jallcom.2020.158264. [DOI] [Google Scholar]
- Ali M. A.; Hossain M. M.; Uddin M. M.; Hossain M. A.; Islam A. K. M. A.; Naqib S. H. Physical Properties of New MAX Phase Borides M2SB (M = Zr, Hf and Nb) in Comparison with Conventional MAX Phase Carbides M2SC (M = Zr, Hf and Nb): Comprehensive Insights. J. Mater. Res. Technol. 2021, 11, 1000–1018. 10.1016/j.jmrt.2021.01.068. [DOI] [Google Scholar]
- Materials Science and Engineering: An Introduction, 10th Edition | Wiley https://www.wiley.com/en-us/Materials+Science+and+Engineering%3A+An+Introduction%2C+10th+Edition-p-9781119405498 (accessed 2021–07 -29).
- Gencer A. Electronic and Optical Properties of ASc2S4 (A = Ca, Sr) Compounds. Phys. Scr. 2021, 96, 075805 10.1088/1402-4896/abf796. [DOI] [Google Scholar]
- Jiang C. First-Principles Study of Structural, Elastic, and Electronic Properties of Chromium Carbides. Appl. Phys. Lett. 2008, 92, 041909 10.1063/1.2838345. [DOI] [Google Scholar]
- Ali M. A.; Naqib S. H. Recently Synthesized (Ti1–xMox)2AlC (0 ≤ x ≤ 0.20) Solid Solutions: Deciphering the Structural, Electronic, Mechanical and Thermodynamic Properties via Ab Initio Simulations. RSC Adv. 2020, 10, 31535–31546. 10.1039/D0RA06435A. [DOI] [PMC free article] [PubMed] [Google Scholar]
- Masys Š.; Jonauskas V. A First-Principles Study of Structural and Elastic Properties of Bulk SrRuO3. J. Chem. Phys. 2013, 139, 224705. 10.1063/1.4840435. [DOI] [PubMed] [Google Scholar]
- Mouhat F.; Coudert F.-X. Necessary and Sufficient Elastic Stability Conditions in Various Crystal Systems. Phys. Rev. B 2014, 90, 224104. 10.1103/PhysRevB.90.224104. [DOI] [Google Scholar]
- Voigt W.Lehrbuch der kristallphysik (mit ausschluss der kristalloptik); B.G. Teubner [J.W. Edwards: Leipzig; Berlin; [Ann Arbor, Mich., 1946.
- Reuss A. Berechnung Der Fließgrenze von Mischkristallen Auf Grund Der Plastizitätsbedingung Für Einkristalle. ZAMM - J. Appl. Math. Mech. 1929, 9, 49–58. 10.1002/zamm.19290090104. [DOI] [Google Scholar]
- Hill R. The Elastic Behaviour of a Crystalline Aggregate. Proc. Phys. Soc. A 1952, 65, 349–354. 10.1088/0370-1298/65/5/307. [DOI] [Google Scholar]
- Ali M. A.; Hossain M. M.; Uddin M. M.; Islam A. K. M. A.; Jana D.; Naqib S. H. DFT Insights into New B-Containing 212 MAX Phases: Hf2AB2 (A = In, Sn). J. Alloys Compd. 2021, 860, 158408. 10.1016/j.jallcom.2020.158408. [DOI] [Google Scholar]
- Hossain M. S.; Ali M. A.; Hossain M. M.; Uddin M. M. Physical Properties of Predicted MAX Phase Borides Hf2AB (A = Pb, Bi): A DFT Insight. Mater. Today Phys. 2021, 27, 102411. 10.1016/j.mtcomm.2021.102411. [DOI] [Google Scholar]
- Ali M. A.; Hossain M. M.; Hossain M. A.; Nasir M. T.; Uddin M. M.; Hasan M. Z.; Islam A. K. M. A.; Naqib S. H. Recently Synthesized (Zr1-XTix)2AlC (0 ≤ x ≤ 1) Solid Solutions: Theoretical Study of the Effects of M Mixing on Physical Properties. J. Alloys Compd. 2018, 743, 146–154. 10.1016/j.jallcom.2018.01.396. [DOI] [Google Scholar]
- Rahaman M. M.; Rubel M. H. K.; Rashid M. A.; Alam M. A.; Hossain K. M.; Hossain M. I.; Khatun A. A.; Hossain M. M.; Islam A. K. M. A.; Kojima S.; Kumada N. Mechanical, Electronic, Optical, and Thermodynamic Properties of Orthorhonmbic LiCuBiO4 Crystal: A First–Priciples Study. J. Mater. Res. Technol. 2019, 8, 3783–3794. 10.1016/j.jmrt.2019.06.039. [DOI] [Google Scholar]
- Barua P.; Hossain M. M.; Ali M. A.; Uddin M. M.; Naqib S. H.; Islam A. K. M. A. Effects of Transition Metals on Physical Properties of M2BC (M = V, Nb, Mo and Ta): A DFT Calculation. J. Alloys Compd. 2019, 770, 523–534. 10.1016/j.jallcom.2018.08.155. [DOI] [Google Scholar]
- Hossain M. M.; Ali M. A.; Uddin M. M.; Hossain M. A.; Rasadujjaman M.; Naqib S. H.; Nagao M.; Watauchi S.; Tanaka I. Influence of Se Doping on Recently Synthesized NaInS2-XSex Solid Solutions for Potential Thermo-Mechanical Applications Studied via First-Principles Method. Mater. Today Phys. 2021, 26, 101988. 10.1016/j.mtcomm.2020.101988. [DOI] [Google Scholar]
- Pugh S. F. XCII. Relations between the elastic moduli and the plastic properties of polycrystalline pure metals. London Edinburgh Philos. Mag. J. Sci. 1954, 45, 823–843. 10.1080/14786440808520496. [DOI] [Google Scholar]
- Chen X.-Q.; Niu H.; Li D.; Li Y. Modeling Hardness of Polycrystalline Materials and Bulk Metallic Glasses. Intermetallics 2011, 19, 1275–1281. 10.1016/j.intermet.2011.03.026. [DOI] [Google Scholar]
- Miao N.; Sa B.; Zhou J.; Sun Z. Theoretical Investigation on the Transition-Metal Borides with Ta3B4-Type Structure: A Class of Hard and Refractory Materials. Comput. Mater. Sci. 2011, 50, 1559–1566. 10.1016/j.commatsci.2010.12.015. [DOI] [Google Scholar]
- Mazhnik E.; Oganov A. R. A Model of Hardness and Fracture Toughness of Solids. J. Appl. Phys. 2019, 126, 125109. 10.1063/1.5113622. [DOI] [Google Scholar]
- USPEX Tools and Utilities — USPEX https://uspex-team.org/en/uspex/tools (accessed 2021–07 -29).
- Jhi S.-H.; Ihm J.; Louie S. G.; Cohen M. L. Electronic Mechanism of Hardness Enhancement in Transition-Metal Carbonitrides. Nature 1999, 399, 132–134. 10.1038/20148. [DOI] [Google Scholar]
- Gao F.; He J.; Wu E.; Liu S.; Yu D.; Li D.; Zhang S.; Tian Y. Hardness of Covalent Crystals. Phys. Rev. Lett. 2003, 91, 015502 10.1103/PhysRevLett.91.015502. [DOI] [PubMed] [Google Scholar]
- Ashby M. F.; Cebon D. Materials Selection in Mechanical Design. J. Phys. IV France 1993, 03, C7-1–C7-9. 10.1051/jp4:1993701. [DOI] [Google Scholar]
- Ding Z.; Zhou S.; Zhao Y. Hardness and Fracture Toughness of Brittle Materials: A Density Functional Theory Study. Phys. Rev. B 2004, 70, 184117. 10.1103/PhysRevB.70.184117. [DOI] [Google Scholar]
- Niu H.; Niu S.; Oganov A. R. Simple and Accurate Model of Fracture Toughness of Solids. J. Appl. Phys. 2019, 125, 065105 10.1063/1.5066311. [DOI] [Google Scholar]
- King S. W.; Antonelli G. A. Simple Bond Energy Approach for Non-Destructive Measurements of the Fracture Toughness of Brittle Materials. Thin Solid Films 2007, 515, 7232–7241. 10.1016/j.tsf.2007.02.106. [DOI] [Google Scholar]
- Haque E. Outstanding Thermoelectric Performance of MCu3X4 (M = V, Nb, Ta; X = S, Se, Te) with Unaffected Band Degeneracy under Pressure. ACS Appl. Energy Mater. 2021, 4, 1942. 10.1021/acsaem.0c03043. [DOI] [Google Scholar]
- Born M. Thermodynamics of Crystals and Melting. J. Chem. Phys. 1939, 7, 591–603. 10.1063/1.1750497. [DOI] [Google Scholar]
- Zhu L.-F.; Grabowski B.; Neugebauer J. Efficient Approach to Compute Melting Properties Fully from Ab Initio with Application to Cu. Phys. Rev. B 2017, 96, 224202. 10.1103/PhysRevB.96.224202. [DOI] [Google Scholar]
- Ledbetter H.; Migliori A. A General Elastic-Anisotropy Measure. J. Appl. Phys. 2006, 100, 063516 10.1063/1.2338835. [DOI] [Google Scholar]
- Tvergaard V.; Hutchinson J. W. Microcracking in Ceramics Induced by Thermal Expansion or Elastic Anisotropy. J. Am. Ceram. Soc. 1988, 71, 157–166. 10.1111/j.1151-2916.1988.tb05022.x. [DOI] [Google Scholar]
- Lloveras P.; Castán T.; Porta M.; Planes A.; Saxena A. Influence of Elastic Anisotropy on Structural Nanoscale Textures. Phys. Rev. Lett. 2008, 100, 165707. 10.1103/PhysRevLett.100.165707. [DOI] [PubMed] [Google Scholar]
- Ravindran P.; Fast L.; Korzhavyi P. A.; Johansson B.; Wills J.; Eriksson O. Density Functional Theory for Calculation of Elastic Properties of Orthorhombic Crystals: Application to TiSi2. J. Appl. Phys. 1998, 84, 4891–4904. 10.1063/1.368733. [DOI] [Google Scholar]
- Chung D. H.; Buessem W. R. The Elastic Anisotropy of Crystals. J. Appl. Phys. 1967, 38, 2010–2012. 10.1063/1.1709819. [DOI] [Google Scholar]
- Ranganathan S. I.; Ostoja-Starzewski M. Universal Elastic Anisotropy Index. Phys. Rev. Lett. 2008, 101, 055504 10.1103/PhysRevLett.101.055504. [DOI] [PubMed] [Google Scholar]
- Gaillac R.; Pullumbi P.; Coudert F.-X. ELATE: An Open-Source Online Application for Analysis and Visualization of Elastic Tensors. J. Phys.: Condens. Matter 2016, 28, 275201. 10.1088/0953-8984/28/27/275201. [DOI] [PubMed] [Google Scholar]


