Abstract
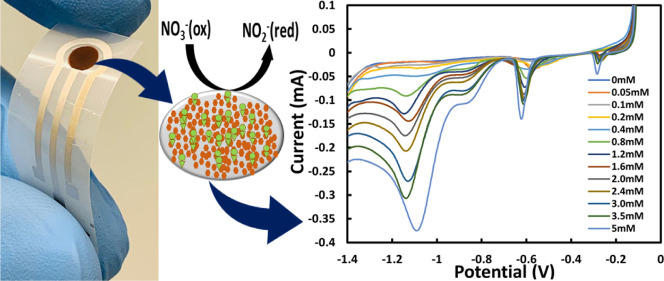
Nitrate (NO3–) contamination is becoming a major concern due to the negative effects of an excessive NO3– presence in water which can have detrimental effects on human health. Sensitive, real-time, low-cost, and portable measurement systems able to detect extremely low concentrations of NO3– in water are thus becoming extremely important. In this work, we present a novel method to realize a low-cost and easy to fabricate amperometric sensor capable of detecting small concentrations of NO3– in real water samples. The novel fabrication technique combines printing of a silver (Ag) working electrode with subsequent modification of the electrode with electrodeposited copper (Cu) nanoclusters. The process was tuned in order to reach optimized sensor response, with a high catalytic activity toward electroreduction of NO3– (sensitivity: 19.578 μA/mM), as well as a low limit of detection (LOD: 0.207 nM or 0.012 μg/L) and a good dynamic linear concentration range (0.05 to 5 mM or 31 to 310 mg/L). The sensors were tested against possible interference analytes (NO2–, Cl–, SO42–, HCO3–, CH3COO–, Fe2+, Fe3+, Mn2+, Na+, and Cu2+) yielding only negligible effects [maximum standard deviation (SD) was 3.9 μA]. The proposed sensors were also used to detect NO3– in real samples, including tap and river water, through the standard addition method, and the results were compared with the outcomes of high-performance liquid chromatography (HPLC). Temperature stability (maximum SD 3.09 μA), stability over time (maximum SD 3.69 μA), reproducibility (maximum SD 3.20 μA), and repeatability (maximum two-time useable) of this sensor were also investigated.
Introduction
In the past decades, contamination of water sources by industrial and agricultural activities has become a major concern all over the world. Among the various water and soil contaminants, the substances most incriminated are surely nitrate ions (NO3–).1 Indeed, NO3– ions are widely used not only in fertilizers but also as an additive to enhance color and flavor or as an agent to prevent food poisoning from Clostridium botulinum in food industries.2 However, a high level of NO3– has several detrimental effects on human health since NO3– can be converted into different harmful nitrogen compounds such as nitrite (NO2–), nitric oxide, and N-nitrosamines, which can cause liver disease and gastric cancer.3 An excessive NO3– intake is also responsible for infant methemoglobinemia, commonly known as blue baby syndrome.4 Because of its toxic influence on human health, the World Health Organization (WHO) and European Directives have set the maximum contaminant level (MCL) of NO3– in public drinking water to be 50 mg/L (ca. 0.8 mM).5 It is therefore of uttermost importance to determine the correct levels of NO3–, especially in drinking water.
To date, different methodologies have been developed to identify the level of NO3– in water, such as flow injection analysis, capillary electrophoresis, ion chromatography, liquid chromatography-tandem mass spectrometry, spectrophotometry, chemiluminescence, high-performance liquid chromatography (HPLC), and gas chromatography–mass spectrometry.6,7 Although these techniques are sensitive and specific and allow a wide range of detection, several drawbacks are connected to their use, especially the need to utilize highly expensive, time-consuming, sophisticated instruments and the requirement of trained personnel. Alternative methods able to detect NO3– in a proper, quick, and cost-effective way without sacrificing sensitivity and selectivity are therefore of great interest. In this context, electrochemical sensors are a promising class of analytical devices as alternatives to the above-mentioned screening techniques. A wide range of electrochemical sensors have been proven to be promising in comparison to traditional methods because of their simplicity, selectivity, portability, and miniaturization.8,9
Up to now, various types of electrochemical sensors have been used to detect NO3– in water, such as potentiometric, amperometric, and conductometric with or without the incorporation of enzymes.10−13 The nonenzymatic electrochemical sensors for NO3– detection can be realized using different types of sensitive materials. For example, different metals like copper (Cu), platinum (Pt), silver (Ag), and gold (Au) have been used as catalysts for electroreduction of NO3– in amperometric electrochemical sensors.14−17 Among these electrocatalytic metals, Cu has been proven to be one of the most effective metals to catalyze the electroreduction of NO3–,18,19 mainly because of its high conductivity (5.8 × 10⁷ S/m) that improves the charge transfer; in addition, compared to other metals, Cu is also less expensive.20,21 Recently, researchers have demonstrated the ability to lower the detection limit [limit of detection (LOD)] of electrochemical NO3– sensors at a concentration as low as 10 μM (620 μg/L) by increasing the electroactive surface area using nanostructured Cu.10,22 For example, Essousi et al.23 were able to improve the LOD using a working electrode (WE) made of ion-imprinted polymer coated with Cu nanoparticles, whereas Wu et al.24 realized the NO3– sensor with a LOD low as 12.2 μM (7.44 μg/L) with a linear range of 50–600 μM (3.1–37.2 mg/L) using Cu nanoparticles by thermal oxidation. Therefore, taking advantage of the above cited methods in a more cost-effective way, we decided to deposit a rough Cu nanostructured layer on top of our WE using electrodeposition. Electrodeposition is a well-established, easy, cost-effective, and large-area scalable deposition technique of pure metal, metal alloy, or oxide, where the growth process can be easily kinetically controlled by changing the deposition time and current density in cyclic voltammetry (CV) or chronoamperometry.25−27 In comparison with other deposition methods, such as e-beam evaporation, sputtering, and pulsed laser deposition, electrodeposition does not need expensive equipment for ultrahigh vacuum and high temperature.28 Moreover, Cu can be easily electrodeposited in the form of nanoclusters or nanoparticles on top of different bulky electrodes, such as glassy carbon, graphite felt, and disk electrodes, as reported, for example, by Bagheri et al.,10 Lu et al.,29 and Stortini et al.,30 respectively. Additionally, we decided to use screen printing, a fabrication technique that enables the development of flexible, disposable, and cheap electrochemical sensors.31 To the best of our knowledge, there is no work reporting modification of amperometric electrochemical printed silver WEs with Cu electrodeposition to detect NO3– in water.
In this work, we developed a flexible screen-printed amperometric electrochemical NO3– sensor functionalized by electrodeposited Cu metal nanoclusters. The uniqueness of the proposed sensor consists in the possibility of combining two low-cost and scalable techniques such as screen printing and electrodeposition, which allows to realize cost-effective, disposable, easy to use sensors on a polymeric substrate with a sensing performance (LOD and linear detection range) comparable to that reported by other authors who employed complex multilayer structures.15,32 The proposed sensor showed a high capability of detecting NO3– in water with a low calculated LOD (0.207 nM or 0.012 μg/L) and a wide dynamic concentration range (50 to 5000 μM or 31 to 310 mg/L) by using linear sweep voltammetry (LSV). The analysis of the effect of most common interfering analytes, for example, Cl–, NO2–, SO42–, HCO3–, Fe2+, Fe3+, CH3COO–, Mn2+, Na+, and Cu2+, yielded negligible effects on NO3– detection. Moreover, sensor stability over time and temperature, reproducibility, and repeatability were also investigated. Finally, the proposed sensors were employed to detect NO3− in tap and river water and were in good agreement with HPLC results with a relative recovery (RR) of 102.3 and 107.5% and a coefficient of variance of 3.65 and 2.86%, respectively.
Results and Discussion
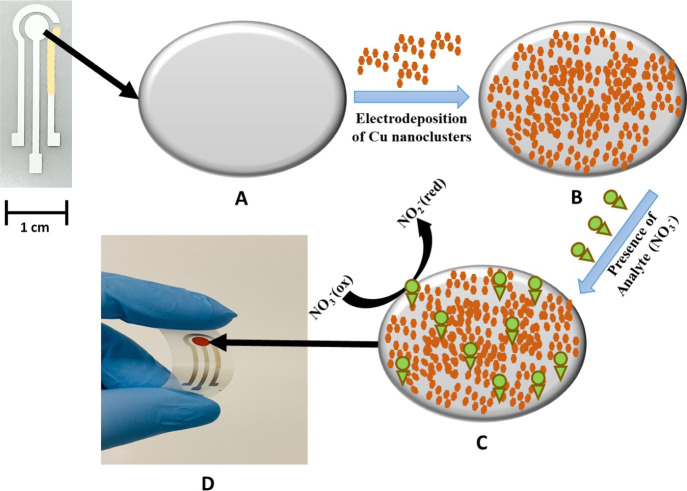
Figure 1 shows the fabrication process and detection mechanism of the proposed cost-effective, easy to fabricate NO3– sensor. Briefly, Ag and AgCl were screen-printed on a flexible polyethylene (PET) film, and the WE was functionalized with electrodeposited nanoclusterized Cu. More information on the sensor fabrication can be found in the experimental section.
Figure 1.
Schematic illustration of the fabrication process and the detection mechanism of the proposed nitrate (NO3–) sensor: (A) Screen-printed silver (Ag) WE (B) modified with electrodeposited copper (Cu), leading to (C) NO3– reduction. (D) Micrograph of the cost-effective, flexible, screen-printed electrochemical NO3– sensor.
Morphological and Compositional Characterization
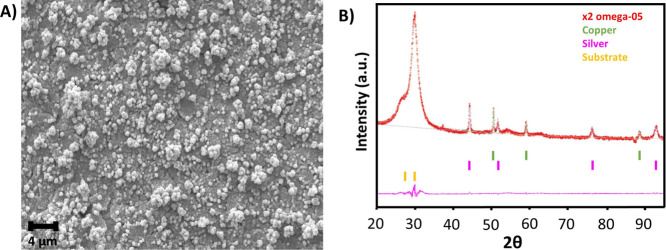
Figure 2A shows the WE morphology after the Cu electrodeposition. As shown in the figure, the deposited Cu is characterized by a globular nanocluster shape, where the diameter of each globule is in the range of 0.5–1 μm. The obtained morphology and size of the Cu nanocluster were uniform all over the WE and consistent with the results previously obtained by Li et al.33 The Cu coverage and uniformity are clearly visible if Figure 2A is compared with the scanning electron microscopy (SEM) image of the bare Ag electrode (Figure S2A). Cu deposited on the surface of the WE was characterized by X-ray diffraction (XRD) to evaluate the crystallographic structure. The XRD pattern, as presented in Figure 2B, shows peaks at positions (2θ) of 50.6, 59.1, and 88.6°corresponding to the Bragg reflections of crystalline Cu(111), (200), and (220), respectively. Additionally, crystalline Ag was also indicated by the presence of peaks at positions of 44.5, 51.5, 76.1, and 92.8°. This pattern confirms the successful coverage of crystalline Cu on top of the Ag WE. Moreover, the observation was quite similar to that of Chen et al.34 who showed that the morphology of the Cu deposited by electrocrystallization is controlled by the different surface energies of the crystallographic plane.35 The composition of the surface of the WE estimated by performing energy-dispersive X-ray spectroscopy (EDS) analysis is presented in Figure S3. The analysis of the considered EDS peaks reveals concentrations of 80% of Cu, 15% of Ag, 4% of C, and 0.5% of O, which are in the expected range, considering the type of deposition and processes used to fabricate the sample, and also reveals that most of the electrode is well covered with electrodeposited Cu.
Figure 2.
Surface morphology and composition of Cu deposited on the screen-printed Ag WE: (A) SEM micrograph showing the surface characterized by a uniform deposition of Cu nanoclusters. (B) XRD pattern of the Cu electrodeposited on top of the Ag WE.
The results from a 3D optical profilometer showed that the thickness and roughness of the WE electrode increased after the Cu deposition from 10.1 ± 0.7 to 14.2 ± 1.5 μm and from 1.4 ± 0.4 to 5.7 ± 0.1 μm, respectively. This observation was consistent with the SEM micrographs (Figures 2A and S2), proving that the electrodeposition process increased the electrode surface area by the formation of Cu nanoclusters.
Electrochemical Characterization
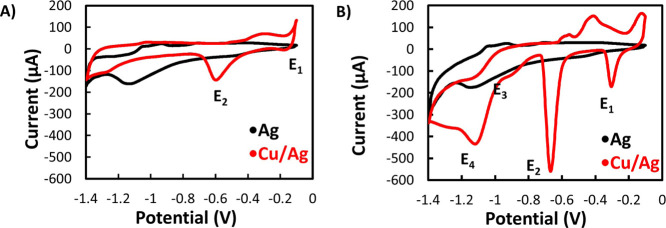
Figure 3A shows the CV obtained at a scan rate of 100 mV for the bare Ag electrode and the Cu/Ag electrode in a blank solution (0 mM NO3– in 0.1 M KCl). In the case of the bare Ag electrode, the curve shows a reduction peak at −1.15 V due to the reduction of Ag, which disappears in the case of the Ag/Cu electrode, proving the full Cu coverage. Instead, in the latter electrode, the CV shows one cathodic peak at −0.2 V (E1) and another at −0.6 V (E2). Peaks E1 and E2 are ascribed to the reduction of Cu(I) and Cu(II), as described by eqs 1 and 2
| 1 |
| 2 |
Figure 3.
(A) CV analysis using Ag electrode (black) and Ag electrode with electrodeposited Cu modification (Ag/Cu, red) in a blank solution (0 mM of NO3–) of 0.1 M KCl electrolyte. (B) CV analysis of Ag (black) and Ag/Cu (red) with the presence of 3 mM NO3– in 0.1 M KCl. Screen-printed AgCl was used as the RE.
After the addition of 3 mM NO3– in the electrolyte solution, the CV of the bare Ag electrode remains unchanged; instead, two additional reduction peaks (E3 and E4) appeared for the Ag/Cu electrode (Figure 3B) which correspond to the reduction of NO3– (E3) and NO2– (E4) ions that happen consecutively.36 Indeed, as described by eqs 3 and 4, the primary product of NO3– reduction is NO2–, which is in turn reduced to form NH3 during the potential scan37
| 3 |
| 4 |
The cathodic peaks for NO3– and NO2– reduction occurred at −0.86 and −1.15 V, respectively, as also reported by Lotfi Zadeh Zhad and Lai.38
The NO3– reduction peak amplitude can be influenced by the processing parameters of the Cu electrodeposition, such as the deposition potential and the time or the cycle number of deposition performed using CV as shown by Li et al.33 To optimize the Cu deposition process, six different numbers of CV cycles (2, 5, 7, 10, 15, and 20) were performed on similar WEs. After the electrodeposition, each electrode, characterized by different CV cycles of Cu electrodeposition, was examined with four different NO3– concentrations (0, 0.1, 0.8, and 1.6 mM) as plotted in Figure S1, where the reduction peak current versus the NO3– concentration is shown. The sensitivity of each electrode was calculated and plotted with the current reduction peak at 1.6 mM of NO3– versus the number of CV cycles in Figure 4. The sensitivity as well as the reduction peak current reached the highest value for 10 cycles of CV of Cu electrodeposition, and then on increasing the CV cycles, they stabilized at a plateau value. From this result, we can infer that 10 CV cycles of Cu deposition correspond to the highest value of the electroactive surface area that provides more electrochemical accessibility for NO3–39 and hence regarded as the optimized CV cycle for Cu deposition. More than 10 cycles of CV may generate excess Cu deposition which reduces the electrode porosity and so the electroactive surface area. Indeed, SEM images taken from samples modified with 2, 5, 10, and 15 CV cycles revealed that with 5 CV cycles, the Cu nanoclusters were nonuniform all over the WE and the underneath Ag was clearly visible (Figure S2B). On the other hand, 10 cycles showed uniform distribution of the Cu nanoclusters all over the Ag electrode surface (Figure S2C), and from 15 CV cycles, the surface showed an increase of Cu but only clusterized in the area at a higher Cu concentration (Figure S2D).
Figure 4.
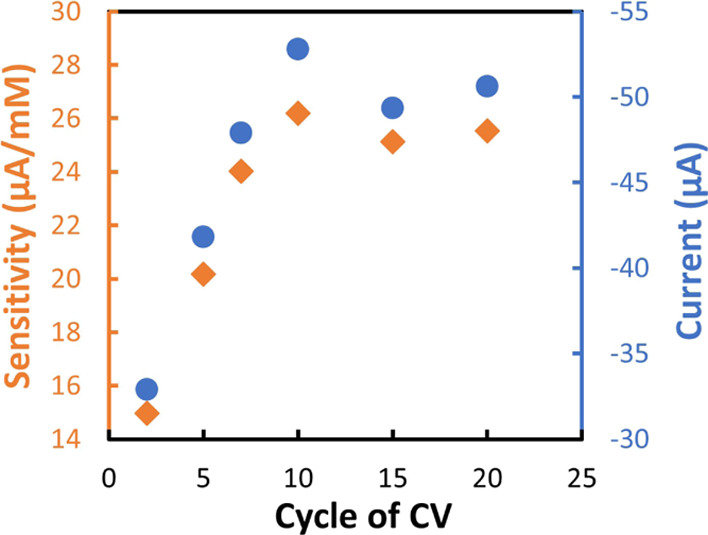
Sensitivity and current reduction peak at 1.6 mM of the NO3– sensor prepared through different CV cycles of Cu electrodeposition.
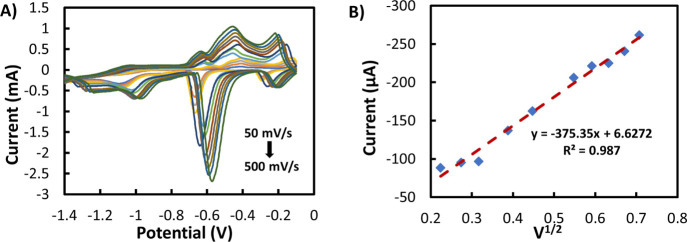
To evaluate the nature of the NO3– electrochemical reaction of screen-printed Cu/Ag electrodes, the effect of the scan rate (50 to 500 mV s–1) on the reduction peak current was investigated, as shown in Figure 5A. The cathodic peak current increased linearly with the increase of the scan rate (Figure 5B), suggesting a diffusion-controlled reduction process as described by the Randles-Sevcik40eq 5
| 5 |
where ip is the peak current, n is the number of electron transfers (here it is 2 for NO3–), α is the cathodic electron transfer coefficient, A is the active surface area (cm2), Do is the diffusion coefficient (2.0 × 10⁻⁶ cm2 s–1 for NO3–),41 v is the scan rate (V s–1), and C is the NO3– concentration (mol cm–3). On the contrary, the potential (Ep) at which the NO3– reduction occurs shifted negatively with the increment of scan rate as shown in Figure S4A. This characteristic behavior is associated with a diffusion-controlled irreversible electron transfer process.42
Figure 5.
(A) Cyclic voltammogram at 3.0 mM NO3– at various scan rates. (B) Linear relationship of peak current versus square root of the scan rate of the Cu/Ag electrode.
To investigate the kinetics of an electrode, the half-peak potential (Ep/2) is often examined.43 The magnitude of ΔEp/2 (= Ep – Ep/2) was calculated and plotted against the scan rate as shown in Figure S4B. It is noticeable that ΔEp/2 is constant at various scan rates (from 50 to 500 mV s–1) with an average value of 80 ± 2 mV, proving that the transfer coefficient of NO3– reduction reaction was independent of the scan rate.
By employing eq 5, the effective electrochemical surface areas of both Ag and Cu/Ag WEs were calculated and found to be 0.062 and 0.111 cm2, respectively, showing that the Cu electrodeposition induced an increase in the effective surface of around 77%.
Sensor Performance for NO3– Detection
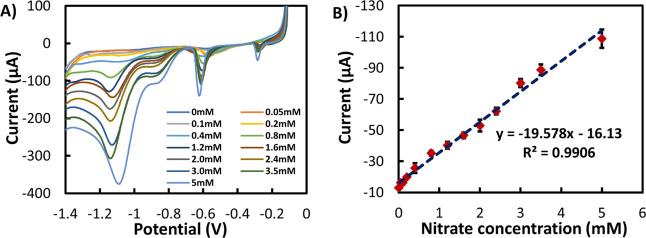
To evaluate the analytical performance of the sensor, LSV was employed with different concentrations of NO3– in 0.1 M KCl solution (Figure 6A). The calibration curve, shown in Figure 6B, was realized by averaging the NO3– reduction peak current of three samples at each concentration (0.05 to 5 mM of NaNO3) with the standard deviation (SD). The curve showed a linear detection range from 0.05 to 5 mM with a sensitivity of 19.58 μA/mM and a coefficient of determination (R2) of 99.06% indicating an excellent linear fit.
Figure 6.
(A) LSV at different concentrations of NO3– in 0.1 M KCl. (B) Calibration curve of the Cu/Ag sensor for NO3– detection (NO3– reduction peak current vs NO3– concentration). Each point represents the average peak current performed by three sensors, where the SD with error bars is shown.
LOD was calculated from the following formula
| 6 |
where I0 is the generated peak current at 0 mM NO3– and m is the slope of the linear response curve calculated by the following formula
| 7 |
where I1 is the generated current for concentration C1 and I0 is the generated current for C0 or blank measurement.47
The calculated LOD was 0.207 nM, which is significantly lower compared to other reported nitrate sensors realized using screen-printed carbon electrode as shown in Table 1.11,20,44−46 Also the linear detection range (0.05–5 mM) and sensitivity (19.08 μA/mM) of the proposed sensor revealed good performance when compared with previously reported screen-printed NO3– sensors (Table 1). Furthermore, NO3– reduction reactions were investigated using KCl solution as a neutral medium. Few research works have been done for NO3– reduction reaction within neutral pH;36,37 indeed, Na2SO4 pH 2.0 has been used in most cases to obtain better sensitivity.10,30 In this work, the KCl electrolyte solution has proved to be an excellent medium and provided the opportunity to directly measure NO3– content in real water samples without the need to change the electrolyte pH and without interfering with the sensor’s performance.
Table 1. Comparison between the Performance of Different Screen-Printed NO3– Sensors.
| electrode | method | linear range (mM) | sensitivity (μA/mM) | LOD (nM) | R2 | refs |
|---|---|---|---|---|---|---|
| screen-printed graphite | amperometry | 0.1–10 | 0.12 | 100 | 0.999 | (11) |
| screen-printed carbon | amperometry | 0.015–0.250 | 0.005 | 5500 | 0.996 | (44) |
| screen-printed carbon | potentiometry | 0.1–100 | 100 | (45) | ||
| screen-printed carbon | amperometry | 0.01–0.25 | 3.13 | 0.97 | (46) | |
| screen-printed carbon | potentiometry | 0.001–10 | 1000 | (20) | ||
| screen-printed silver | amperometry | 0.05–5 | 19.08 | 0.21 | 0.987 | this work |
We also found that the amplitude of the reduction peak of Cu (II) (peak E2 in Figure 3B) increased linearly with the increasing NO3– concentration. This observation can be explained by the catalytic effect of Cu. Filimonov and Shcherbakov48 showed that cuprous ion exhibits the catalytic effect with any nitrogen-containing compound which is electrochemically active, and thus, Cu(II) peak (Figure S5) can also be used to detect NO3–.
Effect of Temperature
The effect of temperature on the sensor performance is another important aspect to evaluate since it can directly impact the kinetics of the sensor’s electrochemical reaction. Thus, the NO3– reduction peak current of the sensor in the presence of 0.8 mM of NO3– was evaluated in a range of temperature from 10 to 40 °C. Figure 7 shows that the overall reduction peak current increased with increasing temperature, although it was stable between 25 and 35 °C. This is an expected behavior since as reported by Cho et al.,49 the reaction rate increases with temperature leading to higher current. Despite this phenomenon that can be accounted, for example, by integrating a temperature sensor on the back of the polymeric substrate, the sensors showed good performance at different temperatures with a maximum SD of 3.09 μA.
Figure 7.
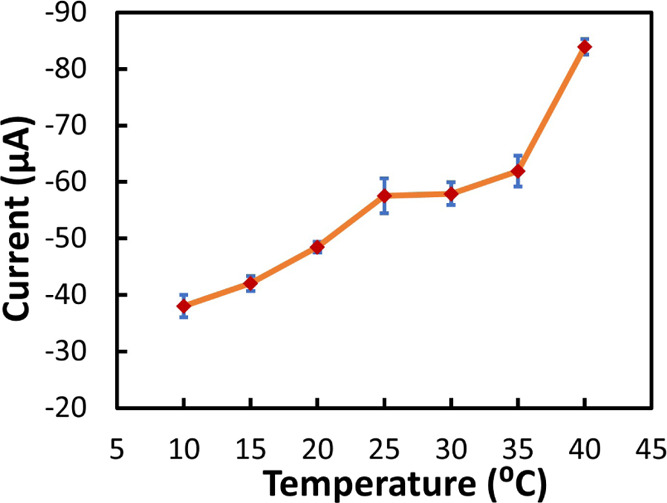
Effect of temperature (10, 15, 20, 25, 30, 35, and 40 °C) on sensor response (reduction peak current of 0.8 mM NO3–).
Interference Study
There are potential anions and cations (Cl–, NO2–, SO42–, HCO3–, Fe2+, Fe3+, CH3COO–, Mn2+, Na+, and Cu2+) commonly found in water that can interfere with NO3– detection,10,39 and hence a comprehensive interference study was performed in this work. At first, the influence of Cl– was investigated as it is considered as one of the most potential interfering agents14,50 and also the main component of the electrolyte solution employed. Since 0.1 M KCl was used as the electrolyte in this work, two other concentrations of KCl (0.5 and 1 M) have been prepared and mixed with 0.8 mM NO3– to investigate the possible interference on the cathodic reduction peak, as shown in Figure S6A. The currents for 0.1, 0.5, and 1 M KCl were 33.23 ±2.28, 34.01 ± 1.83, and 32.75 ± 0.52 μA, respectively, showing that the KCl concentration did not interfere with NO3– detection.
The selectivity of the Ag/Cu sensor was investigated by evaluating the change of the reduction peak of NO3– (at −0.85 V) in the presence of 0.8 mM of different possible interfering ions (NO2–, SO42–, HCO3–, Fe2+, Fe3+, CH3COO–, Mn2+, Na+, and Cu2+). As shown in Figure S6B, the amplitudes of the current peak at −0.85 V for all these interferents were similar to the value of the blank solution (0 mM NaNO3 in 0.1 M KCl). In addition, these interferents were prepared in the presence of 0.8 mM NO3– in 0.1 M KCl solution in order to evaluate the possible cointerference. It was found that the current amplitude of the NO3– reduction peak of the coexistence of different interferents were within the same range of pure NO3–. Each experiment was done in triplicate, and the results are shown in Figure 8 with error bars from SD. The maximum variation of the reduction current peak was found for the SO42– solution as 3.9 μA. From the data, it is observable that there was very little or no interference because of the presence of these ions.
Figure 8.
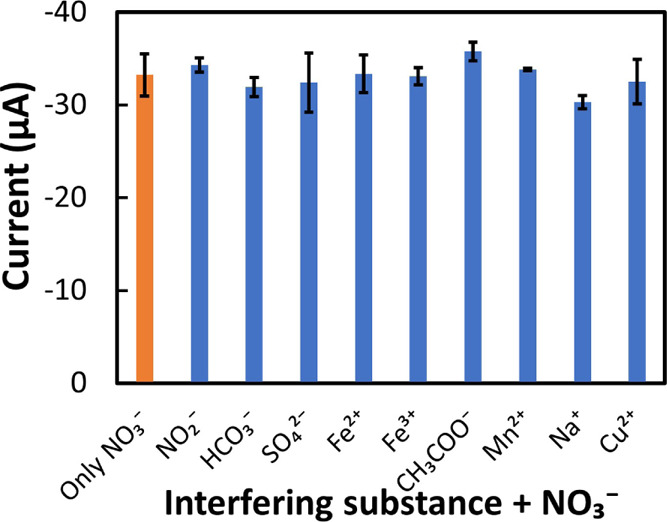
Interference study using a reduction peak current of only 0.8 mM NO3– (orange color) and 0.8 mM other interferents (NO2–, SO42–, HCO3–, Fe2+, Fe3+, CH3COO–, Mn2+, Na+, and Cu2+) (blue color) in the presence of 0.8 mM NO3–.
Reproducibility, Repeatability, and Stability of the Sensor
Important parameters for the sensor evaluation in practical applications are repeatability, reproducibility, and stability over time. The repeatability and reproducibility of the proposed sensors were assessed via repeated measurements performed on the same electrode and on three electrodes at the same conditions, respectively. Specifically, the repeatability test was performed using the same sensor 10 consecutive times and comparing the amplitude of the reduction current peak at 0.8 mM of NO3– with the first measurement to calculate the relative SD (RSD). Each time after examining the sensor with NO3–, the sensor was rinsed with DI water and dried with compressed air and kept ready for the next test. The sensor has stable behavior only up to the second measurement, which is characterized by a reduction of 3% of the NO3– cathodic peak from the first one (Figure S7). Instead, from the third measurement, the sensor showed a very high reduction of the peak current which was 24% less compared to the first test. This was an expected result since a screen printable sensor is meant to be disposable after one-time use (or maximum two times) for the gradual decaying of the sensor, and indeed, the continuous applying of the potential can degrade the performance of the pseudo-reference electrode (RE).51
For the reproducibility test, the samples were tested at five different concentrations of NO3– (0.05, 0.1, 0.8, 1.6, and 3.0 mM), while the measurement on each concentration was performed three times and RSD was found to be 0.82, 1.50, 2.30, 1.73, and 2.16 μA, respectively, showing good reproducibility. This result is ascribed to the good quality of the overall fabrication process: both screen printing and electrodeposition guarantee an excellent homogeneity and reproducibility of the deposition of the sensitive material.52
To investigate the shelf life of the proposed sensor, NO3– reduction current peak stability versus time was tested for 1 month. In this test, all sensors were fabricated at the same time and kept in a cool dry place at room temperature (RT). Tests were performed using the same NO3– concentration (0.8 mM) every week. The average results of the reduction current peaks from five samples are shown in Figure 9 with error bars. The error bars from the SD values increased gradually, remaining below 2.00 μA after the third week, and reached a maximum of 3.69 μA after the fourth week. From the calibration curve, the SD value of 0.8 mM concentration was 2.3 μA. The performance of the sensor degrades and fluctuates over time, likely as a consequence of the formation of the oxidative layer on top of both Ag and Cu. This can be solved by preparing and storing the sensor in a nitrogen atmosphere and avoiding contamination.
Figure 9.
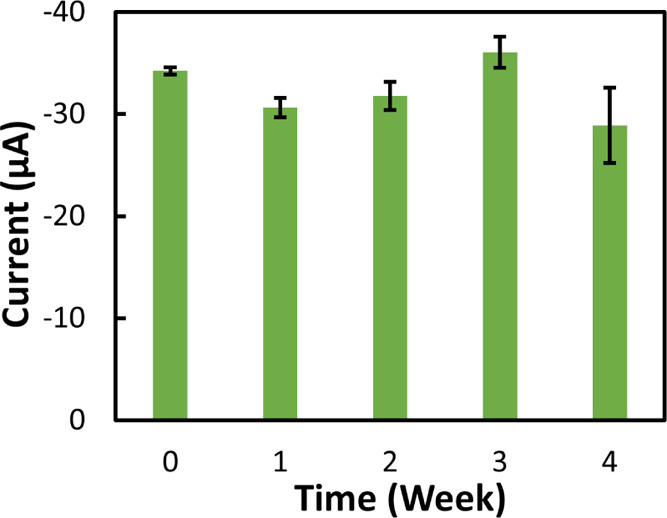
Stability test for the Cu/Ag sensor: the reduction peak (average of five samples) of 0.8 mM NO3– repeated each week until 1 month.
NO3– Detection in Water
To investigate the applicability of the proposed sensor, it is important to test it in real water samples. Thus, the sensor was tested with tap and river water by using the standard addition method.53 0.8 mM of NO3– was added to the real sample without any extra preparation or purification. Each experiment was done in triplicate under identical conditions. The results are shown in Table 2 with RSD and RR. The results of Ag/Cu sensors were in good agreement with those of HPLC for both tap and river water with a RR of 102.3 and 107.5% with a coefficient of variance of 3.65 and 2.86%, respectively. HPLC was calibrated (R2 = 0.9988) before the real water sample test using double distilled water with a wide range of NO3– concentration from 0.1 to 6 mM. These results indicated that the matrix effect was almost negligible with respect to the performance of the sensor in real sample analysis, showing promising feasibility of the employment of the proposed sensor for the determination of NO3– in water samples.
Table 2. NO3– Detection in Different Water Samples.
| sample | added (mM) | detected by sensor (mM) | RR (%) | detected by HPLC (mM) |
|---|---|---|---|---|
| tap water | 0.8 | 0.838 ± 0.045 | 102.3 | 0.858 ± 0.040 |
| river water | 0.8 | 0.840 ± 0.038 | 107.5 | 0.903 ± 0.028 |
Conclusions
In this work, a flexible, low-cost, easy to fabricate screen-printed electrochemical sensor was presented for NO3– detection in water. Initially, the sensor fabrication was optimized in terms of the number of cycles of CV for Cu electrodeposition. The resulting sensor was characterized by nanocluster formed Cu with a 77.4% increase of the electroactive surface area if compared with the bare silver electrode. Under optimal conditions, NO3– could be quantitatively determined in the range extending from 0.05 to 5.0 mM with a calculated LOD of 0.218 nM in neutral media. The sensor showed a high reproducibility with a maximum RSD of 2.60 μA. From the repeatability test, it was confirmed that the same sensor can be used only twice, which is acceptable for a low-cost disposable sensor. Furthermore, the stability test proved that the sensor can be kept in a normal environment for 3 weeks with minimal change in the reduction peak current. The effects of different interfering ions to the sensors were negligible proving the selectivity of the sensor in real water measurements. Additionally, the sensor showed good performance at different temperatures (maximum SD was 3.09 μA). Finally, this electrochemical sensor was investigated with real samples, tap and river water, and validated against HPLC, proving the ability to the sensor to be used in a real application. The proposed sensor can be easily implemented in the industrial sector as a low-cost, fast, specific, and sensitive sensor for NO3– detection. In the future, the sensor can be further improved in terms of sensitivity by using a different transducing platform, such as an electrolyte-gated field-effect transistor, and in terms of portability by realizing a custom-made portable read-out system.
Experimental Section
Reagents and Apparatus
Chemicals in this work (all were of analytical grade) were used without further purification. Double-distilled water (resistivity below 18.2 Ω cm) was used for the preparation of all solutions. Sodium nitrate (NaNO3), copper sulfate (CuSO4·5H2O), sulfuric acid (H2SO4), potassium chloride (KCl), sodium bicarbonate (NaHCO3), sodium sulfate (Na2SO4), sodium chloride (NaCl), ferrous sulfate (FeSO4), ferric chloride hexa hydrate (FeCl3·6H2O), sodium acetate (CH3COONa), manganese sulfate (MnSO4), and sodium nitrite (NaNO2) were purchased from Merck KGaA (Germany). A flexible 125 μm thick PET was used as a substrate (Rauch GmbH, Germany). Silver chloride (AgCl) (ECI 6038E) and Ag (ECI 1011) screen printable inks were purchased from LOCTITE E&C (CA, USA) and used for the electrode fabrication. 0.1 M CuSO4·5H2O (pH adjusted to 2.0 by 0.1 M H2SO4) was used for the electrodeposition of Cu, and 0.1 M KCl was used as electrolyte in all measurements. Tap water was collected from the lab (city water supply network in Bolzano, Italy) and river water was collected from the Adige river in Bolzano, Italy. Cu electrodeposition and all electrochemical measurements were performed by using VersaSTAT 4 electrochemical workstation (Princeton Applied Research, USA) at RT. To determine the NO3– concentration of tap and river water samples, a 1525 Waters HPLC system (Waters Corporations, MA, USA) was used. The HPLC was equipped with a binary pump, an auto-sampler injection system, a Symmetry C18 Column (2.1 × 50 mm, 3.5 μm), and a photodiode array detector (PDA 2998) set at 286 nm.
Electrode Fabrication
A semiautomatic screen-printing machine (C290, Aurel automation S.P.A., Italy) was used to print the typical three-electrode amperometric electrochemical sensor structure on the PET flexible substrate. The screen-printed flexible electrodes consist of an Ag WE of 4 mm diameter working area, an Ag counter electrode, and an Ag/AgCl pseudo-RE, as shown in Figure 1. The fabrication of the screen-printed three-electrode structure involved two steps as described by Shkodra et al.54 Initially, the Ag ink was screen-printed on cleaned PET and annealed at 120 °C for 15 min; subsequently, the upper half of the RE was coated with the AgCl ink, and the electrodes were annealed again at 120 °C for 15 min (see Figure 1A). Afterward, the electrodes were ultrasonically cleaned in isopropyl alcohol and double distilled water for 5 min in a bath sonicator (CP 104, Vetrotecnica, Italy) at RT.
Copper Nanocluster Deposition
For the Cu nanocluster deposition, 0.1 M CuSO4·5H2O solution was prepared in acidic condition (pH = 2.0) by using 0.1 M H2SO4. Electrodeposition was performed on the WE electrode by CV using different cycles (from 2 to 20) at RT while scanning potentials between −1.0 and 0 V with a scan rate of 0.1V s–1, following the procedure from Mumtarin et al.36 (see Figure 1B).
Electrochemical Characterization
CV in the potential range from −0.1 to −1.4 V at different scan rates (50 to 500 mV s–1) was used to evaluate the electrochemical nature of the NO3– reaction at the modified WE electrode surface and to calculate its electroactive surface area. To perform sensitivity tests, LSV was applied in the potential range of −0.1 to −1.4 V at 0.01 V s–1 scan rate using different NO3– concentrations (0.05 to 5.0 mM) in the KCl electrolyte solution. LSV over CV was chosen because LSV can clearly show each peak of the consecutive reactions of NO3– reduction.55 To examine the effect of temperature, the proposed sensor was tested by changing the electrolyte temperature from 10 to 40 °C. The other tests, namely, the interference study, repeatability, reproducibility, stability, and real sample analysis were examined using the MCL of NO3– in water, 0.8 mM, set by WHO and European Directives.30
Morphological and Compositional Characterization
SEM (Quanta 600F, FEI, USA), XRD, and EDS measurements were performed to reveal the surface morphology of Cu nanocluster deposition and also the crystal structure of Cu on Ag electrodes and the elemental analysis on the electrode surface. To acquire XRD measurements, an Italstructures IPD3000 diffractometer equipped with a Co anode source (line focus), a multilayer monochromator to suppress k–β radiation, and fixed 100 μm slits was used. Samples were positioned in reflection geometry with a fixed 5°angle with respect to the incident beam to maximize the signal from the sample surface with respect to the substrate; powder patterns were acquired by means of an Inel CPS120 detector over 5–120° 2-theta range (0.03° per channel). The total acquisition time for each sample was 1800 s. EDS (Bruker, Quantax 200 6/30) with the no-standard P/B ZAF package was used to record EDS spectra with an acquisition time of 30 s and an acceleration voltage of 20 kV. The thickness and roughness of Ag and Cu-deposited Ag (Cu/Ag) were evaluated by a noncontact 3D optical profilometer (ProFilm3D from Filmetrics, Unterhaching, Germany).
Acknowledgments
The authors wish to thank Dr. Mohammad Abul Hasnat from the Shahjalal University of Science and Technology (Sylhet, Bangladesh) for useful discussion and technical suggestions and Dr. Fabio Valentinuzzi from the Free University of Bolzano-Bozen (Bolzano, Italy) for providing technical assistance and data interpretation during the HPLC experiment. Dr. Mauro Bortolotti from the Faculty of Engineering of the University of Trento, Italy, is gratefully acknowledged for performing XRD measurements and offering support and suggestions to data interpretation. Mattia Ronchi from the Service for Microstructural Analysis of Materials (SAMM, Politecnico di Milano, IT) is greatly acknowledged for performing the SEM and EDS analyses. The group of Prof. at The Food Technology lab at Free University of Bozen-Bolzano (Prof. Matteo Scampicchio) is acknowledged for providing access to the SEM unit.
Supporting Information Available
The Supporting Information is available free of charge at https://pubs.acs.org/doi/10.1021/acsomega.1c04296.
Optimization of the cycle number of CV; SEM images of the screen-printed Ag WE modified with different numbers of CV of Cu electrodeposition; EDS spectrum of Cu deposition on top of the WE; dependency of the NO3– reduction peak potential and scan rate dependency of the half-peak potential for the NO3– reduction; linear relationship between the reduction peak current of Cu(II) and different NO3– concentrations; interference test with different interfering agents; and repeatability test for the Cu/Ag sensor (PDF)
Author Contributions
A.K.M.S.I.: conceptualization, methodology, formal analysis, investigation, and writing—original draft. M.A.C.A.: methodology, data curation, and writing—review and editing. B.S.: methodology and participating investigation. A.D.: methodology and participating investigation. E.A.: writing—review and editing. L.M.: software. L.P.: writing—review and editing and project administration. P.L.: funding acquisition and supervision.
Funding was partially provided by the EYRE project of the Faculty for Science and Technology of Free University of Bozen-Bolzano.
The authors declare no competing financial interest.
Supplementary Material
References
- Chen X.; Pu H.; Fu Z.; Sui X.; Chang J.; Chen J.; Mao S. Real-time and selective detection of nitrates in water using graphene-based field-effect transistor sensors. Environ. Sci.: Nano 2018, 5, 1990–1999. 10.1039/c8en00588e. [DOI] [Google Scholar]
- Reddy D.; Lancaster J. R.; Cornforth D. P. Nitrite inhibition of Clostridium botulinum: Electron spin resonance detection of iron-nitric oxide complexes. Science 1983, 221, 769–770. 10.1126/science.6308761. [DOI] [PubMed] [Google Scholar]
- Badea G. E. Electrocatalytic reduction of nitrate on copper electrode in alkaline solution. Electrochim. Acta 2009, 54, 996–1001. 10.1016/j.electacta.2008.08.003. [DOI] [Google Scholar]
- Fahey J. M.; Isaacson R. L. Pretreatment effects on nitrite-induced methemoglobinemia: Saline and calcium channel antagonists. Pharmacol., Biochem. Behav. 1990, 37, 457–459. 10.1016/0091-3057(90)90012-7. [DOI] [PubMed] [Google Scholar]
- World Health Organization. Water, Sanitation and Health Team . Guidelines for Drinking-Water Quality: Incorporating First Addendum, Recommendations. 2006; Vol. 1. [Google Scholar]
- Li Y.; Zhang Z.; Song Y.; Bian C.; Sun J.; Dong H.; Xia S.. Determination of Nitrate in Potable Water Using a Miniaturized Electrochemical Sensor. IEEE 13th Annual International Conference on Nano/Micro Engineered and Molecular Systems, 2018; pp 619–622.
- Zhang J.-Z.; Fischer C. J. A simplified resorcinol method for direct spectrophotometric determination of nitrate in seawater. Mar. Chem. 2006, 99, 220–226. 10.1016/j.marchem.2005.09.008. [DOI] [Google Scholar]
- Kato M.; Okui M.; Taguchi S.; Yagi I. Electrocatalytic nitrate reduction on well-defined surfaces of tin-modified platinum, palladium and platinum-palladium single crystalline electrodes in acidic and neutral media. J. Electroanal. Chem. 2017, 800, 46–53. 10.1016/j.jelechem.2017.01.020. [DOI] [Google Scholar]
- Mao S.; Chang J.; Zhou G.; Chen J. Nanomaterial-enabled Rapid Detection of Water Contaminants. Small 2015, 11, 5336–5359. 10.1002/smll.201500831. [DOI] [PubMed] [Google Scholar]
- Bagheri H.; Hajian A.; Rezaei M.; Shirzadmehr A. Composite of Cu metal nanoparticles-multiwall carbon nanotubes-reduced graphene oxide as a novel and high performance platform of the electrochemical sensor for simultaneous determination of nitrite and nitrate. J. Hazard. Mater. 2017, 324, 762–772. 10.1016/j.jhazmat.2016.11.055. [DOI] [PubMed] [Google Scholar]
- Albanese D.; Di Matteo M.; Alessio C. Screen printed biosensors for detection of nitrates in drinking water. Comput.-Aided Chem. Eng. 2010, 28, 283–288. 10.1016/s1570-7946(10)28048-3. [DOI] [Google Scholar]
- Li Y.; Li H.; Song Y.; Lu H.; Tong J.; Bian C.; Sun J.; Xia S. An Electrochemical Sensor System with Renewable Copper Nano-Clusters Modified Electrode for Continuous Nitrate Determination. IEEE Sens. J. 2016, 16, 8807–8814. 10.1109/jsen.2016.2582038. [DOI] [Google Scholar]
- Alahi M. E. E.; Nag A.; Mukhopadhyay S. C.; Burkitt L. A temperature-compensated graphene sensor for nitrate monitoring in real-time application. Sens. Actuators, A 2018, 269, 79–90. 10.1016/j.sna.2017.11.022. [DOI] [Google Scholar]
- Dima G. E.; De Vooys A. C. A.; Koper M. T. M. Electrocatalytic reduction of nitrate at low concentration on coinage and transition-metal electrodes in acid solutions. J. Electroanal. Chem. 2003, 554–555, 15–23. 10.1016/s0022-0728(02)01443-2. [DOI] [Google Scholar]
- Motaghedifard M. H.; Pourmortazavi S. M.; Alibolandi M.; Mirsadeghi S. Au-modified organic/inorganic MWCNT/Cu/PANI hybrid nanocomposite electrode for electrochemical determination of nitrate ions. Microchim. Acta 2021, 188, 99. 10.1007/s00604-021-04754-9. [DOI] [PubMed] [Google Scholar]
- Wang J.; Zhang Z.; Wang S. Facile fabrication of Ag/GO/Ti electrode by one-step electrodeposition for the enhanced cathodic reduction of nitrate pollution. J. Water Process. Eng. 2021, 40, 101839. 10.1016/j.jwpe.2020.101839. [DOI] [Google Scholar]
- Chen X.; Zhou G.; Mao S.; Chen J. Rapid detection of nutrients with electronic sensors: A review. Environ. Sci.: Nano 2018, 5, 837–862. 10.1039/c7en01160a. [DOI] [Google Scholar]
- Zhao G.; Liu K.; Lin S.; Liang J.; Guo X.; Zhang Z. Electrocatalytic reduction of nitrite using a carbon nanotube electrode in the presence of cupric ions. Microchim. Acta 2004, 144, 75–80. 10.1007/s00604-003-0079-0. [DOI] [Google Scholar]
- Li Y.; Bian C.; Xia S.; Sun J.; Tong J. Micro electrochemical sensor with copper nanoclusters for nitrate determination in freshwaters. Micro Nano Lett. 2012, 7, 1197–1201. 10.1049/mnl.2012.0533. [DOI] [Google Scholar]
- Frag E. Y.; Mohamed M. E.-B.; Salem H. S. Preparation and characterization of in situ carbon paste and screen-printed potentiometric sensors for determination of econazole nitrate: surface analysis using SEM and EDX. J. Iran. Chem. Soc. 2017, 14, 2355–2365. 10.1007/s13738-017-1171-4. [DOI] [Google Scholar]
- Amiripour F.; Azizi S. N.; Ghasemi S. Nano P zeolite modified with Au/Cu bimetallic nanoparticles for enhanced hydrogen evolution reaction. Int. J. Hydrogen Energy 2019, 44, 605–617. 10.1016/j.ijhydene.2018.11.046. [DOI] [Google Scholar]
- Hafezi B.; Majidi M. R. A sensitive and fast electrochemical sensor based on copper nanostructures for nitrate determination in foodstuffs and mineral waters. Anal. Methods 2013, 5, 3552–3556. 10.1039/c3ay26598f. [DOI] [Google Scholar]
- Essousi H.; Barhoumi H.; Bibani M.; Ktari N.; Wendler F.; Al-Hamry A.; Kanoun O. Sensor electroquímico de impresión de iones basado en nanopartículas de cobre-matriz de polianilina para la detección de nitratos. J. Sens. 2019, 2019, 4257125. 10.1155/2019/4257125. [DOI] [Google Scholar]
- Wu Y.; Gao M.; Li S.; Ren Y.; Qin G. Copper wires with seamless 1D nanostructures: Preparation and electrochemical sensing performance. Mater. Lett. 2018, 211, 247–249. 10.1016/j.matlet.2017.10.016. [DOI] [Google Scholar]
- Zhang M.; Lv J.-J.; Li F.-F.; Bao N.; Wang A.-J.; Feng J.-J.; Zhou D.-L. Urea assisted electrochemical synthesis of flower-like platinum arrays with high electrocatalytic activity. Electrochim. Acta 2014, 123, 227–232. 10.1016/j.electacta.2014.01.054. [DOI] [Google Scholar]
- Feng J.-J.; Lv Z.-Y.; Qin S.-F.; Li A.-Q.; Fei Y.; Wang A.-J. N-methylimidazole-assisted electrodeposition of Au porous textile-like sheet arrays and its application to electrocatalysis. Electrochim. Acta 2013, 102, 312–318. 10.1016/j.electacta.2013.04.008. [DOI] [Google Scholar]
- Lv Z.-Y.; Li A.-Q.; Fei Y.; Li Z.; Chen J.-R.; Wang A.-J.; Feng J.-J. Facile and controlled electrochemical route to three- dimensionalhierarchical dendritic gold nanostructures. Electrochim. Acta 2013, 109, 136–144. 10.1016/j.electacta.2013.07.123. [DOI] [Google Scholar]
- Cialone M.; Fernandez-Barcia M.; Celegato F.; Coisson M.; Barrera G.; Uhlemann M.; Gebert A.; Sort J.; Pellicer E.; Rizzi P.; Tiberto P. A comparative study of the influence of the deposition technique (electrodeposition versus sputtering) on the properties of nanostructured Fe70Pd30 films. Sci. Technol. Adv. Mater. 2020, 21, 424–434. 10.1080/14686996.2020.1780097. [DOI] [PMC free article] [PubMed] [Google Scholar]
- Lu C.; Lu X.; Yang K.; Song H.; Zhang S.; Li A. Cu, Ni and multi-walled carbon-nanotube-modified graphite felt electrode for nitrate electroreduction in water. J. Mater. Sci. 2021, 56, 7357–7371. 10.1007/s10853-020-05764-3. [DOI] [Google Scholar]
- Stortini A. M.; Moretto L. M.; Mardegan A.; Ongaro M.; Ugo P. Arrays of copper nanowire electrodes: Preparation, characterization and application as nitrate sensor. Sens. Actuators, B 2015, 207, 186–192. 10.1016/j.snb.2014.09.109. [DOI] [Google Scholar]
- Yamanaka K.; Vestergaard M. C.; Tamiya E. Printable electrochemical biosensors: A focus on screen-printed electrodes and their application. Sensors 2016, 16, 1761. 10.3390/s16101761. [DOI] [PMC free article] [PubMed] [Google Scholar]
- Lotfi Zadeh Zhad H. R.; Lai R. Y. Comparison of nanostructured silver-modified silver and carbon ultramicroelectrodes for electrochemical detection of nitrate. Anal. Chim. Acta 2015, 892, 153–159. 10.1016/j.aca.2015.08.022. [DOI] [PubMed] [Google Scholar]
- Li Y.; Sun J. Z.; Bian C.; Tong J. H.; Dong H. P.; Zhang H.; Xia S. H. Copper nano-clusters prepared by one-step electrodeposition and its application on nitrate sensing. AIP Adv. 2015, 5, 041312. 10.1063/1.4905712. [DOI] [Google Scholar]
- Chen D.-J.; Lu Y.-H.; Wang A.-J.; Feng J.-J.; Huo T.-T.; Dong W.-J. Facile synthesis of ultra-long Cu microdendrites for the electrochemical detection of glucose. J. Solid State Electrochem. 2012, 16, 1313–1321. 10.1007/s10008-011-1524-3. [DOI] [Google Scholar]
- Li C.; Shuford K. L.; Park Q.-H.; Cai W.; Li Y.; Lee E. J.; Cho S. O. High-yield synthesis of single-crystalline gold nano-octahedra. Angew. Chem. 2007, 46, 3264–3268. 10.1002/anie.200604167. [DOI] [PubMed] [Google Scholar]
- Mumtarin Z.; Rahman M. M.; Marwani H. M.; Hasnat M. A. Electro-kinetics of conversion of NO3 – into NO2 – and sensing of nitrate ions via reduction reactions at copper immobilized platinum surface in the neutral medium. Electrochim. Acta 2020, 346, 135994. 10.1016/j.electacta.2020.135994. [DOI] [Google Scholar]
- Hasnat M. A.; Ben Aoun S.; Nizam Uddin S. M.; Alam M. M.; Koay P. P.; Amertharaj S.; Rashed M. A.; Rahman M. M.; Mohamed N. Copper-immobilized platinum electrocatalyst for the effective reduction of nitrate in a low conductive medium: Mechanism, adsorption thermodynamics and stability. Appl. Catal., A 2014, 478, 259–266. 10.1016/j.apcata.2014.04.017. [DOI] [Google Scholar]
- Lotfi Zadeh Zhad H. R.; Lai R. Y. Comparison of nanostructured silver-modi fi ed silver and carbon ultramicroelectrodes for electrochemical detection of nitrate. Anal. Chim. Acta 2015, 892, 153–159. 10.1016/j.aca.2015.08.022. [DOI] [PubMed] [Google Scholar]
- Liang J.; Zheng Y.; Liu Z. Nanowire-based Cu electrode as electrochemical sensor for detection of nitrate in water. Sens. Actuators, B 2016, 232, 336–344. 10.1016/j.snb.2016.03.145. [DOI] [Google Scholar]
- Douaki A.; Abera B. D.; Cantarella G.; Shkodra B.; Mushtaq A.; Ibba P.; Inam A. K.; Petti L.; Lugli P. Flexible screen printed aptasensor for rapid detection of furaneol: A comparison of CNTs and AgNPs effect on aptasensor performance. Nanomaterials 2020, 10, 1–18. 10.3390/nano10061167. [DOI] [PMC free article] [PubMed] [Google Scholar]
- Alves M.; Méreau R.; Grignard B.; Detrembleur C.; Jérôme C.; Tassaing T. DFT investigation of the reaction mechanism for the guanidine catalysed ring-opening of cyclic carbonates by aromatic and alkyl-amines. RSC Adv. 2017, 7, 18993–19001. 10.1039/c7ra00220c. [DOI] [Google Scholar]
- Polatides C.; Kyriacou G. Electrochemical reduction of nitrate ion on various cathodes – reaction kinetics on bronze cathode. J. Appl. Electrochem. 2005, 35, 421–427. 10.1007/s10800-004-8349-z. [DOI] [Google Scholar]
- Bontempelli G.; Dossi N.; Toniolo R.. Chemistry, Molecular Sciences and Chemical Engineering/Linear Sweep and Cyclic; Elsevier Inc., 2016; pp 1–10. [Google Scholar]
- Quan D.; Shim J. H.; Kim J. D.; Park H. S.; Cha G. S.; Nam H. Electrochemical determination of nitrate with nitrate reductase-immobilized electrodes under ambient air. Anal. Chem. 2005, 77, 4467–4473. 10.1021/ac050198b. [DOI] [PubMed] [Google Scholar]
- Dam V. A. T.; Zevenbergen M. A. G.. Holst Centre/imec , 5656 AE Eindhoven , The Netherlands. 2019 20th International Conference on Solid-State Sensors, Actuators and Microsystems, 2019; pp 1285–1288.
- Sabrina W. N.; Hidayah A. P. N.; Faridah S.; Rashid M. R.; Adibah Y. N.; Zamri I. Electroimmobilization of Nitrate Reductase into Polypyrrole Films on Screen Printed Carbon Electrode (SPCE) for Amperometric Detection of Nitrate. Procedia Chem. 2016, 20, 69–72. 10.1016/j.proche.2016.07.025. [DOI] [Google Scholar]
- Macdougall D. B.; Mottram D. S.; Rhodes D. N. Contribution of Nitrite and Nitrate to the Colour and Flavour of Cured Meats. J. Sci. Food Agric. 1975, 26, 1743–1754. 10.1002/jsfa.2740261117. [DOI] [Google Scholar]
- Filimonov E. V.; Shcherbakov A. I. Catalytic effect of copper ions on nitrate reduction. Prot. Met. 2004, 40, 280–285. 10.1023/b:prom.0000028923.12984.8c. [DOI] [Google Scholar]
- Cho S.-J.; Sasaki S.; Ikebukuro K.; Karube I. A simple nitrate sensor system using titanium trichloride and an ammonium electrode. Sens. Actuators, B 2002, 85, 120–125. 10.1016/s0925-4005(02)00062-x. [DOI] [Google Scholar]
- Da Silva I. S.; De Araujo W. R.; Paixão T. R. L. C.; Angnes L. Direct nitrate sensing in water using an array of copper-microelectrodes from flat flexible cables. Sens. Actuators, B 2013, 188, 94–98. 10.1016/j.snb.2013.06.094. [DOI] [Google Scholar]
- Mohamed H. M. Screen-printed disposable electrodes: Pharmaceutical applications and recent developments. TrAC, Trends Anal. Chem. 2016, 82, 1–11. 10.1016/j.trac.2016.02.010. [DOI] [Google Scholar]
- Sophocleous M.; Atkinson J. K. A review of screen-printed silver/silver chloride (Ag/AgCl) reference electrodes potentially suitable for environmental potentiometric sensors. Sens. Actuators, A 2017, 267, 106–120. 10.1016/j.sna.2017.10.013. [DOI] [Google Scholar]
- Bader M. A systematic approach to standard addition methods in instrumental analysis. J. Chem. Educ. 1980, 57, 703–706. 10.1021/ed057p703. [DOI] [Google Scholar]
- Shkodra B.; Abera B. D.; Cantarella G.; Douaki A.; Avancini E.; Petti L.; Lugli P. Flexible and printed electrochemical immunosensor coated with oxygen plasma treated SWCNTs for histamine detection. Biosensors 2020, 10, 35. 10.3390/bios10040035. [DOI] [PMC free article] [PubMed] [Google Scholar]
- Wang X.; Zhu M.; Zeng G.; Liu X.; Fang C.; Li C. A three-dimensional Cu nanobelt cathode for highly efficient electrocatalytic nitrate reduction. Nanoscale 2020, 12, 9385–9391. 10.1039/c9nr10743f. [DOI] [PubMed] [Google Scholar]
Associated Data
This section collects any data citations, data availability statements, or supplementary materials included in this article.


