

Summary Paragraph
Neurotropic alphaherpesviruses initiate infection in exposed mucosal tissues and, unlike most viruses, rapidly transmit into sensory and autonomic nerves where life-long latency is established 1. Recurrent infections sporadically arise from the peripheral nervous system throughout the life of the host, and invasion of the central nervous system may occur with severe outcomes 2. These viruses appear to be unique in their property of directly engaging cellular motors to transport along microtubules within nerve axons, but how the motors are manipulated to deliver the virus to neuronal nuclei is not understood. Using herpes simplex virus type I (HSV-1) and pseudorabies virus (PRV) as model alphaherpesviruses, we show that a cellular kinesin motor is captured by virions in epithelial cells, carried between cells, and subsequently used in neurons to traffic to nuclei. Viruses assembled in the absence of kinesin are not neuroinvasive. The findings elucidate a critical component of the alphaherpesvirus neuroinvasive mechanism and demonstrate that these viruses assimilate a cellular protein as an essential proviral structural component. This newly defined principle of viral assimilation may prove relevant to other virus families and offers new strategies to combat infection.
The alphaherpesviruses, herpes simplex virus type 1 (HSV-1) and pseudorabies virus (PRV), encode a conserved neuroinvasive effector protein, pUL36. Prior studies of PRV pUL36 demonstrate that this virion component binds the dynein microtubule motor complex and promotes the centripetal intracellular transport of viral particles during initial infection 3. These studies also revealed that the transport activity of pUL36 is unmasked by removing its C-terminal capsid-binding domain during transient expression in mammalian cells (Supplementary Video 1). Unlike the transport of capsids during infection 4,5, the motion exhibited by truncated pUL36 in transfected cells is highly bi-directional, with the protein co-localizing with microtubules and gradually accumulating at the cell periphery (Extended Data Fig. 1). Bi-directional transport and peripheral accumulation of pUL36 indicate the PRV protein, in addition to binding dynein, also recruits an opposing kinesin motor. These observations were reinforced by co-localization of the conventional kinesin-1 motor with pUL36 and by co-immunoprecipitation (Extended Data Fig. 2). Kinesin binding mapped to tryptophan/aspartate (WD) motifs in the central region of PRV pUL36 (Extended Data Fig. 3 and Extended Data Fig. 4) 6. Two WD motifs, WD1 and WD2, were dispensable, whereas WD3 enhanced the kinesin interaction and WD4 was essential (Extended Data Fig. 4). As a first step to assessing the role of kinesin during infection, corresponding mutations were introduced into PRV. PRV failed to propagate when WD4 was mutated, indicating the kinesin interaction was possibly essential for infection (Extended Data Fig. 5a). As an alternative to producing a mutant of PRV lacking kinesin binding, a reduced kinesin binding [RKB] mutant was produced by mutating WD3 along with the acidic residues of WD4 (Extended Data Fig. 4 and Extended Data Fig. 5b). Microtubule-based transport of PRV[RKB] was less susceptible to kinesin inhibition by AMP-PNP in vitro, consistent with the mutant virus being attenuated for kinesin-based transport (Extended Data Fig. 6). Upon infection of primary sensory neurons, PRV[RKB] transported in axons but the bulk of the incoming viral particles failed to reach neuronal nuclei, where capsids normally dock and inject their DNA into the nucleoplasm, and instead accumulating in the juxtanuclear cytoplasm (Extended Data Fig. 5c). Consistent with this nuclear delivery defect, subsequent viral gene expression was also diminished (Extended Data Fig. 5d). These results implicate kinesin-1 binding by pUL36 promotes transport of viral particles to nuclei during initial infection.
To complement these initial findings, infections were examined in cells lacking kinesin-1. Of the three kinesin-1 isoforms (Kif5A, B, and C), TERT-immortalized human retinal pigmented epithelial cells (RPE) only express detectable amounts of Kif5B. RPE cells knocked-out for Kif5B were recently described (Fig. 1a) 7. RPE cells were infected with HSV-1 and processed for immunofluorescence (Fig. 1, b–d, left portion of panels). Whereas incoming capsids predominantly decorated the nuclear rim in normal RPE cells, HSV-1 capsids were accumulated at a juxtanuclear position in RPEΔKif5B cells, with a reduced proportion of capsids at the nucleus. The juxtanuclear position was coincident with the centrosome and, based on this finding, a custom image analysis pipeline was developed to count the number of capsids at centrosomes and nuclei, which indicated the magnitude of the defect was less than two-fold (Fig. 1c). Nevertheless, the defective phenotype was also observed in normal human fibroblasts transiently knocked down for Kif5B (Extended Data Fig. 7) and mimicked the PRV[RKB] phenotype (Extended Data Fig. 5c). Collectively, these results supported that, like pUL36, kinesin-1 contributed to the trafficking of incoming capsids from the centrosome to the nucleus. However, the limited impact incurred in the absence of kinesin-1 did not satisfactorily explain why PRV encoding a mutant isoform of pUL36 that does not bind kinesin-1 could not be propagated (see ΔWD4 in Extended Data Fig 5a). Therefore, we hypothesized that virions could provide a second source of kinesin-1 during infection. To examine this, HSV-1 was produced on RPEΔKif5B cells and the resulting stock was used to infect RPEΔKif5B cells. In this paradigm, where kinesin-1 was absent during virion production and during the subsequent infection, centrosome-to-nucleus trafficking of capsids was dramatically impaired (Fig. 1b, right half of illustration, Fig. 1c, rightmost column, Fig. 1d, rightmost panel). This raised the intriguing possibility that virions may possess a kinesin motor that is used upon infection to traffic viral particles to nuclei.
Fig. 1. Kinesin-1 supports HSV-1 initial infection of hTERT-RPE (RPE) cells.
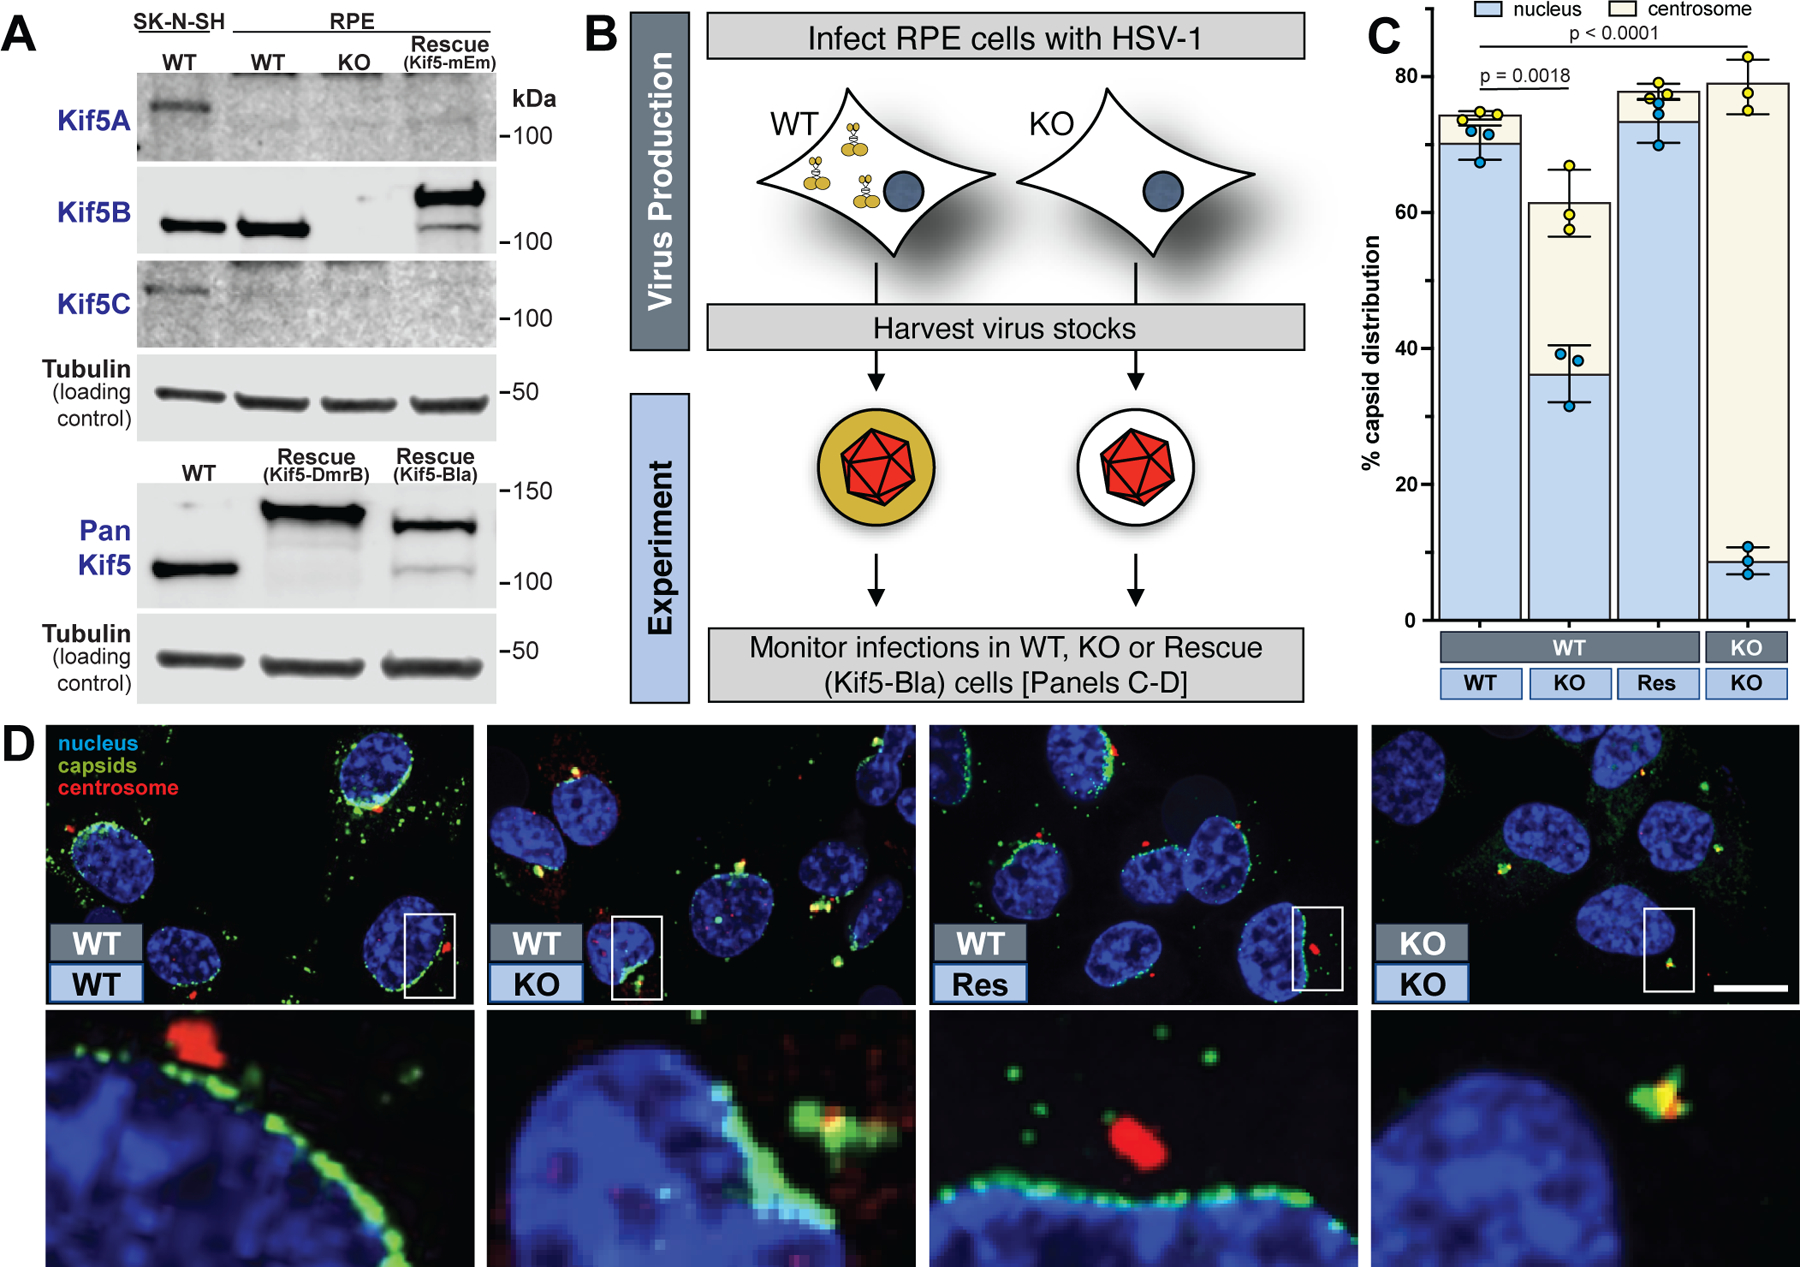
(A) Western blots documenting Kif5 expression in wild-type RPE cells (WT), RPEΔKif5B cells (KO), and RPEΔKif5B cells expressing either Kif5B-mEmerald (Rescue Kif5-mEm), DmrB-Kif5-CmNeonGreen (Rescue Kif5-DmrB) or Kif5B-beta-lactamase (Rescue Kif5-Bla). SK-N-SH cells serve as standard and tubulin as loading control (n = 3 independent experiments). (B) Experimental design describing dark and light blue boxes in panels C and D. (C) Capsid localization at 4 hpi in RPE cells (light blue boxes) following infection with indicated virus preparations (dark blue boxes) (n = 3 independent experiments > 5000 capsids each). (D) Example immunofluorescence images from the panel C analysis (n = 3 independent experiments). Mean values ± SD and P values based on two-tailed unpaired t test are indicated.
To specifically investigate the impact of producing virions in the absence of kinesin-1, stocks of HSV-1 and PRV produced on RPEΔKif5B cells were further studied. Unexpectedly, these HSV-1 and PRV stocks attained higher final titers than equivalent stocks prepared on normal RPE cells (Fig. 2a). The basis for the titer increases was not clear, but we note that the absence of kinesin-1 impacts cytoplasmic architecture and could lessen restraints normally limiting viral assembly or egress during late infection 7. Although kinesin-1 was dispensable for virus production, the resulting virions produced small plaques upon infection of normal cells and were attenuated in mice (Fig. 2, b–c). Thus, in the absence of kinesin-1, virions were produced in abundance that were less competent to propagate infection. Using automated analysis of capsid localization, wild-type cells infected with viruses prepared in the absence of kinesin-1 were found largely devoid of capsids at nuclei and instead had capsids accumulated at centrosomes (Fig. 2d). In fact, the magnitude of the nuclear trafficking defect observed was on par with that seen initially in RPEΔKif5B cells (compare Fig. 1c rightmost column and 2d middle column). The defect was also observed by live-cell microscopy in normal cells infected with HSV-1 encoding a fluorescent-capsid tag, manifesting to the greatest extent in sensory neurons (Fig. 2e). Consistent with this nuclear delivery defect, subsequent viral gene expression was also impaired in normal cells (Fig. 2f). This set of results was remarkable given that the defects were observed in cells that express kinesin-1, indicating that virions produced in the absence of kinesin-1 were not complemented upon entering target cells by the endogenous kinesin-1 in these cells.
Fig. 2. The presence of kinesin-1 during virus assembly promotes trafficking of capsids to nuclei during subsequent infection.
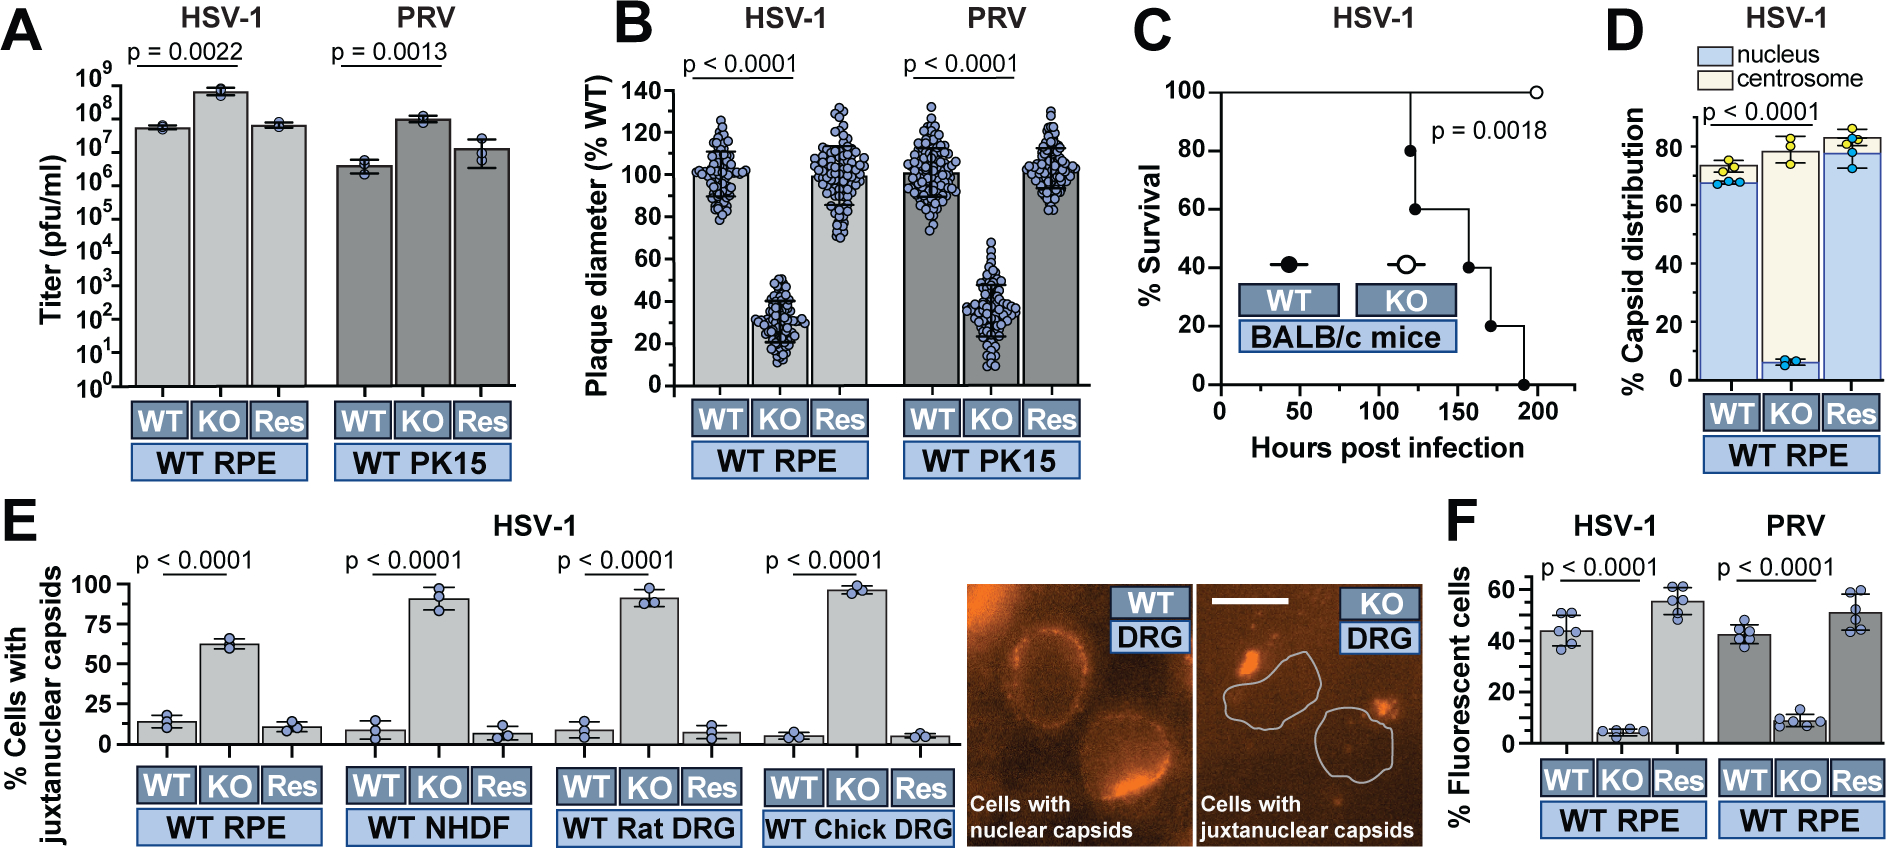
HSV-1 or PRV produced on RPE (WT), RPEΔKif5B (KO), or RPEΔKif5B + Kif5B-mEmerald (Res) were used to infect WT cells or mice. Light and dark blue boxes are referenced from Figure 1B. (A & B) Titers (n = 3 independent experiments) and plaque diameters (n = 90 plaques over 3 independent experiments). (C) Mouse survival post challenge (n = 5 per group; log-rank Mantel-Cox test). (D) Capsid localization as in Figure 1C (n = 3 independent experiments > 5000 capsids each). (E) Live-cell analysis of capsid localization (n = 3 independent experiments > 90 cells each). Representative images of chick DRG at right (nuclei outlined in the right panel). (F) Virus reporter gene expression (n = 6 independent experiments averaging > 600 cells each). Mean values ± SD and P values based on two-tailed unpaired t test are indicated.
We reasoned that kinesin-1 could enhance the infectivity of virions either indirectly (e.g., by contributing to an aspect of virion assembly) or directly (e.g., by becoming a functional constituent of nascent virions). To help discriminate between these possibilities, isolated extracellular HSV-1 particles were examined for the presence of the kinesin motor. Initial attempts at kinesin-1 detection by Western blot were inconclusive; therefore, HSV-1 was isolated from infected RPEΔKif5B cells that were repaired by stably expressing Kif5B fused to beta-lactamase (Kif5B-Bla) (Fig. 1a). By extracting the virion membrane, beta-lactamase activity in the internal viral architecture was measured using a nitrocefin chromogenic substrate 8. This method provided initial evidence for the presence of Kif5B in extracellular HSV-1 particles at levels below a virally-encoded structural protein (Fig. 3, a–b) 9. Delivery of Kif5B-Bla into the cytosol of cells upon infection was confirmed using cells preloaded with the Bla substrate, CCF2-AM (Fig. 3c) 10. The presence of native kinesin-1 in extracellular HSV-1 particles produced from normal RPE cells was confirmed by enriching for proteins in the range of approximately 100–150 kDa (kinesin heavy chain: 110 kDa) and applying tandem mass spectrometry (Supplementary Data 2). Finally, Kif5B-Bla was also detected in extracellular PRV particles, and its capture was reduced in the PRV [RKB] mutant but not in a ΔUs9 control (a protein involved in kinesin-based transport during late infection 11–14) (Fig. 3d). These results demonstrate that kinesin-1 is captured into virions, in part by the pUL36 tegument protein, and delivered into the cytosol of cells upon infection.
Fig. 3. Kinesin-1 is captured in viral particles and delivered to other cells.
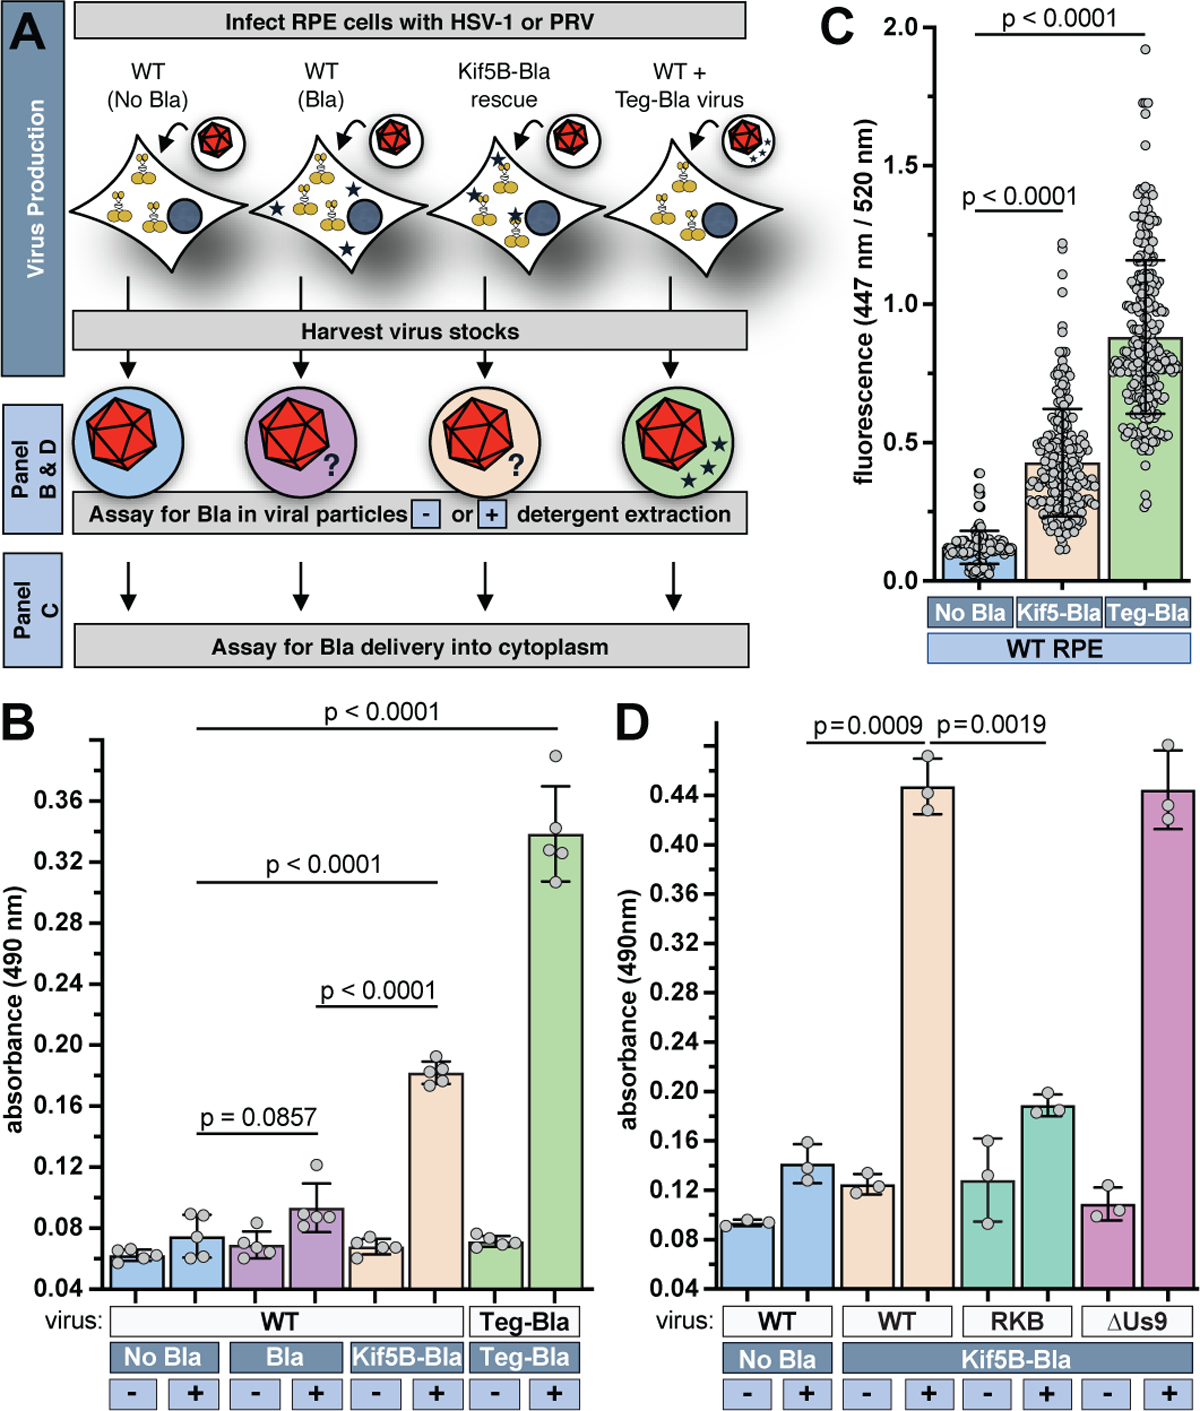
(A) Experimental design describing dark and light blue boxes in panel B. HSV-1 was produced on RPE cells expressing no trans gene (No Bla) or beta-lactamase (Bla), and RPEΔKif5B + Kif5B-Bla cells. HSV-1 encoding Bla fused to the VP13/14 tegument protein (Teg-Bla) was produced on WT RPE cells as a positive control. Bla is represented by blue stars. (B) Presence of Bla in HSV-1 by nitrocefin assay (n=5 independent experiments). (C) Delivery of Bla into cells by CCF2 assay following infection (n > 220 cells over 3 independent experiments). (D) Presence of Bla in PRV (WT, RKB, ΔUs9) by nitrocefin assay (n=3 independent experiments). Mean values ± SD and P values based on two-tailed unpaired t test are indicated.
The capture and carry of kinesin between cells by virions raised the intriguing possibility that HSV-1 repurposes captured kinesin to infect cells, including neurons. To test this hypothesis, HSV-1 stocks were prepared on RPEΔKif5B cells stably expressing Kif5C fused to an inducible dimerization domain (DmrB) (Fig. 1a). Addition of a dimerization inducing drug to DmrB-Kif5C crosslinks the two heavy chains of the motor, rendering it immobile on microtubules (we note that, although this construct was based on the Kif5C isoform, Kif5B and Kif5C equally support pUL36 trafficking; Extended Data Fig. 8) 15. Addition of the homodimerizer drug to RPE cells and primary sensory neurons infected with HSV-1 carrying DmrB-Kif5C inhibited virus trafficking to nuclei and impaired viral gene expression (Fig. 4). Therefore, HSV-1 assimilated kinesin-1 by capturing the protein complex from epithelial cells, carrying it to neurons (as well as other cell types), and repurposing the motor to deliver the viral particle to nuclei following axonal transport to the centrosome.
Fig. 4. Virally captured kinesin traffics capsids to nuclei.
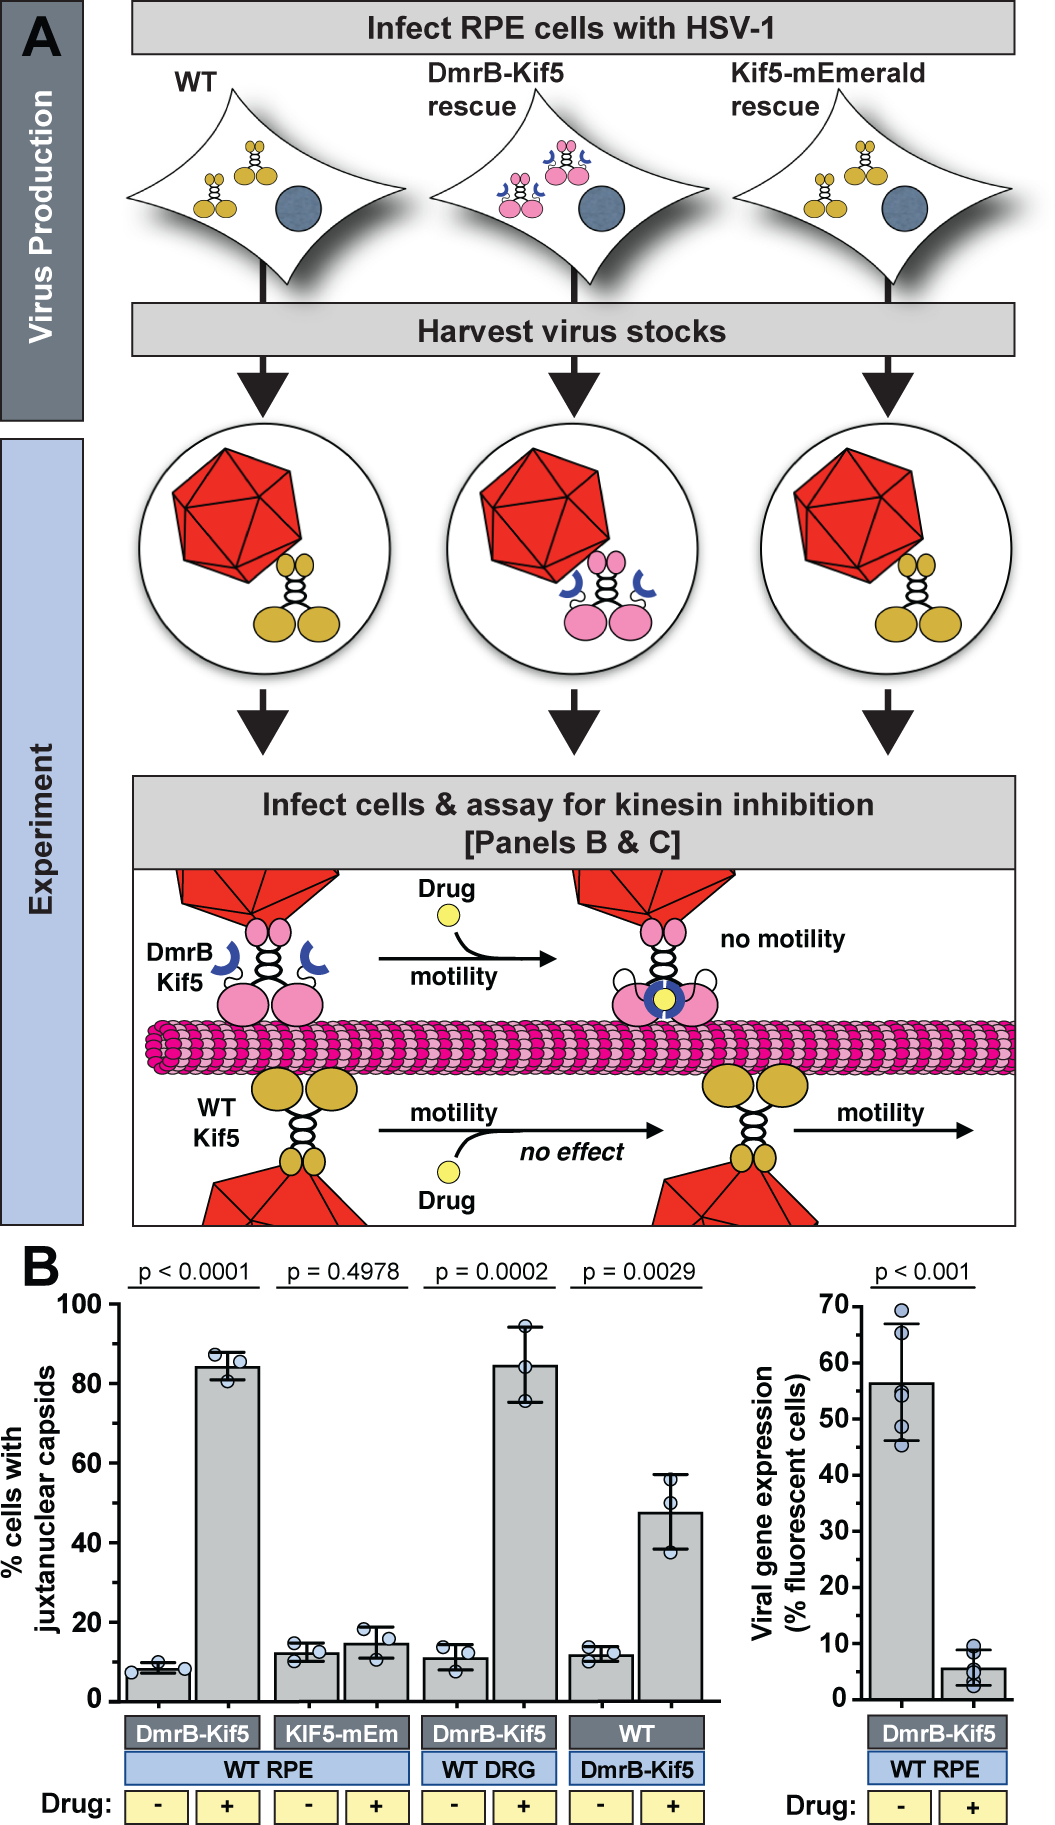
(A) Experimental design highlighting selective kinesin inhibition. Addition of the homodimerizer drug (yellow circle) crosslinks the DmrB domains (blue half-circles) and inhibits motility of DmrB-Kif5C. (B) Impact of homodimerizer drug on capsid localization in living cells (light blue boxes) following infection with HSV-1 produced on RPE (WT), RPEΔKif5B + Kif5B-mEmerald, or RPEΔKif5B + DmrB-Kif5C-mNeonGreen cells (dark blue boxes) (n = 3 independent experiments > 100 cells each). (C) Virus reporter gene expression at 5 hpi (n = 6 independent experiments averaging > 600 cells each). Mean values ± SD and P values based on two-tailed unpaired t test are indicated.
Prior to this study, alphaherpesviruses were known to recruit the dynein microtubule motor to sustain transport in axons of peripheral nerves as a means to reach sensory and autonomic ganglia within the PNS 1,3,16. While this mechanism explains how viral particles are delivered long distances to neural soma it did not account for how they specifically arrive at the nucleus (Supplementary Video 2). The initial findings of this report identified kinesin-1 as the solution to this problem, while also highlighting the limitation of unabated dynein-based transport: in the absence of kinesin-1, viral particles transported by dynein accumulated at the centrosome and largely fail to reach the nucleus. HSV-1 and PRV overcome this problem using a tactic of sequential dynein and kinesin-1 engagement. Importantly, this tactic affords the long-distance dynein-based trafficking that is necessary for axonal-based neuroinvasion, while systematically overcoming the consequence of this transport by using kinesin-1 to reroute the viral particle from the centrosome to the nucleus. A role for kinesin during initial infection was postulated nearly 20 years ago, yet this is the first demonstration of the biphasic transport of herpesvirus capsids to nuclei, which elucidates a pivotal attribute of the robust neuroinvasive property of these viruses 17.
The neuroinvasive mechanism proved more intriguing by the realization that HSV-1 uses kinesin-1 motors that are not endogenous to neurons but rather originate from previously infected epithelial cells from which the viral particles emerged (Extended Data Fig. 9). Although the kinesin-1 binding sites in pUL36 contributed to the packaging of kinesin-1 in virions, we cannot rule out that kinesin interactions promoting viral egress during late infection may also contribute to its capture 12,13,18–20. Nevertheless, the presence of kinesin-1 in virions was reinforced by the beta-lactamase reporter assay and tandem mass spectrometry, and this combined approach was critical given that prior proteomic studies of HSV-1 and PRV did not detect kinesin motors in virions 21,22, although detection was reported by immunogold labeling 23. The kinesin copy number per virion is likely low and enriching for proteins in the molecular weight range of kinesin heavy chain prior to analysis presumably benefited its detection here. The repurposing of a cellular protein, in this instance a microtubule motor, as an essential virion structural component was unprecedented, and we refer to this process as assimilation.
Kinesin-1 assimilated by the herpesvirus pUL36 protein promoted infection of all cell types by shuttling viral particles from centrosomes to nuclei. Endogenous cellular kinesin-1 also assisted in centrosome-to-nucleus transfer of incoming viral particles even though it could not substitute for assimilated kinesin, suggesting some form of cooperation between the assimilated and cellular motor pools. For example, by assimilating kinesin, viral particles may become predisposed to overpower dynein upon arriving at centrosomes, where additional kinesin motors may be acquired. Alternatively, cellular kinesin may not directly participate in virus transport but instead stabilize microtubules projecting from the centrosome to the nucleus, thereby maintaining the infrastructure on which assimilated kinesin moves. Regardless, the dependence of HSV-1 and PRV on assimilated kinesin was striking and indicates that the abundant kinesin motors encountered upon entering a cell are insufficient to effectively traffic these viruses to nuclei. This initial description of assimilation, or the repurposing of a cellular protein as a virion component that drives subsequent rounds of infection, raises the questions of whether cellular proteins other than kinesin motors are targeted for assimilation, and if the process extends beyond the alphaherpesviruses.
Methods
Cells
Vero (African green monkey kidney epithelial), HEK293 (human embryonic kidney), RK13 (rabbit kidney epithelial), and PK15 (pig kidney epithelial) cells were grown in DMEM (Dulbecco’s Modified Eagle Medium; Invitrogen, 11965–118) supplemented with 10% BGS (bovine growth supplement; Rocky Mountain Biologicals, FGR-BBT). hTERT-RPE (immortalized human retinal pigmented epithelial; RPE), SK-N-SH (human neuroblastoma) cells, and NHDF (normal human dermal fibroblast) cells were grown in DMEM supplemented with 10% FBS (fetal bovine serum; Gemini, 100106). RPE cells were further supplemented with 1 mM sodium pyruvate (Invitrogen, 11360070). BGS and FBS were reduced to 2% when performing infections. Intact or dissociated chick DRG (dorsal root ganglia; embryonic day 9) were cultured on polyornithine- and laminin-treated coverslips as previously described 24,25. Rat DRG explants (embryonic day 18; Neuromics, PC35115) were cultured identically to chick DRG, but with the addition of human holo-transferrin (Sigma-Aldrich, T0665) to the media.
RPE cells knocked-out for Kif5B (RPEΔKif5B) and RPEΔKif5B cells stably expressing Kif5B-mEmerald were previously described 7. RPEΔKif5B cells stably expressing beta-lactamase (Bla), Kif5B-Bla, and DmrB-Kif5C-mNeonGreen were produced by retroviral transduction. To create Kif5B-Bla expressing cells, the portion of the bla gene coding for the enzyme without its signal sequence was amplified from pBR322 and cloned by InFusion (Takara Bio USA, Mountain View, CA, USA) into a Moloney-murine leukemia virus (MMLV) backbone encoding Kif5B-mEmerald that was cut with BamHI to remove the mEmerald coding sequence. PCR was performed with primers 5’AGCAGTCGTGGGATCCACCGGTCGCCACCGCTCACCCAGAAACGCTGG and 5’GCGGAATTCCGGATCTTACCAATGCTTAATCAGTGAGGCACCT (underlined sequences were complementary to bla coding sequence). The resulting clone, pGS7001, encoded Kif5B-Bla as a translational fusion. A similar MMLV backbone encoding bla alone, pGS7147, was produced by PCR cloning bla into pQCXIN (Takara Bio, 631514) cut with BamHI + NotI using primers 5’GCGCGGCCGCATGAGTATTCAACATTTCCG and 5’CGGGATCCTTACCAATGCTTAATCAGTGAG. To create DmrB-Kif5C-mNeonGreen expressing cells, InFusion PCR was used to amplify DmrB-Kif5C-mNeonGreen from p202ME DmrB-GG-RNKif5C-mNG (provided by Kristen Verhey) using primers 5’AATTGATCCGCGGCCGCCACCATGGGCGTG and 5’GCGGAATTCCGGATCTTACTTGTACAGCTCGTCCATGCCCATCACA. The product was inserted into the pQCXIN vector cut with BamHI + NotI, resulting in pGS7050. Retrovirus particles were packaged in GP293 cells transiently expressing the vesicular stomatitis virus glycoprotein (VSV-G). At 48 hours post transfection (hpt) the media was collected and passed through a 0.2 μM filter (EMD Millipore, SLFG05010). Polybrene (MilliporeSigma, H9268) was added at a final concentration of 8 μg/ml, and the mixture was incubated on RPE cells for 6 hr and then replaced with fresh media. Beginning two days later, cells were selected using 2 mg/ml G418 (EMD Millipore, 345812) for 1 week. RPE cells expressing Bla and Kif5B-Bla were confirmed by nitrocefin assay (see below), and RPE cells expressing DmrB-Kif5C-mNeonGreen were confirmed green fluorescent. Cells were also confirmed by Western blot (Figure 1a).
Vero and PK15 cells were obtained from ATCC; HEK293 (human embryonic kidney), were obtained from Dane Chetkovich, Northwestern University; hTERT-RPE (immortalized human retinal pigmented epithelial) were obtained from Vladimir Gelfand, Northwestern University; SK-N-SH (human neuroblastoma) were obtained from Richard Longnecker, Northwestern University; NHDF (normal human dermal fibroblast) were obtained from Lonza Bioscience (CC-2509). Cell lines were tested regularly for mycobacterium contamination using the PlasmoTest kit (InvivoGen) and authenticated by the source. No commonly misidentified cell lines were included in the study.
Viruses
All recombinant viruses were derived from the HSV-1 strain F infectious clone, pYEbac102 26, or the PRV strain Becker infectious clone, pBecker3 27, and are listed in Extended Data Table 1. HSV-1 stocks were produced by electroporation of BAC clones into Vero cells and were subsequently propagated on Vero-Cre cells to excise the loxP-flanked BAC backbone from the viral genomes and produce working stocks. PRV stocks were produced by electroporation or Lipofectamine 2000 transfection [Invitrogen, 11668–019] of the self-excising BAC clones into PK15 cells and were subsequently expanded on PK15 cells to produce working stocks as previously described 27. HSV-1 and PRV stocks were produced in the presence or absence of kinesin-1 by passaging the working stocks one additional time on RPE cells (including RPEΔKif5B, RPEΔKif5B+Kif5B-mEmerald, RPEΔKif5B+Bla, RPEΔKif5B+Kif5B-Bla, and RPEΔKif5B+DmrB-Kif5C-mNeonGreen derivatives). Wild-type HSV-1 strains KOS and McKrae were propagated on Vero cells 28. All HSV-1 and PRV stocks were harvested once all cells displayed full cytopathic effects, irrespective of the time required.
HSV-1 and PRV encoding fluorescently-tagged capsids (HSVF-GS4553, PRV-GS4284, PRV-GS4379) or immediate-early fluorescent reporters (PRV-GS2564, HSVF-GS3217) were previously described 29–32. HSV-1 encoding bla translational fused to the carboxyl terminus of pUL47 (HSVF-GS6389) was produced by two-step RED-mediated recombination using the pEP-Bla-in template 31. All UL36 mutations (ΔWD3, WD3-REP, ΔWD4, WD4-REP, WD4(ΔW), WD4(ΔDE), and RKB) were introduced by two-step red-mediated recombination into PRV-GS4284 33 (primer sequences will be made available upon request). All mutations and repairs were double confirmed by sequencing both BAC DNA and viral DNA. PRV-Becker codon numbering was based on GenBank JF797219.1 34.
Virus isolation
Three 15 cm dishes of RPE cells were grown to 80–90% confluency and infected with either HSV-1 (MOI 5) or PRV (MOI 10) until all cells exhibited cytopathic effect (typically 24–48 h). The supernatants of the three dishes were harvested together into a 50 ml conical on ice, and centrifuged for 20 min at 5,000 × g at 4°C. The cleared supernatant was transferred to a 25 × 89 mm centrifugation tube [Seton; 7052], underlayed with a 20% (wt/vol) sucrose solution in PBS, and centrifuged at 13,000 rpm for 1 hr in a SW32 rotor at 4°C. The pellet was resuspended in 500 μl (HSV-1) or 333 μl (PRV) cold PBS on ice, and 50 μl aliquots were stored at −80°C. Isolated virus preparations were titered on RPE cells (HSV-1) and PK15 cells (PRV) and ranged from 1.0×10⁹ - 1.0×10¹⁰ PFU/ml for HSV-1 and 1.0×10⁵ - 5.0×10⁶ for PRV. We note that PRV titers produced by this procedure were 100-fold less than crude cell+media harvests of PRV from RPE cells.
Plaque assays
Titers of virus stocks were determined by serial dilution as previously described 27. Cells were infected and overlaid with DMEM [Invitrogen, 12100–046] supplemented with 10 mg/ml methylcellulose [VWR, AA36718–36], 100 U/ml penicillin-streptomycin [Invitrogen, 15140122], and either 2% BGS (for Vero and PK15 cells) or 2% FBS (for RPE cells). Plaque sizes of fluorescent viruses were measured by fluorescence imaging 2–3 days post infection. A minimum of 30 isolated plaques from each infection were imaged with a Nikon Eclipse TE2000-U inverted microscope using a 10x × 0.3 numerical aperture (NA) objective and RFP or GFP filter set, and infections were repeated in triplicate to provide a total of 90 plaque measurements per sample. The average of two orthogonal diameter measurements were calculated for each plaque using MetaMorph [Molecular Devices] or ImageJ software 35. Plaque diameters were reported as a percentage of the wild-type diameter, the latter always measured in parallel. Plaque diameters were plotted with GraphPad Prism 8 [GraphPad Software Inc].
Mammalian expression plasmids
All pUL36 expression plasmids were subcloned from full-length recombinant BACs as GFP fusions into either pEGFP-C1 or pEGFP-N1 [Clontech] as described previously (Extended Data Table 1) 3,36–38. A mCherry-tubulin plasmid was obtained from Addgene [Addgene, 26768], and mCherry-KLC1, mCherry-KLC2, HA-KLC1 and HA-KLC2 were provided by Michael Way 39.
Imaging of transiently transfected cells
Vero cells were transfected with mammalian expression plasmids using Lipofectamine 2000 (Invitrogen) or polyethylenimine (PEI; Polysciences, 23966). PEI was used as previously described 3. For Lipofectamine transfections, a confluent plate of Vero cells was split 1:4 into a 6-well plate containing sterile glass coverslips (22 × 22 mm, #1.5) and incubated with a DNA-Lipofectamine 2000 mixture (0.5–3 μg of DNA and 5 μl of Lipofectamine 2000 in 250 ml serum-free DMEM per well) for 18–28 hr before imaging. Cells were imaged live in chambers sealed with VALAB (Vaseline, lanolin, and beeswax) as previously described 25. Images were acquired with an inverted wide-field Nikon Eclipse TE2000-E fluorescence microscope fitted with a 60x × 1.4NA objective and a CoolSnap HQ2 camera [Photometrics]. The microscope was housed in a 37°C environmental box [InVivo Scientific]. Time-lapse recordings were acquired at 10 frames/s with a Nikon Ti microscope fitted with a Yokogawa confocal scanner unit, and either a Cascade II:1024 [Photometrics] or sCMOS Neo camera [Andor] at 37°C. Image acquisition and processing was done with MetaMorph [Molecular Devices], and ImageJ software 35.
For immunofluorescence imaging, transfected Vero cells were fixed and permeabilized on coverslips with ice-cold methanol for 5 min at −20°C followed by ice-cold acetone for 2 min at −20°C. Air-dried coverslips were washed in PBS and then treated with primary antibodies diluted in PBS at room temperature (RT) for 1 hr. Primary antibodies used were: mouse anti-Kif5 heavy chain (1:100) [Millipore, H2] and mouse anti-KLC (1:1000) [63–90; provided by Scott Brady]. After washing 3x with PBS, the primary antibodies were detected using goat anti-mouse Alexa-568 (1:250) [ThermoFisher Scientific, A-11019] for 1 hr at RT. Cells were washed at least 5x in PBS and then mounted on coverslips using Vectashield mounting media [Vector Laboratories] and sealed with nail polish (OPI, Suzi & the 7 Düsseldorfs).
Live imaging of intracellular capsid localization
NHDF, RPE, and primary DRG were infected with either HSV-1 or PRV expressing fluorescently-tagged capsids (Extended Data Table 1), and trafficking of capsids to nuclei was monitored as previously described 3. Briefly, NHDF and RPE cells were plated on coverslips, incubated 1 day to obtain 80% confluency, infected at MOI 100 in the presence of 100 μM cycloheximide, and imaged at 4–5 hpi. Chick or rat DRG explants were adhered to coverslips (1 explant/coverslip) and incubated for 2 days to allow for axon outgrowth. Explants were infected with 1.3×10⁸ PFU and a minimum of 11 infected neural soma were imaged per DRG at 2–3 hpi. Individual cells were scored “juxtanuclear” if capsids were aggregated in the cytoplasm near the nucleus and no more than 5 capsids were present immediately adjacent to the nucleus. A minimum of 225 infected cells were imaged per sample, and samples were replicated in triplicate. Images of DRG were acquired with an inverted wide-field Nikon Eclipse TE2000-E fluorescence microscope fitted with a 60x × 1.4NA objective and a CoolSnap HQ2 camera [Photometrics]. The microscope was housed in a 37°C environmental box [In Vivo Scientific]. Images of NHDF and RPE cells were acquired with a Ti inverted microscope fitted with a 100× 1.45-NA objective (Nikon Instruments) and CSU-W1 confocal head (Yokogawa Electric Corporation) that was housed in a 37°C environmental chamber (InVivo Scientific). Illumination was provided by Obis 488 and Sapphire 561 lasers (Coherent).
Immediate-early gene reporter assay
For each sample, nearly confluent RPE cells in three wells of a 6-well tray were infected with either PRV-GS2564 or HSVF-GS3217 (Extended Data Table 1) at MOI 15. Fluorescence emissions were captured 30 minutes post Hoechst [Sigma, 33342] staining from 5–6 hpi for HSV-1 and 10 hpi for PRV. Cells were scored using the automated MetaMorph Cell Scoring App and were counted positive if reporter emissions were 2000 gray levels above background. A minimum of 600 cells were counted per sample from the three wells. This procedure was repeated to produce six replicas per sample. Images were acquired with a Nikon Eclipse TE2000-U inverted microscope using a 10x × 0.3 numerical aperture (NA) objective. Statistical analysis was performed with GraphPad Prism 8.
siRNA knock down
Kif5B knock downs were performed in NHDF cells in 12 well plates that were seeded one day before the start of the experiment. Cells were transfected with RNAiMAX [Invitrogen, 13778–150] at 60% confluency according to manufacturer’s protocol. Briefly, 25 μl Opti-MEM + 2.5 μl RNAiMAX and 50 μl Opti-MEM + 1.5 μl siRNA (100 μM) were combined and incubated for 10 min and added to the cells. Three days post-transfection the transfection procedure was repeated. Six days after the initial transfection, NHDF cells were split from one to two wells for western blot experiments or into two wells with coverslips for imaging experiments. 24 hr later, NHDF cells were infected with WT HSV-1 strain KOS, MOI 100, for 8 hr in medium containing 100 μg/ml cycloheximide. Cells were washed with PBS, fixed with methanol, and processed for immunofluorescence. Images were acquired by wide-field microscopy using a Leica DMI6000B-AFC microscope, 100x × 1.44NA objective, an ORCA-FLASH 4.0 camera, and MetaMorph software.
Automated analysis of intracellular capsid localization
RPE cells were plated on coverslips, incubated 1 day to obtain 80% confluency, infected at MOI 100 in the presence of 100 μM cycloheximide (to prevent viral gene expression and de novo capsid assembly), and fixed at 4–5 hpi with ice-cold methanol for 7 min at −20°C. Coverslips were washed 3x with PBS, and were permeabilized and blocked with PBS supplemented with 10% FBS and 0.25% saponin for 40 min at RT. The solutions were aspirated, replaced with primary antibody in antibody solution (PBS supplemented with 10% FBS and 0.025% saponin), and rocked overnight at 4°C. Primary antibodies used were rat anti-tyr-tubulin (1:400) [obtained from Gregg Gundersen], rabbit anti-pericentrin (1:200) [Bethyl Laboratories, IHC-00264] and mouse anti-HSV-1 VP5 (1:400) [Virusys, HA018]. Primary antibody solutions were replaced and washed 3x with antibody solution, and secondary antibodies diluted 1:400 were added for 1–2 hr at RT in the dark. Secondary antibodies used were anti-mouse Alexa-488, anti-rabbit Alexa-568, and anti-rat Alexa-647 [ThermoFisher Scientific, A-11001, A-11011, A-21247]. Coverslips were washed once with antibody solution and stained with Hoechst or DAPI diluted in antibody solution for 10 min. Coverslips were washed 4x in antibody solution for 5 min each, mounted on slides using Vectashield mounting media (Vector Laboratories), and sealed with nail polish (OPI, Suzi & the 7 Düsseldorfs). Imaging was performed on a Ti inverted microscope fitted with a 100 × 1.45NA objective (Nikon Instruments) and a CSU-W1 confocal head (Yokogawa Electric Corporation) that was housed in a 37°C chamber (InVivo Scientific). Illumination was provided by Obis 405, 488 and Sapphire 561 lasers (Coherent). Images were captured with 0.5 s or 2.0 s exposure times. NIS Elements microscope imaging software (Nikon, version 5.30.01) was used to quantify the number of capsids in the vicinity of nuclei and centrosomes within infected RPE cells. An automated pipeline was developed for this analysis that used four channel image series (nuclei, centrosomes, and capsids immunofluorescence, and DIC) as input.
Centrosomes were identified using Clustered Bright Spot Detection with Typical Diameter set to 12 pixels and a Contrast of 500. The detected objects were expanded using Grow Bright Regions to Intensity using a minimum value of 4500. Objects with an EqDiameter < 4 pixels or with circularity outside a 0.5 – 1.0 range were discarded. To further remove spurious objects, a binary mask was applied to discard centrosomes that overlapped nuclei by more than 8 pixels or were not within cell margins (see below).
Cell nuclei were identified after denoising images with the Smooth function set to a 3×3 kernel and processing for morphology using Close with a 2×2 kernel. Thresholding intensity values were set to the range of 1200 – 60095 with Smooth and Clean set to off, Fill Holes set to on, and Separate set to 1x. The Size filter was set to a minimum pixel size of 10. Open morphology was applied with a 3×3 kernel, and objects with an EqDiameter < 40 pixels or with Circularity outside a 0.5 – 0.99 range were discarded. To further remove spurious objects a binary mask was applied to discard nuclei that were not within the boundaries of a cell (see below). A nuclear Erode function was separately applied to remove spurious objects that were identified as centrosomes (see above).
Cells were identified based on background cellular fluorescence resulting from the anti-pericentrin antibody by expanding nuclei using Grow Bright Regions to Intensity using a minimum value of 1300 on the anti-pericentrin channel. A binary mask was applied to discard cells lacking a detectable centrosome. Cell identification was used to remove distal objects spuriously detected as centrosomes or nuclei (see above) but did not otherwise factor into the final analysis of capsid localization.
Capsids were identified using Clustered Bright Spot Detection with Typical Diameter set to 3 pixels and a Contrast of 400. The detected objects were expanded using Grow Bright Regions to Intensity using a minimum value of 2200. This resulted in capsids that could not be spatially resolved being identified as single objects (see below for how this was resolved). To remove spurious objects, a binary mask was applied to discard capsids that overlapped nuclei by more than 8 pixels or were not within cell margins. Objects identified as capsids were recorded for integrated intensity (SumIntensityOf function) and the respective distances to the nearest centrosome and nucleus (MinDistanceTo function). The three values were exported to Microsoft Excel for each capsid object.
Final analysis in Excel consisted of normalizing capsid integrated intensities to an estimated capsid number per object by using the modal intensity value of all capsid objects identified for the sample as a baseline. Capsids with a distance of zero to the centrosome were scored as centrosomal, and capsids with a zero distance to the nucleus and a distance greater than zero to the centrosome were scored as nuclear. Greater than 3000 capsids were scored per sample and samples were repeated in triplicate. Percentages of centrosomal and nuclear capsids, relative to all detected capsids, were plotted as stacked bar graphs (capsids localizing with neither structure were omitted from the plot).
Preparation of whole cell lysates
RPE cells were seeded in a 10 cm dish. At 90% confluency, cells were washed with 10 ml of ice-cold PBS and lysed with 400 μl 2x final sample buffer (60 mM Tris-HCl, pH 6.8, 2% SDS, 10% glycerol, 0.01% bromophenol blue) supplemented with 5% beta-mercaptoethanol. Dishes were scraped to dislodge all cells into suspension, which was then transferred to microcentrifuge tubes on ice, and passed 7 times through each of 3 needles (18.5 gauge, 21.5 gauge, 27.5 gauge). Samples were either immediately used for western blot analysis, or heated at 100°C for 6 min and then stored at −20°C.
Co-immunoprecipitation
The protocol for co-immunoprecipitation was previously described 3. Briefly, a confluent plate of HEK293 cells was split 1:1.5 into 6-well plates and transfected with a DNA-Lipofectamine 2000 mixture (0.5–4 μg of DNA and 5 μl of Lipofectamine 2000 in 250 ml of DMEM per well) 22–24 hr before cell lysis. Transfection efficiency was monitored based on GFP emissions. HEK293 cells transiently expressing GFP, GFP-tagged pUL36 mutants, and HA-tagged kinesin light-chain isoforms, were treated with 10 μM nocodazole (VWR) for 1 hr and lysed in 500 μl/well of cold TAP lysis buffer (50 mM Tris-HCl pH 7.5, 50 mM KCl, 2 mM MgCl2, 0.1 mM EDTA, 5% glycerol, 1% NP-40) supplemented with 10 μM nocodazole, 1 mM dithiothreitol, 0.5 mM NaF, 0.1 mM Na3VO4, 0.1 mM phenylmethylsulfonyl fluoride (PMSF), and a protease inhibitor cocktail [P1860, Sigma]. Cell lysates were centrifuged at 14,000 rpm for 20 min at 4°C. GFP-tagged proteins were immunoprecipitated using an anti-GFP [Invitrogen, A-6455] antibody-loaded Sepharose A/G bead slurry [CalBiochem, IP05] overnight (16–18 h) at 4°C. Beads were washed four times with cold supplemented TAP lysis buffer and resuspended in 60 μl of 2x final sample buffer supplemented with 10% β-mercaptoethanol. Samples were either immediately used for western blot analysis, or heated at 85°C for 15 min and then stored at −20°C.
Western blot analysis
Whole cell lysates and immunoprecipitated samples were separated on 4–20% precast Mini-PROTEAN TGX gels [Bio-Rad] and transferred to PVDF Hybond-P membranes [GE Healthcare] or Immobilon-FL membrane [Invitrogen]. Whole cell lysates were first heated to 100°C for 6 min, whereas immunoprecipitated samples were divided into two equal parts (25 μl each) and, along with 30 μl of cleared cell lysates (6% of total input) were heated at 85°C for 15 min. Membranes were blocked with 5% dry nonfat milk in PBS for 1.4 hr at RT, then incubated with an appropriate dilution of primary antibody at 4°C overnight. The following primary antibodies, all diluted 1:1000, were used: anti-GFP [Santa Cruz Biotechnology, B2], anti-HA [ABM, G036], anti-p150glued [BD Biosciences, 610473], pan anti-Kif5 [reacts with Kif5A, Kif5B, and Kif5C; Millipore, H2], anti-Kif5A [Abcam, ab5628], anti-Kif5B [Abcam, ab5629], anti-Kif5C [Abcam, ab5630], 63–90 anti-kinesin light chain, and anti-alpha tubulin [Abcam, ab7291]. A horseradish peroxidase-conjugated goat anti-mouse antibody was used at a 1:10,000 dilution [Jackson ImmunoResearch, 115–035-146] or goat anti-mouse IRDye 800CW [LI-COR Biosciences, 926–32210] at 1:10,000 and donkey anti-rabbit IRDye 680RD [LI-COR Biosciences, 926–68073] at 1:10,000. Blots were visualized using a luminol-coumeric acid-H2O2 chemiluminescence solution and exposed film was digitized with an Epson Perfection V500 photo scanner or imaged with a LI-COR Odyssey FC imaging system at 700 nm and 800 nm wavelengths for 3.5 min each. All antibodies were diluted in 1% dry nonfat milk in PBS except for anti-kinesin heavy chain antibody [H2, Millipore], which was diluted 1:500 in 5% dry nonfat milk in PBS. Western blots of Kif5 expression were performed in triplicate.
Detection of beta-lactamase in extracellular viral particles (nitrocefin assay)
Isolated virus preparations were diluted to 1.0×10⁸ PFU/ml (HSV-1) or 1.0×10⁵ PFU/ml (PRV) in TNE in a final volume of 100 μl. Triton X-100 and NaCl were added to final concentrations of 2% and 100 mM, respectively, and incubated in the dark for 30 min (HSV-1) or 48 h (PRV) to extract viral envelopes. Samples were transferred to plates [CoStar, 3603] pre-mounted in a Synergy H1 hybrid plate reader [Biotek, Winooski, VT], and nitrocefin [Sigma Aldrich, 80017–706] was added at a final concentration of 0.1 mg/ml immediately before reading absorbance (HSV-1) or at the time of sample incubation (PRV). All experiments were replicated in triplicate.
Viral delivery of beta-lactamase to cells upon infection (CCF2 assay)
A previously described beta-lactamase penetration assay was modified to measure the delivery of kinesin-1 to RPE cells 31. RPE cells were cultured as described above. Media was replaced with 0.6 μl CCF2/AM + 5.4 μl Solution B + 79 μl Solution C [CCF2/AM Live-Blazer dye solution; Invitrogen, K1032], 15 μl 0.1 M probenecid, and 500 μl F12 media supplemented with 10% FBS. Cells were incubated for 45 min at 37°C to achieve loading of CCF2 into the cytosol of cells and then washed three times with serum-free F12 media. The serum was reduced to 2% FBS and cells were infected with MOI 10. Cells were imaged from 45 min post infection using an inverted wide-field Nikon Eclipse TE2000-U microscope fitted with a 60x × 1.4NA objective, beta-lactamase ratiometric filter set [Chroma], and a CoolSnap HQ2 camera [Photometrics]. Three sequential images of a single field were captured beginning with differential interference contrast (DIC), followed by fluorescence imaging with a HQ405/20x excitation filter and HQ460/40m emission filter, and lastly with HQ405/20x excitation and HQ530/30m emission filters. 100 ms exposures were used for all images. CCF2 cleavage was quantitated by drawing a region of interest (ROI) around a cell on the DIC image, which was then transferred to the 460 nm and 530 nm images. The average fluorescence intensity of the 460 nm ROI was divided by the corresponding average fluorescence intensity of the 530 nm ROI. Ratiometric values were obtained for three independent experiments with at least 50 ROIs recorded per experiment. Image analysis was performed with the MetaMorph software package [Molecular Devices].
Inhibition of DmrB-Kif5C
RPE cells were cultured as described above, seeded on glass coverslips, and expanded to ~70% confluency. The culture media was supplemented with 1 μM B/B homodimerizer drug [Takara 635060] for 45 min prior to infection. RPE cells were infected at MOI 100 in the presence of 100 μM cycloheximide, and both drugs were maintained through 4 hpi when capsid accumulation at nuclear rims was imaged as described above.
RNA preparation and quantitative real-time RT-PCR
Approximately 4×10⁵ PK15 cells were infected at MOI 1 or 10. At 4 hpi, total RNA was isolated with TRIzol according to the manufacturer’s instructions [Invitrogen, 15596–026], and contaminating DNA was removed with RQ1 RNase-free DNase [Promega, M6101]. RNA concentration was determined by absorbance at 260 nm with a NanoDrop 8000 [Thermo scientific]. Gene-specific complementary DNAs were synthesized using the SuperScript III First-Strand Synthesis System [Invitrogen, #18080–051] as recommended by the supplier. SYBR Green-based quantitative real-time PCR was performed on the first-strand cDNAs in a LightCycler 480 II [Roche], based on a previously described protocol 40. Briefly, all reactions were carried out in 10 μl volumes: 2 μl cDNA, 5 μl LightCycler 480 SYBR Green I Master [Roche, 4707516001], 0.5 μl forward primer, 0.5 μl reverse primer (0.5 μM each), and 2 μl water. Running conditions and primer sequences were described previously 40. No-RT controls and melting point analysis were used to confirm the specificity of the PCR reactions. Swine S28 rRNA was used as a loading control. The crossing points, the point at which the fluorescence rises appreciably above the background fluorescence, for each transcript was determine by “Fit Point Method” using LightCycler 480 II software 1.5.0 SP3 [Roche]. IE180 mRNA levels were normalized to respected S28 rRNA levels and depicted as a fold change over IE180 mRNA levels during wild-type infection. Results are averages of three independent experiments, and significance was determined using a Student’s t-test. To ensure accuracy of the results, virus dilutions used in the assay were titered on PK15, and preparations were discarded if the titers varied > 2-fold.
Isolation of post-nuclear supernatants
RK13 cells were infected with PRV-GS4284 or PRV-GS5636 at MOI 20 for 1 hr at 37°C. Cells were then washed, overlaid with pre-warmed medium and incubated at 37°C. After 16 h, infected cells were washed twice with ice-cold MEPS buffer (5 mM MgSO4, 5 mM EGTA, 0.25 M sucrose, 35 mM PIPES [pH 7.1]) then scraped into ice cold MEPS containing 2 mM phenylmethylsulfonyl fluoride, 5% (vol/vol) Protease Inhibitor Cocktail (Sigma P8340) and 4 mM dithiothreitol (DTT). A post-nuclear supernatant was then prepared as previously described 41,42.
In vitro motility assays
Optical micro-chambers were prepared as previously described using 24×40 mm coverslips and a piece of cut glass separated by 2 parallel strips of double-sided tape [Scotch 3M] to create a 3–5 μl volume chamber 41,42. Fluorescent microtubules were prepared as described previously using porcine brain tubulin either unlabeled, or labeled with HiLyte Fluor 488 [Cytoskeleton, Inc.] 42–44. Unlabeled and labeled tubulin were mixed at a molar ratio of 10:1 (total concentration 6.5 μg/μl) in BRB80/G buffer (1 mM EGTA, 1 mM MgCl2, 1 mM GTP, 3% glycerol, 80 mM PIPES [pH 7.1]) Polymerization was allowed to occur at 37°C for 25 min, microtubules were stabilized by the addition of prewarmed BRB80/G buffer containing 20 μM Taxol, and stabilized microtubules were pelleted at 15,000 × g in an Eppendorf 5415R centrifuge at RT. Microtubules were resuspended in fresh BRB80/G buffer containing 20 μM Taxol and stored in the dark at RT for up to 3 weeks. Microtubules were diluted to the desired concentration in PMEE buffer (5 mM MgSO4, 1 mM EGTA, 0.5 mM EDTA, 35 mM PIPES [pH 7.4]) supplemented with 20 μM Taxol, flowed into micro-chambers precoated with 10 μg/ml DEAE-Dextran [Pharmacia], allowed to attach for 5 min, and washed with Blocking Buffer (PMEE supplemented with 20 μM Taxol, 2 mg/ml BSA, 4 mM DTT, 2 mg/ml ascorbic acid, 5 mg/ml casein) to remove unbound microtubules.
Post-nuclear supernatants prepared from PRV-infected RK13 cells were rapidly thawed, diluted as necessary and added to each micro-chamber. For initial viral particle attachment to microtubules, chambers were incubated for 10 min in a closed humidified container. Unbound post-nuclear supernatant was washed away with Assay Buffer (AB: PMEE supplemented with 20 μM Taxol, 2 mg/ml BSA, 4 mM DTT, 2 mg/ml ascorbic acid). Chambers were placed on a heated microscope stage and motility was initiated with addition of 50 μM ATP in AB at 37°C. For motor inhibitor studies, 1 mM AMP-PNP or 5 μM sodium orthovanadate in AB was premixed with the ATP prior to addition.
Percentage motility was calculated by comparing the number of particles initially bound to microtubules to those that became motile following addition of the ATP or ATP/inhibitor mixture. Imaging was performed in the Analytical Imaging Facility of the Albert Einstein College of Medicine. Videos were saved in a Zeiss AxioVision ZVI [Zeiss Vision Image] format using AxioVision Rel. 4.8.2 image acquisition and management software. Volocity 6.2.2 software [Perkin Elmer] was used to count numbers of bound and motile particles/field.
Animal studies
BALB/C mice (males) from Charles River Breeding Laboratories were maintained under 12 hr light: 12 hr dark conditions throughout with food and water continuously available and animals were weighed daily. All procedures conformed to NIH guidelines for work with laboratory animals and were approved by the Institutional Animal Care and Use Committee of the University of Nebraska, Lincoln. Intranasal infection of BALB/C mice was performed as previously described 3,29. Stocks of HSV-1 McKrae were produced on WT RPE or RPEΔKif5B cells, sonicated, and cleared by centrifugation at 300 × g for 5 minutes. Supernatants were aliquoted and frozen. The stock produced on RPEΔKif5B cells was approximately 30-fold higher titer than the stock produced on WT RPE cells at this stage. Both stocks were diluted to 3×10⁷ PFU/ml with serum-free DMEM, and titers were measured again: 2.17×10⁷ PFU/ml (produced on WT RPE) and 3.68×10⁷ PFU/ml (produced on KO RPE). Mice (5 animals per group) received 5 μl of either stock into each nostril while anesthetized by isoflurane (2.5 – 5.0%) inhalation. Behavior was continuously video monitored and images were captured every 10 min. Time to death after inoculation was determined from recorded images and rounded to the nearest hour. Animals were assigned randomly to experimental and control groups. (e.g., 10 animals were randomly assigned to two groups, one control or one experimental group with 5 animals in each group). Animals were age and sex matched. Kaplan–Meier plots of mouse survival were prepared using a log-rank Mantel-Cox test. P-values were determined by a Tukey’s multiple comparison test.
HSV-1 isolation for mass spectrometry
Isolation of HSV-1 viral particles was performed as previously described with the following changes 45,46. Wild-type RPE or RPEΔKif5B cells were seeded in 15 cm dishes and 5 dishes were infected at MOI 10 per virus. Media was harvested 22–24 hpi. Cellular debris was removed by centrifugation at 5,000 × g for 30 min and supernatants were transferred to SW28 rotor tubes (Fisher, NC9115402) and underlayed with 10% Nycodenz. Viral particles were pelleted by ultracentrifugation at 30,000 × g for 60 min. The pellet was resuspended in 100 μl PBS supplemented with protease inhibitor cocktail [Sigma, P8340], layered on top of a 12 to 32% dextran gradient in TNE buffer (10 mM Tris, 150 mM NaCl, and 1 mM EDTA, pH 7.5), and centrifuged in a SW41 rotor at 68,400 × g for 1 hr. The heavy viral particle band (H-band) was collected with a syringe by side puncture of the gradient. Each H-band was diluted in a total volume of 2 ml of TNE (20 mM Tris, pH 7.6, 500 mM NaCl, 1 mM EDTA) supplemented with 10 μl of protease inhibitor cocktail [Sigma, P8340] and pelleted in a Beckman SW50.1 rotor at 68,400 × g for 1 hr at 4°C. Pelleted H-bands were resuspended in 50 μl of final sample buffer supplemented with 5% beta-mercaptoethanol and stored at −20°C. Resuspended H-bands were thawed, boiled for 5 min, and loaded on a 4 to 20% Mini-PROTEAN TGX gel [Bio-Rad, 456–1096] with Bio-Rad dual-color standards [Bio-Rad, 1610374].
Mass spectrometry sample preparation
Protein samples were separated on a 4–12% SDS-PAGE gel and the region of the gel roughly corresponding to 100–150 kDa proteins was cut out, chopped into 1 mm × 1 mm cubes, and processed for in-gel digestion. Gel pieces were incubated in 50 mM ammonium bicarbonate (ABC) supplemented with 10 mM TCEP for 1 hr at 37°C. The solution was replaced with 50 mM ABC supplemented with 50 mM iodoacetamide and incubated for 45 min at RT in the dark, then replaced with 50 mM ABC supplemented with 50 mM TCEP and incubated for 30 min at RT. Gel pieces were washed 3 times with 50 mM ABC and digested with sequencing grade modified trypsin (1 μg in 50 mM ABC) overnight at 37°C with shaking. The following day, the supernatant was collected, and the gel pieces were subjected to three rounds of incubations with 50% acetonitrile (ACN) and 5% formic acid (FA) solution for 30 min at RT with shaking. Supernatant was collected after each incubation, combined, and dried by vacuum centrifugation. Samples were re-suspended in 0.5% trifluoroacetic acid, desalted with Pierce C18 spin columns [Thermo Scientific, 89873] per manufacturer’s instructions, and dried by vacuum centrifugation for future MS analysis.
Mass spectrometry analysis
Dried samples were re-suspended in 20 μl Buffer A (94.875% H2O with 5% ACN and 0.125% FA) and three micrograms of each fraction or sample, as determined by microBCA assay [Thermo Scientific, 23235], were loaded via auto-sampler with an UltiMate 3000 HPLC pump, onto a vented Pepmap 100, 75 μm × 2 cm, nanoViper trap column coupled to a nanoViper analytical column [Thermo Scientific] with stainless steel emitter tip assembled on the Nanospray Flex Ion Source with a spray voltage of 2000 V. A coupled Orbitrap Fusion was used to generate MS data. Buffer A contained 94.785% H2O with 5% ACN and 0.125% FA, and buffer B contained 99.875 ACN with 0.125% FA. MS parameters were as follows: ion transfer tube temp = 300°C, Easy-IC internal mass calibration, default charge state = 2 and cycle time = 3 s. Detector type set to Orbitrap, with 60K resolution, with wide quad isolation, mass range = normal, scan range = 300–1500 m/z, max injection time = 50 ms, AGC target = 200,000, microscans = 1, S-lens RF level = 60, without source fragmentation, and datatype = positive and centroid. MIPS was set as on, included charge states = 2–6 (reject unassigned). Dynamic exclusion enabled with n = 1 for 30 s and 45 s exclusion duration at 10 ppm for high and low. Precursor selection decision = most intense, top 20, isolation window = 1.6, scan range = auto normal, first mass = 110, collision energy 30%, CID, Detector type = ion trap, OT resolution = 30K, IT scan rate = rapid, max injection time = 75 ms, AGC target = 10,000, Q=0.25, inject ions for all available parallelizable time.
Mass spectrometry data analysis
Protein identification/quantification and analysis were performed with Integrated Proteomics Pipeline - IP2 [Integrated Proteomics Applications, Inc] using ProLuCID 47,48 and DTASelect2 49,50. Spectrum raw files were extracted into MS1 and MS2 files using RawConverter 1.0.0.0 [http://fields.scripps.edu/downloads.php]. The tandem mass spectra were searched against databases for their relevant species [UniProt human protein database downloaded on 03–25-2014 and UniProt pig protein database downloaded on 08–01-2019] 51. Searched spectra were matched to sequences using the ProLuCID/SEQUEST algorithm [ProLuCID version 3.1] with 50 ppm peptide mass tolerance for precursor ions and 600 ppm for fragment ions. ProLuCID searches included all fully- and half-tryptic peptide candidates that fell within the mass tolerance window and with no miscleavages. Carbamidomethylation (+57.02146 Da) of cysteine was considered as a static modification. Peptide/spectrum matches (PSMs) were assessed in DTASelect2 using the cross-correlation score (XCorr), and normalized difference in cross-correlation scores (DeltaCN). Each protein identified was required to have a minimum of one peptide of minimal length of six amino acid residues. False discovery rate (FDR) was set to 1% at the protein level. Peptide probabilities and FDR were calculated based on a target/decoy database containing the reversed sequences of all the proteins appended to the target database 52.
Statistical analysis
Statistical significance was determined by unpaired two-tailed Student’s t-test for pairwise comparisons. A one-way analysis of variance (ANOVA) was performed with a post-hoc Tukey test for comparison of multiple experimental groups. All independent experiments are provided as biological replicates.
Ethics statement
All procedures conformed to NIH guidelines for work with laboratory animals and were approved by the Institutional Animal Care and Use Committee of the University of Nebraska, Lincoln (Protocol: 1086). Fertilized chicken eggs were obtained from Sunnyside of Beaver Dam, Inc. and tissue were harvested between embryonic day 8 and 10.
Extended Data
Extended Data Fig. 1. Transiently-expressed PRV pUL36 co-localizes with microtubules and accumulates at the cell periphery.
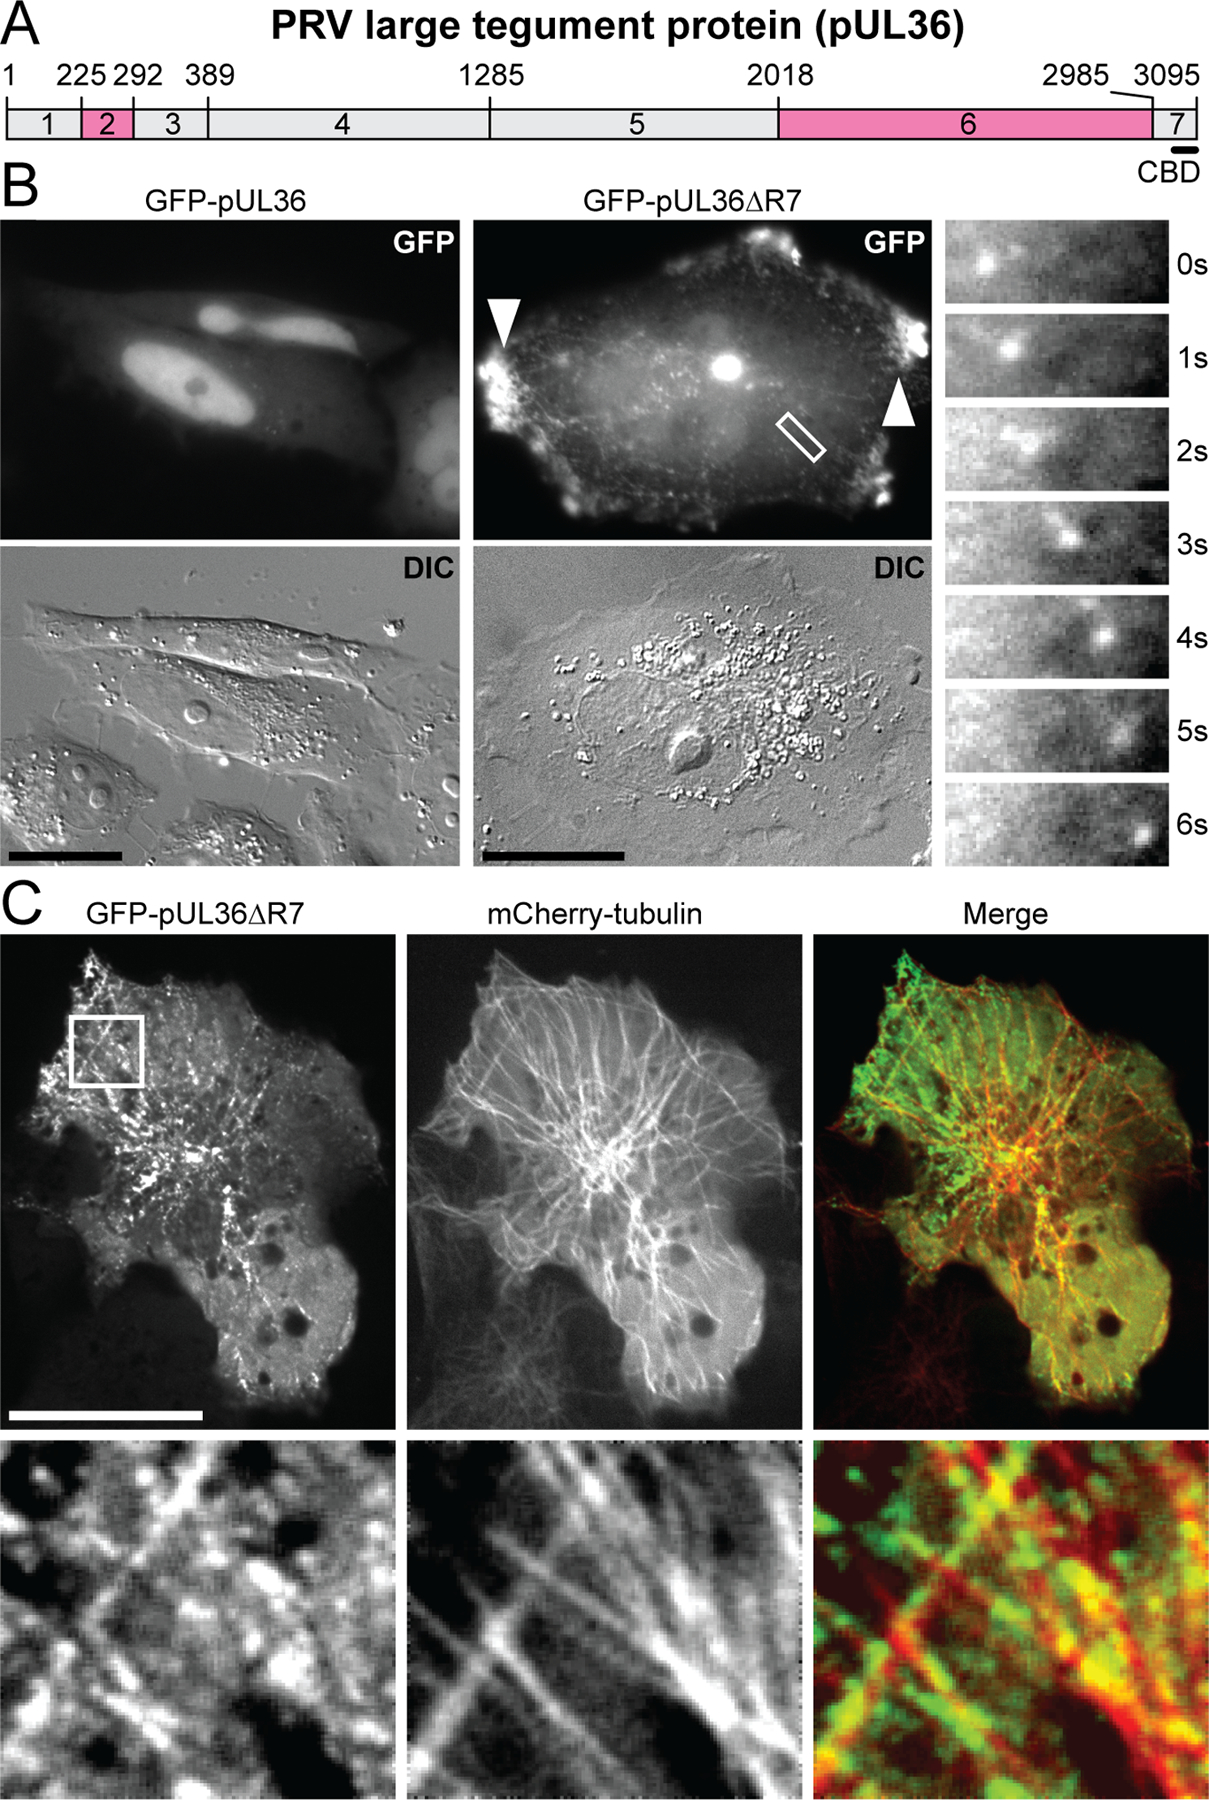
(A) Schematic representation of seven regions of pUL36. Regions 2 and 6 are proline rich (pink). Position of the capsid binding domain (CBD) consisting of amino acids 3033–3095 is indicated. Amino acid positions are indicated above the schematic. (B) Transiently expressed GFP-pUL36ΔR7, but not GFP-pUL36 (full length), formed small punctae that moved in curvilinear trajectories (also see Supplementary Video 1) and accumulated at the periphery of Vero cells (arrowheads). The 6.9 μm × 2.4 μm boxed region is expanded as a time-lapse montage to the right of the image (n=3 independent experiments). (C) GFP-pUL36ΔR7 decorates microtubules. Vero cells were transiently co-transfected with GFP-pUL36ΔR7 and mCherry-tubulin. The 7.4 μm × 7.4 μm boxed region is expanded below each image. All images were captured between 24–28 hours post transfection (hpt) (n=3 independent experiments). Scale bars are 20 μm.
Extended Data Fig. 2. Transiently-expressed PRV pUL36 interacts with components of the Kif5 motor complex.
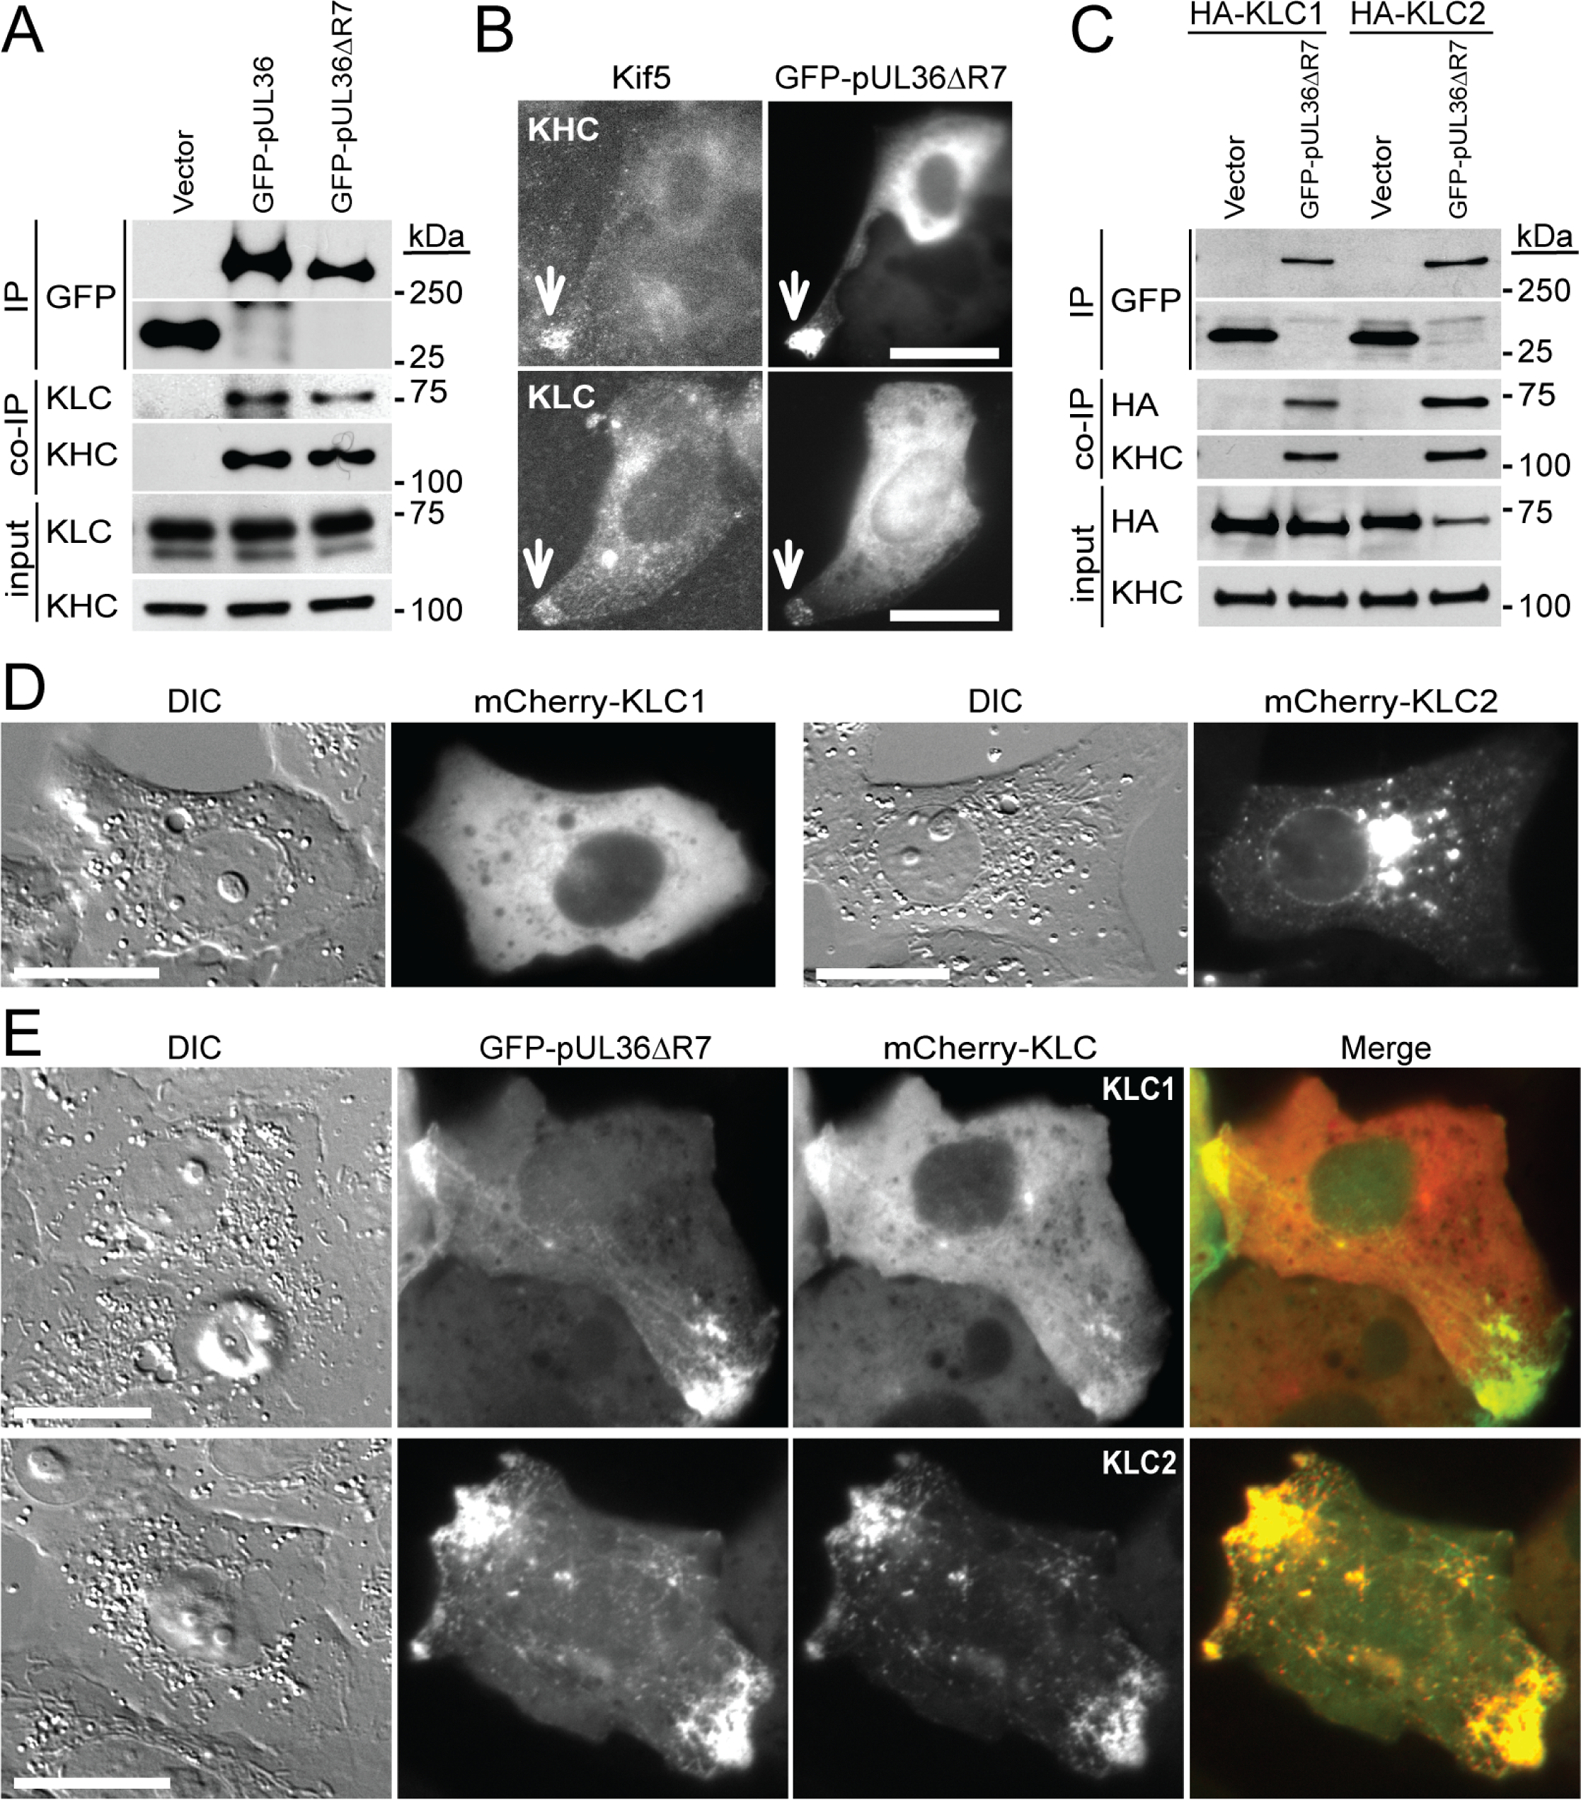
(A) pUL36 region 7 is dispensable for co-immunoprecipitation (co-IP) with Kif5 heavy chain (KHC) and Kif5 light chain (KLC). HEK293 cells were lysed 16–18 hpt and GFP-pUL36 was immunoprecipitated (IP) with anti-GFP antibody and detected by western blot as indicated. Inputs are 6% of crude lysates (n=3 independent experiments). (B) Peripheral accumulations of transiently expressed GFP-pUL36ΔR7 co-localize with endogenous cellular Kif5 components (arrows). Vero cells were fixed and immunostained for KHC or KLC at 20 hpt (n=3 independent experiments). Scale bars are 20 μm. (C) GFP-pUL36ΔR7 co-immunoprecipitates with KLC1 and KLC2 isoforms. HEK293 cells transiently expressing GFP or GFP-pUL36ΔR7 were co-transfected with HA-KLC1 and HA-KLC2. Endogenous KHC served as a positive co-immunoprecipitation control (n=3 independent experiments). (D) Transient expression mCherry-KLC1 and mCherry-KLC2 in Vero cells. Both fusion proteins show varying degrees of juxtanuclear localization and an absence of peripheral accumulation (n=3 independent experiments). (E) mCherry-KLC1 and mCherry-KLC2 redistribute with GFP-pUL36ΔR7 to the cell periphery during transient expression. Vero cells were imaged 24–28 hpt (n=3 independent experiments). Scale bars are 20 μm.
Extended Data Fig. 3. Mapping the PRV pUL36 kinesin-binding region.
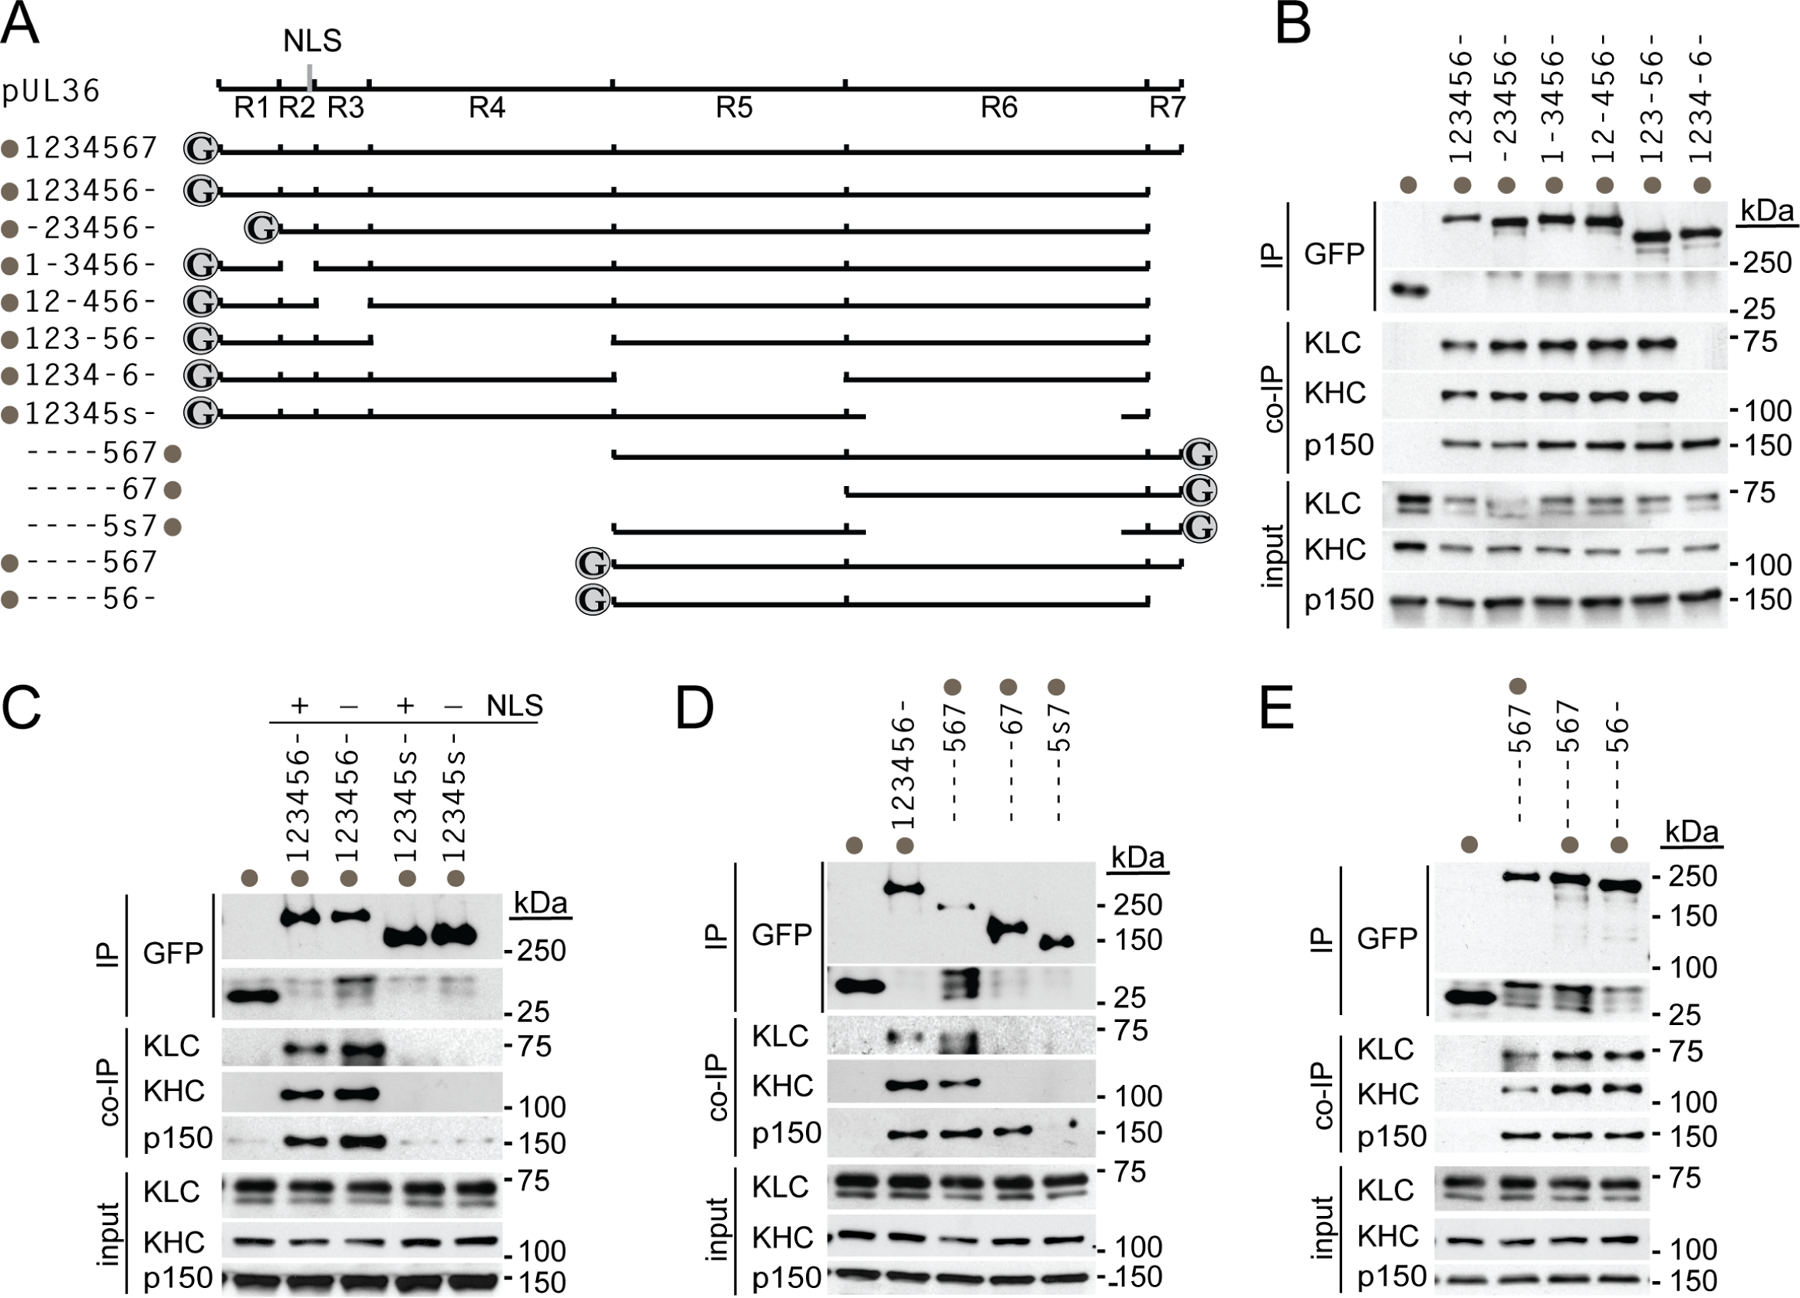
(A) Illustration of pUL36 constructs with amino- and carboxyl-terminal GFP fusions indicated (grey circles). Location of a cryptic nuclear localization signal (NLS) at the end of region 2 (vertical grey line in R2) that becomes active when region 6 is deleted is also indicated. Constructs are named for each intact region number with a dash representing deleted regions. In the case of region 6, a subregion consisting of the majority of the sequence was deleted (denoted “s” and consisting of amino acids 2087–2796). (B) pUL36 region 5 is required for interaction with the Kif5 complex (KHC, Kif5 heavy chain; KLC, Kif5 light chain; n = 3 independent experiments). (C) pUL36 region 6 is required for interaction with the Kif5 complex. Deletion of region 6 also resulted in nuclear localization of the protein due to the NLS in region 2. Mutation of the NLS (K285RRR > AAAA) restored protein localization to the cytoplasm (not shown) but did not restore Kif5 interaction (n = 3 independent experiments). (D-E) pUL36 regions 5–6, is sufficient for Kif5 binding. Interaction with a dynactin component, p150/glued (p150), was used as a positive co-immunoprecipitation control (n = 3 independent experiments each).
Extended Data Fig. 4. PRV pUL36 WD motifs are required for kinesin-1 binding.
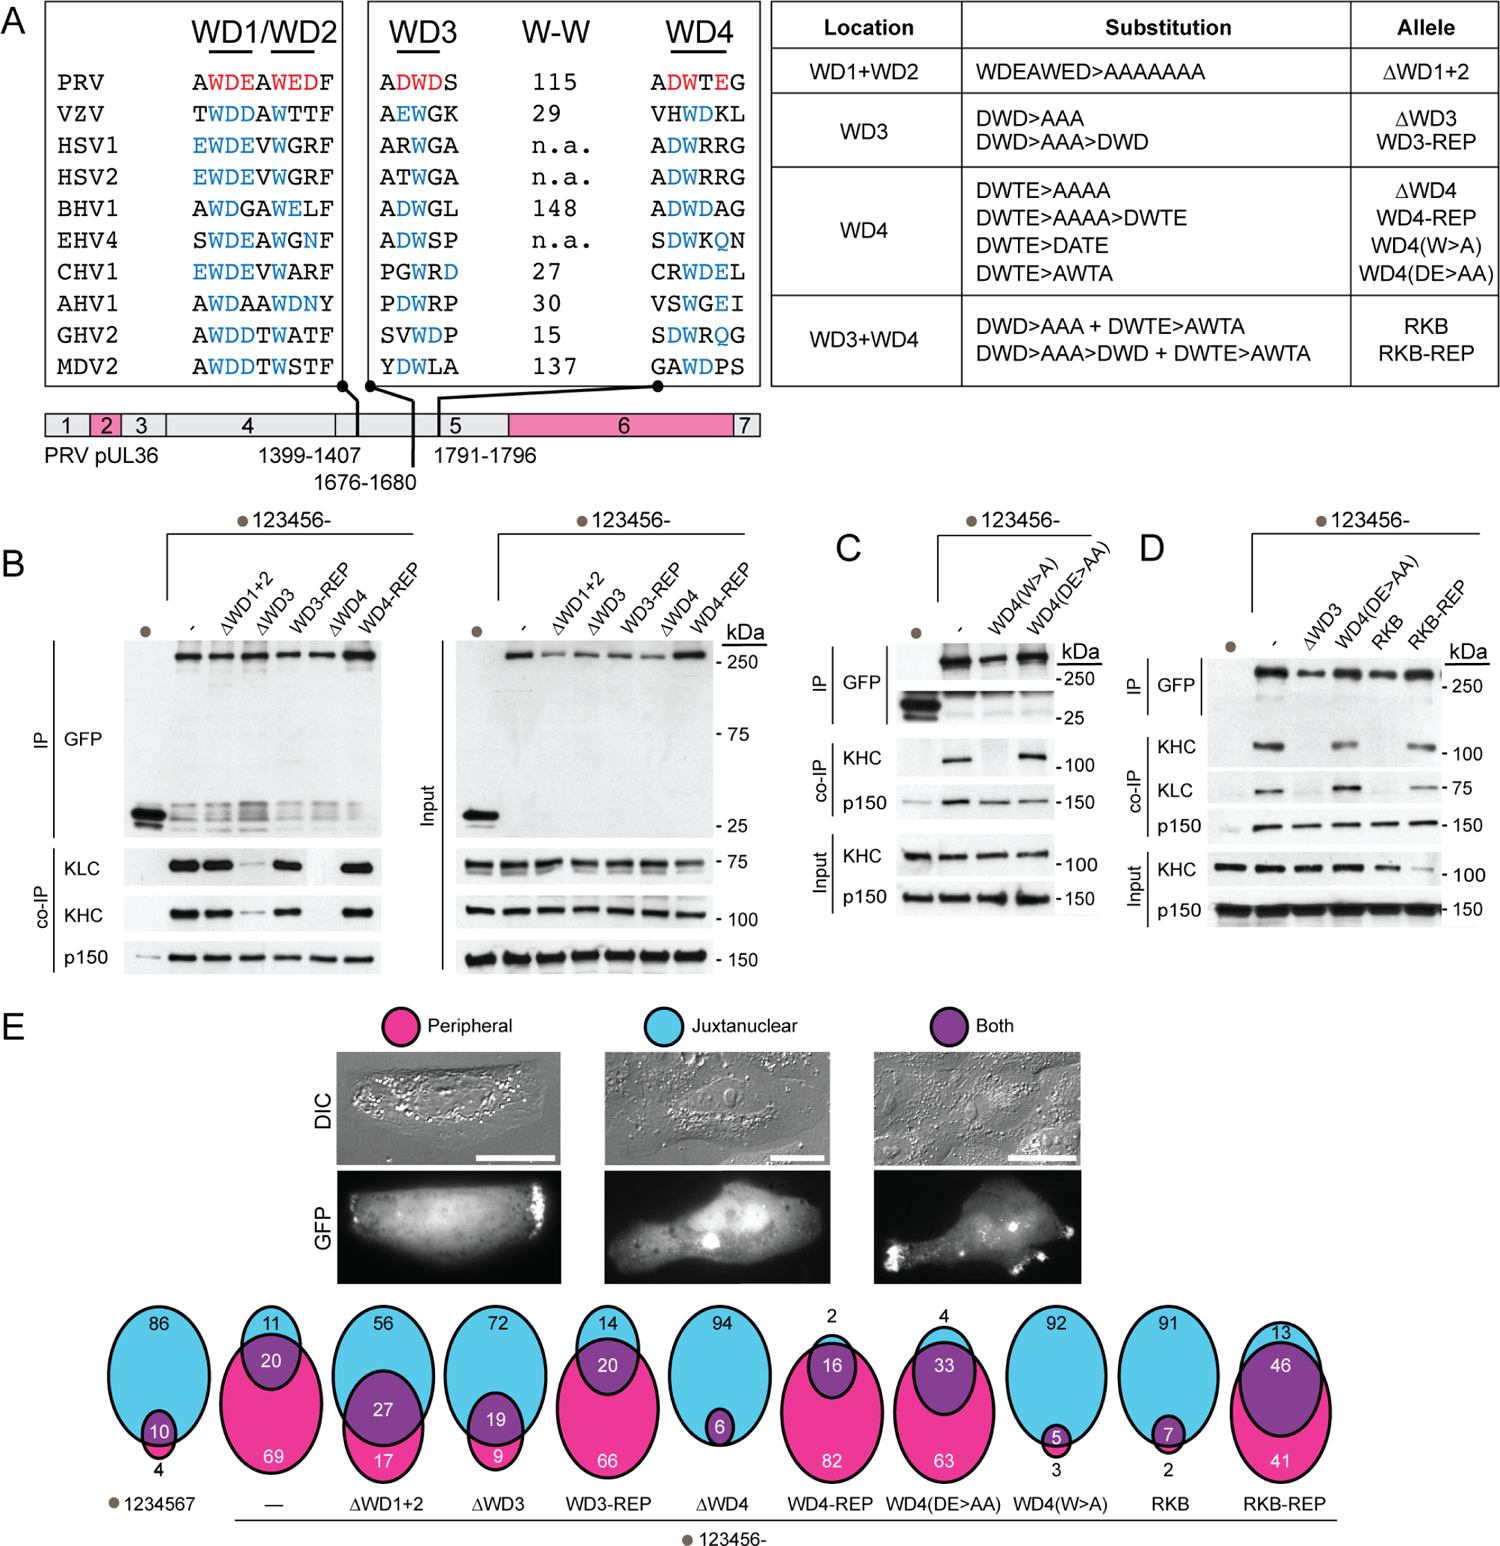
(A) Schematic representation of two potential bipartite kinesin-binding motifs (WD1/WD2 and WD3/WD4) in region 5 of pUL36. Corresponding regions from ten different alphaherpesvirinae are aligned. Prospective WD motifs in PRV are highlighted in red. Conserved tryptophans and/or surrounding E, D, N and Q at positions ±1 and +2 in pUL36 orthologs are in blue. The number of amino acids between the WD3 and WD4 tryptophans are indicated only when no other tryptophan was present in between (W-W); otherwise, n.a. is indicated. Table on the right summarizes mutants used for transient expression (RKB, reduced kinesin binding mutant that was subsequently introduced into PRV – see Extended Data Fig. 5 & 6). (B-D) Co-immunoprecipitations of pUL36 proteins and endogenous cellular Kif5 demonstrate that WD3 and WD4 contribute to the pUL36-Kif5 interaction. Interaction with dynactin component, p150/glued (p150) was used as a positive co-immunoprecipitation control (n = 3 independent experiments each). (E) Quantitation of cells displaying pUL36 localization at the cell periphery or juxtanuclear between 24–28 hpt. Representative images of cells and scoring are provided at top. Percentile distributions of pUL36 accumulation are illustrated by Venn diagrams (average of n = 3 independent experiments >250 cells each). Scale bars are 20 μm.
Extended Data Fig. 5. The PRV[RKB] mutant is defective for nuclear trafficking and gene expression.
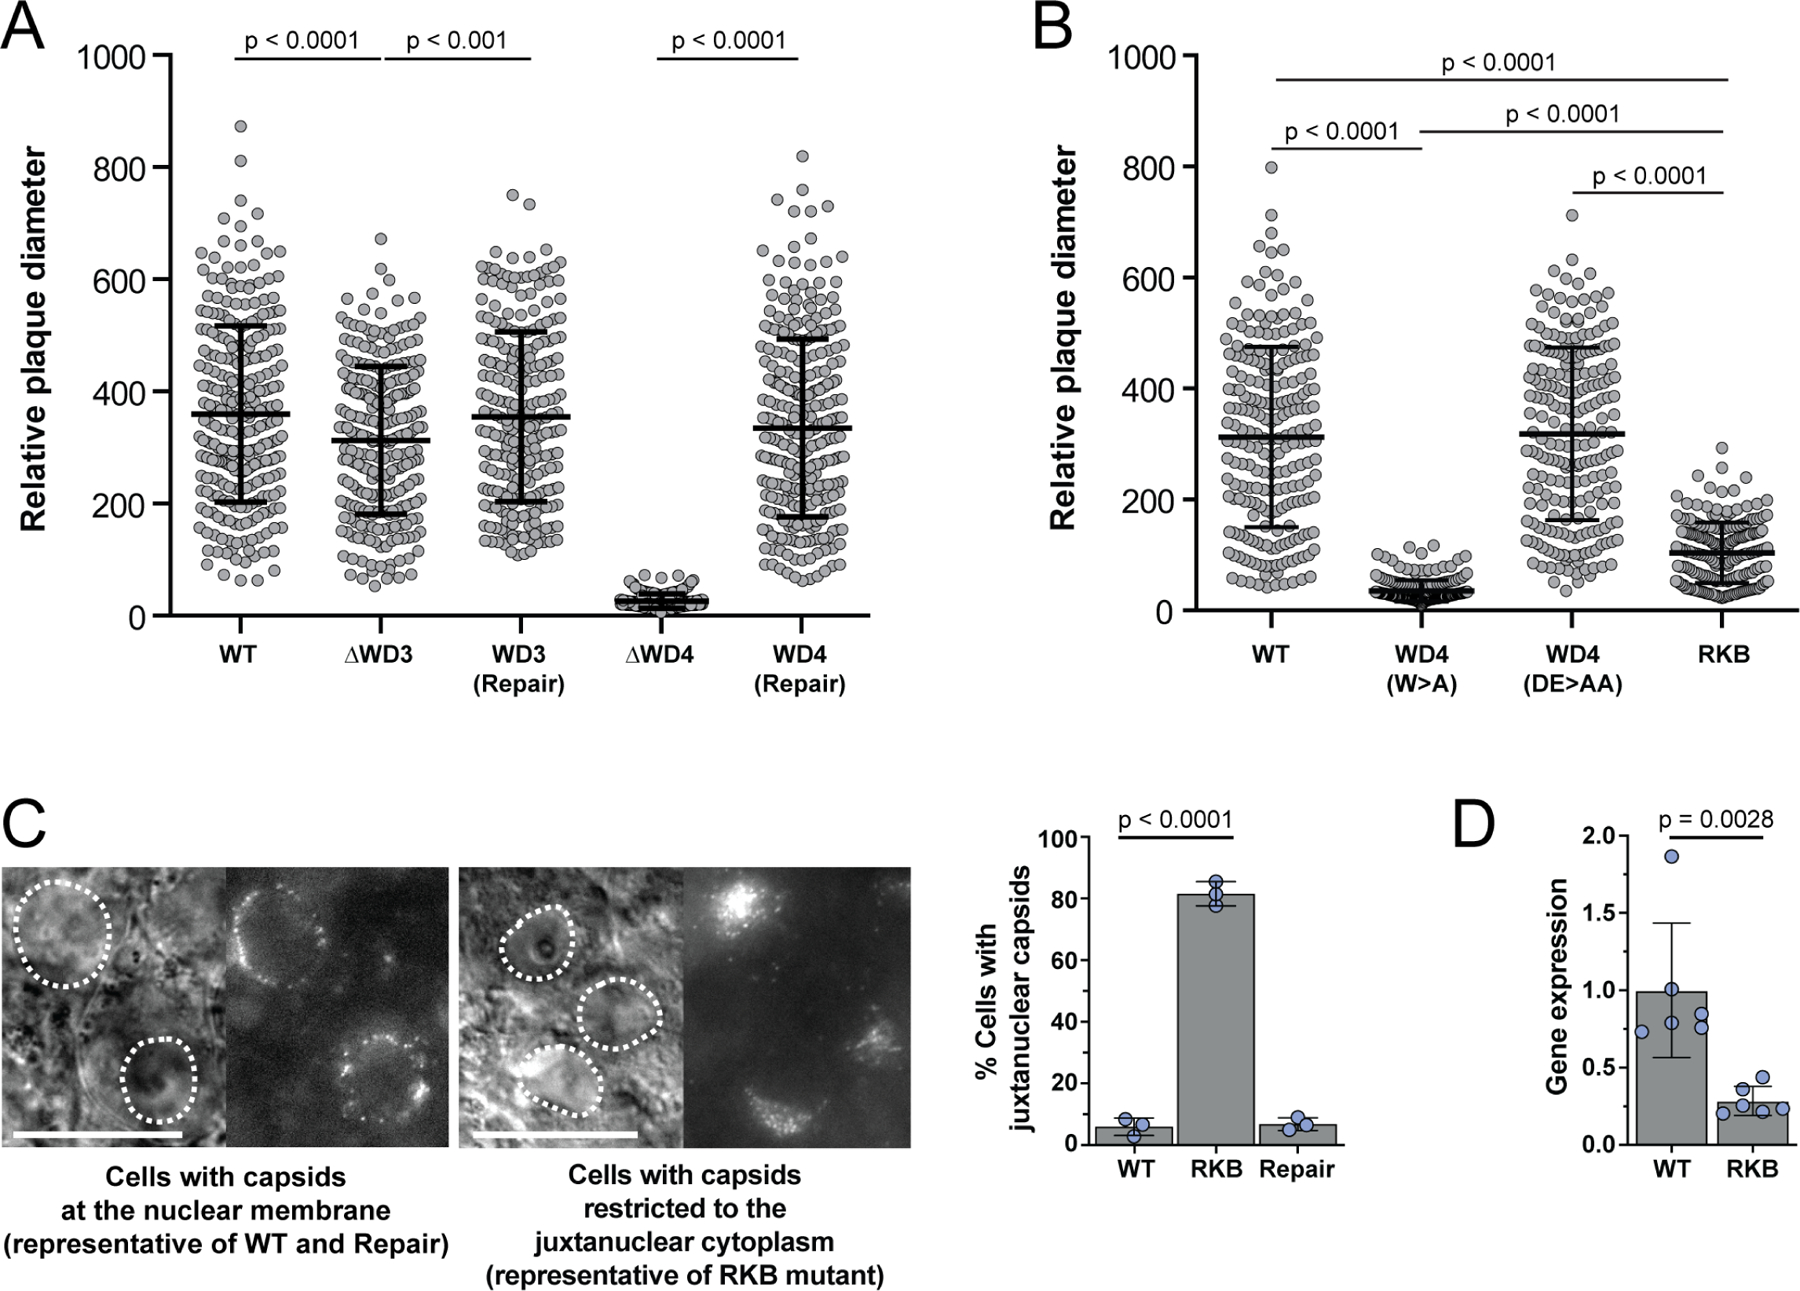
(A) Mutation of WD3 attenuated PRV spread, as measured by plaque size, whereas mutations of WD4 rendered PRV non-viable (n = 200 plaques over 3 independent experiments). (B) Mutation of the WD4 tryptophan alone also rendered PRV non-viable, whereas mutation of the surrounding acidic residues did not impair viral spread. PRV encoding both the ΔWD3 mutation and WD4(DE>AA) attenuated viral spread but could be propagated and further studied and was designated as the reduced-kinesin binding mutant (RKB; also see Figure S4). Plaque diameters were measured 43 hpt. Data are presented as scatter plots, with each dot representing a single plaque (n = 200 plaques over 3 independent experiments). Mean values ± SD are indicated. (P-values were determined by one-way analysis of variance with a post-hoc Tukey test). (C) Incoming capsids of PRV encoding the pUL36 RKB mutant accumulate juxtanuclear in explanted chick dorsal root ganglia (DRG). Representative images of neural soma (transmitted and fluorescent capsid image pairs with nuclei highlighted by dotted lines). Percentile distributions of juxtanuclear capsid accumulation are illustrated at right (n= 3 independent experiments > 500 infected cells each). DRG explants were imaged between 2.5–3 hpi. Scale bars are 20 μm. Mean values ± SD are indicated. (P values based on two-tailed unpaired t test). (D) PRV[RKB] has delayed viral gene expression. PK15 cells were infected at MOI 10 and total RNA was harvested at 4 hpi. Relative IE180 mRNA levels were measured by RT-PCR first-strand DNA synthesis and qPCR amplification using primers specific for PRV IE180 and the swine ribosomal S28 rRNA (loading control). Data was normalized to S28 rRNA levels and depicted as a fold change with respect to IE180 mRNA levels during WT infection (n = independent experiments). Mean values ± SD are indicated. (P values based on two-tailed unpaired t test).
Extended Data Fig. 6. PRV[RKB] is impaired for kinesin-based transport.
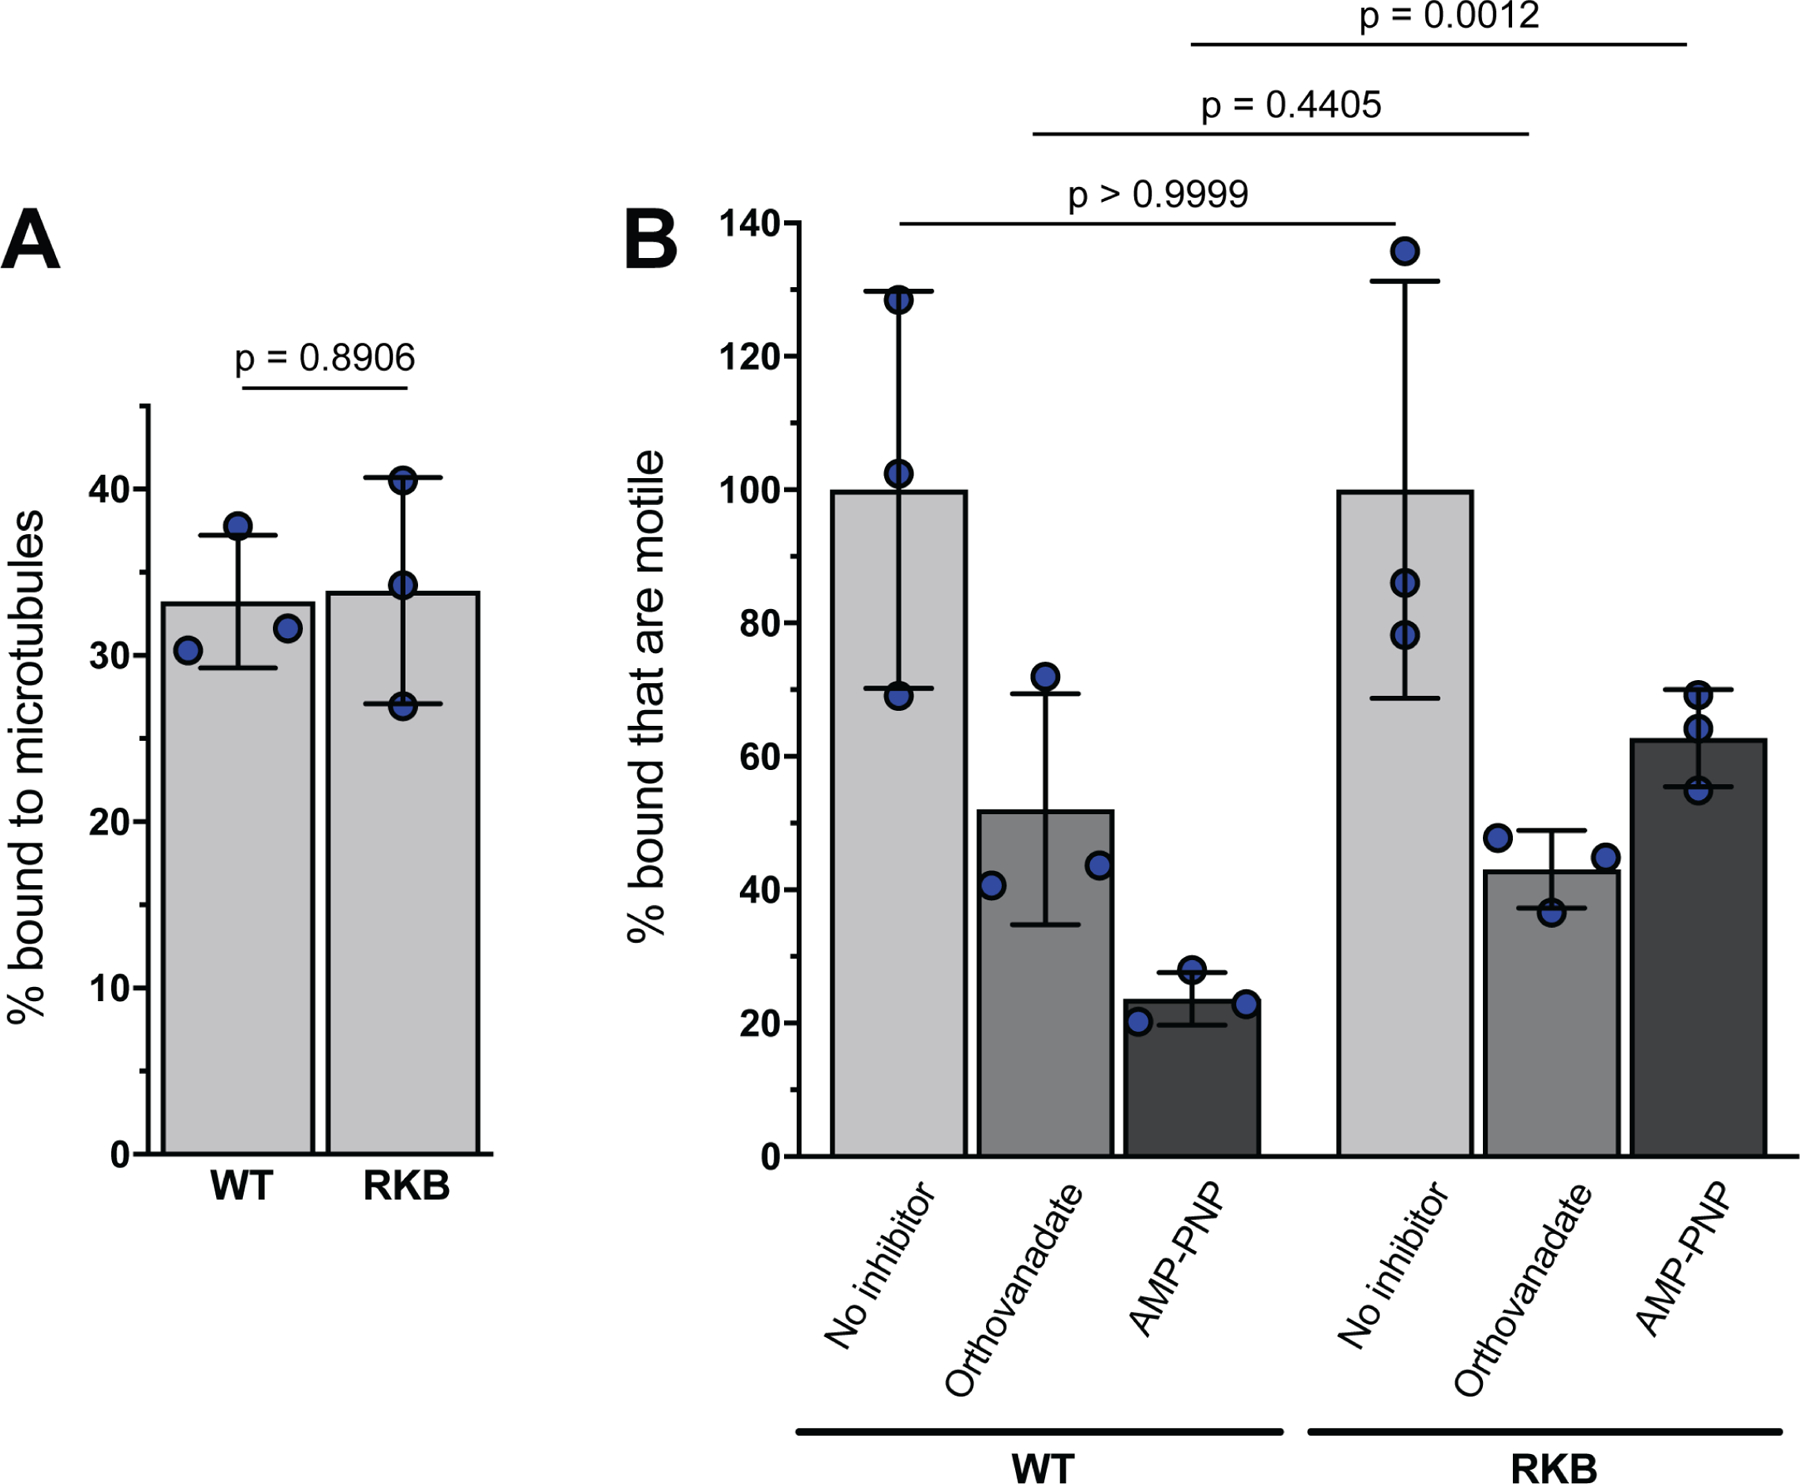
Viral particles were harvested from the cytoplasm of infected RK13 cells and allowed to bind to fluorescent microtubules in vitro. (A) Numbers of bound fluorescent viral particles were counted and are represented as a percentage of those initially added to the imaging chamber. Four independent chambers containing a total of 1204 and 805 bound particles were counted for wild-type PRV (WT) and PRV encoding the reduced kinesin binding mutant pUL36 allele [RKB]. (B) Motility was measured after addition of ATP supplemented with: no inhibitor (light grey bars), 5 μM sodium orthovanadate (a dynein inhibitor; medium grey bars) or 1 mM AMP-PNP (a kinesin inhibitor; dark grey bars). Numbers of motile virions were determined from triplicate motility chambers, and motility plotted as a percentage of the number of motile particles seen in the absence of inhibitor. For WT and RKB respectively, the numbers of individual viral particles examined for each set of conditions were as follows: no inhibitor (658, 706), sodium orthovanadate (776, 714), AMP-PNP (776, 714). Mean values ± SD are indicated (n = 3 independent experiments). (P values based on two-tailed unpaired t test).
Extended Data Fig. 7. Kinesin-1 knockdown impairs HSV-1 infection in primary human fibroblasts.
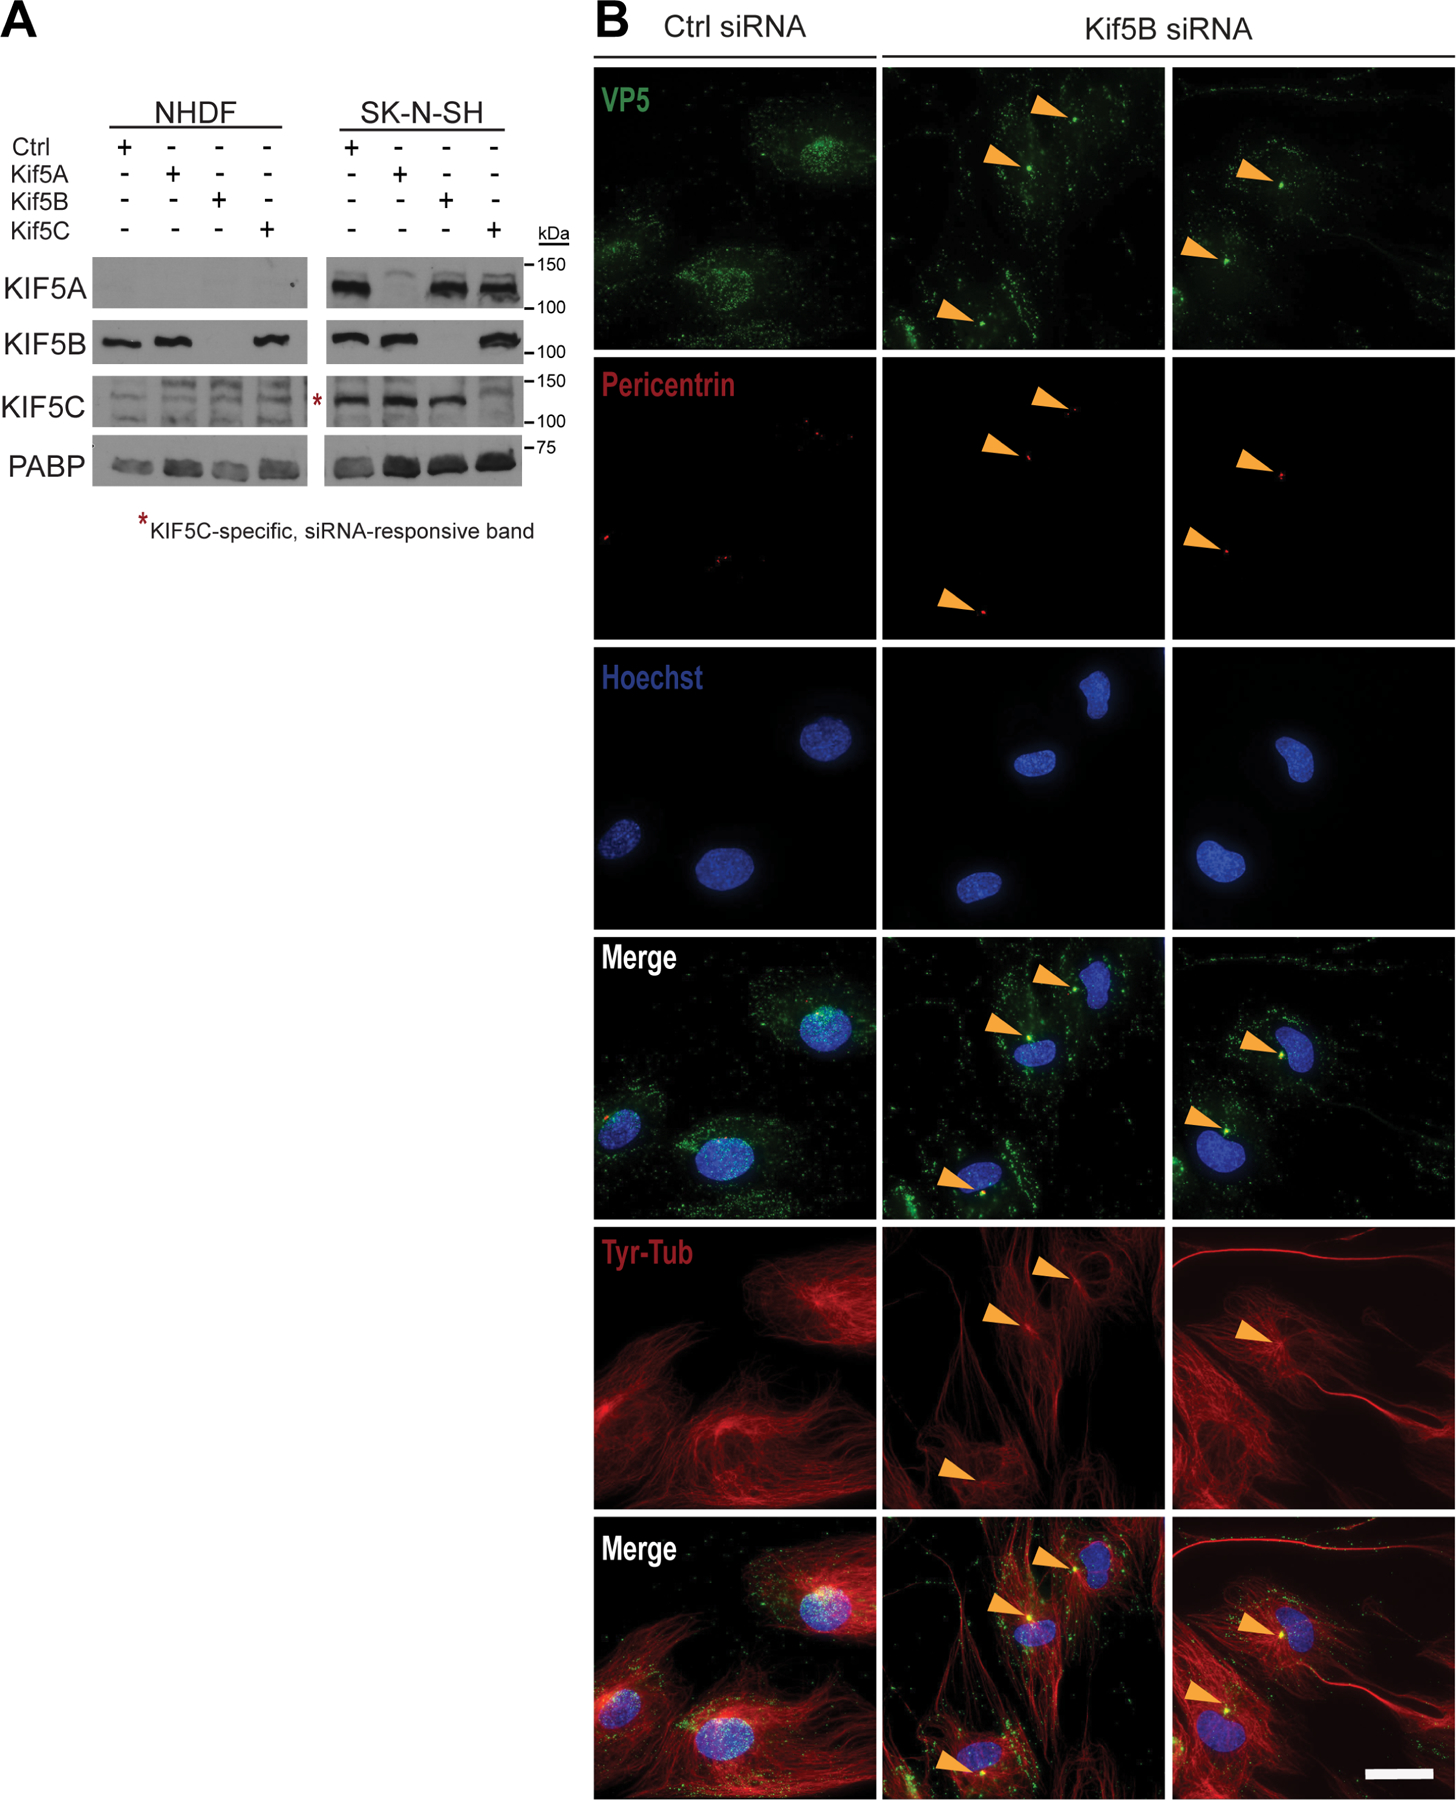
(A) Normal human dermal fibroblasts (NHDF) cells were depleted of Kif5 isoforms by siRNA knockdown. Kif5 expression profile in SK-N-SH cells as a standard that expresses all three Kif5 isoforms (n = 1 independent experiment). (B) Control and Kif5B-depleted NHDF cells were infected with HSV-1 in the presence of 100 μM cycloheximide (n = 1 independent experiment). At 8 hpi, cells were fixed and immunofluorescence was performed. Scale bar is 20 μm.
Extended Data Fig. 8. Kif5B and Kif5C function interchangeably to rescue pUL36 peripheral accumulation in RPEΔKif5B (KO) cells.
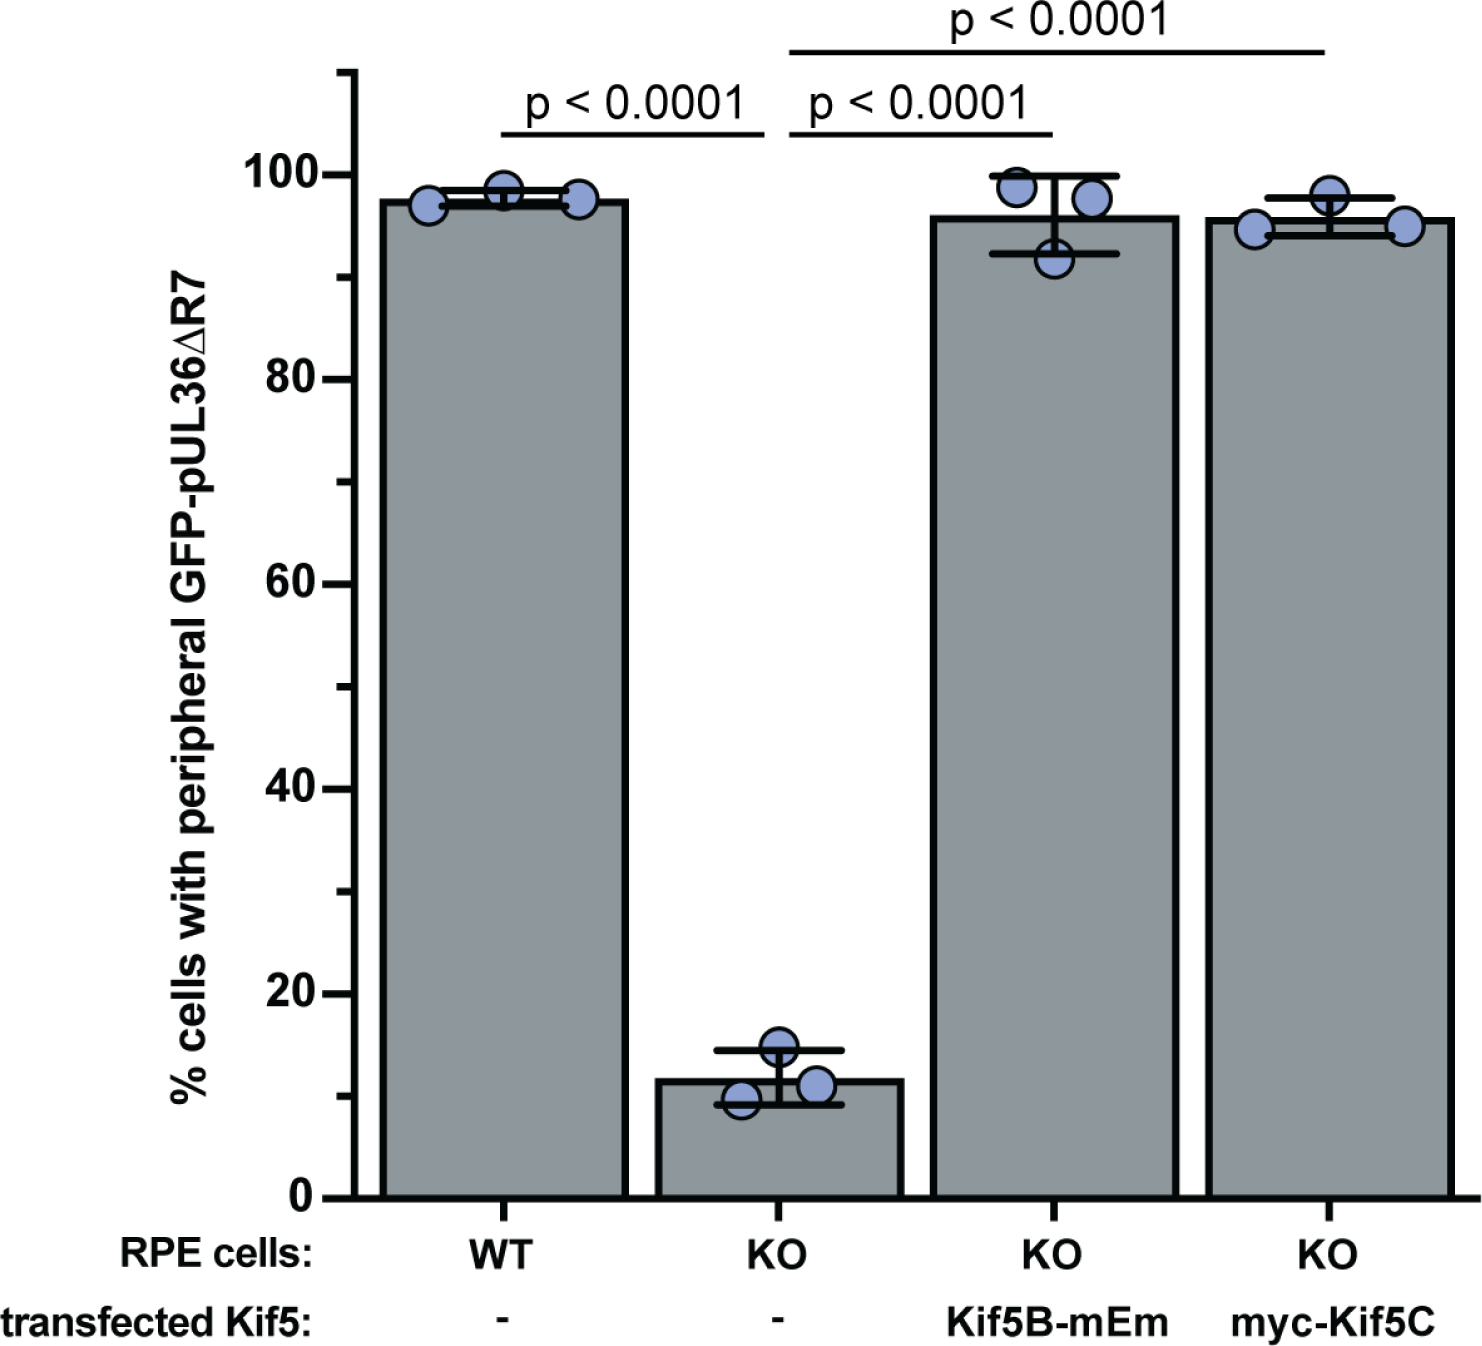
Quantitation of transiently-transfected cells displaying GFP-pUL36ΔR7 localization at the cell periphery (n = 3 independent experiments > 150 each). Scoring methodology is provided in Extended Data Fig. 4. Mean values ± SD are indicated. (P values based on two-tailed unpaired t test).
Extended Data Fig. 9. Model of viral assimilation of kinesin-1.
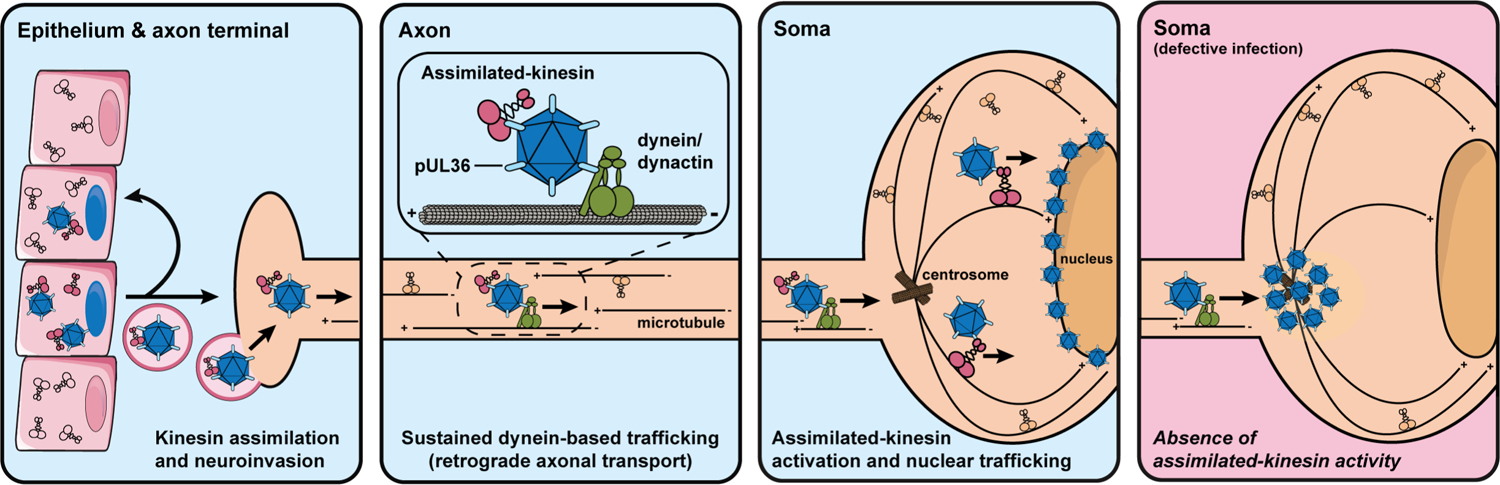
Neuroinvasive herpesviruses capture Kif5 (conventional kinesin; kinesin-1) into the tegument of newly formed virions during infection of epithelial cells. The captured epithelial kinesin-1 is carried between cells as a structural virion component and is deposited into cells (epithelia and neurons) upon the subsequent round of infection (first blue panel). Upon entry, cytosolic capsids engage in retrograde axonal transport effected by the cytoplasmic dynein/dynactin microtubule motor. The assimilated kinesin is presumably carried in an inactive state during this step of infection (second blue panel). Dynein/dynactin-based transport directs the capsid ‘minus-ended’ along microtubules ending at the centrosome, where the virus uses assimilated kinesin to transport to nuclei (third blue panel). When viruses are attenuated for assimilated-kinesin binding (e.g., PRV[RKB]) or are produced in the absence of Kif5, capsids predominately accumulate at the centrosome and do not progress toward the nucleus despite the presence of endogenous neuronal kinesin-1 (pink panel). Nevertheless, endogenous kinesin also supports nuclear trafficking of capsids.
Extended Data Table 1.
Description of recombinant viruses and mammalian expression plasmids used in this study.
| Virus | Tag | pUL36 allele | Other mutations | Reference |
| PRV-GS4284 | pUL25/mCherry | WT | Bohannon et al., 2012 | |
| PRV-GS4500 | pUL25/mCherry | ΔWD3 (DWD>AAA) | this study | |
| PRV-GS5230 | pUL25/mCherry | WD3-REP | this study | |
| PRV-GS5167 | pUL25/mCherry | ΔWD4 (DWTE>AAAA) | this study | |
| PRV-GS5325 | pUL25/mCherry | WD4-REP | this study | |
| PRV-GS5589 | pUL25/mCherry | WD4 (W>A) | this study | |
| PRV-GS5586 | pUL25/mCherry | WD4 (DE>AA) | this study | |
| PRV-GS5636 | pUL25/mCherry | ΔWD3 (DWD>AAA) + WD4 (DE>AA [RKB] | this study | |
| PRV-GS5666 | pUL25/mCherry | ΔWD3-REP + WD4 (DE>AA) [RKB-REP] | this study | |
| PRV-GS5469 | pUL25/mCherry | WT | ΔUs9 | Daniel et al., 2015 |
| PRV-GS2564 | gG::CMV>eGFP | WT | Richards et al., 2017 | |
| HSVF-GS4553 | pUL25/mCherry | WT | Huffmaster et al., 2015 | |
| HSVF-GS3217 | gJ::CMV>NLS-tdTomato>pA | WT | Stults et al., 2019 | |
| Expression plasmid | UL36 Insert | Reference | ||
| pGS1521 | GFP-(R1-R7) | Lee et al, 2006 | ||
| pGS4351 | GFP-(R1-R7) | Zaichick et al., 2013 | ||
| pGS3384 | GFP-(R1-R6) | Zaichick et al., 2013 | ||
| pGS3364 | GFP-(R2-R6) | Zaichick et al., 2013 | ||
| pGS3226 | GFP-(R1-R6) ΔR2 | Zaichick et al, 2013 | ||
| pGS3227 | GFP-(R1-R6) ΔR3 | Zaichick et al, 2013 | ||
| pGS3241 | GFP-(R1-R6) ΔR4 | Zaichick et al, 2013 | ||
| pGS3242 | GFP-(R1-R6) ΔR5 | Zaichick et al., 2013 | ||
| pGS3229 | GFP-(R1-R6) ΔR6S | Zaichick et al, 2013 | ||
| pGS3157 | GFP-(R1-R6)NLS | Zaichick et al., 2013 | ||
| pGS3322 | GFP-(R1-R6)NLSΔR6S | Zaichick et al, 2013 | ||
| pGS3337 | (R5-R7)-GFP | Zaichick et al, 2013 | ||
| pGS3476 | (R5-R7) ΔR6S-GFP | Zaichick et al, 2013 | ||
| pGS1952 | (R6-R7)-GFP | Leelawong et al, 2012 | ||
| pGS3787 | GFP-(R5-R7) | this study | ||
| pGS3788 | GFP-(R5-R6) | this study | ||
| pGS3617 | GFP-(R1-R6)WD1+2 | this study | ||
| pGS4129 | GFP-(R1-R6)WD3 | this study | ||
| pGS4226 | GFP-(R1-R6)WD3-REP | this study | ||
| pGS5136 | GFP-(R1-R6)WD4 | this study | ||
| pGS5416 | GFP-(R1-R6)WD4-REP | this study | ||
| pGS5599 | GFP-(R1-R6)WD4(W>A) | this study | ||
| pGS5598 | GFP-(R1-R6)WD4(DE>AA) | this study | ||
| pGS5669 | GFP-(R1 -R6)WD3+WD4(DE>AA) | this study | ||
| pGS5852 | GFP-(R1-R6)WD3-REP+WD4(DE>AA) | this study | ||
Supplementary Material
Acknowledgements
We thank Vladimir Gelfand and Kristin Verhey for suggestions that helped inform the experimental design. We also thank them along with Amelie Roberts, Martin Englke, Michael Way, Scott Brady, and Gregg Gunderson for reagents that made this work possible. David Kirchenbuechler of the Northwestern University Cell Imaging Facility, supported by NCI CCSG P30 CA060553, provided invaluable support in the development of the automated image analysis pipeline used in this report. Some confocal imaging was performed on an Andor XDI Revolution microscope purchased through the support of NCRR 1S10 RR031680–01 at the Northwestern University Cell Imaging Facility. Sequencing services were performed at the Northwestern University Genomics Core Facility. In vitro microtubule-dependent motility assays and analyses were performed in the Analytical Imaging Facility of the Albert Einstein College of Medicine, with support from National Cancer Institute cancer center grant P30CA013330. This work was funded by NIH AI056346 (G.A.S., P.J.S, and G.E.P.), AI125244 (D.W.W.), AI141470 (D.W.), and AI148780 (J.N.S.). E.B.W. was supported by NIH NS106812. C.E.P. received support from National Science Foundation DGE-1324585 and NIH Cellular and Molecular Basis of Disease Training Grant T32GM08061.
Footnotes
Competing interests: Patricia J. Sollars, Gary E. Pickard, and Gregory A. Smith have disclosed a significant financial interest Thyreos, Inc. In accordance with their Conflict of Interest policies, the University of Nebraska-Lincoln and Northwestern University Feinberg School of Medicine Conflict of Interest Review Committees have determined that this must be disclosed.
Data availability statement:
Unfiltered mass spec data, raw microscopy images, and plasmid and virus construction details (including primer sequences) are available from the corresponding author upon request. All remaining data are within the paper and its supporting files.
References
- 1.Smith G Herpesvirus Transport to the Nervous System and Back Again. Annu Rev Microbiol 66, 153–176 (2012). [DOI] [PMC free article] [PubMed] [Google Scholar]
- 2.Lafaille FG et al. Deciphering Human Cell-Autonomous Anti-HSV-1 Immunity in the Central Nervous System. Front Immunol 6, 208 (2015). [DOI] [PMC free article] [PubMed] [Google Scholar]
- 3.Zaichick SV et al. The herpesvirus VP1/2 protein is an effector of dynein-mediated capsid transport and neuroinvasion. Cell Host Microbe 13, 193–203 (2013). [DOI] [PMC free article] [PubMed] [Google Scholar]
- 4.Smith GA, Pomeranz L, Gross SP & Enquist LW Local modulation of plus-end transport targets herpesvirus entry and egress in sensory axons. Proc Natl Acad Sci U S A 101, 16034–16039 (2004). [DOI] [PMC free article] [PubMed] [Google Scholar]
- 5.Antinone SE & Smith GA Retrograde axon transport of herpes simplex virus and pseudorabies virus: a live-cell comparative analysis. J Virol 84, 1504–1512 (2010). [DOI] [PMC free article] [PubMed] [Google Scholar]
- 6.Pernigo S, Lamprecht A, Steiner RA & Dodding MP Structural basis for kinesin-1:cargo recognition. Science 340, 356–359 (2013). [DOI] [PMC free article] [PubMed] [Google Scholar]
- 7.Robert A et al. Kinesin-dependent transport of keratin filaments: a unified mechanism for intermediate filament transport. FASEB J, fj201800604R (2018). [DOI] [PMC free article] [PubMed] [Google Scholar]
- 8.Bish SE, Song W & Stein DC Quantification of bacterial internalization by host cells using a beta-lactamase reporter strain: Neisseria gonorrhoeae invasion into cervical epithelial cells requires bacterial viability. Microbes Infect 10, 1182–1191 (2008). [DOI] [PMC free article] [PubMed] [Google Scholar]
- 9.Heine JW, Honess RW, Cassai E & Roizman B Proteins specified by herpes simplex virus. XII. The virion polypeptides of type 1 strains. J Virol 14, 640–651 (1974). [DOI] [PMC free article] [PubMed] [Google Scholar]
- 10.Cavrois M, De Noronha C & Greene WC A sensitive and specific enzyme-based assay detecting HIV-1 virion fusion in primary T lymphocytes. Nat Biotechnol 20, 1151–1154 (2002). [DOI] [PubMed] [Google Scholar]
- 11.Lyman MG, Feierbach B, Curanovic D, Bisher M & Enquist LW PRV Us9 Directs Axonal Sorting of Viral Capsids. J Virol (2007). [DOI] [PMC free article] [PubMed] [Google Scholar]
- 12.Scherer J et al. A Kinesin-3 recruitment complex facilitates axonal sorting of enveloped alpha herpesvirus capsids. PLoS Pathog 16, e1007985 (2020). [DOI] [PMC free article] [PubMed] [Google Scholar]
- 13.Diwaker D, Murray JW, Barnes J, Wolkoff AW & Wilson DW Deletion of the Pseudorabies Virus gE/gI-US9p complex disrupts kinesin KIF1A and KIF5C recruitment during egress, and alters the properties of microtubule-dependent transport in vitro. PLoS Pathog 16, e1008597 (2020). [DOI] [PMC free article] [PubMed] [Google Scholar]
- 14.DuRaine G, Wisner TW, Howard P, Williams M & Johnson DC Herpes Simplex Virus gE/gI and US9 Promote both Envelopment and Sorting of Virus Particles in the Cytoplasm of Neurons, Two Processes That Precede Anterograde Transport in Axons. J Virol 91 (2017). [DOI] [PMC free article] [PubMed] [Google Scholar]
- 15.Engelke MF et al. Engineered kinesin motor proteins amenable to small-molecule inhibition. Nat Commun 7, 11159 (2016). [DOI] [PMC free article] [PubMed] [Google Scholar]
- 16.Schipke J et al. The C terminus of the large tegument protein pUL36 contains multiple capsid binding sites that function differently during assembly and cell entry of herpes simplex virus. J Virol 86, 3682–3700, doi: 10.1128/JVI.06432-11 (2012). [DOI] [PMC free article] [PubMed] [Google Scholar]
- 17.Dohner K et al. Function of Dynein and dynactin in herpes simplex virus capsid transport. Mol Biol Cell 13, 2795–2809 (2002). [DOI] [PMC free article] [PubMed] [Google Scholar]
- 18.DuRaine G, Wisner TW, Howard P & Johnson DC Kinesin-1 proteins KIF5A, 5B and 5C promote anterograde transport of herpes simplex virus enveloped virions in axons. J Virol (2018). [DOI] [PMC free article] [PubMed] [Google Scholar]
- 19.Radtke K et al. Plus- and minus-end directed microtubule motors bind simultaneously to herpes simplex virus capsids using different inner tegument structures. PLoS Pathog 6, e1000991 (2010). [DOI] [PMC free article] [PubMed] [Google Scholar]
- 20.Diefenbach RJ et al. The Basic Domain of Herpes Simplex Virus 1 pUS9 Recruits Kinesin-1 To Facilitate Egress from Neurons. J Virol 90, 2102–2111 (2016). [DOI] [PMC free article] [PubMed] [Google Scholar]
- 21.Loret S, Guay G & Lippe R Comprehensive characterization of extracellular herpes simplex virus type 1 virions. J Virol 82, 8605–8618 (2008). [DOI] [PMC free article] [PubMed] [Google Scholar]
- 22.Kramer T, Greco TM, Enquist LW & Cristea IM Proteomic characterization of pseudorabies virus extracellular virions. J Virol 85, 6427–6441 (2011). [DOI] [PMC free article] [PubMed] [Google Scholar]
- 23.Miranda-Saksena M et al. Herpes simplex virus utilizes the large secretory vesicle pathway for anterograde transport of tegument and envelope proteins and for viral exocytosis from growth cones of human fetal axons. J Virol 83, 3187–3199 (2009). [DOI] [PMC free article] [PubMed] [Google Scholar]
Additional references
- 24.Smith CL (eds Banker G & Goslin K) Ch. 261–287, (MIT Press, 1998). [Google Scholar]
- 25.Smith GA, Gross SP & Enquist LW Herpesviruses use bidirectional fast-axonal transport to spread in sensory neurons. Proc Natl Acad Sci U S A 98, 3466–3470 (2001). [DOI] [PMC free article] [PubMed] [Google Scholar]
- 26.Tanaka M, Kagawa H, Yamanashi Y, Sata T & Kawaguchi Y Construction of an excisable bacterial artificial chromosome containing a full-length infectious clone of herpes simplex virus type 1: viruses reconstituted from the clone exhibit wild-type properties in vitro and in vivo. J Virol 77, 1382–1391 (2003). [DOI] [PMC free article] [PubMed] [Google Scholar]
- 27.Smith GA & Enquist LW Construction and transposon mutagenesis in Escherichia coli of a full-length infectious clone of pseudorabies virus, an alphaherpesvirus. J Virol 73, 6405–6414 (1999). [DOI] [PMC free article] [PubMed] [Google Scholar]
- 28.Kaufman HE, Ellison ED & Waltman SR Double-stranded RNA, an interferon inducer, in herpes simplex keratitis. Am J Ophthalmol 68, 486–491, doi: 10.1016/0002-9394(69)90720-x (1969). [DOI] [PubMed] [Google Scholar]
- 29.Bohannon KP, Sollars PJ, Pickard GE & Smith GA Fusion of a fluorescent protein to the pUL25 minor capsid protein of pseudorabies virus allows live-cell capsid imaging with negligible impact on infection. J Gen Virol 93, 124–129 (2012). [DOI] [PMC free article] [PubMed] [Google Scholar]
- 30.Huffmaster NJ, Sollars PJ, Richards AL, Pickard GE & Smith GA Dynamic ubiquitination drives herpesvirus neuroinvasion. Proc Natl Acad Sci U S A 112, 12818–12823 (2015). [DOI] [PMC free article] [PubMed] [Google Scholar]
- 31.Richards AL et al. The pUL37 tegument protein guides alpha-herpesvirus retrograde axonal transport to promote neuroinvasion. PLoS Pathog 13, e1006741 (2017). [DOI] [PMC free article] [PubMed] [Google Scholar]
- 32.Stults AM & Smith GA The Herpes Simplex Virus 1 Deamidase Enhances Propagation but Is Dispensable for Retrograde Axonal Transport into the Nervous System. J Virol 93, e01172–01119 (2019). [DOI] [PMC free article] [PubMed] [Google Scholar]
- 33.Tischer BK, Smith GA & Osterrieder N En passant mutagenesis: a two step markerless red recombination system. Methods Mol Biol 634, 421–430 (2010). [DOI] [PubMed] [Google Scholar]
- 34.Szpara ML et al. A wide extent of inter-strain diversity in virulent and vaccine strains of alphaherpesviruses. PLoS Pathog 7, e1002282 (2011). [DOI] [PMC free article] [PubMed] [Google Scholar]
- 35.Abramoff MD, Magelhaes PJ & Ram SJ Image Processing with ImageJ. Biophotonics International 11, 36–42 (2004). [Google Scholar]
- 36.Luxton GW et al. Targeting of herpesvirus capsid transport in axons is coupled to association with specific sets of tegument proteins. Proc Natl Acad Sci U S A 102, 5832–5837 (2005). [DOI] [PMC free article] [PubMed] [Google Scholar]
- 37.Leelawong M, Lee JI & Smith GA Nuclear egress of pseudorabies virus capsids is enhanced by a subspecies of the large tegument protein that is lost upon cytoplasmic maturation. J Virol 86, 6303–6314 (2012). [DOI] [PMC free article] [PubMed] [Google Scholar]
- 38.Lee JI, Luxton GW & Smith GA Identification of an essential domain in the herpesvirus VP1/2 tegument protein: the carboxy terminus directs incorporation into capsid assemblons. J Virol 80, 12086–12094 (2006). [DOI] [PMC free article] [PubMed] [Google Scholar]
- 39.Dodding MP, Mitter R, Humphries AC & Way M A kinesin-1 binding motif in vaccinia virus that is widespread throughout the human genome. EMBO J 30, 4523–4538 (2011). [DOI] [PMC free article] [PubMed] [Google Scholar]
- 40.Tombacz D, Toth JS, Petrovszki P & Boldogkoi Z Whole-genome analysis of pseudorabies virus gene expression by real-time quantitative RT-PCR assay. BMC genomics 10, 491 (2009). [DOI] [PMC free article] [PubMed] [Google Scholar]
- 41.Lee GE, Murray JW, Wolkoff AW & Wilson DW Reconstitution of herpes simplex virus microtubule-dependent trafficking in vitro. J Virol 80, 4264–4275 (2006). [DOI] [PMC free article] [PubMed] [Google Scholar]
- 42.Kharkwal H, Smith CG & Wilson DW Blocking ESCRT-mediated envelopment inhibits microtubule-dependent trafficking of alphaherpesviruses in vitro. J Virol 88, 14467–14478 (2014). [DOI] [PMC free article] [PubMed] [Google Scholar]
- 43.Howard J & Hyman AA Preparation of marked microtubules for the assay of the polarity of microtubule-based motors by fluorescence microscopy. Methods in cell biology 39, 105–113 (1993). [DOI] [PubMed] [Google Scholar]
- 44.Shanda SK & Wilson DW UL36p is required for efficient transport of membrane-associated herpes simplex virus type 1 along microtubules. J Virol 82, 7388–7394 (2008). [DOI] [PMC free article] [PubMed] [Google Scholar]
- 45.Homa FL et al. Structure of the pseudorabies virus capsid: comparison with herpes simplex virus type 1 and differential binding of essential minor proteins. J Mol Biol 425, 3415–3428 (2013). [DOI] [PMC free article] [PubMed] [Google Scholar]
- 46.Huet A et al. Extensive subunit contacts underpin herpesvirus capsid stability and interior-to-exterior allostery. Nat Struct Mol Biol 23, 531–539, doi: 10.1038/nsmb.3212 (2016). [DOI] [PMC free article] [PubMed] [Google Scholar]
- 47.Eng JK, McCormack AL & Yates JR An approach to correlate tandem mass spectral data of peptides with amino acid sequences in a protein database. J Am Soc Mass Spectrom 5, 976–989, doi: 10.1016/1044-0305(94)80016-2 (1994). [DOI] [PubMed] [Google Scholar]
- 48.Xu T et al. ProLuCID: An improved SEQUEST-like algorithm with enhanced sensitivity and specificity. J Proteomics 129, 16–24, doi: 10.1016/j.jprot.2015.07.001 (2015). [DOI] [PMC free article] [PubMed] [Google Scholar]
- 49.Cociorva D, D LT & Yates JR Validation of tandem mass spectrometry database search results using DTASelect. Curr Protoc Bioinformatics Chapter 13, Unit 13 14, doi: 10.1002/0471250953.bi1304s16 (2007). [DOI] [PubMed] [Google Scholar]
- 50.Tabb DL, McDonald WH & Yates JR 3rd. DTASelect and Contrast: tools for assembling and comparing protein identifications from shotgun proteomics. J Proteome Res 1, 21–26, doi: 10.1021/pr015504q (2002). [DOI] [PMC free article] [PubMed] [Google Scholar]
- 51.UniProt C UniProt: a hub for protein information. Nucleic Acids Res 43, D204–212, doi: 10.1093/nar/gku989 (2015). [DOI] [PMC free article] [PubMed] [Google Scholar]
- 52.Elias JE & Gygi SP Target-decoy search strategy for increased confidence in large-scale protein identifications by mass spectrometry. Nat Methods 4, 207–214, doi: 10.1038/nmeth1019 (2007). [DOI] [PubMed] [Google Scholar]
Associated Data
This section collects any data citations, data availability statements, or supplementary materials included in this article.
Supplementary Materials
Data Availability Statement
Unfiltered mass spec data, raw microscopy images, and plasmid and virus construction details (including primer sequences) are available from the corresponding author upon request. All remaining data are within the paper and its supporting files.