Abstract
Dental landmark localization is a fundamental step to analyzing dental models in the planning of orthodontic or orthognathic surgery. However, current clinical practices require clinicians to manually digitize more than 60 landmarks on 3D dental models. Automatic methods to detect landmarks can release clinicians from the tedious labor of manual annotation and improve localization accuracy. Most existing landmark detection methods fail to capture local geometric contexts, causing large errors and misdetections. We propose an end-to-end learning framework to automatically localize 68 landmarks on high-resolution dental surfaces. Our network hierarchically extracts multi-scale local contextual features along two paths: a landmark localization path and a landmark area-of-interest segmentation path. Higher-level features are learned by combining local-to-global features from the two paths by feature fusion to predict the landmark heatmap and the landmark area segmentation map. An attention mechanism is then applied to the two maps to refine the landmark position. We evaluated our framework on a real-patient dataset consisting of 77 high-resolution dental surfaces. Our approach achieves an average localization error of 0.42 mm, significantly outperforming related start-of-the-art methods.
Keywords: 3D dental surface, Landmark localization, Geometric deep learning
1. Introduction
Digitalization (a.k.a. Localization) of dental landmarks is a necessary step in dental model analysis during treatment planning for patients with jaw and teeth deformities. In the modern era of digital dentistry, high-resolution digital dental surface mesh models are either generated by a three-dimensional (3D) intraoral surface scanner or constructed from cone-beam computed tomography (CBCT) images. In the current standard of care, over 60 commonly used dental landmarks are digitized manually for each patient by orthodontists, surgeons, or trained technicians, which is time-consuming and labor-intense.
Automatic localization of dental landmarks on a 3D surface mesh model is challenging. A high degree of accuracy (less than 0.5 mm error) is required. The shapes of dental landmark areas (cusps and fossa) vary dramatically across patients due to normal wear or tooth restoration. Processing these high-resolution models is computationally intensive since they usually contain more than 100,000 mesh cells. Over the years, deep neural networks have been shown to be effective in the localization of anatomical landmarks [7, 11, 13, 14]. However, these networks are developed mainly for medical images and can not be directly used on 3D mesh models. A potential solution, as described in [4, 6], is to map the 3D mesh to a 2D planar flat-torus, which is then fed to a fully convolutional network [5] to annotate the landmarks. This approach is susceptible to transformation artifacts and information loss. More recently, PointNet++ [9] was proposed to learn group-wise geometric features by applying PointNet [8] hierarchically on grouped points. PointConv [12] learns translation-invariant and permutation-invariant convolution kernels via multi-layer perceptrons (MLP). Lian et al. [3] introduced MeshSegNet to hierarchically extract multi-scale local contextual features with dynamic graph-constrained learning modules by using multiple features extracted from each cell.
Although yielding promising results in classification and segmentation tasks, the methods described above suffer from several limitations when applied to detecting dental landmarks. First, they are agnostic to curvature features and are not necessarily catered to learning edge features inside the landmark areas. Second, the high-resolution model is usually significantly down-sampled to meet GPU limitations. Essential structural information is hence lost and localization accuracy might not be able to meet the clinical requirements.
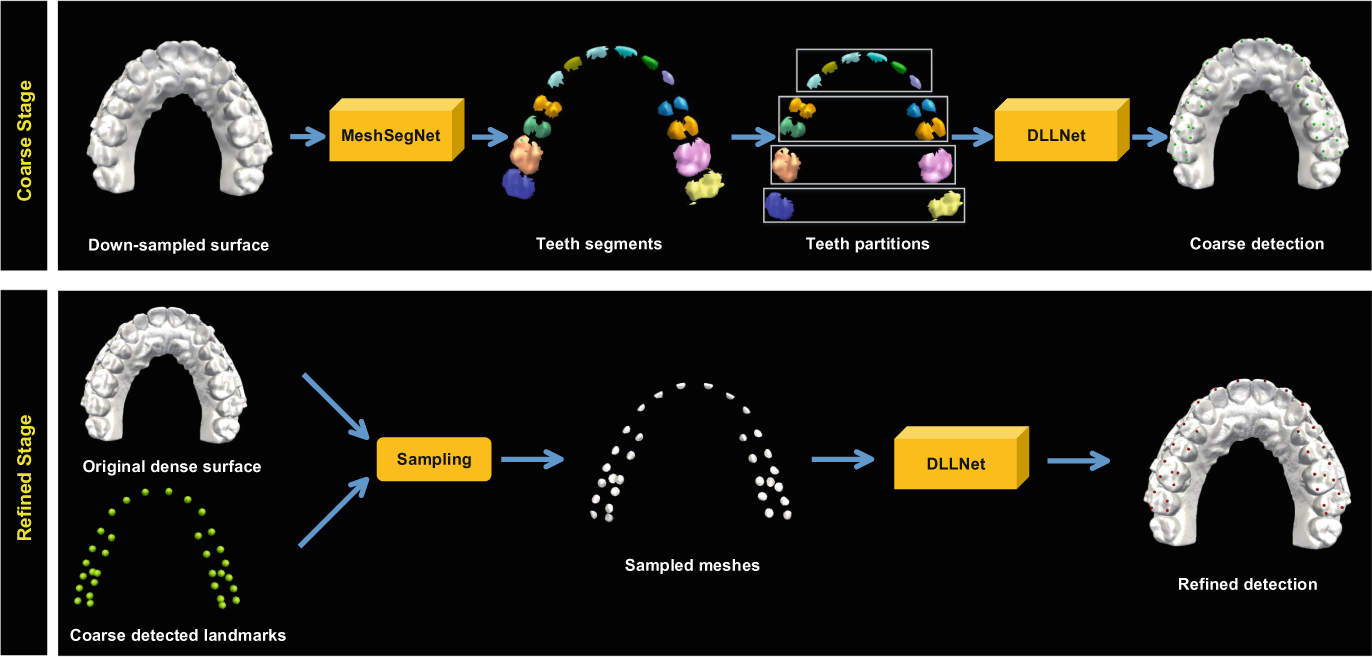
In this paper, we propose an end-to-end deep learning method, DLLNet, to automatically localize 68 commonly used dental landmarks on 3D high-resolution dental models. All landmarks are detected with a coarse-to-fine two-stage strategy (Fig. 1). In the first stage, a segmentation network [3] is applied on a down-sampled mesh model for tooth segmentation. The teeth are grouped into four partitions. The proposed network takes each partition as input, and outputs a coarse localization result of each landmark. In the second stage, DLLNet is applied to mesh patches sampled in the vicinity of the coarse localization results to refine landmark locations.
Fig. 1.

Coarse-to-fine framework for dental landmark localization on a 3D surface.
The main technical contribution of our paper is three-fold. First, DLLNet hierarchically extracts multi-scale local contextual features along two collaborative task-driven paths (i.e., landmark localization and landmark area segmentation). It captures the global context of each tooth and the local contexts of landmark areas. Second, in addition to features described in [3] (i.e., vertex coordinates, cell normal vectors, and cell centroids), curvature features are included for more comprehensive structural description of landmark areas. Third, an attention mechanism is applied to improve detection accuracy and to reduce misdetections.
2. Methods
As shown in Fig. 2, DLLNet extracts multi-scale local context features along two task-driven paths. The extracted global-to-local features are concatenated to output heatmaps and segmentation probability maps. Additionally, an attention mechanism is adopted for the two outputs, yielding refined heatmaps for landmark localization.
Fig. 2.

The architecture of DLLNet and the details of the modules.
2.1. High-Level Feature Extraction
DLLNet takes a matrix F0 ∈ RN × 24 as input. N is the number of cells in the down-sampled mesh models. Each cell is described by a 24-dimensional feature vector. Following [3], the first 15 elements of the feature vector include the coordinates of the three vertices (9 elements), normal vectors (3 elements) and cell centroid (3 elements). Since dental landmarks are located on the tips or valleys of the tooth surface with typically large curvatures (e.g., cusp landmarks or fossa landmarks), Gaussian curvatures (3 elements), maximum curvatures (3 elements) and minimum curvatures (3 elements) are included to capture edge information.
Given an input feature matrix F0, the first MLP block consisting of two successive MLP layers is applied to extract high-level geometric features. A feature-transformer module (FTM) [8] follows by aligning the input to a canonical space to learn transformation-invariant features F1 ∈ RN × 64. After FTM, F1 is fed to two first-level graph-constrained learning modules (GLMs) [3], i.e., GLM_S1 and GLM_L1 in the segmentation path and the localization path, respectively. Specifically, the segmentation path detects areas where landmarks may exist (landmark RoI). With the same modules but different receptive fields, the localization path detects landmarks from these areas. In each path, symmetric average pooling (SAP) operates on the input feature matrix F and an N × N adjacent matrix A to generate a local contextual feature matrix , which is calculated by
| (1) |
where is the diagonal degree matrix. Adjacent matrix A controls the receptive field in a sphere with the geodesic radius r. We empirically set and to construct and since localizing landmark requires a larger receptive field. The output of the first-level GLM is calculated by
| (2) |
where σ(·) is the MLP layer and ⊕ is a concatenation operator. The outputs of GLM_S1 and GLM_L1, i.e., and , are concatenated across channels and are then consumed by the second MLP block to generate a feature matrix F2 ∈ RN × 512.
The second-level GLMs (GLM_S2 and GLM_L2) adopt an addition SAP operation on with F2 to output multi-scale contextual features and . Specifically, and are constructed by setting and to enlarge the receptive fields. and are then concatenated and squeezed by a MLP layer to output F3. Global max pooling (GMP) is then applied to embed global structural features into a feature vector F4.
2.2. Feature Fusion and Attention Heatmap
A fusion strategy is employed to concatenate the local-to-global contextual features (F1, F2, F3 and F4). Followed by the third MLP block, F5 ∈ RN × 128 is obtained as the feature matrix that is shared by two tasks: 1) landmark regression, where a MLP layer is used to predict a Gaussian heatmap matrix H with size N × C; and 2) landmark area segmentation, where another MLP layer with softmax activation is used to predict a probability map S with size N ×(C + 1). C is the number of landmarks.
The result of landmark localization is sensitive to the accuracy of H on the foreground mesh cells (mesh cells that are close to the target landmark). Misdetection even happens when background mesh cells are assigned with a high probability due to feature similarity. To eliminate these effects, we use S as an attention map on H to generate an attention heatmap :
| (3) |
where consists of the last C columns of S. ⊙ is the Hadamard-product. Learning forces the network to focus on the regression on landmark areas. This procedure also constrains the training of S and H by each other. Finally, the landmark localization results are determined by as the coordinates of the mesh cell with the largest probability value. Additionally, computing can be regarded as local coarse-to-fine processing since S can be viewed as a coarse landmark detection result. The total training loss of our network is
| (4) |
where λh, λs and λa are training weights. H*, S* and are the corresponding ground truths. We employ Adaptive Wing Loss [10] for LH, MSE loss for LA, and generalized Dice loss [1] for LS.
2.3. Implementation and Inference
In the first stage, we use tooth surfaces as the ground truth to train the segmentation network, i.e., MeshSegNet, following the parameter setting in [3]. Each tooth surface is formed by combining all corresponding landmark areas cropped within a non-overlapping geodesic ball (r = 1.5 mm). The segmented teeth are grouped into four partitions: anterior teeth (incisors + canines), premolars, first molars and second molars. Before training the DLLNet, we crop teeth partitions that have the same topology as the corresponding segmentation results from the original data, then down-sampled them to 3,000 mesh cells.
DLLNet is trained by ADAM optimizer with an initial rate of 0.01 for 30 epochs (2000 iterations/epoch) in total. The batch size is set to 20. H* is created with a Gaussian distribution with variance of 1 mm on each landmark. The geodesic radius of landmark areas for S* is set to 0.8 mm. is generated by performing Hadamard-product on H* with S* (last C columns). In the second stage, 150 mesh cells around each predicted landmark (≤0.5 mm) are sampled to train another DLLNet to refine the results. We empirically set λh = 0.5, λs = 0.5, and λa = 1.
In the inference phase, all landmarks are localized by directly using the coarse-to-fine strategy with the trained networks. In the second stage, only 150 mesh cells centered at the estimated landmark location are sampled. Our approach takes about 1 min to process a dental model (maxilla or mandible) using an Intel Core i7-8700K CPU with a 12 GB GeForce GTX 1080Ti GPU. All the procedures are implemented by Python based on Keras.
3. Experiments
3.1. Data
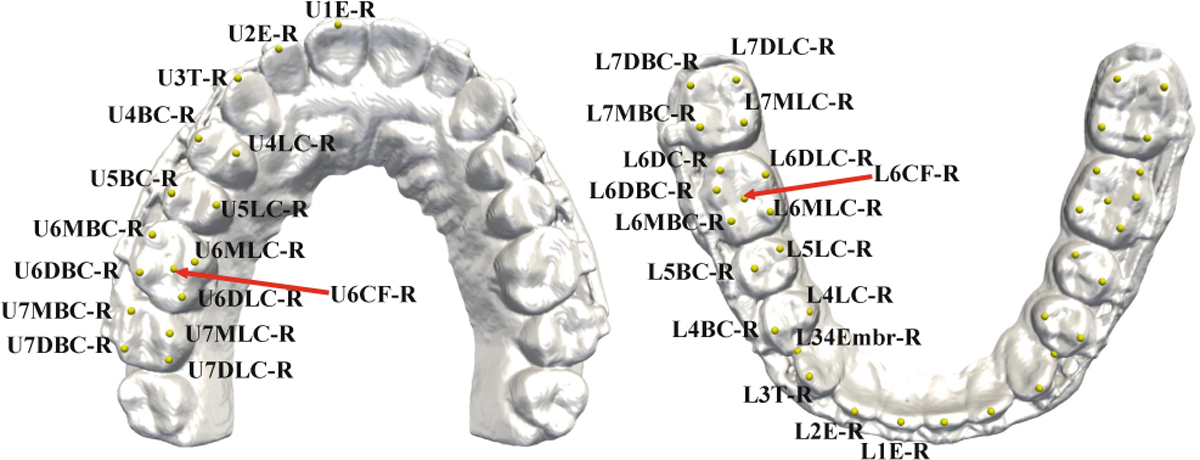
Our approach was evaluated quantitatively using 77 sets of high-resolution digital dental models randomly selected from our clinical digital archive, in which 15 sets were partially edentulous (missing tooth/teeth). All personal information were deidentified prior to the study. For each set of the dental models, 32 maxillary and 36 mandibular dental landmarks were digitized by experienced oral surgeons (Fig. 3). Each dental surface has roughly 100,000 ~ 300,000 mesh cells, with a resolution of 0.2 ~ 0.4 mm (the average length of cell edges). Using 5-fold cross-validation, we randomly selected 57 sets for training, 10 sets for validation and the rest for testing. Prior to training, data augmentation (30 times) was performed by random rotation (), translation ([−20, 20]) and re-scaling ([0.8, 1.2]) along the three orthogonal direction. The input feature matrix was normalized by Gaussian normalization constant (GNC).
Fig. 3.

Names of landmarks annotated on the maxillary (left) and mandibular (right) dental models.
3.2. Comparison Methods
DLLNet was compared with PointNet++ [9], PointConv [12] and the state-of-the-art MeshSegNet [3] with the same network architectures that were described in the original papers. To evaluate the effectiveness of the curvature features, two-task driven paths, and the attention mechanism, which are the main differences between our DLLNet and MeshSegNet, we performed an ablation study by comparing DLLNet with three variants: 1) DLL-SA with input features identical to MeshSegNet; 2) DLL-C with GLM_S1, GLM_S2 and output S removed and thus only focuses on heatmap regression; and 3) DLL-CS with the attention module removed. The results of landmark localization were quantitatively evaluated with root mean squared error (RMSE). Finally, the misdetection rate (MDR) was calculated. All compared methods were trained using the same coarse-to-fine strategy, augmented dataset, and training loss for heatmap regression and landmark area segmentation.
3.3. Results
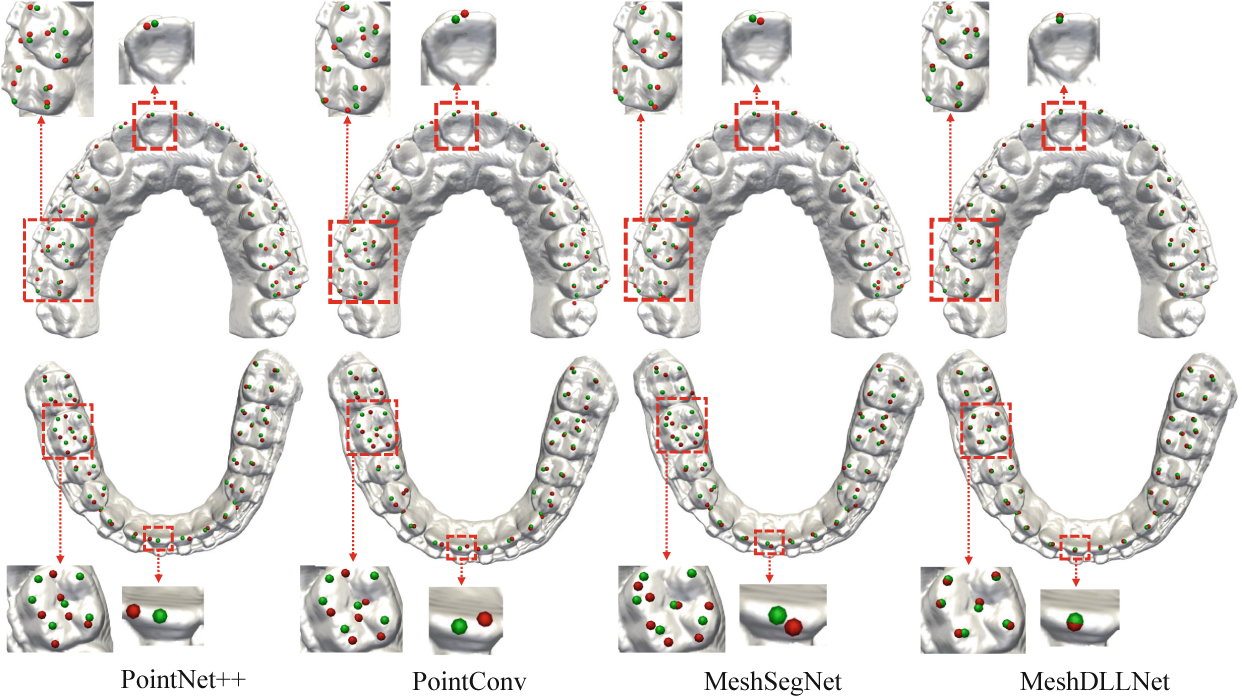
Table 1 summarizes the landmark localization results in RMSE based on anatomical regions, including anterior teeth (AT), central and lateral incisors, canines, premolars (PM), first molars (FM), and second molars (SM). The central dental midline points of maxillary and mandibular dental arches are extremely important during planning and treatment, as they are derived from the right and left of the central incisors as the midpoint [2]. Therefore, we single out the accuracy evaluation of the four central incisor (CI) landmarks from the anterior teeth and present them separately in the fifth column. The results show that DLLNet achieves the highest accuracy among the four methods. MeshSegNet outperforms Point++ and PointConv in all 4 dental regions, indicating that using GLM and the combined features is effective in capturing the local-to-global contextual features. However, the errors are still considerably large in all regions because consideration of structural information captured in landmark areas is inadequate. Furthermore, all three competing methods have a large MDR due to surface similarity, hindering them from being used in real clinical applications. Finally, the accuracy in molar regions are slightly lower than the others due to normal wear of the molars. Nonetheless, the accuracy achieved by DLLNet is still within the clinical standard of 0.5 mm. Figure 4 shows the qualitative results of a set of randomly selected dental models, clearly demonstrating that our approach yields in overall better performance than the completing methods. Notably, the localization accuracy on the central and lateral incisors has been significantly improved.
Table 1.
RMSE (mean ± SD, unit: mm) of landmark localization.
| Method | AT | PM | FM | SM | CI | MDR |
|---|---|---|---|---|---|---|
| Point++ | 0.71 ± 0.49 | 1.02 ± 0.58 | 1.40 ± 0.53 | 1.44 ± 0.64 | 0.95 ± 0.61 | 17% |
| PointConv | 0.66 ± 0.41 | 1.40 ± 0.54 | 1.39 ± 0.48 | 1.41 ± 0.58 | 0.82 ± 0.52 | 15% |
| MeshSegNet | 0.64 ± 0.49 | 0.52 ± 0.41 | 0.59 ± 0.47 | 0.78 ± 0.43 | 0.78 ± 0.43 | 10% |
| DLL-SA | 0.48 ± 0.27 | 0.51 ± 0.42 | 0.57 ± 0.48 | 0.69 ± 0.58 | 0.49 ± 0.38 | 3% |
| DLL-C | 0.49 ± 0.29 | 0.48 ± 0.34 | 0.56 ± 0.41 | 0.60 ± 0.42 | 0.48 ± 0.34 | 10% |
| DLL-CS | 0.40 ± 0.21 | 0.45 ± 0.32 | 0.51 ± 0.36 | 0.58 ± 0.39 | 0.42 ± 0.29 | 8% |
| DLLNet | 0.30 ± 0.11 | 0.39 ± 0.26 | 0.47 ± 0.28 | 0.49 ± 0.37 | 0.28 ± 0.15 | 0% |
Fig. 4.

Results of maxillary and mandibular landmark localization of a set of randomly selected dental models using the four methods (Red: Algorithm-localized landmarks; Green: Ground truth).
The ablation results compared with the three variants are summarized in Table 1. DLL-C outperforms MeshSegNet and other methods partly due to the curvature features, which are added into the input matrix by considering that landmarks are located on cusps or fossa. However, DLL-C still yields a large MDR (10%). DLL-CS further improves the accuracy by collaboratively performing multi-scale landmark detection via the landmark area segmentation path. The overall performance of DLL-SA is slightly worse than the other two variants because curvature information is not considered. However, DLL-SA still outperforms the other compared methods via local coarse-to-fine processing, where the landmark area segmentation results are used as attention maps, forcing each landmark to be localized within the landmark area, thus reducing misdetections. By integrating all these strategies into our framework, DLLNet ultimately achieves the highest accuracy and the lowest misdetection rate when compared with related methods.
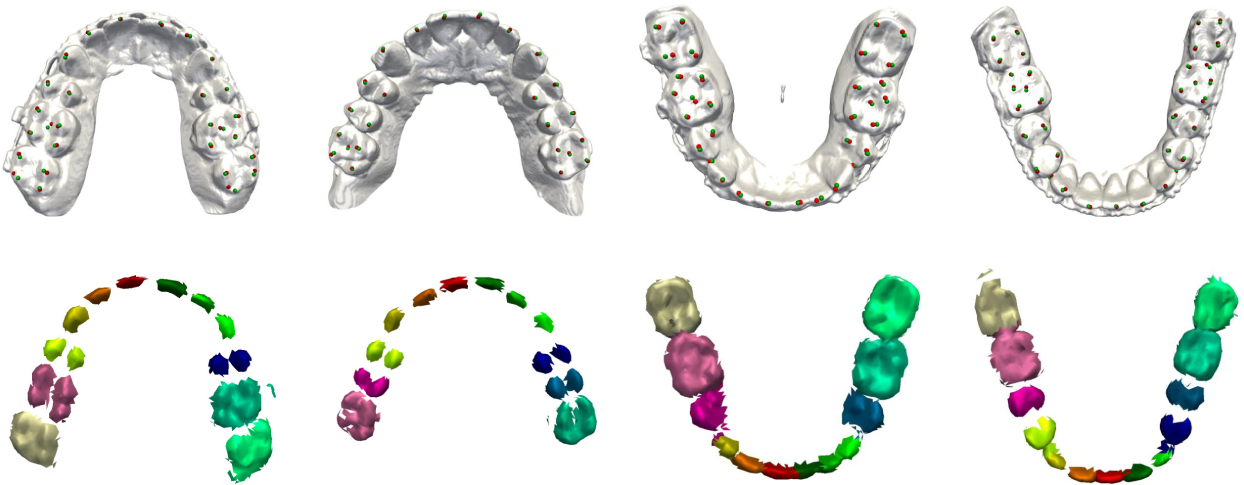
Finally, Fig. 5 shows the localization results on randomly selected partial edentulous subjects, where tooth absence can be directly detected from the pre-segmentation results. All available landmarks are correctly and accurately localized without false detection. This strongly suggests that our approach is capable of handling imperfections.
Fig. 5.

Localization and pre-segmentation results for partially edentulous patients.
4. Conclusion
In this paper, we have proposed an attention-based deep learning method, called DLLNet, to accurately localize 68 commonly used tooth landmarks on 3D dental surface models. DLLNet applies curvature features and learns multi-scale local contextual features along two task-driven paths. By using an attention mechanism, the network further refine localization accuracy and reduces misdetections. Experimental results based on a clinical dataset show that DLLNet significantly outperforms related state-of-the-art methods. Future work will focus on validation on more patients with various tooth conditions.
Acknowledgment.
This work was supported in part by United States National Institutes of Health (NIH) grants R01 DE022676, R01 DE027251, and R01 DE021863.
References
- 1.Hong Y, Kim J, Chen G, Lin W, Yap PT, Shen D: Longitudinal prediction of infant diffusion MRI data via graph convolutional adversarial networks. IEEE Trans. Med. Imaging 38(12), 2717–2725 (2019) [DOI] [PMC free article] [PubMed] [Google Scholar]
- 2.Hsu SSP, et al. : Accuracy of a computer-aided surgical simulation protocol for orthognathic surgery: a prospective multicenter study. J. Oral Maxillofac. Surg 71(1), 128–142 (2013) [DOI] [PMC free article] [PubMed] [Google Scholar]
- 3.Lian C, Wang L, Wu TH, Wang F, Yap PT, Ko CC, Shen D: Deep multi-scale mesh feature learning for automated labeling of raw dental surfaces from 3d intraoral scanners. IEEE Trans. Med. Imaging 39(7), 2440–2450 (2020) [DOI] [PubMed] [Google Scholar]
- 4.Liu S, He JL, Liao SH: Automatic detection of anatomical landmarks on geometric mesh data using deep semantic segmentation. In: 2020 IEEE International Conference on Multimedia and Expo (ICME), pp. 1–6. IEEE (2020) [Google Scholar]
- 5.Long J, Shelhamer E, Darrell T: Fully convolutional networks for semantic segmentation. In: Proceedings of the IEEE Conference on Computer Vision and Pattern Recognition, pp. 3431–3440 (2015) [DOI] [PubMed] [Google Scholar]
- 6.Maron H, et al. : Convolutional neural networks on surfaces via seamless toric covers. ACM Trans. Graph 36(4), 71–1 (2017) [Google Scholar]
- 7.Payer C, Štern D, Bischof H, Urschler M: Regressing heatmaps for multiple landmark localization using CNNs. In: Ourselin S, Joskowicz L, Sabuncu MR, Unal G, Wells W (eds.) MICCAI 2016. LNCS, vol. 9901, pp. 230–238. Springer, Cham: (2016). 10.1007/978-3-319-46723-827 [DOI] [Google Scholar]
- 8.Qi CR, Su H, Mo K, Guibas LJ: PointNet: deep learning on point sets for 3D classification and segmentation. In: Proceedings of the IEEE Conference on Computer Vision and Pattern Recognition, pp. 652–660 (2017) [Google Scholar]
- 9.Qi CR, Yi L, Su H, Guibas LJ: Pointnet++: deep hierarchical feature learning on point sets in a metric space. arXiv preprint arXiv:1706.02413 (2017) [Google Scholar]
- 10.Wang X, Bo L, Fuxin L: Adaptive wing loss for robust face alignment via heatmap regression. In: Proceedings of the IEEE/CVF International Conference on Computer Vision, pp. 6971–6981 (2019) [Google Scholar]
- 11.Wang X, Yang X, Dou H, Li S, Heng PA, Ni D: Joint segmentation and landmark localization of fetal femur in ultrasound volumes. In: 2019 IEEE EMBS International Conference on Biomedical & Health Informatics (BHI), pp. 1–5. IEEE (2019) [Google Scholar]
- 12.Wu W, Qi Z, Fuxin L: PointConv: deep convolutional networks on 3D point clouds. In: Proceedings of the IEEE/CVF Conference on Computer Vision and Pattern Recognition, pp. 9621–9630 (2019) [Google Scholar]
- 13.Zhang J, Liu M, Shen D: Detecting anatomical landmarks from limited medical imaging data using two-stage task-oriented deep neural networks. IEEE Trans. Image Process 26(10), 4753–4764 (2017) [DOI] [PMC free article] [PubMed] [Google Scholar]
- 14.Zhang J, et al. : Joint craniomaxillofacial bone segmentation and landmark digitization by context-guided fully convolutional networks. In: Descoteaux M, MaierHein L, Franz A, Jannin P, Collins DL, Duchesne S (eds.) MICCAI 2017. LNCS, vol. 10434, pp. 720–728. Springer, Cham: (2017). 10.1007/978-3-319-66185-881 [DOI] [PMC free article] [PubMed] [Google Scholar]


