Abstract
Biosynthesis of nanoparticles through plant extracts is gaining attention due to the toxic free synthesis process. The environmental engineering applications of many metal oxide nanoparticles have been reported. In this study, iron oxide nanoparticles (Fe2 O3 ‐Nps) were synthesised using a simple biosynthetic method using a leaf extract of a mangrove plant Rhizophora mucronata through reduction of 0.01 M ferric chloride. Fe2 O3 ‐Np synthesis was revealed by a greenish colour formation with a surface plasmon band observed close to 368 nm. The stable Fe2 O3 ‐Np possessed excitation and emission wavelength of 368.0 and 370.5 nm, respectively. The Fourier‐transform infrared spectral analysis revealed the changes in functional groups during formation of Fe2 O3 ‐Np. Agglomerations of nanoparticles were observed during scanning electron microscopic analysis and energy‐dispersive X‐ray spectroscopic analysis confirmed the ferric oxide nature. The average particle size of Fe2 O3 ‐Np based on dynamic light scattering was 65 nm. Based on transmission electron microscopic analysis, particles were spherical in shape and the crystalline size was confirmed by selected area electron diffraction pattern analysis. The synthesised Fe2 O3 ‐Np exhibited a good photodegradation efficiency with a reduction of 83 and 95% of phenol red and crystal violet under irradiation of sunlight and florescent light, respectively. This report is a facile synthesis method for Fe2 O3 ‐Np with high photodegradation efficiency.
Inspec keywords: photochemistry, dyes, nanofabrication, transmission electron microscopy, scanning electron microscopy, nanoparticles, iron compounds, X‐ray diffraction, catalysts, catalysis, particle size, X‐ray chemical analysis, electron diffraction, Fourier transform infrared spectra, surface plasmons
Other keywords: energy‐dispersive X‐ray spectroscopic analysis, ferric oxide nature, transmission electron microscopic analysis, selected area electron diffraction pattern analysis, iron oxide nanoparticles, plant extracts, toxic free synthesis process, metal oxide nanoparticles, metal nanoparticles, nanofiltration, nanobiocides, Rhizophora mucronata Lam, crystalline size, phenol red, crystal violet, sunlight irradiation, florescent light, scanning electron microscopic analysis, Fourier‐transform infrared spectral analysis, surface plasmon, ferric chloride, leaf extract, nanocatalysts, nanoadsorbents, photocatalytic degradation, synthetic dyes, mangrove plant, water remediation, wastewater pollutant, wavelength 370.5 nm, wavelength 368.0 nm, Fe2 O3
1 Introduction
Nanotechnology is a tool of the recent decade to resolve many issues related to environment and health care. The nano‐scale particles have numerous advantages and are widely explored for its new functionalities. The metal nanoparticles production is usually carried out using physical and chemical methods. An array of chemicals is required for the metal nanoparticles production, which is very reactive and toxic reducing agents. This brings about many deleterious effects during its application in health care and environmental engineering. In the meantime, many facile and reliable green technologies were adopted for the production of these nanoparticles. Among the green technologies, various organisms act as precursors to produce the stable and well‐functionalised nanoparticles, which include bacteria, actinomycetes, fungi, yeast, viruses, plants and so on [1, 2]. Plant‐mediated nanoparticle synthesis is more reliable in terms of its monodispersed nature, stability and fast synthesis compared to other precursors [3, 4]. Various part of plants can be used for the metal nanoparticle synthesis and the process is the simplest and most cost‐effective [5].
The environmental engineering applications of many metal oxide nanoparticles, especially iron oxide nanoparticles (Fe2 O3 ‐Nps) have been reported. Recently, metal nanoparticles and metal oxide nanoparticles are used as nano‐adsorbents, nano‐catalysts, nano‐filtration and nano‐biocides for remediation of water and wastewater pollutants. Among them, potential of iron nanoparticles was found suitable for environmental remediation. The nanoscale zero‐valent iron has a large surface area to volume ratio, which enhances their reactivity especially in the environmental applications [6].
In the present work, we used Rhizophora mucronata a common mangrove plant for the synthesis of Fe2 O3 ‐Nps. The mangrove plants such as R. mucronata and R. apiculata were used for metal Np synthesis through bio‐reduction method [7], which were proved to have antimicrobial [8] and anti‐larvicidal activity [9]. However, there are no reports pertaining to the Fe2 O3 ‐Np synthesis using R. mucronata and hence this form the first report on the Fe2 O3 ‐Np synthesis to the best of our knowledge.
The dye decolourisation using biological system is a complex process requiring a suitable enzyme system in bioremediation of such effluents. Such dye rich effluents can be treated through metal oxide nanoparticle by the photocatalytic degradation process. Photocatalytic reactions are induced by the illumination of nano‐sized semiconductors such as TiO2, ZnO, ZnS, WO3 and Fe2 O3 in a suspension and they are most promising for the wastewater treatment [10] because of their high stability, low costs, high efficiency and no toxicity [11]. Among various semiconductors used in photocatalysts, iron oxide nanomaterials exhibit promising photocatalytic activities [12, 13, 14]. However, ‘combinational’ nanoparticle systems were used previously for the dye photocatalytic degradation activity. In the present study, we focused on the application of Fe2 O3 ‐Nps alone in the photocatalytic degradation activity of some selected synthetic dyes.
2 Materials and methods
2.1 Extract preparation
Rhizophora mucronata Lam. leaves were collected from Mangalavanam mangrove ecosystem, Kerala, India. The leaves were washed well to remove excess salt and dust particles. A 5 g of leaves was weighed and chopped into small pieces and an extract was made by boiling in millipore water for 5 min. The leaves were removed by filtration and the filtrate was used for nanoparticle synthesis.
2.2 Synthesis of Fe‐nanoparticles
FeCl3 (Sigma Aldrich) solution of two different concentrations (0.1 M and 0.01 mM) was made using millipore grade water. This solution was added to an equal amount of plant extract (1:1 v/v) while mixing. The colour change was observed while adding the solutions which confirmed the Fe2 O3 ‐Np synthesis.
2.3 Characterisation of Fe‐nanoparticles
Based on the colour change, the nanoparticle synthesis was initially screened and the sample was subjected to scanning in the range of 200–800 nm using UV–Vis spectrophotometer (Spectronic‐200, Thermo Scientific, USA). The absorbance maximum of the nanoparticle solution was noted. The nanoparticle sample and plant extract were subjected to Fourier‐transform infrared (FTIR) analysis (FTIR Prestige 21 Shimadzu) in the range of 4000–400 cm−1 for understanding the functional groups involved. Particle size of the synthesised nanoparticle was determined by dynamic light scattering (Malvern Instruments Ltd.). The sample was further centrifuged and dried overnight for scanning electron microscopy (SEM) (JEOL Model JSM – 6390LV), energy‐dispersive X‐ray spectroscopic analysis (EDAX) and X‐ray diffraction (XRD) analysis using X‐ray diffractometer (Bruker AXS D8 Advance). Excitation and emission properties of the Fe2 O3 ‐Np synthesised were analysed by spectrofluorometric analysis using spectrofluorometer (SL‐174, Elico, India). Further characterisation was carried out using high‐resolution transmission electron microscopy (HR‐TEM) and selected area electron diffraction (SAED) pattern.
2.4 Photoctalytic degradation of synthetic dyes using Fe‐Np
The photocatalytic degradation activities of synthesised Fe2 O3 ‐Np samples were analysed using various concentrations of synthetic dyes under different light sources. For the experiment, four synthetic dyes namely phenol red (PR), rhodamine B (RB), acridine orange (AO) and crystal violet (CV) were used. Three different conditions were applied to the photo‐catalysis reaction by illumination through fluorescent light, sunlight and UV light. The solution was stirred well before the illumination. The vials containing dyes + Fe2 O3 ‐Np were incubated under illuminated conditions for 30 min and absorbance was measured at 554, 525, 590 and 570 nm for RB, AO, CV and PR, respectively, using UV–Vis spectrophotometer. The decolourisation efficiency was calculated using the formula: (A 0 − At )/A 0 × 100, where A 0 is the absorbance before irradiation and At is the absorbance at time t [15]. The absorbance contributed by nanoparticles was subtracted from test solution (kept as control) in the experiment.
3 Results and discussion
3.1 Spectroscopic analysis of Fe2 O3 ‐Nps
The colour change of the extract from colourless to greenish‐black was observed immediately after mixing, which indicated the formation of Fe2 O3 ‐Nps. The time required for the bio‐reduction of the metal ions varied from a few minutes as in Euphorbia milli to about 24 h as in lemon grass tea. When the R. mucronata leaf extract and FeCl3 solution was mixed, a colour change was observed from yellowish brown to finally dark green, almost blackish green colour indicating the formation of Fe2 O3 ‐Np. In a previous work on Fe2 O3 ‐Np synthesis using neem leaves extract also, a similar change in colour was noticed [16]. During the excitation of surface plasmon resonance (SPR), there was a visible change in colour which was characterised by UV–Vis spectroscopy that could be due to the formation of Fe2 O3 ‐Np [17]. Generally, the Fe2 O3 ‐Nps have been prepared by strong hydrolysis of iron salts at elevated temperature [18]. The plant‐mediated Fe2 O3 ‐Nps were prepared at room temperature in our study. Due to the high organic contents in the plant extracts, the mechanism study of Fe2 O3 ‐Nps formation is bit difficult. However, the organic compound present in the plant extracts acts as a reducing as well as capping or binding agent to form Fe2 O3 ‐Nps [19].
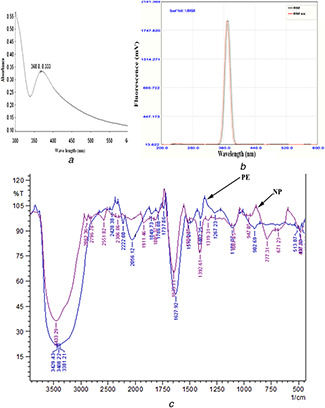
UV–Vis spectroscopy is the most widely used technique to investigate the optical properties of the particles. UV–Vis spectroscopy analysis was carried out in the range of 200–800 nm and the maximum absorbance was observed at 368 nm that may be due to the formation of Fe2 O3 ‐Nps due to the excitation of surface plasmon vibrations (Fig. 1 a). UV–Vis spectrum, known as the surface plasmon absorption band, of the individual nanoparticles is different from that of nanoparticles aggregate. The SPR of a nanoparticle aggregate is shifted to a longer wavelength as compared with SPR of the individual particles [20]. The shorter UV absorption wavelength confirmed that no aggregation of Nps occurred during the synthesis. Metallic iron nanoparticles synthesised in the present work exhibited a relatively identical UV–Vis spectrum obtained from previous reports [21].
Fig. 1.

Characterisation of iron nanoparticle synthesise by Rhizophora mucronata
(a) UV–Vis spectrum, (b) Photoluminescence spectrum, (c) FTIR spectrum
However, the UV–Vis spectrum of Fe3 O4 ‐Nps in the aqueous Sargassum muticum extract had two absorption peaks at wavelengths of 402 and 415 nm indicating the formation of ferrous oxide nanoparticles [22]. Similarly, nanoparticle synthesised using Eucalyptus globulus leaf extract mixture exhibited an absorption maximum (λmax) peak around 402 nm indicating the formation of low dimensional β‐Fe2 O3 [19]. UV–Vis spectrum was observed for the extract with 0.1 M and 0.01 mM of FeCl3 solution exhibited similar λmax. In the present study, the results depicted that 0.01 M was the optimum FeCl3 concentration for the synthesis of Fe2 O3 ‐Np. Excitation and emission properties of the Fe2 O3 ‐Np synthesised were analysed by spectrofluorometric analysis (Fig. 1 b). The Fe2 O3 ‐Np exhibited an excitation at 368 nm and emission at 370.5 nm with a quantum yield of 1.0045. This result shows the possible application of the synthesised Fe2 O3 ‐Np in bio‐imaging.
3.2 FTIR analysis of synthesised Fe2 O3 ‐Nps
The Fe2 O3 ‐Nps synthesised by R. mucronata was subjected to FTIR analysis and compared with the plant extract (before reaction). The FTIR spectrum of Fe2 O3 ‐Np (Fig. 1 c) represents the major absorption bands. The bands/peak assignments from the FTIR spectrum of Fe2 O3 ‐Np were: 3433.29‐Br (OH) a characteristic N–H vibration region; 2862.36 – hydroxyl compounds; 2796.78 – C–H stretch of aldehyde; 2551.82 – SH stretch; 2306.86‐S=O stretching; 1911.46 – N=C=S stretching; 1805.37 – C=O stretching; 1633.71‐C=C alkene; 1504.48‐C=C stretching – alkenes; 1392.61 – C–H deformation due to alkynes; 1319.31 – NO2 nitro compounds; 1087.85 – C–O stretching due to secondary alcohols; 777.31 – C–H alkenes; 671.23 – C–Br stretch of halogen groups and 466.77 – metal oxide or metal chloride. The bands at 466.77 cm−1 were due to the formation of metal oxides or metal chlorides [23, 24]. Bands at 3429.43, 3408.22 and 3381.21 cm−1 were not visible in the FTIR spectrum of nanoparticle. Similarly, bands at 2056.12 and 902.69 cm−1 were disappeared. Moreover, there was visible shift of peaks during the nanoparticle formation that might be due to oxido‐reductive reactions. The results were comparable with previous reports of Balamurugan et al. [19]. The presence of phenolic compounds and proteins might be responsible for the formation and stabilisation of synthesised Fe2 O3 ‐Nps [19].
3.3 XRD analysis of synthesised Fe2 O3 ‐Nps
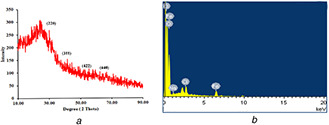
The average size, the crystalline nature of the particles and quality of compounds were determined by XRD spectrum with CuKα radiation λ = 1.504 Å over a wide range of Bragg angles using XRD patterns (Fig. 2 a). The XRD spectrum showed different diffraction peaks at 12.02°, 23.83°, 31.92° and 45.81° corresponding to the crystal planes of (220), (311), (422) and (440) of crystalline Fe2 O3. The obtained data matched with the Joint Committee on Powder Diffraction Standards (JCPDS) File No. (4‐755). Previously, major characteristic peaks for prepared crystalline metallic nanoparticles were obtained at 2θ values of 24.2°, 33.1°, 35.7°, 40.9°, 49.4°, 54.1°, 57.6°, 62.6° and 64.0° corresponding to (012), (104), (110), (113), (024), (116), (018), (214) and (300), respectively [19]. The average lattice size found for Fe2 O3 ‐Np ranged from 1.14 to 4.55 nm with a lattice strain of 0.0204 to 0.304. EDAX also supported the oxide nature of the nanoparticle (Fig. 2 b).
Fig. 2.

Characterisation of Iron (III) oxide nanoparticle synthesised by Rhizophora mucronata using X‐ray spectroscopy
(a) XRD spectrum of Fe2 O3 ‐Np, (b) EDAX
3.4 SEM analysis of synthesised Fe2 O3 ‐Nps
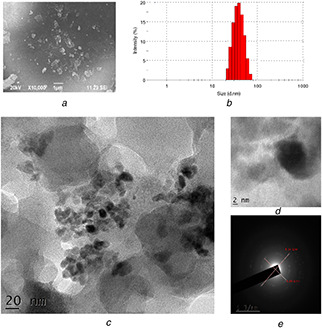
The dry powdered sample was analysed for the structure and morphology of the synthesised Fe2 O3 ‐Np using SEM at different magnification levels (Fig. 3 a). SEM images revealed that the synthesised Fe2 O3 ‐Np were aggregated as irregular sphere shapes with rough surfaces. The morphology of the nanoparticles mostly appeared to be porous and spongy. Based on the dynamic scattering light (DSL) method, the average particle size was about 65 nm. However, agglomerations were observed similar to the previous report of Balamurugan et al. [19]. However, larger Fe3 O4 ‐Np with an average diameter of 116 nm was also reported [25]. Stability of the Fe2 O3 ‐Np was carried out after 3 months, and the peak position was stable.
Fig. 3.

Morphological and size characterisation of Fe2 O3 ‐Np synthesised by Rhizophora mucronata
(a) SEM image, (b) Particle size distribution, (c) HR‐TEM image, (d) Magnified Fe2 O3 ‐Np, (e) SAED
3.5 TEM analysis
In the present work, the TEM images of the synthesised Fe2 O3 ‐Np showed spherical morphologies with 5.58–9.02 nm size (Figs. 3 c and d). This was in agreement with the SAED results (6.04–8.3 nm) (Fig. 3 e). α‐Fe2 O3 nanoparticles synthesised by using green tea (Camellia sinensis) leaf extract resulted in spherical and highly porous particles with an average diameter of 60 nm based on the TEM images [26].
3.6 Photocatalytic degradation of synthetic dyes
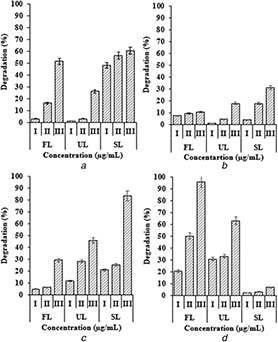
The photocatalytic degradation of four dyes was carried out under three different illumination conditions. The Fe2 O3 ‐Np concentration when increased had enhanced the photocatalytic degradation of all dyes. RB, PR and AO exhibited maximum degradation at highest Fe2 O3 ‐Np concentration when incubated under sunlight (Fig. 4), whereas in the case of CV, maximum degradation was observed under fluorescent light followed by UV light source. CV showed minimal degradation under sunlight. The photo‐oxidation of RB was carried out in the presence of H2 O2 / Fe2+ ion using UV light [27]. In a similar study, Alshehri et al. [28] observed that the Fe nanoparticles degraded more than 55% of Congo red within a short period of 30 min under UV irradiation. However, a better degradation was observed in our study with a reduction of 83 and 95% of PR and CV under irradiation of sunlight and florescent light, respectively. At high concentrations, most of the dye molecules, after being adsorbed on the surface of Fe nanoparticles, may block the active reaction sites and might result in a decrease in the photodegradation efficiency [29]. In a previous study, they obtained maximum photodegradation efficiency with a concentration of 60 µg ml−1 [28]. However, the concentration required in our study was very minimum as 50 µg ml−1.
Fig. 4.

Photocatalytic degradation of synthetic dyes
(a) Rhodamine, (b) Acridine orange, (c) Phenol red, (d) Crystal violet (I, 10 µg ml−1; II, 25 µg ml−1 and III, 50 µg ml−1; FL, florescent light; UL, UV light; and SL, sunlight)
4 Conclusion
Biogenic synthesis of Fe2 O3 ‐Np using R. mucronata was very fast and required no toxic chemicals. Synthesised Fe2 O3 ‐Np was confirmed by colour change, and based on UV–Vis spectroscopy analysis, where a λ max of 368.0 nm was observed. The Fe2 O3 ‐Nps were stable up to 3 months and exhibited an excitation at 368.0 nm and emission at 370.5 nm. FTIR spectrum revealed the changes of functional groups during the formation Fe2 O3 ‐Nps. The average lattice size found for Fe2 O3 ‐Np ranged from 1.14 to 4.55 nm based on XRD analysis and mean particle size distribution in aqueous media was about 65 nm. TEM analysis revealed a smaller particle size of 5.58–9.02 nm that was in agreement with SAED analysis. The synthesised Fe2 O3 ‐Np exhibited a good photodegradation efficiency with a reduction of 83 and 95% of PR and CV under irradiation of sunlight and florescent light, respectively.
5 Acknowledgments
The authors are grateful to the Director, NIO, Goa and Scientist‐ in‐ charge, CSIR‐NIO (RC), Kochi for their support and advice. NVK acknowledge the financial support of Science and Engineering Board (SERB), Government of India through National Post‐Doctoral fellowship [PDF/2016/000438]. This is NIO contribution number 6273. Authors acknowledge Central Instrumentation Unit, Lady Doak College, Madurai for photoluminescence analysis and Sophisticated Test and Instrumentation Centre (STIC), CUSAT for XRD and TEM analysis; Karunya University, Coimbatore for DSL, SEM and EDAX.
6 References
- 1. Mandal D. Bolander M.E. Mukhopadhyay D. et al.: ‘The use of microorganisms for the formation of metal nanoparticles and their application’, Appl. Microbiol. Biotechnol., 2006, 69, pp. 485 –492 [DOI] [PubMed] [Google Scholar]
- 2. Jebali A. Ramezani F. Kazemi B.: ‘Biosynthesis of silver nanoparticles by Geotricum sp.’, J. Clust. Sci., 2011, 22, pp. 225 –232 [Google Scholar]
- 3. Iravani S.: ‘Green synthesis of metal nanoparticles using plants’, Green Chem., 2011, 13, pp. 2638 –2650 [Google Scholar]
- 4. Dhillon G.S. Brar S.K. Kaur S. et al.: ‘Green approach for nanoparticle biosynthesis by fungi: current trends and applications’, Crit. Rev. Biotechnol., 2012, 32, pp. 49 –73 [DOI] [PubMed] [Google Scholar]
- 5. Kalaiarasi R. Jayallakshmi N. Venkatachalam P.: ‘Phytosynthesis of nanoparticles and its applications’, Plant Cell Biotechnol. Mol. Biol., 2010, 11, pp. 1 –16 [Google Scholar]
- 6. Lin W. Rieter W.J. Taylor K.M.: ‘Modular synthesis of functional nanoscale coordination polymers’, Angew. Chem. Int. Ed., 2009, 48, pp. 650 –658 [DOI] [PMC free article] [PubMed] [Google Scholar]
- 7. Gouda S. Das G. Sen S.K. et al.: ‘Mangroves, a potential source for green nanoparticle synthesis: a review’, IJMS, 2015, 44, pp. 635 –645 [Google Scholar]
- 8. Premanathan M. Benitha V.S.S. Jeyasubramanian K. et al.: ‘Rapid biosynthesis of antibacterial silver nanoparticles by Rhizophora mucronata leaf’, Adv. Sci. Eng. Med., 2014, 6, pp. 184 –187 [Google Scholar]
- 9. Gnanadesigan M. Anand M. Ravikumar S. et al.: ‘Biosynthesis of silver nanoparticles by using mangrove plant extract and their potential mosquito larvicidal property’, Asian Pac. J. Trop. Med, 2011, 4, pp. 799 –803 [DOI] [PubMed] [Google Scholar]
- 10. Dai K. Chen H. Peng T. et al.: ‘Photocatalytic degradation of methyl orange in aqueous suspension of mesoporous titania nanoparticles’, Chemosphere, 2007, 69, pp. 1361 –1367 [DOI] [PubMed] [Google Scholar]
- 11. Dipti V. Sharma V.K.: ‘Study of synthesis and photocatalytic activities of Mo doped ZnO’, J. Chem. Pharm. Res, 2010, 2, pp. 269 –273 [Google Scholar]
- 12. Leland J.K. Bard A.J.: ‘Photochemistry of colloidal semiconducting iron oxide polymorphs’, J. Phys. Chem., 1987, 91, pp. 5076 –5083 [Google Scholar]
- 13. Zhao S. Wu H.Y. Song L. et al.: ‘Preparation of γ‐Fe2 O3 nanopowders by direct thermal decomposition of Fe‐urea complex: reaction mechanism and magnetic properties’, J. Mater. Sci., 2009, 44, pp. 926 –930 [Google Scholar]
- 14. Bharathi S. Nataraj D. Mangalaraj D. et al.: ‘Highly mesoporous α‐Fe2 O3 nanostructures: preparation, characterization and improved photocatalytic performance towards Rhodamine B (RhB)’, J. Phys. D, Appl. Phys., 2009, 43, p. 015501 [Google Scholar]
- 15. Abraham S.D. David S.T. Bennie R.B. et al.: ‘Eco‐friendly and green synthesis of BiVO4 nanoparticle using microwave irradiation as photocatalayst for the degradation of Alizarin Red S’, J. Mol. Struct., 2016, 1113, pp. 174 –181 [Google Scholar]
- 16. Pattanayak M. Nayak P.L.: ‘Ecofriendly green synthesis of iron nanoparticles from various plants and spices extract’, Int. J. Plant, Animal Environ. Sci., 2013, 3, pp. 68 –78 [Google Scholar]
- 17. Song J.Y. Kim B.S.: ‘Rapid biological synthesis of silver nanoparticles using plant leaf extracts’, Biopro. Biosyst. Eng., 2009, 32, p. 79 [DOI] [PubMed] [Google Scholar]
- 18. Ocaña M. Morales M.P. Serna C.J.: ‘Homogeneous precipitation of uniform α‐Fe2 O3 particles from iron salts solutions in the presence of urea’, J. Colloid Interface Sci., 1999, 212, pp. 317 –323 [DOI] [PubMed] [Google Scholar]
- 19. Balamurugan M. Saravanan S. Soga T.: ‘Synthesis of iron oxide nanoparticles by using Eucalyptus globulus plant extract’, e‐J. Surf. Sci. Nanotechnol., 2014, 12, pp. 363 –367 [Google Scholar]
- 20. Masarovičová E. Kráľová K.: ‘Metal nanoparticles and plants/nanocząstki metaliczne I rośliny’, Ecol. Chem. Eng, 2013, 20, pp. 9 –22 [Google Scholar]
- 21. Alqudami A. Annapoorni S.: ‘Fluorescence from metallic silver and iron nanoparticles prepared by exploding wire technique’, Plasmonics., 2007, 2, pp. 5 –13 [DOI] [PubMed] [Google Scholar]
- 22. Mahdavi M. Namvar F. Ahmad M.B. et al.: ‘Green biosynthesis and characterization of magnetic iron oxide (Fe3 O4) nanoparticles using seaweed (Sargassum muticum) aqueous extract’, Molecules, 2013, 18, pp. 5954 –5964 [DOI] [PMC free article] [PubMed] [Google Scholar]
- 23. Nakamoto K. Nakamoto K.: ‘Infrared and Raman spectra of inorganic and coordination compounds’ (Wiley, New York, 1977) [Google Scholar]
- 24. Sharma V.K. Pandey O.P. Sengupta S.K.: ‘Synthesis and physico‐chemical and biological studies on ruthenium (III) complexes with Schiff bases derived from aminocarboxylic acids’, Trans. Metal Chem., 1987, 12, pp. 509 –515 [Google Scholar]
- 25. Gottimukkala K.S.V.: ‘Green synthesis of iron nanoparticles using green tea leaves extract’, J. Nanomed. Biotherap. Dis., 2017, 7, p. 151 [Google Scholar]
- 26. Ahmmad B. Leonard K. Islam M. S. et al.: ‘Green synthesis of mesoporous hematite (α‐Fe2 O3) nanoparticles and their photocatalytic activity’, Adv. Powder Technol., 2013, 24, (1), pp. 160 –167 [Google Scholar]
- 27. Dhahir S.A. Al‐Saade K.A. Al‐Jobouri I.S.: ‘Degradation studies of rhodamine B in the presence of UV/H2 O2 /Fe2 ’, Int. J. Tech. Res. Appl., 2014, 2, pp. 123 –127 [Google Scholar]
- 28. Alshehri A. Malik M.A. Khan Z. et al.: ‘Biofabrication of Fe nanoparticles in aqueous extract of Hibiscus sabdariffa with enhanced photocatalytic activities’, RSC Adv., 2017, 7, pp. 25149 –25159 [Google Scholar]
- 29. Chowdhury P.R. Bhattacharyya K.G.: ‘Synthesis and characterization of Co/Ti layered double hydroxide and its application as a photocatalyst for degradation of aqueous Congo Red’, RSC Adv., 2015, 5, pp. 92189 –92206 [DOI] [PMC free article] [PubMed] [Google Scholar] [Retracted]


