Abstract
This study reports the fabrication of cellulose nanoparticles through electrospraying the solution of cellulose in N,N ‐dimethylacetamide/lithium chloride solvent as well as investigating the effect of electrospraying conditions and molecular weight on the average size of electrosprayed nanoparticles. Electrospraying of cellulose was carried out with the following range for each factor, namely concentration = 1–3 wt%, voltage = 15–23 kV, nozzle–collector distance = 10–25 cm, and feed rate = 0.03–0.0875 ml/h. The smallest nanoparticles had an average size of around 40 nm. Results showed that lowering the solution concentration and feed rate, as well as increasing the nozzle–collector distance and applied voltage led to a decrease in the average size of the electrosprayed cellulose nanoparticles. Fourier transform infrared analysis proved that no chemical change had occurred in the cellulose structure after the electrospraying process. According to X‐ray diffraction (XRD) results, cellulose nanoparticles showed a lower degree of crystallinity in comparison with the raw cellulose powder. XRD results also proved the absence of LiCl salt in the electrosprayed nanoparticles.
Inspec keywords: polymers, nanoparticles, nanofabrication, spraying, molecular weight, particle size, Fourier transform infrared spectra, X‐ray diffraction, polymer structure
Other keywords: cellulose nanoparticles; electrospraying; N,N‐dimethylacetamide‐lithium chloride solvent; molecular weight; solution concentration; feed rate; nozzle‐collector distance; Fourier transform infrared analysis; X‐ray diffraction; XRD; crystallinity; cellulose powder; voltage 15 kV to 23 kV
1 Introduction
Cellulose, the most abundant biopolymer found on Earth, is a linear homopolysaccharide composed of D‐anhydroglucopyranose units linked together through an oxygen, which is covalently bonded to C1 and C4 of adjoining glucose rings (β ‐1,4‐glucoside bond) [1, 2, 3, 4]. Cellulose can neither be melted nor can it be dissolved in water and common solvent systems due to its rather complex and highly ordered structure as a result of strong inter‐ and intra‐molecular interactions. Dissolving cellulose counts as a challenging task, and preparation of pure cellulose requires its solution [2, 3, 4, 5, 6]. Solvents employed to dissolve cellulose in recent years include N ‐methylmorpholine‐N ‐oxide, ionic liquids, N,N ‐dimethylacetamide (DMAc), sodium hydroxide aqueous solution, alkali/urea, alkali/thiourea aqueous solution, tetrabutyl ammonium fluoride/dimethylsulphoxide system, metal complex solutions and molten inorganic salt hydrates [1]. Cellulose is gaining attention increasingly because of its favourable properties such as availability, biocompatibility, biodegradability, high moisture absorption, renewability, low cost, non‐toxicity etc. [1, 7]. Thanks to the above‐mentioned features, cellulose has found applications in different industries such as paper, textile, food as well as packaging, filtration, pharmaceuticals, coating and membranes. Depending on the application, cellulose is used in a variety of forms such as film, hydrogel, aerogel, powder, microsphere, nanofibre and nanoparticle [1, 4, 8, 9].
Nanotechnology refers to the study of reducing dimensions to as low as atomic, molecular and macromolecular scales. Nanotechnology produces materials with dimensions in the range of 1–100 nm [10]. Many types of researches have indicated the importance of nanoparticles in comparison with microspheres due to the considerably higher surface to volume ratio [11]. Nanoparticles of various polymers such as proteins, polysaccharides and synthetic polymers have been produced through processes such as emulsion/evaporation, desolvation, coacervation, spray‐drying, nanoprecipitation and electrospraying techniques [10, 11]. Electrospraying also known as electrohydrodynamic atomisation is, in fact,, the breakage of a drop into small micro‐/nanosized droplets when an electric field overcomes the liquid surface tension [12]. The advantage of electrospraying method over other routes is that by varying the factors such as applied voltage, needle–collector distance and the feed rate, a range of average size of electrosprayed nanoparticles can be obtained [13, 14, 15, 16].
The literature review shows the following reports on electrosprayed natural polymer nanoparticles. Gholami et al. [17] produced fibroin nanopowder with an average size below 80 nm. Pedram Rad et al. [18] produced feather keratin nanopowder with an average size of 53 nm. Hazeri et al. [19] showed that producing sericin nanopowder with an average size of 80 nm is possible through electrospraying. Ebrahimgol et al. [20] produced wool keratin nanoparticles through electrospraying. The average size of these nanoparticles was recorded to be between 36 and 72 nm. Ghaeb et al. [21] produced maize starch and its constituents (amylose and amylopectin) nanoparticles through electrospraying with an average nanoparticle size of about 100 nm.
Cellulose nanoparticles can be produced through acid hydrolysis and mechanical methods such as high‐pressure homogenisation [22, 23]. Moaris et al. [23] produced cellulose nanocrystals with an average size of 177 nm through acid hydrolysis process. Li et al. [24] produced cellulose nanoparticles with a size between 10 and 20 nm, through high‐pressure homogenisation. However, some shortcomings have been mentioned for these procedures, which include the elimination of a considerable amount of cellulose because of acid hydrolysis in the amorphous regions as well as high mechanical energy for breaking the compact structure of cellulose [22].
Considering the literature review mentioned above, this research aimed at presenting the application of electrospraying for producing cellulose nanoparticles.
2 Material and methods
2.1 Raw materials and chemicals
Cellulose microcrystalline powder with the average molecular weight of 120 KDa and cotton linters based cellulose powder with the average molecular weight of 192 KDa were purchased from Merck and Sigma‐Aldrich, respectively. Lithium chloride (LiCl), DMAc and methanol were supplied by Merck.
2.2 Preparation of cellulose solution in DMAc/LiCl solvent system
To facilitate dissolution, cellulose was swollen first as follows: 20 g of raw cellulose was immersed in 100 ml deionised water for 8 h at room temperature. After dewatering by filtration, cellulose was placed in 10 ml of methanol for 30 min (room temperature) and eventually placed in 10 ml of DMAc for another 30 min (room temperature). Finally, samples were dried at room temperature for 12 h [25].
DMAc/LiCl (91‐9) was employed as the solvent system, which was prepared by first drying a given amount of LiCl salt in an oven at 140°C and then keeping it in a desiccator until being added to DMAc (80°C), followed by stirring for 1 h. After dissolution, the solvent system was cooled to room temperature. To prepare cellulose solutions, given amounts of swollen cellulose were added to the solvent system and stirred at 30°C for 12 h [25].
2.3 Electrospraying of cellulose solution
The electrospraying setup consisted of a syringe pump, needle, aluminium foil collector and high‐voltage power supply. The electrospraying process was set up horizontally with rotating collector (rpm = 50) tangential to a water bath as shown in Fig. 1, so that the electrosprayed nanoparticles could touch the water surface. This was done to remove LiCl salt from the electrosprayed nanoparticles. In a study on electrospinning cellulose nanofibres from DMAc/LiCl solvent system Kim et al. [9] showed that in order to obtain dry, stable and nano‐scaled fibres, electrospun nanofibres had to be wetted immediately by water. To accelerate the evaporation of DMAc from the airborne cellulose nanoparticles in the electrospraying field, an infrared lamp was used to heat the air around the aluminium foil collector to about 60°C. The 2 ml syringe connected to a blunt tipped needle (gauge = 23) was filled with cellulose solution and placed in the feeding system of the electrospraying setup, as shown in Fig. 1.
Fig. 1.
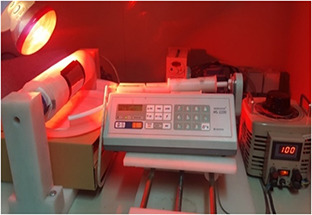
Electrospraying setup
The syringe and rotating collector were connected to the positive and the negative electrodes of the high‐voltage supply, respectively. Preliminary trials were carried out in order to find a suitable range of electrospraying factors, i.e. cellulose solution concentration, voltage, needle–collector distance and feed rate. The levels chosen for each factor are as shown in Table 1.
Table 1.
Conditions of electrospraying cellulose solution
| Factor | Levels |
|---|---|
| concentration of cellulose in DMAc/LiCl (9:1), w/w% | 1–2–3 |
| voltage, kV | 15–20–23 |
| needle–collector distance, cm | 10–17–25 |
| feed rate, ml/h | 0.03–0.06–0.0875 |
2.4 Characterisation of the cellulose solution and the electrosprayed nanoparticles
Average particle (average diameter) size of the electrosprayed cellulose nanoparticles was measured by applying digimiser software on scanning electron microscopy (SEM) micrographs of the nanoparticles. At least 100 particles were chosen randomly for each measurement. Statistical Package for the Social Sciences software (SPSS) was applied for the statistical analysis. Electrical conductivity, surface tension and viscosity of cellulose solution were measured to study their effect on average particle size of the electrospun cellulose nanoparticles. Fourier transform infrared spectroscopy (FTIR) studies were carried out to investigate the formation of probable reactions and interactions throughout the different stages of cellulose nanoparticle fabrication. X‐ray diffraction (XRD) studies were carried out to study the microstructure of cellulose nanoparticles. Crystallinity index was calculated by employing PANalytical X'pert Highscore and Arean softwares.
2.5 Molecular weight measurement
As the molecular weight of the two cellulose samples employed in this research was not known, viscometry experiments were carried out to find them. With LiCl/DMAc (9‐91) as the solvent system (30°C), intrinsic viscosity was determined by Cannon–Fenske viscometer as follows.
Initially, the reduced viscosity of cellulose solution with concentrations of 0.95, 1.15, 1.5, 1.85 and 3 (mg/cm3) was measured according to (1) [22] (replica = 5)
| (1) |
where t 0 shows the solvent efflux time, t is the solution efflux time and c represents the cellulose solution concentration (g/cm3). Then, reduced viscosity versus concentration was plotted for the two cellulose samples. The intercept on Y ‐axis ascertains the intrinsic viscosity (Figs. 2 a and b). The calculated intrinsic viscosities for micro‐cellulose and cotton linters cellulose was 141.6 and 248.6 cm3 /g, respectively. A calibration curve of intrinsic viscosity [ɳ] versus molecular weight (M w) of cellulose in LiCl/DMAc (9‐91) solvent system (30°C) has been already prepared by McCormick et al. [25]. Using this calibration curve for the two calculated intrinsic viscosities resulted in molecular weights of 120 and 192 KDa for microcrystalline cellulose and cotton linters cellulose, respectively.
Fig. 2.

Reduced viscosity versus concentration for
(a) 120 KDa, (b) 192 KDa
It is worth mentioning that according to Mark–Houwink, intrinsic viscosity (η int) and molecular weight () are related to each other by the equation below:
| (2) |
K and a are constants for polymers in specific solvents at a given temperature. McCormick et al. have reported the values of K and a for cellulose in LiCl/DMAc solvent system as 1.278 × 10⁻⁴ and 1.19, respectively [25]. So, according to McCormick, the Mark–Houwink (2) for cellulose in LiCl/DMAc can be considered as the equation below:
| (3) |
In fact, (3) can be used instead of the calibration curves and substituting the intrinsic viscosities in (3) gives the same molecular weights of 120 and 192 KDa for microcrystalline cellulose and cotton linter cellulose, respectively.
3 Results and discussion
Fig. 3 shows the SEM micrographs of the electrosprayed cellulose nanoparticles. Electrospraying conditions are shown in Table 2.
Fig. 3.
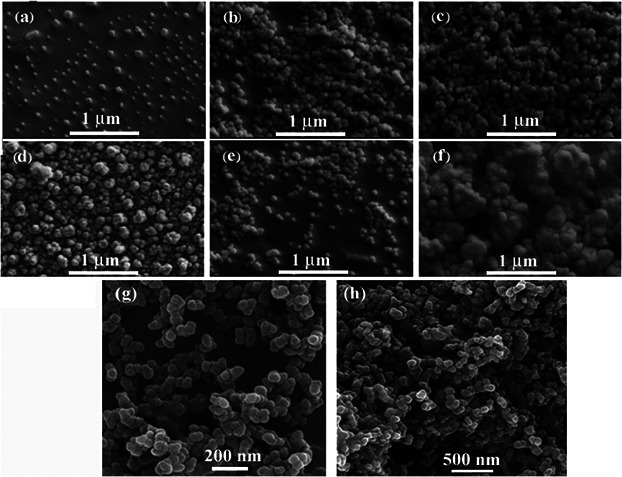
Typical SEM micrographs of electrosprayed cellulose nanoparticles (Table 2)
Table 2.
Electrospinning conditions for samples a–h
| F, ml/h | C, wt% | D, cm | V, kV | Type | |
|---|---|---|---|---|---|
| (a) | 0.03 | 2 | 17 | 15 | microcrystalline cellulose |
| (b) | 0.03 | 3 | 17 | 23 | cotton linters cellulose |
| (c) | 0.06 | 2 | 17 | 23 | microcrystalline cellulose |
| (d) | 0.0875 | 2 | 17 | 23 | microcrystalline cellulose |
| (e) | 0.03 | 2 | 10 | 23 | cotton linters cellulose |
| (f) | 0.03 | 3 | 10 | 23 | cotton linters cellulose |
| (g) | 0.03 | 2 | 10 | 23 | microcrystalline cellulose |
| (h) | 0.03 | 2 | 10 | 20 | microcrystalline cellulose |
F = feed rate, C = concentration, D = Distance and V = Voltage.
Fig. 4 shows the variation of average particle size of electrosprayed cellulose nanoparticles versus the concentration of cellulose powder in DMAc/LiCl solvent system. With other electrospraying conditions constant, the decrease of cellulose lowers average size of cellulose nanoparticles. Electrospraying phenomenon happens as a result of a coulombic explosion leading to the breakage of droplets in the electrostatic field as they travel from the positive electrode to the negative electrode (collector).
Fig. 4.
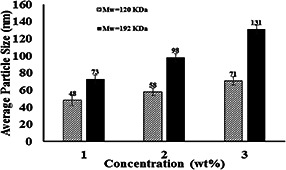
Variation of the average particle size of electrosprayed cellulose nanoparticles versus the concentration of cellulose powder in DMAc/LiCl solvent system. (Voltage = 20 kV, nozzle–collector distance = 10 cm and feed rate = 0.03 ml/h)
Therefore, the decrease in average cellulose particle size as a result of lower cellulose concentration can be explained by the fact that in lower concentrations, the solvent‐to‐polymer ratio is higher and hence lower degree of entanglement of cellulose molecular chains leads to easier breakage of droplets to smaller ones. In the electrospraying process, as the solvent evaporates, the airborne droplets explode further into smaller ones. It is also important to note that polymer concentration in its solution affects other factors which in turn influence solution‐electrical field interactions and hence the final nanoparticle size. These include relative viscosity, surface tension and electrical conductivity. Fig. 5 shows the variation of relative viscosity, surface tension and electrical conductivity of cellulose solution versus cellulose concentration for the two different molecular weights.
Fig. 5.
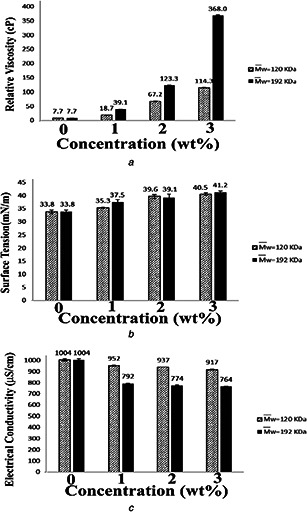
Variation of solution
(a) Relative viscosity, (b) Surface tension, (c) Electrical conductivity versus cellulose concentration for two different cellulose molecular weights
Fig. 5 a shows the variation of solution relative viscosity versus cellulose concentration. The relative viscosity of pure solvent system is 7.7 ± 0.1 cP. As can be seen, increasing cellulose concentration leads to an increase in solution viscosity. The reason for this increase is related to higher entanglement among molecular chains as polymer concentration increases. It is concluded that the increase in viscosity leads to an increase in average particle size. It is concluded that viscosity increase occurring as a result of higher polymer concentration leads to more adhesion between molecular chains, which makes the breakage of droplets into smaller ones more difficult. As far as solution surface tension versus cellulose concentration is concerned, according to Fig. 5 b, higher cellulose concentration leads to higher surface tension. It is concluded that lower surface tension of electrospraying solutions leads to lower‐average particle sizes. This is because lower surface tensions of electrospraying solutions show lower resistance against the columbic explosions in the electric field, and therefore average particle size decreases. The surface tension of solvent alone is 33.7 ± 0.016 mN/m.
Fig. 5 c shows the variation of electrical conductivity versus cellulose concentration in electrospraying solutions. The electrical conductivity of pure solvent system was 1004 ± 10.5 µS. As can be seen, for both molecular weights, concentration increase decreases electrical conductivity. The electric conductivity of electrospraying solutions not only influences the initiation of the electrospraying process, but also the breakage of droplets into smaller ones and hence smaller‐average particle size. Higher electrical conductivity eases the induction of static electricity on droplets and as a result higher electrical charge which facilitates the breakage of droplets. It is concluded that increase in solution‐electrical conductivity decreases the average size of electrosprayed nanoparticles. So, it is concluded that viscosity, surface tension and electrical conductivity are affected by polymer concentration, in other words, polymer concentration of electrospraying solution affects average particle size of the electrosprayed nanoparticles through these three parameters.
It is worth saying that electrospraying cellulose solutions with concentrations of more than 3 wt% were not possible because at higher concentrations, the system tends to form nanofibers instead of nanoparticles.
As far as molecular weight is concerned, Figs. 3 and 4 show that basically the cellulose with higher‐molecular weight enjoys a higher viscosity, higher surface tension, but somehow lower electrical conductivity. However, as Fig. 1 suggests basically, the higher‐molecular weight yields a considerably higher nanoparticle size which can be related to the effect of molecular weight on viscosity, surface tension and electrical conductivity. As already explained, higher viscosity, higher surface tension and lower electrical conductivity lead to bigger electrosprayed nanoparticles. This is verified by the comparison of the average size of cellulose electrosprayed nanoparticle with molecular weights of 120 and 192 KDa. It should be reminded that existing literature in the field of electrospraying natural polymers does not provide any information on the effect of molecular weight.
As far as the electrospraying conditions, e.g. voltage, nozzle–collector distance and feed rate are concerned, Figs. 6, 7, 8 show the effect of these parameters on the average particle size.
Fig. 6.
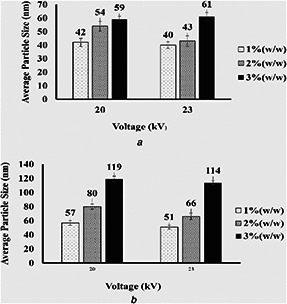
Variation of the average particle size of electrosprayed cellulose nanoparticles versus the voltage applied during the electrospraying process. Feed rate = 0.03 ml/h and nozzle–collector distance = 17 cm
(a) M w = 120 KDa, (b) (M w = 192 KDa)
Fig. 7.
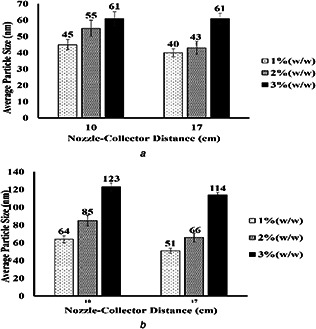
Variation of the average particle size of electrosprayed cellulose nanoparticles versus nozzle–collector distance. feed rate = 0.03 ml/h and voltage = 23 kV
(a) M w = 120 KDa, (b) M w = 192 KDa
Fig. 8.
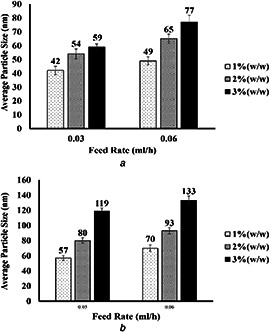
Variation of the average particle size of electrosprayed cellulose nanoparticles versus feed rate. Voltage = 20 kV and nozzle–collector distance = 10 cm
(a) M w = 120 KDa, (b) (M w = 192 KDa)
3.1 Voltage
Fig. 6 shows the variation of the average particle size of electrosprayed cellulose nanoparticles versus the voltage applied during the electrospraying process. As can be seen, keeping all other electrospraying conditions constant, increasing the voltage leads to a decrease in average particle size. Although analysis of variance (ANOVA) shows that the difference between the average particle sizes of cellulose nanoparticles electrospun at voltages of 15 and 20 kV is not statistically significant (P = 0.05), but by increasing the voltage to 23 kV, the differences become statistically significant. Like other electrospraying parameters, the voltage can be chosen in a specific range. On one hand, the voltage applied must be high enough to provide the needed amount of electric charge on the surface of the droplet to enable them to break up into smaller particles, and on the other hand applying too high voltages can lead to unstable electrospraying conditions.
3.2 Needle–collector distance
Fig. 7 shows the variation of the average particle size of electrosprayed cellulose nanoparticles versus the distance between the needle and the collector during the electrospraying process. It is clearly seen that average particle size of nanoparticles decreases as the distance increases. It is worth mentioning that too low distance between the needle and the collector may not give enough time to the solvent to evaporate, and therefore nanoparticles collected on the aluminium foil may stick to each other. Yet, this distance should not be increased to an extent that it may weaken the electric field and cause the cessation of breakage of nanoparticles or even the nanoparticles not reaching the collector. Increasing the distance between the needle and the collector provides more time for the flight of particles toward the collector and hence more coulombic explosions leading to smaller‐sized nanoparticles.
Fig. 8 shows the variation of the average particle size versus the feed rate. As can be seen, increasing feed rate in the electrospraying process contributes to an increase in average particle size. This is related to the increased amount of solution sent to the needle tip, and therefore forming a larger Taylor cone. Larger Taylor cones then lead to the formation of larger nanoparticles reaching the collector. Although increasing feed rate is more desirable in terms of final product, larger nanoparticles are fabricated. It is worth mentioning that recently some useful studies have employed molecular dynamics simulations focusing on the present topic as well [26, 27, 28].
3.3 XRD analysis
Fig. 9 shows the XRD spectra of low‐ and high‐molecular weight cellulose powder and the corresponding nanoparticles electrosprayed from the solution of 2 wt%, respectively. Comparing the XRD spectra of cellulose nanoparticles and pure cellulose shows that electrosprayed cellulose nanoparticles possess structures with smaller crystallites and lower crystallinity index when compared with pure cellulose. Moreover, it is also observed that pure cellulose powder with higher‐molecular weight shows lower crystallinity index than low‐molecular weight one. In a study carried out by Richards [29] on polyethylene, it was also observed that polyethylene with lower‐molecular weight crystallised more easily than higher‐molecular weight one. So, it is concluded that increase in chain entanglement as a result of higher‐molecular weight leads to a structural disorder, i.e. increase in the amorphous regions. However, another study carried out by Biganska et al. [30] has shown that regenerated cellulose crystallinity is not affected by its molecular weight, but is under the influence of solution concentration. Given that LiCl XRD characteristic peak is seen at 2θ = 30.09°, the absence of this peak in the spectrum of nanoparticles confirms that salt removal from cellulose nanoparticles, as a result of aluminium foil revolving in a water bath, is successful [31].
Fig. 9.
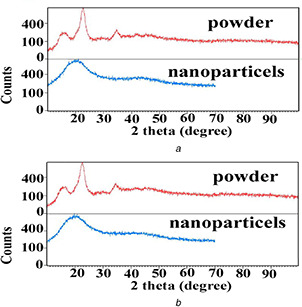
XRD spectra of pure cellulose powder and the corresponding electrosprayed nanoparticles [concentration = 2% (w/w), voltage = 23 kV, nozzle–collector distance = 10 cm and feed rate = 0.03 ml/h]
(a) Molecular weight = 120 KDa, (b) Molecular weight = 192 KDa
3.4 FTIR analysis
Fig. 10 shows the FTIR spectra of pure cellulose powder and electrosprayed cellulose nanoparticles. In the FTIR analysis of cellulose, the absorption bands at 3450, 2900, 1640, 1430, 1375, 1318, 1280, 1162 and 898 cm−1 are related to OH tensile vibrations, methylene (CH2) asymmetrical tensile vibrations, OH bending vibrations, CH2 symmetrical tensile vibrations, C–H symmetrical bending vibrations, C6 tensile vibrations, C–H symmetrical tensile vibrations, C–O tensile vibrations and C–O–C tensile vibrations, respectively [32, 33, 34, 35]. As can be seen in Fig. 10, peaks representing pure cellulose exist in both spectrums of electrosprayed cellulose nanoparticles. The difference in absorbance bands in zone 1100–1000 cm−1 is related to microstructure. So, it is concluded that preparing the electrospraying solution as well as the electrospraying technique influences the microstructure of cellulose and decreases the crystallinity. As far as pure cellulose with higher crystallinity is concerned, the stretching C–O–C and C–O–H bands are more distinguishable in FTIR spectrum. However, in electrosprayed cellulose nanoparticles with lower crystallinity, these bands are not clearly seen in the FTIR spectrum, as they are more of bending type. The reason for peak intensity change at 1318 and 1430 cm−1 can be contributed to C6 conformation difference in cellulose CH2 OH groups. It is finally concluded that there are no considerable changes in chemical structure of cellulose after solubilisation and the electrospraying.
Fig. 10.
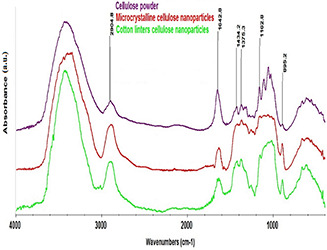
FTIR spectra of
(a) Pure cellulose powder (molecular weight = 120 KDa) and electrosprayed cellulose nanoparticles, (b) M w = 120 KDa, (c) M w = 192 KDa
3.5 Comparison of the size of particles produced by different methods
Table 3 compares the size of cellulose particles obtained by different methods. As can be seen, the reported average size of cellulose particles fabricated through acid hydrolysis is 177 nm. However, mechanical high‐pressure homogenisation has produced the smallest‐sized nanoparticles (10–20 nm). Electrospraying technique, with cellulose particle size of 40 nm stands second with a rather big distance from acid hydrolysis and not much far from mechanical high‐pressure homogenisation.
Table 3.
Comparison of cellulose particle size obtained by different methods
| Method | Average cellulose particle size, nm |
|---|---|
| acid hydrolysis (Morais et al.) | 177 |
| mechanical high‐pressure homogenisation (Li et al.) | 10–20 |
| electrospraying | 40 |
4 Conclusion
Cellulose nanoparticles with an average particle size in the range of 40–80 nm were produced through electrospraying. Lower concentrations, lower feed rates, higher voltages and longer needle–collector distances lead to a decrease in the average particle size. Electrosprayed cellulose nanoparticles with a molecular weight of 120 KDa are smaller in size compared with electrosprayed cellulose nanoparticles with the average molecular weight of 192 KDa. The former nanoparticles possess lower viscosity, lower surface tension and higher electrical conductivity compared with the latter. FTIR studies on both raw cellulose powder and electrosprayed cellulose nanoparticles proved that no considerable chemical change had occurred in the cellulose structure after electrospraying process. According to XRD results, cellulose nanoparticles showed a lower degree of crystallinity and also smaller‐sized crystallites compared with raw cellulose powder. Results also show that polyester fabric surface can be electrosprayed with cellulose nanoparticles.
5 References
- 1. Wang S. Lu A. Zhang L.: ‘Recent advances in regenerated cellulose materials’, Prog. Polym. Sci., 2016, 53, pp. 169 –206 [Google Scholar]
- 2. Medronho B. Lindman B.: ‘Competing forces during cellulose dissolution: from solvents to mechanisms’, Curr. Opin. Colloid Interface Sci., 2014, 19, pp. 32 –40 [Google Scholar]
- 3. Medronho B. Lindman B.: ‘Brief overview on cellulose dissolution/regeneration interactions and mechanisms’, Adv. Colloid Interface Sci., 2015, 222, pp. 502 –508 [DOI] [PubMed] [Google Scholar]
- 4. Ahn Y. Hu D. Hong J.H. et al.: ‘Effect of co‐solvent on the spinnability and properties of electrospun cellulose nanofiber’, Carbohydr. Polym., 2012, 89, pp. 340 –345 [DOI] [PubMed] [Google Scholar]
- 5. Chen J. Guan Y. Wang K. et al.: ‘Combined effects of raw materials and solvent systems on the preparation and properties of regenerated cellulose fibers’, Carbohydr. Polym., 2015, 128, pp. 147 –153 [DOI] [PubMed] [Google Scholar]
- 6. Xu S. Zhang J. He A. et al.: ‘Electrospinning of native cellulose from nonvolatile solvent system’, Polymer, 2008, 49, pp. 2911 –2917 [Google Scholar]
- 7. Klemm D. Heublein B. Fink H.P. et al.: ‘Cellulose: fascinating biopolymer and sustainable raw material’, Angew. Chem., Int. Ed., 2005, 44, pp. 3358 –3393 [DOI] [PubMed] [Google Scholar]
- 8. Rezaei A. Nasirpour A. Fathi M.: ‘Application of cellulosic nanofibers in food science using electrospinning and its potential risk’, Comprehensive Rev. Food Sci. Food Saf., 2015, 14, pp. 269 –284 [DOI] [PubMed] [Google Scholar]
- 9. Kim C.W. Kim D.S. Kang S.Y. et al.: ‘Structural studies of electrospun cellulose nanofibers’, Polymer, 2006, 47, pp. 5097 –5107 [Google Scholar]
- 10. Zandpour F. Allafchian A.R. Vahabi M.R et al.: ‘The green synthesis of silver nanoparticles with the aerial part of Dorema ammoniacum D. Extract by antimicrobial analysis’, IET Nanobiotechnol., doi: 10.1049/iet‐nbt.2017.0216 [DOI] [PMC free article] [PubMed] [Google Scholar]
- 11. Sridhar R. Lakshminarayanan R. Madhaiyan K. et al.: ‘Electrosprayed nanoparticles and electrospun nanofibers based on natural materials: applications in tissue regeneration, drug delivery and pharmaceuticals’, Chem. Soc. Rev., 2015, 44, pp. 790 –814 [DOI] [PubMed] [Google Scholar]
- 12. Xie J. Jiang J. Davoodi P. et al.: ‘Electrohydrodynamic atomization: a two‐decade effort to produce and process micro‐/nanoparticulate materials’, Chem. Eng. Sci., 2015, 125, pp. 32 –57 [DOI] [PMC free article] [PubMed] [Google Scholar]
- 13. Golkar P. Allafchian A.R. Afshar B.: ‘ Alyssum lepidium mucilage as a new source for electrospinning production and physicochemical characterization’, IET Nanobiotechnol., 2018, 12, pp. 259 –263 [Google Scholar]
- 14. Liu Z.‐P. Zhang L.‐L. Yang Y.‐Y. et al.: ‘Preparing composite nanoparticles for immediate drug release by modifying electrohydrodynamic interfaces during electrospraying’, Powder Technol., 2018, 327, pp. 179 –187 [Google Scholar]
- 15. Li X.‐Y. Zheng Z.‐B. Yu D.‐G. et al.: ‘Electrosprayed spherical ethylcellulose nanoparticles for an improved sustained‐release profile of anticancer drug’, Cellulose, 2017, 24, pp. 5551 –5564 [Google Scholar]
- 16. Yang Y.‐Y. Zhang M. Liu Z.‐P. et al.: ‘Meletin sustained‐release gliadin nanoparticles prepared via solvent surface modification on blending electrospraying’, Appl. Surf. Sci., 2018, 434, pp. 1040 –1047 [Google Scholar]
- 17. Gholami A. Tavanai H. Moradi A.R.: ‘Production of fibroin nanopowder through electrospraying’, J. Nanoparticle Res., 2011, 13, pp. 2089 –2098 [Google Scholar]
- 18. Pedram Rad Z. Tavanai H. Moradi A.R.: ‘Production of feather keratin nanopowder through electrospraying’, J. Aerosol Sci., 2012, 51, pp. 49 –56 [Google Scholar]
- 19. Hazeri N. Tavanai H. Moradi A.R.: ‘Production and properties of electrosprayed sericin nanopowder’, Sci. Technol. Adv. Mater., 2012, 13, p. 035010 [DOI] [PMC free article] [PubMed] [Google Scholar]
- 20. Ebrahimgol F. Tavanai H. Alihosseini F. et al.: ‘Electrosprayed recovered wool keratin nanoparticles’, Polym. Adv. Technol., 2014, 25, pp. 1001 –1007 [Google Scholar]
- 21. Ghaeb M. Tavanai H. Kadivar M.: ‘Electrosprayed maize starch and its constituents (amylose and amylopectin) nanoparticles’, Polym. Adv. Technol., 2015, 26, pp. 917 –923 [Google Scholar]
- 22. Hao X. Shen W. Chen Z. et al.: ‘Self‐assembled nanostructured cellulose prepared by a dissolution and regeneration process using phosphoric acid as a solvent’, Carbohydr. Polym., 2015, 123, pp. 297 –304 [DOI] [PubMed] [Google Scholar]
- 23. Morais S.J.P. Rosa M.D.F. Moreira de Souza Filho M.D.S. et al.: ‘Extraction and characterization of nanocellulose structures from raw cotton linter’, Carbohydr. Polym., 2013, 91, pp. 229 –235 [DOI] [PubMed] [Google Scholar]
- 24. Li J. Wei X. Wang Q. et al.: ‘Homogeneous isolation of nanocellulose from sugarcane bagasse by high pressure homogenization’, Carbohydr. Polym., 2012, 90, pp. 1609 –1613 [DOI] [PubMed] [Google Scholar]
- 25. McCormick C.L. Callais P.A. Hutchinson B.H. Jr.: ‘Solution studies of cellulose in lithium chloride and N, N‐dimethylacetamide’, Macromolecules, 1985, 18, pp. 2394 –2401 [Google Scholar]
- 26. Wang B.B. Wang X.D. Wang T.H. et al.: ‘Size control mechanism for bio‐nanoparticle fabricated by electrospray deposition’, Drying Technol., 2015, 33, pp. 406 –413 [Google Scholar]
- 27. Wang B.B. Wang X.D. Wang T.H.: ‘Microscopic mechanism for the effect of adding salt on electrospinning by molecular dynamics simulations’, Appl. Phys. Lett., 2014, 105, p. 121906 [Google Scholar]
- 28. Wang B.B. Wang X.D. Duan Y.Y. et al.: ‘Molecular dynamics simulation on evaporation of water and aqueous droplets in the presence of electric field’, Int. J. Heat Mass Transf., 2014, 73, pp. 533 –541 [Google Scholar]
- 29. Richards R.B.: ‘Polyethylene‐structure, crystallinity and properties’, J. Chem. Technol. Biotechnol., 1951, 1, pp. 370 –376 [Google Scholar]
- 30. Biganska O. Navard P. Bedue O.: ‘Crystallisation of cellulose/N ‐methylmorpholine‐N ‐oxide hydrate solutions’, Polymer, 2002, 43, pp. 6139 –6145 [Google Scholar]
- 31. Kim C.W. Frey M.W. Marquez M. et al.: ‘Preparation of sub‐micron‐scale, electrospun cellulose fibers via direct dissolution’, J. Polym. Sci. B, Polym. Phys., 2005, 43, pp. 1673 –1683 [Google Scholar]
- 32. Ciolacu D. Ciolacu F. Popa V.I.: ‘Amorphous cellulose – structure and characterization’, Cellulose Chem. Technol., 2011, 45, pp. 13 –21 [Google Scholar]
- 33. Fattahi Meyabadi T. Dadashian F. Mir Mohamad Sadeghi G. et al.: ‘Spherical cellulose nanoparticles preparation from waste cotton using a green method’, Powder Technol., 2014, 261, pp. 232 –240 [Google Scholar]
- 34. Oh S.Y. Yoo D.I. Shin Y. et al.: ‘FTIR analysis of cellulose treated with sodium hydroxide and carbon dioxide’, Carbohydr. Res., 2005, 340, pp. 417 –428 [DOI] [PubMed] [Google Scholar]
- 35. Zhang C. Liu R. Xiang J. et al.: ‘Dissolution mechanism of cellulose in N,N ‐dimethylacetamide/lithium chloride: revisiting through molecular interactions’, J. Phys. Chem. B, 2014, 118, pp. 9507 –9514 [DOI] [PubMed] [Google Scholar]


