

Abstract
Augmented escape of nanostructures to the ecosystem has necessitated the comprehensive study of their impact, especially on plants. In the current study, hematite nanoparticles were prepared by employing garlic extract and checked for their cytogenetic effect on onion roots and germination characteristics of five agricultural crops (Vigna radiata, Triticum aestivum, Trigonella foenum‐graecum, Cicer arietinum and Vicia faba) in the concentration range of 20–100 mg/L. Onion roots exhibited an increased mitotic index till 60 mg/L dosage, beyond which trend decreased marginally. Percentage of aberrant chromosomes reported for 100 mg/L exposure was very low (3.358 ± 0.13%) and included common defects such as clumped/sticky metaphase, ring chromosomes, laggards, spindle abnormality, chromosome bridges etc. Moreover, comet assay, DNA laddering experiment and electron micrograph study confirmed negligible damage to onion roots. Seed germination study indicated a positive response in different agronomic traits (germination index, root length, fold change in weight and vigour index) up to 60 mg/L, beyond which either negative or neutral effect was observed. However, none of the samples showed 50% inhibition in germination index; highest being 33.33% inhibition for V. faba, compared to the control. In brief, biogenic hematite nanoparticles caused insignificant phytotoxicity and were likely assimilated as iron source at lower dosage.
Inspec keywords: cellular biophysics, agriculture, iron, cellular effects of radiation, crops, biological effects of gamma‐rays, soil pollution, agricultural engineering, DNA, superparamagnetism, nanoparticles, toxicology, food products, biotechnology
Other keywords: mitotic index, aberrant chromosomes, ring chromosomes, chromosome bridges, electron micrograph study, seed germination study, germination index, root length, biogenic hematite nanoparticles, superparamagnetic hematite nanoparticle, Cytogenetic impact, seed germination response, crop plants, cytogenetic effect, germination characteristics, agricultural crops, trigonella foenum‐graecum
1 Introduction
Recent years have witnessed an increase in extensive research and applications of iron oxide nanoparticles (IONPs) in various fields, such as environmental remediation, manufacturing industries, health care sector, sensor technology, photocatalysis, reaction catalysis etc. [1, 2, 3]. This enormous use of IONP has raised concerns about their chance to escape or deliberate release to the environment [3, 4]. Possible routes for environmental ingression of IONP can be through the agricultural application, in‐situ dye/heavy metal adsorption, degradation of organic pollutants or waste liberated from industries, research institutes, health care firms etc. [5]. Although iron is one of the most common elements on earth and is required for vital functioning of living beings, elevated level of iron or presence of artificially designed iron oxide particles is likely to affect the organisms as well as the environment, adversely [6]. As a reason, National Institute for Occupational Health and Safety (NIOSH) has drafted a permissible exposure level of 14 mg/m3 over a period of 8 h work/day for IONP [7]. Furthermore, nanoscale particles may also undergo some alterations in their composition or physical state, catalyse secondary reactions when exposed to surroundings and raise concerns of biomagnification [5, 8, 9]. Hence, it is very important to study the eco‐toxicity and overall safety of nanoparticles prior to practical application.
Plants are the major food producer, render global food security and constitute 80% of total biomass across all the taxa in biosphere [10]. Additionally, they are distributed strategically in the biosphere and can directly interact with nanoparticles present on land surface, water bodies and atmosphere. Therefore, they are considered as idyllic candidates for examining the impact of nanoparticles. Nanoparticles, normally come in contact with plant roots through root tips and rhizoderm, while access to the shoot is through epidermis, cuticle and other apertures (stomata, hydathodes, lenticels) [5, 8]. Effect of nanoparticles on plants has been found to be advantageous in some, while negative impact has been observed in others. Tripathi et al. [11] have reported mitotic abnormality and decrease in growth traits in various plant species exposed to silver nanoparticles having wide size distribution. Zinc nanoparticles resulted in improved germination characteristics as well as biomolecule synthesis for Brassica napus, while mixed effect was reported for ZnO nanoparticles on Solanum melongena [12, 13]. Likewise, α‐Fe2 O3 nanoparticles were found to improve iron availability in peanut plants, promote chlorophyll synthesis in soyabean while reduced root conductivity (26%) was noticed in Helianthus annuus [14, 15, 16]. Hence, it is evident that plants respond distinctly to particular nanoparticle. Effect on plants has been typically found to depend on specific characteristics of nanoparticle, e.g. composition, size, shape, concentration, stability, synthesis route, presence or absence of coating agent etc. [5, 8]. Nanoparticles are applied to the plant system by either embedding in the soil or as additive to sterile water or soft gel.
Degree of phytotoxicity can be determined on the basis of different endpoints, such as genetic changes (alteration in chromosome number or shape, decrease in mitotic index, DNA shear damage, DNA unfolding), altered enzyme activity (decrease in amylase activity, higher expression of enzymes responsible for defence against oxidative stress), change in metabolic activity (photosynthetic rate, protein expression), effect on seed germination, measurement of ROS (reactive oxygen species) generation, analysis of morphological changes (abnormality in cell structure, change in root diameter) etc. [5, 17]. Among the various methods used to assess phytotoxicity, Allium cepa test and seed germination study are typical. A. cepa is a common agricultural cultivar which possesses a stable chromosome number (2n = 24). Any chromosomal changes on exposure to foreign agents can be easily visualised in roots exposed to mutagens. Multiple roots are generated in very small time interval (3–4 days), which can be analysed to get statistically significant and reliable results [18]. Additionally, entire protocol is uncomplicated, has good sensitivity and does not require specific technicalities. Another common plant toxicity test is checking impact of nanoparticles on seed germination which is an important stage of plant growth [17]. Different parameters analysed for the purpose are percentage germination, germination kinetics, root and shoot length, plant vigour, biomass, etc. [19]. Comet assay and electron microscopic studies are also used to check DNA damage in root cells and root morphological study, respectively [20].
In the current study, hematite nanoparticles (HNPs) were prepared using a bio‐based approach and investigated for their toxicity using both onion root tip and seed germination study. A detailed analysis encompassing seed germination behaviour, mitotic abnormality, morphological and DNA‐related changes were performed along with statistical validation. Although, currently there are few available literature works citing HNP induced changes in plants, most of them are focused on seed germination behaviour. Here, for the first time an elaborate and phytotoxicity study was attempted using several end‐points and impact of nanoparticle was investigated using diverse plant models.
2 Materials and methods
2.1 Chemicals
Garlic and onions bulbs were bought from the local supermarket, Vellore. Chemicals used for nanoparticle synthesis, i.e. ferric chloride (FeCl3), ferrous sulphate (FeSO4), sodium hydroxide (NaOH) were obtained from Merck, Germany. Tris base, low melting agar, agarose, ethylene diamine tetra‐acetic acid (EDTA), RNAse, Tris‐acetate EDTA buffer, ethidium bromide (EtBr), Phosphate buffer and gluteraldehyde were purchased from HiMedia. Glacial acetic acid, hydrochloric acid (HCl), ethyl alcohol, chloroform, isoamyl alcohol and isopropanol were procured from Fischer Scientific.
2.2 Hematite synthesis, characterisation and preparation of exposure dosages
To begin with, iron precursors (1 M FeSO4 and 2 M FeCl3) were mixed properly in de‐ionised water (50 ml). Second, 10 ml of 20% w/v fresh garlic extract was added to the medium. Subsequently, precipitation was completed by the addition of 20 ml of 2 M NaOH. Agitation time of 10 min, 800 rpm stirring speed and 70°C temperature was maintained for each step throughout the reaction. The colloidal suspension was repeatedly washed and dried. Further, UV‐visible and Infra‐Red spectral characteristics of the nanoparticles were checked using Jasco V‐670 absorption spectrometer and Shimadzu IRAffinity‐1S Fourier transform infrared spectrophotometer (FTIR), respectively. The shape of the nanoparticles was determined using Zeiss Ultra 55, scanning electron microscope (SEM), while Philips CM 200 transmission electron microscopic (TEM) system was used for verifying the size of the nanostructures. Crystal structure of HNP was analysed using D‐8 Advance X‐Ray powder diffractometer (Bruker, Germany). Nanopartica SZ‐100 particle analyser (Horiba, Kyoto) was used to measure hydrodynamic radius and zeta potential of the nanoparticles. Magnetic nature of HNP was assessed by vibration spectrum magnetometer (Lakeshore VSM 7410). Different treatment dosages of nanoparticle were prepared as per Pakrashi et al. [21] with slight modifications. In brief, nanoparticle stock solution (1000 mg/L) was dispersed in de‐ionised water using Sonics Vibra cell ultrasonicator (100 W, 40 kHz for 30 min). The required HNP suspensions (20–100 mg/L) were prepared by appropriately diluting the stock solution and subsequently, investigated for their hydrodynamic size and zeta potential values.
2.3 Genotoxicity study on onion root tips
2.3.1 Design of test system and A. cepa root tip study
Healthy red cultivar onion bulbs (average wt: 25 g) were grown in the sterile water system at room temperature and dark conditions till roots attained an average 3 cm length. Subsequently, nanoparticles were applied to the test system in a concentration range of 20–100 mg/L for a time period of 24 h. Onion roots grown in de‐ionised water was considered as control. Root tips were rinsed thoroughly and sliced, pooled in freshly prepared carnoy's fixative (3 ethyl alcohol: 1 glacial acetic acid) and stored in refrigerator at 4°C for further use. Harvested root tips were acid hydrolysed (0.1 N HCl, 60°C, 2–3 min) and crushed in 1% acetocarmine for about 3–5 min. After blotting out excess stain, slides were observed under microscope (Olympus CKX41 inverted microscope) at both 400× and 1000× magnification for chromosomal study. At least, three replicas were taken for cytogenetic study and 1000 cells were considered for mitotic scoring of each replica. Similar test system and protocol for slide preparation were also employed by Sundar et al. previously [22]. Different mitotic parameters, such as mitotic index (MI), phase index (PI), chromosomal aberration (CA) and specific chromosomal aberration (SCA) were calculated as per previous literature works [21, 23]
| (1) |
| (2) |
| (3) |
| (4) |
2.3.2 Comet assay
Comet assay was carried out as per Ghosh et al. [24] with few changes. About 100 mg of root samples (pre‐incubated in ice) was gently cut to small pieces in 500 µl of ice‐cold 0.5 mM Tris buffer, pH 7.5. Root nuclear suspension was carefully pipetted out in the middle portion of glass slides coated with 1% low melting agar. Electrophoresis was carried out for slides placed in horizontal electrophoresis tank (Thermo Scientific Owl EasyCast™ B1 type tank) containing alkaline electrophoresis buffer (0.3 mM NaOH and 1 mM EDTA; pH > 13) for 30 min, 4°C, 50 V. Neutralisation of the slides was carried out by dipping in 400 mM Tris, pH 7.5 for 5 min, followed by staining with 20 µg/ml EtBr solution. Excess stain was wiped off and immediately slides were visualised using Weswox FM‐3000 fluorescent microscope for any apparent tailing. Each experiment was repeated thrice. Along with control, onion roots were inspected for the effect of three nanoparticle concentrations (low: 20, medium: 60 and high: 100 mg/L).
2.3.3 Root DNA extraction and scanning electron microscopy of onion root tips
Root samples (50 mg) were taken and DNA isolation was carried out as per cetyl trimethylammonium bromide (CTAB) method, reported earlier [25]. DNA pellet was air‐dried, dissolved in TE buffer and treated with 2 µl of RNAse (1 mg/ml). The purity of the sample was checked by measuring absorbance at 260 and 280 nm. For the purpose of loading, 2.5% agarose gel prepared in 1× Tris acetate EDTA buffer, containing 2 µl EtBr was used. Electrophoresis was carried out at 100 V at room temperature for a time period of 45 min. A 100 bp ladder (HiMedia catalogue no: MBT130‐200LN) was loaded as reference and analysis of the gel was carried out using Bio Rad Gel Doc™ XR gel documentation System. Untreated as well as treated specimens (20, 60 and 100 mg/L) were analysed for the presence of smearing of DNA.
SEM (Zeiss EVO 18) was used for detecting any morphological changes in the onion root tips. For root tip fixation, 2% gluteraldehyde in 0.05 M phosphate buffer of pH 7.2 was used, while drying was carried out using increasing concentrations of ethyl alcohol (20–100%) followed by incubation in hot air oven at 45°C for 48 h. Sample preparation technique for electron microscopy analysis has been outlined by Guha et al. [26].
2.4 Seed germination study
Effect of nanoparticles on seed germination was tested using five common crop plants: moong (Vigna radiata), wheat (Triticum aestivum), fenugreek/methi (Trigonella foenum‐graecum), Bengal gram (Cicer arietinum) and broad bean (Vicia faba). At first, seeds were surface sterilised using 10% sodium hypochlorite solution and thoroughly washed to remove any trace of impurity. Thereafter, soaking of seeds was carried out in either distilled water (control) or different HNP suspensions for 3 h. Clean petri dishes (100 mm × 15 mm) were taken and two layers of sterile filter paper were arranged in the bottom portion. Ten seeds were placed per plate in equidistant manner and about 7 ml of either sterile water (control) or nanoparticles suspension (test) was added in each petri dish. Samples were incubated at room temperature under dark condition. Germination patterns of the model plants were studied for a time period of 24–48 h. Seeds were considered to be germinated once the radical was extended by at least 2 mm [27, 28]. Impact of HNP on seed germination was examined on the basis of average root length, % germination, fold change in weight and vigour index. Lin and Xing [27] had also previously reported comparable protocol for demonstrating the effect of nanoparticles on seed germination. Germination parameters were calculated using the below‐mentioned formula, reported in previous studies [29]
| (5) |
| (6) |
| (7) |
2.5 Statistical analysis
Each experimental procedure was performed in triplicate and values were expressed as average ± standard deviation. Nanoparticle induced change in root mitotic activity and seed germination were analysed initially by single way analysis of variance (ANOVA) and later by student's t ‐test for HNP concentration in the range of 20–100 mg/L. The independent groups used for statistical analysis of onion root mitotic activity were mitotic index and phase percentages (P%, M%, A% and T%), while five model plants (moong, wheat, methi, Bengal gram and broad bean) were considered as groups for germination behaviour study. Sigma plot 12 software was used for the analysis process and values having p ‐value ≤0.05 were considered statistically significant.
3 Results and discussion
3.1 Synthesis of HNPs
Hematite is an important iron oxide and in the current study, it was prepared by a biogenic protocol using fresh garlic extract. Entire reaction was highly reproducible and was completed in a short span of 30 min at 6.7 pH. High temperature caused the hydrolysis of iron precursors [30] whilst the addition of plant extract led to reduction of Fe3+ to Fe2+ [31, 32]. Addition of NaOH provided the necessary hydroxyl ions which led to completion of precipitation reaction indicated by dark coloured precipitate [33, 34]. Similar plant extract‐based reduction of nanoparticles has also been detailed by several earlier researchers [31, 32].
3.2 Nanoparticle characteristics
Scanning electron micrograph (Fig. 1 a) together with results from TEM analysis (Fig. 1 b) demonstrated nanoparticles of spherical morphology having an average diameter of 10–25 nm.
Fig. 1.
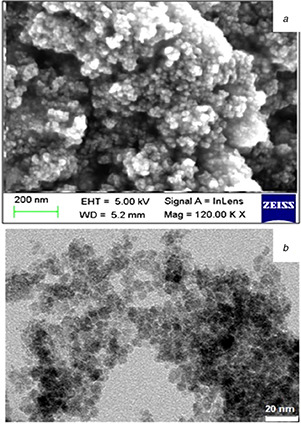
Morphological characterization of HNP
(a) SEM micrograph and (b) TEM image
UV‐visible absorbance spectrum (Fig. 2) of the nanoparticles was found to be centred at 300 nm, referring to direct electronic transition of 2p orbital in O2 −1 to 3d orbital in Fe3+ [35, 36].
Fig. 2.

UV‐visible absorbance spectrum of HNP
Infrared spectrum (Fig. 3 a) demonstrated characteristic peaks for Fe‐O bond at a wave number of 522 cm−1 [36, 37]. Along with typical peak for iron oxide, other peaks were present at 1099, 1622 and 3217 cm−1 representing carbonyl, carboxyl and hydroxyl groups, respectively. Presence of accessory peaks was possibly due to capping by the garlic extract employed in the synthesis step (FTIR spectrum being provided in Fig. 4) [31, 37]. X‐ray diffraction study (Fig. 3 b) indicated presence of different diffraction angles (2θ values) matching to the phase planes of hexagonal α‐Fe2 O3 crystal structure (JCPDS file number: 33‐0664): 24.08 (012), 33.08 (104), 35.56 (110), 40.8 (113), 49.38 (024), 54 (116), 57.52 (018), 62.58 (214), 64.4 (300) and 71.9 (1010). Vibration spectrum magnetometry measurement (Fig. 3 c) revealed superparamagnetic nature of the nanoparticle and a saturation magnetisation of 11.96 emu/g. Normally, hematite particles which possess diameter in the range of 25–30 nm, demonstrate magnetic spin arrangements in such a way that coercivity and remanence become almost negligible, while hysteresis loop takes a sigmoidal shape characteristic of superparamagnetic particles [38].
Fig. 3.

Analysis of chemical, structural, magnetic and colloidal properties of nanoparticle
(a) Image for FTIR spectrum, (b) X‐ray diffraction analysis, (c) Vibration spectrum magnetometry analysis of HNP, (d) Graph for measurement of size and zeta potential of hematite particles at different concentration dosages
Fig. 4.

FTIR profile of aqueous garlic extract
Further to particle characterisation, different exposure concentrations were prepared by diluting 1000 mg/L stock. As depicted in Fig. 3 d, nanoparticle dispersions showed comparable values for particle size and zeta potential for the different treatment conditions. Moreover, HNP demonstrated good colloidal stability for all the studied concentrations. The possible reason can be reduced agglomeration because of steric repulsion shown by particles possessing zeta potential values higher than ±25 mV [39].
3.3 Onion root tips genotoxicity study
3.3.1 Effect on mitotic index and phase index
Control sample exhibited a mitotic index of 65.13 ± 1.64 and presence of normal divisional stages. A slight increase was observed in the percentage of dividing cells, until the application of 60 mg/L HNP, beyond which value was relatively lowered. At dosage concentration of 100 mg/L, value of mitotic index (61.9 ± 1.5%) was reduced by about 5% compared to that of the control. For the different exposure concentrations tested, prophase was observed as the most prominent mitotic stage. Additionally, percentage of cells present in prophase was found to be consistent for both treated and untreated samples. It was noticed, there was not much difference in percentage of cells entering metaphase (M%), anaphase (A%) or telophase (T%) until application of 80 mg/L HNP. However, further increase in nanoparticles dosage caused a slight decrease in phase index value for all the divisional stages except prophase. Fig. 5 represents the observed divisional stages in onion root samples, while Table 1 summarises the mitotic parameters reported before and after nanoparticle treatment.
Fig. 5.
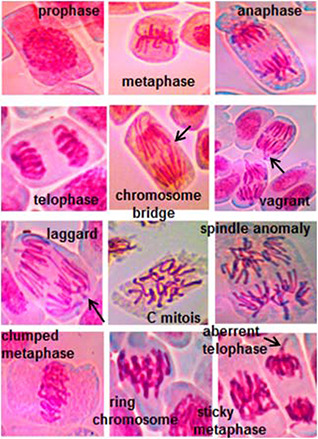
Divisional stages observed in onion root tip slides exposed to different HNP concentrations
Table 1.
Mitosis scoring and % chromosomal aberration of onion root tips exposed to 20–100 mg/L HNP
| Mitotic parameters | Control | 20 mg/L | 40 mg/L | 60 mg/L | 80 mg/L | 100 mg/L | |
|---|---|---|---|---|---|---|---|
| P (%) | N | 91.1 ± 1.3 | 92.84 ± 1.51 | 93.1 ± 1.28 | 93.23 ± 1.15 | 93.97 ± 0.92 | 92.92 ± 0.98 |
| AN | 0 ± 0 | 0 ± 0 | 0 ± 0 | 0 ± 0 | 0.239 ±0.03 | 0.594 ± 0.04 | |
| M (%) | N | 2.342 ± 0.35 | 2.97 ± 0.67 | 2.55 ± 0.77 | 2.11 ± 0.49 | 1.83 ± 0.31 | 0.832 ± 0.13 |
| AN | 0 ± 0 | 0.12 ± 0.046 | 0.13 ± 0.04 | 0.411 ± 0.07 | 0.786 ± 0.06 | 1.664 ± 0.1 | |
| A (%) | N | 2.443 ± 0.42 | 1.13 ± 0.087 | 1.3 ± 0.09 | 1.12 ± 0.056 | 0.876 ± 0.07 | 0.79 ± 0.063 |
| AN | 0 ± 0 | 0.11 ± 0.032 | 0.32 ± 0.02 | 0.587 ± 0.02 | 0.88 ± 0.05 | 0.95 ± 0.11 | |
| T (%) | N | 4.07 ± 0.37 | 2.95 ± 0.28 | 2.6 ± 0.49 | 2.54 ± 0.51 | 2.3 ± 0.42 | 2.1 ± 0.27 |
| AN | 0 ± 0 | 0 ± 0 | 0 ± 0 | 0 ± 0 | 0 ± 0 | 0.15 ± 0.012 | |
| MI (%) | 65.13 ± 1.64 | 67.1 ± 1.78 | 70.7 ± 1.41 | 72.16 ± 1.3 | 69.33 ± 1.1 | 61.9 ± 1.5 | |
| CA (%) | 0 ± 0 | 0.23 ± 0.037 | 0.45 ± 0.02 | 0.998 ± 0.05 | 1.901 ± 0.046 | 3.358 ± 0.13 | |
P (%), M (%), A (%) and T (%) refer to different phase indexes, prophase, metaphase, anaphase and telophase, respectively; MI (%) and CA (%) indicate mitotic index and chromosomal aberration %, respectively; ‘N’ and ‘AN’ refer to number of normal and abnormal chromosomes, respectively.
3.3.2 Chromosomal aberration at different exposure concentrations
Values for percentage chromosomal aberration was found to be considerably less for all the tested HNP concentrations. At higher nanoparticles dosages (80–100 mg/L), aberrant chromosomes were visualised but their percentage abnormality was found to be very low (3.358 ± 0.13% at 100 mg/L exposure). As for specific chromosomal aberration, few instances of dis‐oriented metaphase chromosomes or laggards were noticed for 20 mg/L HNP concentration. For 40 mg/L exposure, common types of alterations observed were chromosome bridges, laggards, improperly aligned metaphase chromosomes etc., while spindle abnormality was found to be frequent at 60 mg/L dosage. For higher dosages (80–100 mg/L), most of the common chromosomal abnormalities (sticky/clumped chromosome, bridges, laggards, chromosome rings, c‐metaphase, telophase with disoriented chromosome, prolonged prophase) were observed at a low frequency. Column graph showing the percentage of specific chromosomal aberration for different treatment groups is presented in Fig. 6 a.
Fig. 6.

Effect of HNP on cytological and genetic characteristics of onion roots
(a) Image for percentage of specific chromosomal abnormality at different treatment condition, (b) Image for DNA laddering experiment, Lane 1, 2, 3, 4 and 5 are 100 kb DNA ladder, control, 20, 60, 100 mg/L treated root samples, (c) Comet assay of onion root samples at different treatment conditions
Observed chromosomal abnormalities may be explained on the basis of the small amount of biochemical change in chromosome, spindle fibres or cytoplasm of dividing cells owing to nanoparticle intervention. Spindle fibres are protein microstructures, consisting of microtubules which interact with motor proteins (dyneins and kinesins) and thereby aid in chromosome movement and separation [40, 41]. Alteration in spindle fibre structure, such as de‐polymerisation of spindle protein usually leads to difficulty in chromosome separation, shift in the division poles and formation of multiple poles [40, 41, 42]. Furthermore, other factors such as improperly folded chromosomes result in sticky chromosomes, while cross‐linking of chromosomal proteins causes difficulty in chromosomal separation [43, 44]. Chromosome bridges are usually formed, because of continuous breaking and joining of chromosomes, while change in the cytoplasm viscosity has been associated with abrupt spindle assembly, C‐metaphase and change in ploidy level [23, 44].
3.4 DNA damage study (DNA laddering, comet study)
DNA extracted using a modified CTAB method showed OD260 /OD280 value of 1.91 which indicated DNA of good quality, devoid of RNA and protein impurities. In the studied treatment dosages (20, 60 and 100 mg/L), no smearing of DNA was relevant compared to the control sample. However, at 100 mg/L, the intensity of the DNA band was slightly faint suggesting relatively low DNA recovery. DNA smear analysis for the onion root samples is presented in Fig. 6 b. Comet assay or single cell gel electrophoresis is a very sensitive technique to determine the extent of nucleic acid damage in the single cell [20]. Nuclear suspensions are generally embedded in low melting agar which gets lysed under alkaline condition. When electrophoresis is performed, damaged DNA being unfolded protrudes out towards the anode resembling the structure of a comet [20, 24]. Higher is the tailing, larger is the damage to the onion root DNA [24]. Comet assay for the treated and control root sample is exhibited in Fig. 6 c. No tailing was observed for 20 and 60 mg/L dosages, while 100 mg/L reported slight tailing indicating negligible DNA damage.
3.5 Root morphological study
Morphology of roots treated with different HNP concentrations and that grown in sterile water is presented in Fig. 7. As per the scanning electron micrograph, samples treated with 20 mg/L nanoparticle concentration showed typical, undamaged and regularly shaped cells compared to the control. There were no signs of any tearing, shrinkage or internalisation of nanoparticles. At exposure to 60 mg/L HNP concentration, some amount of shrinkage of cells was observed, while the increase in dosage up to 100 mg/L, resulted in increased cell shrinkage. Also, presence of HNP on root surface was ascertained from Fig. 7 d. However other signs apart from shrinkage were not evident in the electron micrograph results.
Fig. 7.

Scanning electron micrograph of onion root tips at
(a) Control condition, (b) Exposed to 20 mg/L of HNP concentration, (c) Exposed to 60 mg/L of HNP concentration, (d) Exposed to 100 mg/L of HNP concentration (arrow represents nanoparticles present on the root surface)
3.6 Impact of nanoparticles on plant physiological parameters
Effect of HNP was studied on germination properties of five crop plants, moong, wheat, fenugreek/methi, Bengal gram and broad bean in the concentration range of 20–100 mg/L. Percentage germination of the crops in the presence of HNP is illustrated in Fig. 8 a. A slight increase in the number of germinated seeds was observed up to 60 mg/L for moong and fenugreek, while concentration was 20 mg/L for others. For higher concentrations, a gradual decreasing effect was observed. Additionally, compared to the control, the value of percentage germination was almost similar for all the plants except broad bean which demonstrated 33.33% decrease at 100 mg/L. Average root length (Fig. 8 b) demonstrated an increasing trend up to the application of 60 mg/L HNP for all the studied plants apart from the broad bean which showed an increase until 20 mg/L. Further increase in concentration up to 100 mg/L caused a reduction in average root length for broad bean (23.168%) and methi seeds (34.07%), while lengths were comparable as that of control for others. Fold change in weight (Fig. 8 c) appeared to be almost equivalent to that of control for all the plants apart from methi which demonstrated an increase until 60 mg/L. Variation in vigour index (Fig. 8 d) for the model plants was found to be analogous to that of germination attributes in presence of HNP. Enhanced vigour index was observed until the application of 60 mg/L for moong and methi seeds, while optimal concentration was found to be 20 mg/L for others.
Fig. 8.

Image for impact of HNPs on
(a) % germination, (b) Root length, (c) Fold change in weight, (d) Vigour index for five crop plants moong, wheat, methi, gram and broad bean, respectively
To summarise, germination response of the aforementioned crop plants followed almost a similar pattern upon exposure to varying nanoparticle concentrations. The agronomic traits reportedly displayed a positive effect with an increase in nanoparticles dosage up to a certain concentration (20 mg/L for broad bean and remaining 60 mg/L for others), beyond which either a decrease or a static effect was noted. Pariona et al. [19] and Yuan et al. [45] have also pointed out the similar enhancement of growth traits at low nanoparticles dosage in Zea mayz and Capsicum annuum, respectively. Recent findings by Boutchuen et al. [46] and Jeyasubramanian et al. [47] have also shed light on HNPs associated augmented growth in four legumes and spinach, respectively. Thus, our results further support the biological impact of HNPs and its possible agricultural applications. Hematite is chemically composed of iron, an essential nutrient required for plant growth. Iron is an important constituent of several proteins and is required in electron transfer chain, porphyrin and chlorophyll biosynthesis as well as activation of several enzymes [6, 47]. However, iron availability is mainly limited by its redox potential and soil pH because of which 30% of soil remains in an iron‐deficient condition [6, 47]. IONPs such as HNP possess unique physiochemical properties and may be used for improving iron availability of deficient soils. It can play similar role as that of phytoferritin and assist in seed germination by breaking open the seed coat [19]. However, HNP dosages should be used sensibly, as iron concentration beyond critical limit has been associated with oxidative stress and adverse effects on plant growth [5, 6, 8]. Additionally, biological effects of HNP have also found to vary between different plant species [19, 44]. Thus, optimal dosages should be identified for each plant type and overall impact of nanoparticles must be checked before applying them for crop improvement.
3.7 Statistical analysis
Single way ANOVA for different plant physiological parameters in response to the application of nanoparticles is presented in Table 2. For each of the studied factors, the calculated F value was found to be less than the table value (F crit). The magnitude of p ‐value for onion root mitotic activity was 0.999999, while values obtained for seed germination parameters, such as germination index, root length, fold change in weight and vigour index were 0.2589, 0.9066, 0.999796 and 0.242, respectively. As value for F calculated was less than F crit and p ‐value ≥0.05, variations between the different parameters were not statistically significant. Furthermore, multiple comparison results using student's t ‐test (Table 3) also yielded similar results of p ‐value above 0.05 and value for t table ≥t experimental [23]. On the whole, statistical analysis on different plants indicated that there was no significant variation in means for control and treatment samples with respect to the mitotic activity or the germination behaviour. Hence, prepared nanoparticles were not found to cause any significant cytotoxicity on the stated plant models.
Table 2.
Single‐factor ANOVA table for plant physiological responses with and without nanoparticle treatment
| Source of variation | SS | df | MS | F | p ‐value | F ‐crit |
|---|---|---|---|---|---|---|
| onion root tip study | ||||||
| mitotic parameters of onion roots | ||||||
| between groups | 20.86314 | 5 | 4.172627 | 0.002175 | 0.999999 | 2.620654 |
| within groups | 46,043.21 | 24 | 1918.467 | |||
| total | 46,064.07 | 29 | ||||
| seed germination studies | ||||||
| germination index | ||||||
| between groups | 575.21 | 5 | 115.04 | 1.402 | 0.2589 | 2.621 |
| within groups | 1968.88 | 24 | 82.04 | |||
| total | 2544.09 | 29 | ||||
| root length | ||||||
| between groups | 0.196 | 5 | 0.039 | 0.3023 | 0.9066 | 2.620654 |
| within groups | 3.112 | 24 | 0.13 | |||
| total | 3.31 | 29 | ||||
| fold change in weight | ||||||
| between groups | 0.064 | 5 | 0.013 | 0.021 | 0.999796 | 2.620654 |
| within groups | 14.81 | 24 | 0.62 | |||
| total | 14.88 | 29 | ||||
| vigour index | ||||||
| between groups | 595 | 5 | 118.9993 | 1.452 | 0.242 | 2.621 |
| within groups | 1967.4 | 24 | 81.97663 | |||
| total | 2562.44 | 29 | ||||
SS: sum of squares, df: degree of freedom, MS: mean square, F : calculated value of F, F crit: table value of F at given df.
Table 3.
Paired t ‐test for plant physiological responses with and without nanoparticle treatment
| Statistical parameters | Comparison of treatment with control, mg/L | Mean values for different treatment conditions | t statistic | t critical | p ‐value |
|---|---|---|---|---|---|
| mitotic parameters in onion root tips; n : 5, df: 4 mean for control 33.017 | 20 | 33.398 | −0.55 | 2.78 | 0.61 |
| 40 | 34.05 | 0.8 | 2.78 | 0.47 | |
| 60 | 34.232 | −0.76 | 2.78 | 0.49 | |
| 80 | 33.6612 | −0.53 | 2.78 | 0.62 | |
| 100 | 31.7084 | 1.56 | 2.78 | 0.097 | |
| germination index; n: 5, df: 4 mean for control condition: 88.67 | 20 | 92 | −1.83 | 2.78 | 0.142 |
| 40 | 86 | 1.21 | 2.78 | 0.294 | |
| 60 | 90.67 | −0.47 | 2.78 | 0.666 | |
| 80 | 80 | 1.463 | 2.78 | 0.217 | |
| 100 | 81.99 | 1.101 | 2.78 | 0.333 | |
| root length; n: 5, df: 4 mean for control condition:1.027 | 20 | 1.111 | −1.12 | 2.78 | 0.33 |
| 40 | 0.9712 | 1.27 | 2.78 | 0.27 | |
| 60 | 1.069 | −0.34 | 2.78 | 0.75 | |
| 80 | 0.9493 | 0.79 | 2.78 | 0.47 | |
| 100 | 0.8663 | 1.89 | 2.78 | 0.13 | |
| fold change in weight; n: 5, df: 4 mean for control condition: 2.341 | 20 | 2.39 | −0.521 | 2.78 | 0.63 |
| 40 | 2.412 | −1.269 | 2.78 | 0.27 | |
| 60 | 2.414 | −0.566 | 2.78 | 0.601 | |
| 80 | 2.413 | −1.066 | 2.78 | 0.346 | |
| 100 | 2.291 | 0.366 | 2.78 | 0.732 | |
| vigour index; n: 5, df: 4 mean for control condition: 89.74 | 20 | 93.18 | −1.823 | 2.78 | 0.142 |
| 40 | 87.01 | 1.248 | 2.78 | 0.28 | |
| 60 | 91.79 | −0.467 | 2.78 | 0.665 | |
| 80 | 81 | 1.455 | 2.78 | 0.22 | |
| 100 | 82.93 | 1.12 | 2.78 | 0.325 |
where n is sample size, df: degree of freedom, t statistic: calculated value of t, t critical: table value of t at the given df.
4 Conclusion
In this paper, we have evaluated the biological impact of green synthesised HNPs on various plant models in the concentration range of 20–100 mg/L. Microscopic analysis, DNA damage study, electron micrograph of onion roots and germination assay on various crop plants indicated that biosynthesised HNP barely showed any apparent toxicity. In addition, the overall effect of nanoparticles on plants was found to depend on HNP exposure concentration. While lower concentrations led to increased mitotic activity in onion roots and favoured the growth of crop plants, higher dosages (80–100 mg/L) demonstrated minor inhibitory effects and associated hallmarks. However, the negative effects observed were not statistically significant. Agricultural traits were found to be enhanced until 20 mg/L HNP application for broad bean and 60 mg/L for others. Thus, germination characteristics were found to vary between different plant species with almost a similar growth trend against varying HNP concentration. The present findings augment our knowledge on effect of HNP on food crops and suggest their possible use as nanoiron source in iron‐deficient soils.
5 Acknowledgments
Authors are thankful to Vellore Institute of Technology for providing financial, technical and instrumentation facilities to carry out the research work. Authors also thank the Centre for Nano Science and Engineering, IISc, Bangalore for SEM analysis and IIT, Madras for vibration spectrophotometry characterisation. Authors wish to extend special thanks to Dr H.G. Nagendra, Professsor & Head, Dept. of Biotechnology, Sir MVIT, Bangalore for allowing us to carry out DNA damage study.
6 References
- 1. Wu W. Wu Z. Yu T. et al.: ‘Recent progress on magnetic iron oxide nanoparticles: synthesis, surface functional strategies and biomedical applications’, Sci. Technol. Adv. Mater.., 2015, 16, (2), p. 023501 [DOI] [PMC free article] [PubMed] [Google Scholar]
- 2. Basavegowda N. Mishra K. Lee Y.R.: ‘Synthesis, characterization, and catalytic applications of hematite (α‐Fe2O3) nanoparticles as reusable nanocatalyst’, Adv. Nat. Sci. Nanosci. Nanotechnol., 2017, 8, (2), p. 025017 [Google Scholar]
- 3. Dissanayake N.M. Current K.M. Obare S.O.: ‘Mutagenic effects of iron oxide nanoparticles on biological cells’, Int. J. Mol. Sci., 2015, 16, (10), pp. 23482 –23516 [DOI] [PMC free article] [PubMed] [Google Scholar]
- 4. Lead J.R. Batley G.E. Alvarez P.J.J. et al.: ‘Nanomaterials in the environment: behavior, fate, bioavailability, and effects‐An updated review’, Environ. Toxicol Chem., 2018, 37, (8), pp. 2029 –2063 [DOI] [PubMed] [Google Scholar]
- 5. Ruttkay‐Nedecky B. Krystofova O. Nejdl L. et al.: ‘Nanoparticles based on essential metals and their phytotoxicity’, J. Nanobiotechnol., 2017, 15, (1), p. 33 [DOI] [PMC free article] [PubMed] [Google Scholar]
- 6. Morrissey J. Guerinot M. L.: ‘Iron uptake and transport in plants: the good, the bad, and the ionome’, Chem. Rev., 2009, 109, (10), pp. 4553 –4567 [DOI] [PMC free article] [PubMed] [Google Scholar]
- 7. Stueckle T. Antonini J. Rojanasakul Y. et al.: ‘Potential toxicity and underlying mechanisms associated with pulmonary exposure to iron oxide nanoparticles: conflicting literature and unclear risk’, Nanomaterials, 2017, 7, (10), p. E307 [DOI] [PMC free article] [PubMed] [Google Scholar]
- 8. Rastogi A. Zivcak M. Sytar O. et al.: ‘Impact of metal and metal oxide nanoparticles on plant: a critical review’, Front. Chem., 2017, 12, (5), p. 78 [DOI] [PMC free article] [PubMed] [Google Scholar]
- 9. Rico C.M. Majumdar S. Duarte‐Gardea M. et al.: ‘Interaction of nanoparticles with edible plants and their possible implications in the food chain’, J. Agric. Food Chem., 2011, 59, (8), pp. 3485 –3498 [DOI] [PMC free article] [PubMed] [Google Scholar]
- 10. Bar‐On Y.M. Phillips R. Milo R.: ‘The biomass distribution on earth’, Proc. Natl. Acad. Sci.., 2018, 115, (25), pp. 6506 –6511 [DOI] [PMC free article] [PubMed] [Google Scholar]
- 11. Tripathi D.K. Tripathi A. Shweta et al.: ‘Uptake, accumulation and toxicity of silver nanoparticle in autotrophic plants, and heterotrophic microbes: a concentric review’, Front Microbiol., 2017, 8, p. 07 [DOI] [PMC free article] [PubMed] [Google Scholar]
- 12. Sohail Amara U. Shad S. et al.: ‘In vitro germination and biochemical profiling of Brassica napus in response to biosynthesised zinc nanoparticles’, IET Nanobiotechnol.., 2019, 13, (1), pp. 46 –51 [DOI] [PMC free article] [PubMed] [Google Scholar]
- 13. Thunugunta T. Reddy A.C. Seetharamaiah S.K. et al.: ‘Impact of zinc oxide nanoparticles on eggplant (S. melongena): studies on growth and the accumulation of nanoparticles’, IET Nanobiotechnol.., 2018, 12, (6), pp. 706 –713 [DOI] [PMC free article] [PubMed] [Google Scholar]
- 14. Alidoust D. Isoda A.: ‘Effect of γFe2O3nanoparticles on photosynthetic characteristic of soybean (Glycine max (L.) Merr.): foliar spray versus soil amendment’, Acta Physiol. Plant., 2013, 35, (12), pp. 3365 –3375 [Google Scholar]
- 15. Rui M. Ma C. Hao Y. et al.: ‘Iron oxide nanoparticles as a potential iron fertilizer for peanut (Arachis hypogaea)’, Front. Plant Sci., 2016, 7, p. 815 [DOI] [PMC free article] [PubMed] [Google Scholar]
- 16. Martínez‐Fernández D. Barroso D. Komárek M.: ‘Root water transport of Helianthus annuus L. Under iron oxide nanoparticle exposure’, Environ. Sci. Pollut. Res., 2016, 23, (2), pp. 1732 –1741 [DOI] [PubMed] [Google Scholar]
- 17. Yanga J. Cao W. Rui Y.: ‘Interactions between nanoparticles and plants: phytotoxicity and defense mechanisms’, J. Plant Interact., 2017, 12, (1), pp. 158 –169 [Google Scholar]
- 18. Levan A.: ‘Cytological studies in Allium VI. The chromosome morphology of some diploid species of Allium’, Hereditas, 1935, 20, pp. 289 –330 [Google Scholar]
- 19. Pariona N. Martinez A.I. Hdz‐García H.M. et al.: ‘Effects of hematite and ferrihydrite nanoparticles on germination and growth of maize seedlings’, Saudi J. Biol. Sci., 2017, 24, (7), pp. 1547 –1554 [DOI] [PMC free article] [PubMed] [Google Scholar]
- 20. Santos C.L.V. Pourrut B. Ferreira de Oliveira J.M.P.: ‘The use of comet assay in plant toxicology: recent advances’, Front. Genet., 2015, 6, p. 216 [DOI] [PMC free article] [PubMed] [Google Scholar]
- 21. Pakrashi S. Jain N. Dalai S. et al.: ‘In vivo genotoxicity assessment of titanium dioxide nanoparticles by Allium cepa root tip assay at high exposure concentrations’, PLoS One, 2014, 9, (2), p. e87789 [DOI] [PMC free article] [PubMed] [Google Scholar]
- 22. Syam Sundar L. Anjum N.A. Ferro M.C. et al.: ‘Biocompatibility and biotoxicity of in‐situ synthesized carboxylated nanodiamond‐cobalt oxide nanocomposite’, J. Mater. Sci. Technol., 2017, 33, (8), pp. 879 –888 [Google Scholar]
- 23. Saha N. Dutta Gupta S.: ‘Low‐dose toxicity of biogenic silver nanoparticles fabricated by Swertia chirata on root tips and flower buds of Allium cepa ’, J. Hazard. Mater., 2017, 15, (330), pp. 18 –28 [DOI] [PubMed] [Google Scholar]
- 24. Ghosh M. Bandyopadhyay M. Mukherjee A.: ‘Genotoxicity of titanium dioxide (TiO2) nanoparticles at two trophic levels: plant and human lymphocytes’, Chemosphere, 2010, 81, (10), pp. 1253 –1262 [DOI] [PubMed] [Google Scholar]
- 25. Doyle J.: ‘DNA protocols for plants‐CTAB total DNA isolation’, in Hewitt G.M. Johnston A.W.B. Young J.P.W. (Eds.): ‘Molecular techniques in taxonomy’ (Springer press, Berlin, 1991), pp. 283 –293 [Google Scholar]
- 26. Guha T. Ravikumar K.V.G. Mukherjee A.: ‘Nanopriming with zero valent iron (nZVI) enhances germination and growth in aromatic rice cultivar (Oryza sativa cv. Gobindabhog L.)’, Plant Physiol. Biochem., 2018, 127, pp. 403 –413 [DOI] [PubMed] [Google Scholar]
- 27. Lin D. Xing B.: ‘Phytotoxicity of nanoparticles: inhibition of seed germination and root growth’, Environ. Pollut., 2007, 150, (2), pp. 243 –250 [DOI] [PubMed] [Google Scholar]
- 28.U.S.EPA: ‘Ecological effects test guidelines seed germination / root elongation toxicity test’, 1996.
- 29. Siddiqui M.H. Al‐Whaibi M.H.: ‘Role of nano‐SiO2 in germination of tomato (Lycopersicum esculentum seeds Mill.)’, Saudi J. Biol. Sci., 2014, 21, (1), pp. 13 –17 [DOI] [PMC free article] [PubMed] [Google Scholar]
- 30. Demir A. Topkaya R. Baykal A.: ‘Green synthesis of superparamagnetic Fe3O4 nanoparticles with maltose: its magnetic investigation’, Polyhedron, 2013, 65, (28), pp. 282 –287 [Google Scholar]
- 31. Mahdavi M. Namvar F. Ahmad M. B. et al.: ‘Green biosynthesis and characterization of magnetic iron oxide (Fe3O4) nanoparticles using seaweed (sargassum muticum) aqueous extract’, Molecules, 2013, 18, (5), pp. 5954 –5964 [DOI] [PMC free article] [PubMed] [Google Scholar]
- 32. Awwad A.M. Salem N.M.: ‘A green and facile approach for synthesis of magnetite nanoparticles’, Nanosci. Nanotechnol., 2012, 2, (6), pp. 208 –213 [Google Scholar]
- 33. Maiti D. Manju U. Velaga S. et al.: ‘Phase evolution and growth of iron oxide nanoparticles: effect of hydrazine addition during sonication’, Cryst. Growth Des., 2013, 13, (8), pp. 3637 –3644 [Google Scholar]
- 34. Mascolo M.C. Pei Y. Ring T.A.: ‘Nanoparticles in a large pH window with different bases’, Materials (Basel), 2013, 6, (12), pp. 5549 –5567 [DOI] [PMC free article] [PubMed] [Google Scholar]
- 35. Zangeneh Kamali K. Alagarsamy P. Huang N.M. et al.: ‘Hematite nanoparticles‐modified electrode based electrochemical sensing platform for dopamine’, Sci. World J., 2014, 2014, pp. 1 –13 [DOI] [PMC free article] [PubMed] [Google Scholar]
- 36. Rajendran K. Sen S.: ‘Optimization of process parameters for the rapid biosynthesis of hematite nanoparticles’, J. Photochem. Photobiol. B., 2016, 159, pp. 82 –87 [DOI] [PubMed] [Google Scholar]
- 37. Coates J.: ‘Interpretation of infrared Spectra, A practical approach’, in Meyers R.A. (Ed.): ‘Encyclopedia of analytical chemistry’ (John Wiley & sons press, Chichester, 2000), pp. 10821 –10822 [Google Scholar]
- 38. Özdemir Ö. Dunlop D.J. Berquó T.S.: ‘Morin transition in hematite: size dependence and thermal hysteresis’, Geochem. Geophys. Geosyst., 2008, 9, (10), p. Q10Z01 [Google Scholar]
- 39. Rajendran K. Karunagaran V. Mahanty B. et al.: ‘Biosynthesis of hematite nanoparticles and its cytotoxic effect on HepG2 cancer cells’, Int. J. Biol. Macromol., 2015, 74, pp. 376 –381 [DOI] [PubMed] [Google Scholar]
- 40. Yamada M. Goshima G.: ‘Mitotic spindle assembly in land plants: molecules and mechanisms’, Biology (Basel), 2017, 6, (1), p. 6 [DOI] [PMC free article] [PubMed] [Google Scholar]
- 41. Liu D. Jiang W. Wang W. et al.: ‘Evaluation of metal ion toxicity on root tip cells by the allium test’, Isr J. Plant Sci., 1995, 43, (2), pp. 125 –133 [Google Scholar]
- 42. Rajeshwari A. Suresh S. Chandrasekaran N. et al.: ‘Toxicity evaluation of gold nanoparticles using an Allium cepa bioassay’, RSC Adv., 2016, 6, p. 24000 [Google Scholar]
- 43. McGill M. Pathak S. Hsu T.C.: ‘Effects of ethidium bromide on mitosis and chromosomes: a possible material basis for chromosome stickiness’, Chromosoma, 1974, 47, pp. 157 –166 [DOI] [PubMed] [Google Scholar]
- 44. Liu D. Jiang W. Wang W. et al.: ‘Effects of lead on root growth, cell division, and nucleolus of Allium cepa’, Environ. Pollut., 1994, 86, (1), pp. 1 –4 [DOI] [PubMed] [Google Scholar]
- 45. Yuan J. Chen Y. Li H. et al.: ‘New insights into the cellular responses to iron nanoparticles in Capsicum annuum ’, Sci. Rep.., 2018, 19, (8), p. 3228 [DOI] [PMC free article] [PubMed] [Google Scholar]
- 46. Boutchuen A. Zimmerman D. Aich N. et al.: ‘Increased plant growth with hematite nanoparticle fertilizer drop and determining nanoparticle uptake in plants using multimodal approach’, J. Nanomater., 2019, 6890572, p. 11 [Google Scholar]
- 47. Jeyasubramanian K. Gopalakrishnan Thoppey U.U. Hikku G.S.: ‘Enhancement in growth rate and productivity of spinach grown in hydroponics with iron oxide nanoparticles’, RSC Adv., 2016, 6, pp. 15451 –15459 [Google Scholar]