Abstract
In present study, the effective penetration of radiofrequency (RF) induced gold decorated iron oxide nanoparticles (GS@IONPs) hyperthermia was investigated. The effective penetration depth of RF also the damage potency of hyperthermia was evaluated during histopathology observations which were done on the chicken breast tissue and hepatocellular carcinoma (HCC) models. The thermal damages are well‐ documented in our previous cellular study which was engaged with potency of RF hyperthermia in Epithelial adenocarcinoma (MCF‐7) and fibroblast (L‐929) cells deaths [1]. In recent work, PEGylated iron oxide nanoparticles (IONPs) were used as base platform for gold magnetic nanoparticles (GS@IONPs) formation. The 144.00015 MHz, 180W RF generator was applied for stimulating the nanoparticles. The chicken breast tissue and the hepatocellular tumor model was considered in the experimental section. In histology studies, the structural changes also the effective penetration depth of RF induced nanoparticles was observed through microscopic monitoring of the tissue slices in histology observations (Gazi medical school). The highest damage level was seen in 8.0 µm tissue slices where lower damages were seen in depth of 1.0 cm and more inside tissue. The histology observations clarified the effective penetration depth of RF waves and irreversible damages in the 2.0 cm inside the tissue.
Inspec keywords: nanomedicine, tumours, biomedical materials, cellular biophysics, nanoparticles, gold, cancer, hyperthermia, magnetic particles, iron compounds, radiation therapy
Other keywords: Au‐Fe3 O4 , depth 1.0 cm, depth 8.0 mum, power 180.0 W, size 2.0 cm, frequency 144.00015 MHz, microscopic monitoring, structural changes, hepatocellular tumour model, standing wave ratio, propylene glycol, thermal damages, hepatocellular carcinoma models, radiofrequency hyperthermia, nanoparticle dispersion, tissue alterations, modified tissues, gold shell magnetic nanoparticles, chicken breast tissue, gold‐coated iron oxide nanoparticles, pathology observations, effective penetration depth, histology observations, tissue slices
1 Introduction
Cancer is the second human death cause after cardiac diseases [1]. There is considerable diversity in alternative protocols compared to the standard techniques of tumour treatment. The hyperthermia is rendering the cancer cells that are sensitive in temperatures between 41–45°C (thermal sensitisation) or is destroying the tumour tissue at temperatures above 47°C (thermal ablation) [2]. Different types of energy such as radiofrequency (RF), ultrasound [3], laser [3, 4] and alternating magnetic field [5, 6] were applied for stimulating nanoparticles in hyperthermia. The nanoparticles mediated RF hyperthermia considered as a promising therapy technique that provide combinational treatment in chemotherapy and radiotherapy [7]. In the RF hyperthermia, the external energy is in the form of RF waves around megahertz (MHz) domain. Despite the advantages such as less harmfulness, high‐tech level and cost‐effectiveness, some other factors should be considered including the wave focusing on target, the SAR index as well as the penetration depth [8] should be considered as a potential disadvantageous [9, 10, 11]. The other notable factors that can be marked are nanoparticles morphology and the efficient RF wavelength that needed to provide the activation energy [12]. In all of the energy sources, the penetration depth potency and scattering power to the tissue are crucial which provides the high impact on the efficiency of the process. According to the Bottomley et al. work, the hepatoma liver D23 tumour had non‐significant relative permittivity in comparison to other tissues such as heart, kidney, brain and lung against RF induction. It means that the resistivity (Ω.m) in the hepatoma tumour tissue is in the lower levels [8]. Bottomley also showed that the RF had inverse correlation with the resistivity of the tissue. There are several cellular studies documented about focal hyperthermia for removal of hepatocellular tumour implemented by Nikfarjam et al. [13]. Also, Golberg et al. [14] studied the tumour tissue coagulation in a pig liver, which was caused by RF ablation. Petersen studied the same case, and showed that the RF power has direct effect on the lesion size (tumour disruption) [15]. According to the Peterson team results, the RF power is critical in the ablation mechanism. The mentioned researches showed that the RF hyperthermia can be emerged as a proper candidate for novel tumour therapy. The other important factors affecting the RF hyperthermia efficiency are focusing on the frequency domain and conversion rate of RF to heat energy compared to the conventional protocols of hyperthermia [16, 17]. The non‐invasive indirect energy in RF hyperthermia needs to provide optimised energy delivery with sufficient penetration into the tissue for exciting the nanoparticles, which are in the target region [18, 19]. Due to the non‐significant harmful effects, a range of the 13.56, 27.12 and 54.24 MHz of electromagnetic frequencies are commonly used in hyperthermia protocols [20]. As mentioned previously, the lower values of specific absorption rate (SAR) and appropriate nanoparticles (GS@IONPs), which is studied in our previous work, are necessary for cancer cells deaths through RF hyperthermia [21, 22]. The implication of energy diffusion and the damageable effect of RF induced nanoparticles on the morphology of tissue was considered as a challengeable area in many research articles [23]. The gold‐iron oxide (core‐shell) nanoparticles in our previous study presented significant advantages in case of malignant cells disruption compared to other nanoparticles as well [11].
2 Experimental section
Ferric chloride hydrate (FeCl3, 6H2 O), 1,2‐Propylene glycol, Urea, succinic acid (99%), ethylene glycol (EG), sodium citrate for fabricating of IONPs were supplied from Sigma‐Aldrich (Germany). The nitric acid (HNO3), hydrogen peroxide (H2 O2) and (3‐aminopropyl) triethoxysilane (APTES, ≥98%) was purchased from Merck (Germany) for modification of synthesised IONPs and their functionalising with NH2. For reducing of atomic gold on the iron oxide nanoparticles (IONPs), tetrachloroauric acid (III) trihydrate (HAuCl4, 3H2 O), sodium borohydride (NaBH4), Tetrakis (hydroxymethyl) phophonium chloride (which is called as THPC hereafter) were supplied from Sigma‐Aldrich (Germany). Chemicals were used as analytical grades without more purification. The Milli Q grade water (∼18 Ω) was used along all of the experiments.
The GS@IONPs were synthesised according to the multi‐stage method that is presented in further steps. Figs. 1 and 2 present the synthesis methods in a glance. We established the one‐pot synthesis of the IONPs via polyethylene‐coated ‘solvothermal’ protocol. Ferric chloride hydrate (0.81 g), urea (1.8 g) and succinic acid (0.118 g) were dissolved in ethylene glycol (30 ml) under glass impeller equipped stirrer. The solution was poured into a Teflon chamber, which was placed into the stainless steel reactor. The reactor was heated at 200°C for an overnight. The black precipitated contents of reactor were collected by a strong magnet after cooling the reactor. The separated part was washed three times with both ethanol and deionised water and dried in vacuum oven at 70°C for 6 h. The details were mentioned in supplementary data. The size distribution of nanoparticles was investigated by ζ‐sizer, also the morphology of nanoparticles were carried out in transmission electron microscopy (TEM).
Fig. 1.

Schematic illustration of ultrafine gold nanoparticles (UFAuNPs) process
Fig. 2.
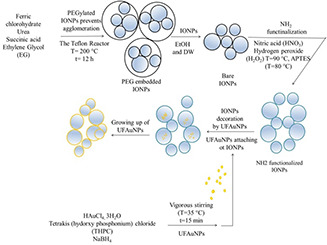
Schematic illustration the nanoparticles geometry in synthesis stages in case of GS@IONPs
2.1 Pre‐treatment and functionalisation of IONPs
In order to attach the gold nanoparticles on the surface of IONPs, it is needed to provide the surface functionalisation of IONPs by amine (NH2) groups. In order to have sufficient active surfaces of IONPs for attachment of gold dots, the PEG molecules removed by several times washing of PEGylated IONPs with EtOH and deionised water. As pre‐stages of NH2 functionalisation of IONPs, the treating of IONPs with nitric acid considered as an essential step. The IONPs (5 ml, 1.3 × 10¹⁵ NP/ml) dispersion was added to a round bottom flask and the diluted nitric acid (65%, 1 M) was added to nanoparticle dispersion to achieve the 1 M final concentration. The pre‐treated IONPs were washed several times with distilled water to achieve the neutral pH. For providing much more hydroxyl groups on the surface of nanoparticles, the nanoparticles surfaces were scratched by treating with hydrogen peroxide (50 ml, 30%) at 90°C for 4 h, and with the amine groups of organosilane (APTES, 140 µl, 2% w/v in ethanol) in the presence of ammonia solution (250 µl, 28–30%) and dry ethanol (40 ml, Analytic grade). The more detailed information about amine modification process mentioned in the supplementary information.
2.2 Gold seeds fabrication
In order to make gold shell on the IONPs, the gold seed synthesised according to the Duff protocol [24]. Briefly, tetrachloroauric acid (III) trihydrate (2 ml, 25 mM from dark‐aged stock) was added to the round bottom flask and the THPC was added to the solution. The THPC (1 ml) mediated gold solution was vigorously mixed with mechanical stirrer at 25°C for 20 min.
The transparent brown colour dispersion approves the synthesis of UFAuNPs. The nanoparticles dispersion was placed in the plastic tube and stored at 4°C. The prepared gold sols (UFAuNPs) couldn't result clear extinction spectra in UV/Vis spectroscopy immediately after synthesis. After couple of the weeks, growing of gold dots (until the 4 weeks) were continued and the UV/Vis extinction spectrum could be appeared in 500–505 nm wavelengths. The analysis of nanoparticles can conducted by the UV/Vis spectroscopy which determines the extinction spectra (absorbance coefficient) wavelength of nanoparticles. The electron microscopy studies of gold sols were performed by applying JEM JEOL 2100F, 200 kV transmission electron microscope (HRTEM).
2.3 Gold shell magnetic (GS@IONPs) nanoparticles
The amine functionalised IONPs were used for gold seeds attachment in this part of study. Different protocols are available for surface decoration of NH2 functionalised IONPs (as core nanoparticles) with gold dots in the literature [25]. In order to grow the gold seeds on the surface of UFAuNPs@IONPs; the gold hydroxide Au x (OH) y was prepared by dissolving of 1.25 mg of potassium carbonate (K2 CO3) in 9.25 ml of deionised water under vigorous mixing for 5 min. Then 400 µl of HAuCl4, 3H2 O (5 mM) was added to flask under aggitation which appears transparent colourless gold solution (gold hydroxide). Then 10 ml of UFAuNPs@IONPs (1.03 × 10¹³ NPs/ml) and 88.5 ml of the gold hydroxide solution added to 45 µl of NaBH4 (0.8 mg/ml) solution for beginning of gold reduction subsequently. The colour of dispersion changes from purple to dark blue that approves formation of the GS@IONPs.
2.4 RF generator
The handmade RF generator were used. More details about RF generator is given in the supported data section (Fig. S2). According to the Winter et al. study [9], the SAR simulations for frequencies from 64 to 600 MHz was studied. The SAR index for 144.00015 MHz (applied in the present work) can be considered as 0.281 (reasonable value). The model tissue was induced by RF exposure after treatment with the nanoparticles. Then the tissue model slices (chicken breast tissue and hepatocellular tissue) were sent to pathology and histology in the appropriate packaging.
2.5 Chicken breast, hepatocellular carcinoma model and RF hyperthermia penetration results
In our previous study, GS@IONPs dispersion was selected as the most effective nanoparticles in RF hyperthermia regarding to the heat generating potency. In the present work, the injury effect of RF hyperthermia was implemented on the tissue models. Hence, the chicken breast and hepatocellular carcinoma (HCC) tissue models with and t = 2.0 cm (thicknesses) slices were prepared. The GS@IONPs dispersed in PBS (200 µl, 30 µg/ml) was used to inject to certain region of tumour models. The model samples were mounted on the antenna where the RF exposures was considerable (10 cm upper the base‐plate). The models fixation on antenna was implemented by using Teflon tape. The tape was used due to the lowest absorption potency of Teflon in case of RF exposures. The RF generator was adjusted at the highest power (180 W) for 10 and 20 min exposure durations. The hepatocellular tumour model and chicken breast tissue was sent to histology/embryology laboratory of Gazi medical school after RF exposures. The entire histology images were given in the supplementary part.
2.6 Histology observations
The HCC (tumour model) and chicken breast slices are prepared as follows; formaldehyde fixations followed by drying in the ethanol and paraffin wax, then impregnation in the metal cassettes for slicing the tissue models with microtome device. Also the haematoxylin and eosin (H&E) staining of the tissues induced RF and nanoparticles interaction regarding to damage model were carried out for histologic microscope observations. The histologic images were resulted to give information about destructive level and penetration depth of RF in the tissues. Histology survey initiation is carried out with biologic sample sectioning in 5 mm, 1.0 and 2.0 cm tissue thicknesses.
3 Results and discussion
The structural analysis of nanoparticles (IONPs, UFAuNPs@IONPs and GS@IONPs) has been represented in Figs. 3 and 4. Figs. 3 A and B is about the crystallography of ethylene glycol (EG) embedded with IONPs and UFAuNPs@IONPs with HRTEM microscope. According to the results (Fig. 3 A), mean diameter sizes of IONPs are 10 nm. Low image quality is due to excess impurities that are created with ethylene glycol. Figs. 3 A and B clarify the both accurate diameter of nanoparticles and the morphology. In Fig. 3 C (XPS analysis by TEM) Fe signal exhibits IONPs and Au signal, represented the shell that coated on the surface of IONPs. The copper signal in Fig. 3 C is related to the copper grid applied for nanoparticles TEM imaging.
Fig. 3.
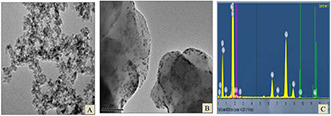
Analysis of synthesised IONPs
(a) Transmission electron microscopy of synthesised IONPs, (b) ultrafine gold nanoparticles attachment on IONPs, (c) XPS elemental analysis of UFAuNPs@IONPs
Fig. 4.
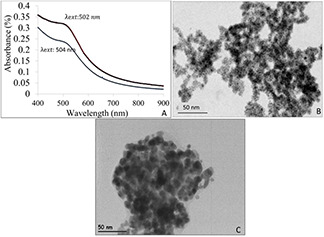
Analysis of gold sols (UFAuNPs);
(a) Absorption spectra of UV/VIS spectrophotometry; 2 weeks (thick line, 502 nm for λ ext) and 4 weeks (thin line, 504 nm for λ ext), respectively, (b) the crystallography image of gold sols (UFAuNPs) scale bar is 50 nm, (c) The morphology of GS@IONPs derived by JEM JEOL 2100F, 200 kV microscope (scale bar, 200 nm)
Fig. 3 A, presented formation of the heterogeneous spherical like nanoparticles. Nanoparticle sizes are ∼10–15 nm. PEG prevented the nanoparticles agglomeration and their clustering. The semi mono‐dispersed nanoparticles prevented formation of individual attachment of gold sols after PEG removals. In Fig. 3 B, the gold seeds on the surface of IONPs act as grow nuclei to create gold shell (GS) on the IONPs.
Fig. 4 A reveals the extinction spectrum of UFAuNPs in a period of 2 and 4 weeks after synthesis. The UFAuNPs synthesised by Duff method didn't resulted obvious absorbance peak in first days after preparation. After one week, clear increasing in visible UV absorbance can be seen. The increasing the excitation wavelengths (λ ext) of UFAuNPs approves the growth of gold seeds. The thick line in Fig. 4 A relates to the standard THPC gold sols and 2 weeks after synthesis where the thin line in the same figure exhibits the (λ ext) 4 weeks after synthesis. Fig. 4B is crystallographic image of UFAuNPs with ∼3–4 nm in diameter synthesised by Duff protocol. The size distribution of nanoparticles in Fig. 4 B reveals the sufficient homogeneity in monodispersed dispersion of UFAuNPs.
The gold shell iron oxide nanoparticles (GS@IONPs) were final morphology in our study. As given in Fig. 4, UFAuNPs performs as nuclei for growing of the gold dots on the surface of core nanoparticles. The surface decoration is time‐dependent reaction which can be partially or completely cover the surface of core. According to Fig. 4 (right), >98% of IONPs have been covered with gold seeds via hydroxide solution of gold. The growth of gold sols (UFAuNPs) was realised by using gold hydroxide solution. The UFAuNPs acts as nuclei for growing gold dots.
3.1 RF hyperthermia method
Heat generating by using RF wave in the presence of metallic nanoparticles was studied in our previous work [11]. RF (144.00015 MHz, 180 W) exposed to the nanoparticles revealed that the highest heat rate records in Fig. 5 was related to the GS@IONPs compared to different nanostructures captured by infrared thermal camera (FLIR i5). As seen in the heat generating curves, nanoparticles dispersions was prepared at 1.03 × 10¹³ NPs/ml concentration. In Fig. 5, long‐dash dot line is related to distilled water with little temperature increasing (35–36.3°C), short dash line is related to AuNRs (35–39°C), dash line is about AuNPs (35–40.5°C) and long dash line is related to GS@IONPs with the highest heat generation rate (35–43.6°C) which reveals 8.6°C in 40 min in the presence of low RF power [180 W with 20% standing wave ratio (SWR)]. In spite of the higher temperature arises of IONPs compared to the GS@IONPs, it was occurred because of the two folds higher concentration of IONPs than GS@IONPs. Hence, GS@IONPs is more effective than IONPs in terms of heat generating.
Fig. 5.
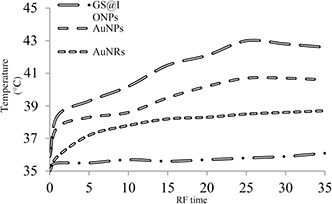
Heat generation differences in nanoparticles dispersions induced by RF exposures
3.2 Pathology observations of chicken breast tissue
In the ex vivo, the penetration depth and structural damages level in the tissue was investigated. Hence, the RF induction in the presence of GS@IONPs was evaluated in this part of study. Combinational effect of RF (10 and 20 min) and nanoparticles in depths of 5 mm, 1 and 2 cm (supported data) were investigated to approve the damageable effect of RF on the tissue. Fig. 6 presents the severe structural changes in the straight muscle fibres of chicken breast tissue occurred via nanoparticles mediated RF hyperthermia. The structural changes results were evaluated by pathology observations after H&E staining. Structural study on the tissue shows obvious disintegration artefacts almost in whole tissue. In some regions, even semi‐coagulation and severe deformation (purple stain) were observed where the RF penetrable regions in different depths were marked by array which proved penetration potential in the presence of RF generator.
Fig. 6.
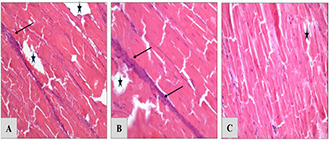
Pathology observation of chicken breast tissue from different depths but in the same direction in RF exposures with nanoparticles presence (10 min RF exposures) The figures are related to 5 mm
(a) , 1 cm (b), 2 cm (c) depths of the unique direction in the tissue. The « mark is RF penetration site and → is thermal injury region
Fig. 7 revealed the different depths of tissue slices (5 mm, 1 and 2 cm) and destruction effect of RF hyperthermia in the presence of nanoparticles on chicken breast tissue. The « marks in Figs. 7 A –C were RF penetration depths which were 5 mm (A), 1 cm (B) and 2 cm (C), respectively. The structural changes were happened in tissue morphology which pointed out as reversible deformation (not significant until reached high temperatures) in the denervated fibre muscle (→ mark). The pathology microscope images were presented in the supported data. In the negative control group, normal muscle fibres illustrate not injured region in the case of nanoparticles absence. Normal straight muscle fibres of negative control group captured by light camera equipped on the Olympus microscope is presented in the supported data. In Fig. 7, ×100 magnification of microscopy and H&E staining of tissue models were implemented.
Fig. 7.

Pathology observation of chicken breast tissue from different depths figures are related to 5 mm
(a) , 1 cm (b), 2 cm (c) depths. The exposures were in the same direction of RF (20 min RF induction) and nanoparticles presence. « RF penetration site, → Thermal injury region
Fig. 6 presented pathology evaluation on chicken breast tissues lesions which were exposed to the RF (10 min) and GS@IONPs incubation. RF exposing results (10 min) exhibit lower structural changes in tissue than those were for 20 min.
In Figs. 6A–C, → mark is related to the morphologic tissue changes were caused by RF and nanoparticles during RF hyperthermia in the depths of 5 mm, 1 and 2 cm of tissue, respectively. The « mark regions in pathology observations are related to the RF penetrable depths. The pathology evaluations in Fig. 6 present lower thermal damages which need to be provided the sufficient target temperature arises for RF ablation in definite area of tissue model. As seen in Fig. 6, the thermal deformations are gradually reduced regarding to the depth increasing in tissue slices. Furthermore, in Fig. 6 C not obvious damages can be seen regarding to the RF exposures and nanoparticles presence. The differences between lesion severities in Fig. 7 (20 min RF time) and Fig. 6 (10 min RF time) approve the time dependency of thermal injury phenomena in the RF hyperthermia. The complementary pathology images included negative group microscopic image is illustrated in the supported data part.
3.3 Hepatocellular tissue model changes against RF exposures
The histology observations of hepatocellular tissue model specimens (physical not living) were implemented in histology/Embryology department of Gazi medical school, Turkey for RF hyperthermia assessments. As presented in Fig. 8 B, where the hepatocytes cells are sticky attached to the fibrous connective tissue, not certain damage areas can be seen in the RF exposures. The histology images of positive control group (RF exposures) are showed not severe structural changes in the tissue morphology compared to the negative control group (neither RF nor GS@IONPs presence). The images in Fig. 9 approves not damageable effect of RF waves on hepathocellular tissue model at mentioned RF power (180 W).
Fig. 8.
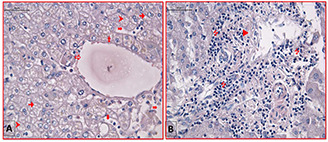
Histology images of healthy hepatocellular tissue model captured at ×100 magnifications by light microscope (Leica, Germany)
(a)
1.0 cm,
(b)
2.0 cm depths of tissue was stained by H&E. Fibrosis (►), lymphatic infiltration (7), hepatocytes (➞), sinusoidal dilatation ( ), vena centralis (⇨), vacuole (➤). Not serious structural damages caused by RF thermal ablation can be seen in the A and B figures. The scale bar equals 50 µm
Fig. 9.
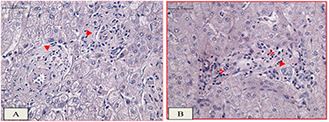
Histology observations in the healthy hepatocellular tissue model,
(a) the fibrous connective tissue surrounded the hepatocytes in portal area which is related to the negative control group with neither RF exposures nor GS@IONPs presence, (b) positive group with RF exposures without nanoparticles presence. Not significant changes can be seen in the H&E staining tissue model with ×100 magnification of light microscope. Fibrosis (►), lymphatic infiltration (7), hepatocytes (dark dots), the scale bar equals 50 µm
3.4 Histology images of hepatocellular healthy tissue model in RF hyperthermia
In this section, the histology observations of RF hyperthermia caused ex‐vivo hepatocellular tissue model are implemented. The damage thresholds were presented in case of the RF hyperthermia in Fig. 8 (healthy hepatocellular tissue model). In Fig. 8 A (1.0 cm thickness tissue slice) vascular changes in hepatocytes, sinusoids dilatation can be seen. In Fig. 8 A, the disruption of vena centralis (but not serious rupture) can be seen. In same figure (1.0 cm slice thickness) of healthy liver tissue, the normal structure without any changes achievable in the vena centralis where appearance lymphatic infiltration in portal area can be highlighted. The negative control group (without nanoparticles) and positive control group (with nanoparticles) of RF hyperthermia implementation in hepatocellular healthy tissue against RF hyperthermia are presented in Fig. S5 of supported data.
3.5 Hepatocelluar tumour tissue model in RF hyperthermia
In this section, histological observations of hepatocellular tumour tissue are evaluated. Figs. 11A and B are related to the histology evaluation in RF on tissue, without incubation of nanoparticles (control group). Fig. 11A reveals the histology observation of RF induced without nanoparticle in tissue and in the depth of 1 cm inside the tissue. In image (A) as control group of this category, the normal liver parenchyma tissue could not be distinguished. Lymphatic infiltration and fibrosis were seen among this fibrotic tissue. Same structural changes were observed in tissue slices that were RF induced without nanoparticles’ incubation in 1.0 and 2.0 cm deep. As seen in Figs. 8, 10 and 11, the hyalinisation is the dominant effect of nanoparticles mediated RF ablation in RF hyperthermia phenomena.
Fig. 10.
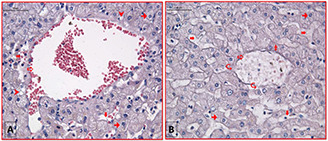
Histology images of thermal injured tissue by RF induced nanoparticles on the hepatocellular tumour tissue through hematoxylin and eosin staining protocol.
(a) 1.0 cm, (b) 2.0 cm tissue slices microscopic images captured by Olympus light microscope in ×100 magnifications. The scale bar was 50 µm. Hepatocytes (➞), Vena centralis (⇨), Hyalinisation. The scale bar equals 50 µm
Fig. 11.
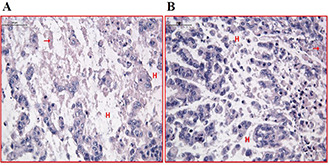
Histology images of thermal RF induced hepatocellular tumor tissue model ablation. The tissue models were prepared by hematoxylin eosin staining
(a) 1.0 cm, (b) 2.0 cm tissue slices microscopic images captured by Olympus light microscope in ×100 magnifications. The scale bar was 50 µm. Hepatocytes (➞), Hyalinisation (H)
The negative control group (without nanoparticles) and positive control group (with nanoparticles) of RF hyperthermia implementation in hepatocellular tumour tissue model is presented in the supported data (S6).
4 Conclusion
In the present investigation about damageable effect of nanoparticles' mediated RF hyperthermia on the morphologic changes in tumour tissue models few evidence approves which are as follows; in the nanoparticles preparation and thermal studies of nanoparticle dispersions is as below; The heat generation of nanoparticles induced by RF exposures sounds from the highest temperature arises of GS@IONPs compared to other nanoparticles. In the RF hyperthermia investigations on the tissue models, the 180 W RF exposures with 20% SWR ratio effects on the structural changes of chicken breast tissue model (pathology observations). Also, the same RF waves conditions (180 W, 20% SWR) on the HCC tissue model exhibits the more serious damageable effects of RF hyperthermia observed in the histology investigations. The hyalinisation is the dominant damage effect of thermal ablation in the RF hyperthermia incorporated with GS@IONPs. Also the pathology and histology study approved that the RF exposures can penetrate to the HCC tumour tissue that the fibrotic tissue is the main component. The histologic necrosis hyalinisation in the depths of 2.0 cm inside the tissue approves the proper diffusion of antenna modulus RF waves for creating histologic damages in the tissue.
5 Acknowledgments
The authors wants to acknowledge Hacettepe University, Ankara, Turkey. In present study, Behzad Nasseri was supported by Turkish Academy of Science, TUBITAK 1003 project no: 113O864
6 References
- 1. Weir H.K. Anderson R.N. King S.M.C. et al.: ‘Peer reviewed: heart disease and cancer deaths—trends and projections in the United States, 1969–2020’, Prev. Chronic Dis., 2016, 13 [DOI] [PMC free article] [PubMed] [Google Scholar]
- 2. Beik J. Abed Z. Ghoreishi F.S. et al.: ‘Nanotechnology in hyperthermia cancer therapy: from fundamental principles to advanced applications’, J. Control. Release, 2016, 235, pp. 205 –221 [DOI] [PubMed] [Google Scholar]
- 3. Cheung A.Y. Neyzari A.: ‘Deep local hyperthermia for cancer therapy: external electromagnetic and ultrasound techniques’, Cancer Res., 1984, 44, (10 Suppl), pp. 4736s –4744s [PubMed] [Google Scholar]
- 4. Raoof M. Curley S.A.: ‘Non‐invasive radiofrequency‐induced targeted hyperthermia for the treatment of hepatocellular carcinoma’, Int. J. Hepatol., 2011, 2011, p. 676957. doi:10.4061/2011/676957 [DOI] [PMC free article] [PubMed] [Google Scholar]
- 5. Mamiya H. Jeyadevan B.: ‘Hyperthermic effects of dissipative structures of magnetic nanoparticles in large alternating magnetic fields’, Sci. Rep., 2011, 1, p. 157 [DOI] [PMC free article] [PubMed] [Google Scholar]
- 6. Laurent S. Dutz S. Hafeli U.O. et al.: ‘Magnetic fluid hyperthermia: focus on superparamagnetic iron oxide nanoparticles’, Adv. Colloid Interface, 2011, 166, (1–2), pp. 8 –23. doi:10.1016/j.cis.2011.04.003 [DOI] [PubMed] [Google Scholar]
- 7. Wust P. Hildebrandt B. Sreenivasa G. et al.: ‘Hyperthermia in combined treatment of cancer’, Lancet Oncol., 2002, 3, (8), pp. 487 –497 [DOI] [PubMed] [Google Scholar]
- 8. Bottomley P.A. Andrew E.R.: ‘RF magnetic field penetration, phase shift and power dissipation in biological tissue: implications for NMR imaging’, Phys. Med. Biol., 1978, 23, (4), p. 630 [DOI] [PubMed] [Google Scholar]
- 9. Winter L. Özerdem C. Hoffmann W. et al.: ‘Design and evaluation of a hybrid radiofrequency applicator for magnetic resonance imaging and RF induced hyperthermia: electromagnetic field simulations up to 14.0 Tesla and proof‐of‐concept at 7.0 Tesla’, PloS one, 2013, 8, (4), p. e61661 [DOI] [PMC free article] [PubMed] [Google Scholar]
- 10. Elsherbini A.A. Saber M. Aggag M. et al.: ‘Laser and radiofrequency‐induced hyperthermia treatment via gold‐coated magnetic nanocomposites’, Int. J. Nanomed., 2011, 6, p. 2155 [DOI] [PMC free article] [PubMed] [Google Scholar]
- 11. Nasseri B. Yilmaz M. Turk M. et al.: ‘Antenna‐type radiofrequency generator in nanoparticle‐mediated hyperthermia’, RSC Adv., 2016, 6, (54), pp. 48427 –48434. doi:10.1039/c6ra03197h [Google Scholar]
- 12. Hensley D. Tay Z.W. Dhavalikar R. et al.: ‘Combining magnetic particle imaging and magnetic fluid hyperthermia in a theranostic platform’, Phys. Med. Biol., 2017, 62, (9), p. 3483 [DOI] [PMC free article] [PubMed] [Google Scholar]
- 13. Nikfarjam M. Muralidharan V. Christophi C.: ‘Mechanisms of focal heat destruction of liver tumors’, J. Surg. Res., 2005, 127, (2), pp. 208 –223 [DOI] [PubMed] [Google Scholar]
- 14. Goldberg S.N. Gazelle G.S. Halpern E.F. et al.: ‘Radiofrequency tissue ablation: importance of local temperature along the electrode tip exposure in determining lesion shape and size’, Acad. Radiol., 1996, 3, (3), pp. 212 –218 [DOI] [PubMed] [Google Scholar]
- 15. Petersen H.H. Chen X. Pietersen A. et al.: ‘Lesion size in relation to ablation site during radiofrequency ablation’, Pacing Clin. Electrophysiol., 1998, 21, (1), pp. 322 –326 [DOI] [PubMed] [Google Scholar]
- 16. Cherukuri P. Glazer E.S. Curleya S.A.: ‘Targeted hyperthermia using metal nanoparticles’, Adv. Drug Delivery Rev., 2010, 62, (3), pp. 339 –345. doi:10.1016/j.addr.2009.11.006 [DOI] [PMC free article] [PubMed] [Google Scholar]
- 17. Hunt J.W. Lalonde R. Ginsberg H. et al.: ‘Rapid heating – critical theoretical assessment of thermal‐gradients found in hyperthermia treatments’, Int. J. Hyperth., 1991, 7, (5), pp. 703 –718. doi:10.3109/02656739109056440 [DOI] [PubMed] [Google Scholar]
- 18. Bottomley P.A. Andrew E.R.: ‘Rf magnetic‐field penetration, phase‐shift and power dissipation in biological tissue – implications for Nmr imaging’, Phys. Med. Biol., 1978, 23, (4), pp. 630 –643. doi:10.1088/0031–9155/23/4/006 [DOI] [PubMed] [Google Scholar]
- 19. Lazebnik M. McCartney L. Popovic D. et al.: ‘A large‐scale study of the ultrawideband microwave dielectric properties of normal breast tissue obtained from reduction surgeries’, Phys. Med. Biol., 2007, 52, (10), pp. 2637 –2656. doi:10.1088/0031–9155/52/10/001 [DOI] [PubMed] [Google Scholar]
- 20. Ma C. Fourkal E. Veltchev I. et al.: World Congress on Medical Physics and Biomedical Engineering, September 7–12, 2009, Munich, Germany, 2010. [Google Scholar]
- 21. Sneed P. K. Stauffer P. R. Li G. C. et al.: ‘Hyperthermia’, 2015. See https://clinicalgate.com/hyperthermia‐2/#bib34
- 22. Moran C.H. Wainerdi S.M. Cherukuri T.K. et al.: ‘Size‐dependent Joule heating of gold nanoparticles using capacitively coupled radiofrequency fields’, Nano Res., 2009, 2, (5), pp. 400 –405. doi:10.1007/s12274‐009‐9048‐1 [Google Scholar]
- 23. Raoof M. Corr S.J. Kaluarachchi W.D. et al.: ‘Stability of antibody‐conjugated gold nanoparticles in the endolysosomal nanoenvironment: implications for noninvasive radiofrequency‐based cancer therapy’, Nanomed. Nanotechnol. Biol. Med., 2012, 8, (7), pp. 1096 –1105 [DOI] [PMC free article] [PubMed] [Google Scholar]
- 24. Duff D.G. Baiker A. Edwards P.P.: ‘A new hydrosol of gold clusters. 1. Formation and particle size variation’, Langmuir, 1993, 9, (9), pp. 2301 –2309 [Google Scholar]
- 25. Gazicki M. James W. Yasuda H.: ‘Colloids and surfaces a: physicochemical and engineering aspects’, J. Polym. Sci.: Lett. Polym. Ed., 1985, 23, pp. 639 –645 [Google Scholar]


