Abstract
The synthesis, characterisation and application of metal nanoparticles have become an important and attractive branch of nanotechnology. In current study, metallic nanoparticles of silver, copper, and gold were synthesised using environment friendly method (polyols process), and applied on medicinally important plant: Eruca sativa. Effects of application of these nanoparticles were evaluated on seed germination frequency and biochemical parameters of plant tissues. Seeds of E. sativa were germinated on Murashige and Skoog (MS) medium incorporated with various combinations of nanoparticles suspension (30 µg/ml). Phytotoxicity study showed that nanoparticles could induce stress in plants by manipulating the endogenous mechanisms. In response to these stresses, plants release various defensive compounds; known as antioxidant secondary metabolites. These plants derived secondary metabolites having a great potential in treating the common human ailments. In the authors study, small‐sized nanoparticles showed higher toxicity levels and enhanced secondary metabolites production, total protein content, total flavonoids content and total phenolics content.
Inspec keywords: nanofabrication, nanomedicine, botany, biochemistry, biological tissues, suspensions, toxicology, silver, copper, gold
Other keywords: metal nanoparticle synthesis, seed germination, seedling growth, Eruca sativa, nanotechnology, polyols process, medicinally important plant, biochemical parameters, plant tissues, nanoparticles suspension, stress, endogenous mechanisms, antioxidant secondary metabolites, human ailment treatment, toxicity levels, total protein content, total flavonoids content, total phenolics content, Ag, Cu, Au
1 Introduction
Nanotechnology is a very versatile field covering almost all existing branches of science. Nanotechnology is famed as 21st century science, as it has found applications in physics, chemistry, biology and many other fields [1]. In the last decade many advances in nano‐biotechnology were noted. Nanotechnology has the potential to improve the agriculture with new tools and enhance the plants ability to absorb nutrients. In recent years, scientists have started focusing on employment of nanoparticles in agriculture for the betterment of crop quality and also for increased growth and disease control in plants. Studies on biological effects of nanoparticles in higher plants are increasing day‐by‐day.
Eruca sativa commonly known as rocket plant is the well‐known fast growing herb of family Brassicaceae. Despite of its popular use as vegetable, rocket plant is also considered as useful medicinal plant since ancient times [2]. Its phytochemistry is very rich and it is a good source of fibres, flavonoids, carotenoids, vitamin C and glucosinolates [3]. It has shown anti‐tumour, anti‐ulcer and hepatoprotective activities [4, 5].
Plant tissue culture is considered as promising alternate to conventional breeding. It establishes high‐frequency regeneration protocols and improves the quality of economically important plants. E. sativa has shown adaptability to in vitro regeneration protocols [6]. Tissue culture techniques well explained the need of biotechnology by solving food security and agricultural production issues, and highlighted the use of biotechnological techniques for having genetically improved varieties [7].
Stress enhanced secondary metabolites content in medicinal plants. Elicitors are reported to effect production of these secondary metabolites positively [8]. Recently, exploitation of nanomaterials is reported to effect biosynthesis of economically and commercially viable secondary metabolites in medicinal plant species [9]. An increase in shoot/root ratio was observed by applying different nanoparticles in soil. As the change in growth behaviour was observed after the certain time period, so it was assumed that nanoparticles do not directly influence plants but indirectly alters the mechanisms [10].
As plants possess cell walls as a primary interacting site for foreign particles, so entry of nanoparticles become difficult. The mechanism by which nanoparticles enters the plants is still poorly defined. Yet, nanoparticles have ability to magnify changes in cell structures and molecules and also the defensive mechanisms. Effects of nanoparticles depend on its physical and chemical properties and include solubility of toxic nanoparticles and production of reactive oxygen species [11].
Chemical composition of nanoparticles is very much responsible for the toxic effects of metal nanoparticles (MNPs) on plants and also the stress caused by surface, shape and size of particle [12]. Moreover, toxic nanoparticles may increase the production of reactive oxygen species and hydroxyl radicals that damage the cell membranes and as a result permeability is altered. As a result, entry of nanoparticles into plant cells become easier and stress induced by the particles results in secondary metabolites production [13].
Up to now, only few studies have been reported on application of nanomaterials in plant tissue culture. According to Safavi [14], nanosilver and nano‐titanium dioxide can be used as antimicrobial agent in plant tissue culture medium.
No report is available on application of MNPs in tissue culture media to evaluate the seed germination frequency and plant growth in Eruca. Hence, we have evaluated the effect of chemically synthesised copper (Cu), silver (Ag) and gold (Au) MNPs on growth parameters and secondary metabolites content in E. sativa.
2 Materials and methods
2.1 Plant source and surface sterilisation
Seeds of E. sativa were provided by Dr. Bilal Haider Abbasi, Department of Biotechnology, Islamabad, Pakistan. Seeds were surface sterilised according to the protocol of Abbasi et al. [15], i.e. seeds were sterilised by immersion in 0.1% mercuric chloride for 1 min followed by three time washing with distilled water.
2.2 Metal nanoparticles
MNPs of Au, Cu and Ag were synthesised by environment friendly polyols process. Reagents used were Cu chloride (CuCl2) (98%), Ag nitrate (AgNO3) (99%), hydrogen Au chloride (HAuCl4) (99%), ethylene glycol (C2 H6 O2) (98%), polyethyleneimine (2%). All of these chemicals were purchased from Thermo fisher scientific Inc. (USA), except polyethyleneimine that was obtained from Acros Organics.
2.2.1 Preparation of Cu nanoparticles
About 10 ml polyethyleneimine (2%) was added to 20 ml of CuCl2 solution (1 mM). This mixture was purged with argon blow for 30 min. The solution was heated in oven at 175°C for 30 min. The appearance of bluish black colour showed the formation of Cu nanoparticles that was confirmed by ultraviolet (UV)–visible spectroscopy.
2.2.2 Preparation of Ag nanoparticles
About 10 ml of polyethyleneimine was added to 20 ml of AgNO3 solution (1 mM) and was heated at 150°C for 15 min, the appearance of blackish colour shows the formation of Ag nanoparticles that was also confirmed by UV–visible spectroscopy.
2.2.3 Preparation of Au nanoparticles
For preparation of Au nanoparticles 10 ml polyethyleneimine was poured to 20 ml of HAuCl4 (1 mM) solution and was heated at 100°C for 15 min. The appearance of yellowish back colour evidenced the formation of Au nanoparticles that was confirmed by UV–visible spectrophotometry.
All the three nanoparticles Cu, Ag and Au were stable for six months. These nanoparticles were characterised by using characterisation techniques which include UV spectrophotometer (Cary 100, Varian, Shimadzu, Tokyo Japan), X‐ray diffraction (XRD) (Brucker SMART APEX diffractometer) and transmission electron microscopy (TEM) (Philips, Holland Tecnai 20).
2.3 Seed germination protocol
MNPs were suspended directly in distilled water using sonication. 30 µg/ml suspension was prepared of each MNPs by sonication in distilled water for 30 min according to the protocol described by Savithramma et al. [16]. This suspension was added to MS0 medium in concentration of 3 ml/30 ml of MS medium with the help of a micropipette. Sterilised E. sativa seeds were incubated into conical flasks containing autoclaved solidified MS media. Seed germination was observed in ∼2–4 days and first data on seed germination was collected after 14 days of inoculation. Data was collected after every 2 weeks and the experiment was conducted for 42 days, i.e. 6 weeks.
2.4 Seed germination parameters
2.4.1 Percentage germination frequency
The percentage germination was recorded after every 2 weeks. Seeds were taken as germinated when radicle had emerged from seed coat [17]
2.4.2 Root and shoot length
Root and shoot length of seeds were recorded after every 2 weeks starting from inoculation date. Mean root and shoot length were compared in the form of bar charts.
2.4.3 Seedling vigour index
The seedling vigour index (VI) was calculated by using the method suggested by Abdul‐Baki and Anderson [18] and expressed as index numbers [17]
2.5 Analytical methods
2.5.1 Determination of free radical scavenging activity by 2,2‐diphenyl‐1‐picrylhydrazyl (DPPH) method
The free radical scavenging assay (FRSA) of methanolic extracts of E. sativa was measured in terms of hydrogen donating or radical scavenging ability using the stable radical DPPH. Protocol of Lee et al. [19] was followed with some modifications according to which the test extracts were prepared in methanol, so the DPPH was also prepared in methanol. DPPH solution was added in sample solution according to the defined calculated concentrations separately. These solution mixtures were kept in dark for 30 min (incubation period) at room temperature. After 30 min, the absorbance was measured at 515 nm using micro‐plate reader. Lower absorbance of the reaction mixture indicated higher FRSA. Finally, the radical scavenging activity was calculated as percentage of DPPH discolouration using the equation
where AE is the absorbance of the solution, when extract has been added at a particular level and AD is the absorbance of the DPPH solution with nothing added (blank, without extract).
2.5.2 Evaluation of total antioxidant capacity (TAC) by phosphomolybdenum method
The TAC of the methanol extract was evaluated by the phosphomolybdenum method according to the procedure described by Prieto et al. [20]. According to this assay Mo (VI) is reduced to Mo (V) by the extract and green phosphate/Mo (V) complex is formed at acid pH. A 50 µl of extract was combined with 450 µl of reagent solution (0.6 M sulphuric acid, 28 mM sodium phosphate and 4 mM ammonium molybdate). The extract was then put into water bath at 95°C for 90 min and then samples were cooled at room temperature. The absorbance of the reaction mixture was measured at 695 nm using a spectrophotometer against blank. Methanol was used as the blank. The antioxidant activity is expressed as the number of gram equivalent of ascorbic acid [21]. Some of the compounds which are normally not measured as antioxidants have some chain breaking antioxidant activity also, so TAC assay is helpful to measure all these compounds collectively including complex interactions occurring during chain breaking antioxidants. Generally, TAC is decreased under oxidative stress condition and administration of chain breaking antioxidants increases antioxidant capacity [22].
2.5.3 Determination of total phenolics and total flavonoids content
Total phenolics content (TPC) was determined following the Folin–Ciocalteu (FC) method by Singleton and Rossi [23]. Briefly three solutions were prepared for TPC activity. Ten times diluted solution of FC reagent in distilled water, 6% sodium carbonate (Na2 CO3) solution in distilled water and 4 mg/ml solution of gallic acid in methanol were prepared. About 25, 20, 15, 10 and 5 µ/ml concentrations of gallic acid were used as positive control and 20 µl of Dimethyl sulfoxide (DMSO) as negative control. Absorbance was measured at 630 nm by using microplate reader.
Total flavonoids content (TFC) was determined by following the protocol of Haq et al. [24]. Stock solutions of 10% aluminium chloride in distilled water, 1 M potassium acetate in distilled water and 4 mg/ml quercetin in methanol were prepared. About 20 µl of methanol was used as negative control and 40, 20, 10, 5 and 2.5 µg/ml of final concentration of quercetin as positive control. Absorbance was recorded at 415 nm using microplate reader.
2.5.4 Estimation of total protein content
For total protein content estimation method of Lowry et al. [25] was used. Three reagents, i.e. A [1 g sodium–potassium (Na–K) tartrate × 4 H2 O, 50 g Na2 CO3, 250 ml 1 N sodium hydroxide (NaOH)], B (2 g Na–K tartrate × 4H2 O, 1 g CuSO4. 5H2 O, 0.1 N NaOH) and C (FC reagent ten times diluted with distilled water) were used. About 40 µl of protein extract was taken and 36 µl of reagent A was added and then incubated for 10 min at 50°C and after cooling the reaction mixture 4 µl of reagent B was added and again incubated under same conditions. After cooling reaction mixture at 25°C, 120 µl of reagent C was added. The absorbance was then recorded at 650 nm using microplate reader. Standard curve of bovine serum albumin was prepared at series of 25, 50, 75, 100 and 125 µg/ml used.
2.5.5 Superoxide dismutase (SOD) and peroxidase (POD) activities
SOD activity assay was performed according to method of Ullah et al. [26] with minor changes. Inhibition of photochemical reduction of nitro blue tetrazolium (NBT) by SOD is the principle of assay. About 1 mM ethylenediaminetetraacetic acid, 130 mM methionine, 0.02 mM riboflavin, 0.75 mM NBT and 50 mM phosphate buffer (pH 7) was used. Blank was prepared by mixing all the chemicals except enzyme extracts in the same quantity. Reaction mixture was exposed to fluorescent light for 7 min. optical density (OD) was taken at 560 nm.
Activity of enzyme was calculated applying Lambert–Beer law
where A = absorbance; ε = extinction coefficient (6.39 mM−1 cm−1); L = length of each wall (0.25 cm); C = concentration of enzyme (value of C measured in nM/min/mgFW); and FW = fresh weight of the sample.
For POD activity method of Lagrimini [27] was used. About 27.5 mM hydrogen peroxide (H2 O2) (10×), 100 mM guaiacol (10×), distilled water, 1% polyvinyl‐pyrrolidone. About 50 mM K‐phosphate buffer of pH 7 were used as chemicals. Reaction mixture of 200 microlitre was prepared using these chemicals. Blank was prepared by mixing of 60 µl K‐phosphate buffer, 20 µl guaiacol, 100 µl distilled water and 20 µl H2 O2. Absorbance was recorded at 470 nm with a gap of 20 s and activity was calculated according to the formula used for SOD activity.
3 Results and discussion
The synthesised nanoparticles were characterised by UV–visible spectroscopy, XRD and TEM. UV–visible spectra confirmed the formation of nanoparticles showing single Plasmon band having maximum wavelength closed to the value that have already been published by Rahman et al. [28]. Fig. 1 shows UV–visible spectra of Cu (Fig. 1 a), Ag (Fig. 1 b) and Au (Fig. 1 c) nanoparticles. Their maximum absorbance for 1 mM solution and maximum wavelengths are shown in Table 1. Such suspension was centrifuged and the powdered nanoparticles were analysed by XRD as shown in Fig. 2. XRD helped us in calculating the size of nanoparticles as well as their crystallinity. In Fig. 2 a, 111 is considered as desired peak. In Fig. 2 b, 111, 200 and 210 were taken as the desired peaks, whereas in Fig. 2 c 111 and 200 were taken as desired peaks. Applying Debye Scherrer equation, average size of the nanoparticles was calculated as shown in Table 1. XRD also revealed that nanoparticles are crystalline and mostly to be cubic. Fig. 3 exhibits the TEM photographs of pure Cu, Ag and Au nanoparticles. A typical TEM image of Cu nanoparticles in Fig. 3 a are seemed to be non‐spherical; however, shapes of Ag and Au nanoparticles are spherical as shown in Figs. 3 b and c. Interestingly, size shown by these images was same as calculated from XRD. The size of nanoparticles evaluated from XRD as well as TEM can be seen in Table 1.
Fig. 1.
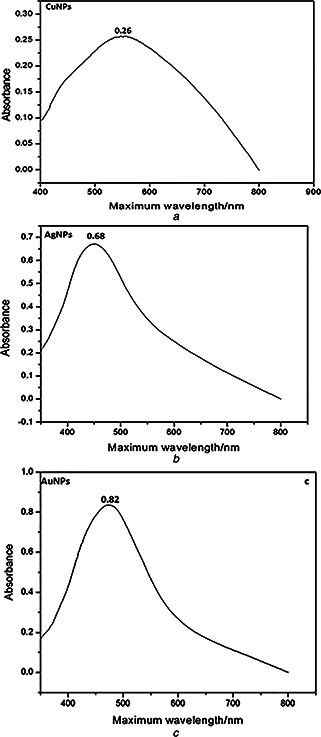
UV–visible spectra of
a Cu nanoparticles prepared by polyols process using C2 H6 O2 as a solvent
b Ag nanoparticles prepared by polyols process using C2 H6 O2 as a solvent
c Au nanoparticles prepared by polyols process using C2 H6 O2 as a solvent
Table 1.
Data obtained from UV–visible spectroscopy, XRD and TEM
| Nanoparticles | Maximum absorbance for 1 mM solution | λ max | Average size, nm |
|---|---|---|---|
| Cu | 0.26 | 550 | 15 |
| Ag | 0.68 | 451 | 18 |
| Au | 0.82 | 485 | 20 |
Fig. 2.
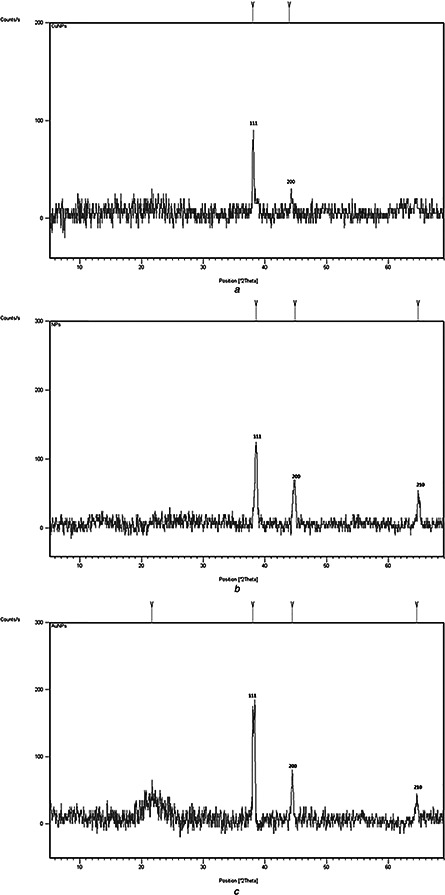
XRD spectra of
a Cu nanoparticles solidified by centrifugation
b Ag nanoparticles solidified by centrifugation
c Au nanoparticles solidified by centrifugation
Fig. 3.

TEM images of
a Cu nanoparticles prepared by polyol process using C2 H6 O2 as a solvent and solidified by centrifugation
b Ag nanoparticles prepared by polyol process using C2 H6 O2 as a solvent and solidified by centrifugation
c Au nanoparticles prepared by polyol process using C2 H6 O2 as a solvent and solidified by centrifugation
3.1 Seed germination frequency
Seed germination and root elongation are easy and widely used in phytotoxicity test and it is simple, low cost and suitable to unstable chemicals or samples [29, 30]. Seed germination frequency was calculated at different time intervals such as 14, 28 and 42 days (Table 2). Among all metals, Ag showed maximum positive response and seed germination frequency was recorded as 73%. As reported by El‐Temsah and Joner [31], Ag nanoparticles of different sizes and in different concentrations effect the seed germination frequency differently, small‐sized particles exert more inhibitory effects on seed germination. In present study, time interval was taken as limitation after expecting that with the progression of time more aggregation of nanoparticles in cell compartments happens, so there is a possibility of nanoparticles of same size to impact in an unexpected way. As reported by Lee et al. [32] Cu nanoparticles are toxic to two species of mung bean (Phaseolus radiatus) and wheat (Triticum aestivum), so in the present paper it also showed inhibitory effect and seed germination was 56%. Au also showed inhibitory effect and germination frequency was 53% but in case of Au as time increases the germination frequency was also increased and toxicity of Au decreased. In previous reports, it is concluded that toxicity of nanoparticles depends on two different actions, i.e. chemical composition and release of toxic ions and stress caused by surface size or shape of nanoparticles [33]. Therefore, in the present paper it is also observed that Cu of small size and toxic nature both contributed in the inhibition of seed germination. Ag showed positive response and results were almost such as the control seeds. Au responds late, it showed inhibition in start and then showed positive response after 28 days but as time increased up to 42 days again seed germination was inhibited due to the release of toxic ions and stress caused by nanoparticles.
Table 2.
Effect of MNPs on in vitro seed germination of E. sativa values are an average of five replications ± SE
| Serial number | Treatments | Percentage seed germination after 14 days | Percentage seed germination after 28 days | Percentage seed germination after 42 days |
|---|---|---|---|---|
| 1 | control (MS0) | 76.6 ± 3.3 | 40 ± 2 | 100 ± 5 |
| 2 | Cu | 56.6 ± 2.8 | 46.6 ± 2.3 | 60 ± 3 |
| 3 | Ag | 73.3 ± 3.6 | 80 ± 4 | 100 ± 5 |
| 4 | Au | 53.3 ± 2.6 | 73.3 ± 3.6 | 60 ± 3 |
3.2 Root and shoot elongation and seed VI
It is inferred that Ag nanoparticles stimulated the root and shoot length and seed VI at different time periods such as 14, 28 and 42 days with exception in root length after 42 days as root length was decreased again after 42 days (Table 3). Savithramma et al. [16] reported that Ag period of time at optimum concentration. Reason maybe Ag nanoparticles penetrated and induce new pores which helped influx the nutrients in seed for rapid growth. Chemical composition of Ag nanoparticles and their precise size and shape does matter in the response showed by these particles.
Table 3.
Effect of metal nanoparticles on root length, shoot length and seed VI of E. sativa values are average of three replications ± SE
| Germination period | Treatments | Root length, cm | Shoot length, cm | VI |
|---|---|---|---|---|
| after 14 days | MS0 | 1.9 ± 0.09 | 1.5 ± 0.07 | 340 ± 17 |
| Cu | 1.7 ± 0.08 | 2 ± 0.1 | 296 ± 14.8 | |
| Ag | 2.3 ± 0.11 | 2.5 ± 0.12 | 484 ± 24.2 | |
| Au | 1.2 ± 0.06 | 1.2 ± 0.06 | 192 ± 9.6 | |
| after 28 days | MS0 | 1.5 ± 0.07 | 2.5 ± 0.12 | 164 ± 8.2 |
| Cu | 1.9 ± 0.09 | 2.8 ± 0.14 | 225.5 ± 11.27 | |
| Ag | 4.5 ± 0.22 | 6.3 ± 0.31 | 866.6 ± 43.33 | |
| Au | 2.3 ± 0.11 | 4.5 ± 0.22 | 498.6 ± 24.93 | |
| after 42 days | MS0 | 5 ± 0.25 | 9.8 ± 0.49 | 1480 ± 74 |
| Cu | 2.1 ± 0.10 | 4.3 ± 0.21 | 384 ± 19.2 | |
| Ag | 2.3 ± 0.11 | 6.7 ± 0.33 | 900 ± 45 | |
| Au | 2.1 ± 0.10 | 3.4 ± 0.17 | 330 ± 16.5 |
Cu and Au nanoparticles have reduced the root and shoot length in E. sativa and showed more stress than Ag nanoparticles. These results are similar to the previously reported results [32]. After 42 days of inoculation, mostly root and shoot lengths were reduced as compared with control which can be justified by the reason that with the passage of time more ions from particles were released and accumulated in roots and shoots more surface ions were exposed and they were more toxic to plantlets.
3.3 Percentage DPPH radical scavenging activity and TAC
After exposing the E. sativa seeds to different nanoparticles, significant radical scavenging activity was noted in plantlets of E. sativa. TAC and DPPH radical scavenging activity of the plantlets treated with nanoparticles is shown in Fig. 4. Correlation was established between radical scavenging activity and TAC. Ag nanoparticles have reduced the antioxidant capacity compared with control and Au nanoparticles again started increasing the capacity as compared with Ag nanoparticles.
Fig. 4.
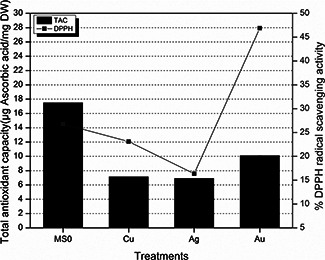
Percentage DPPH radical scavenging activity and TAC of E. Sativa plantlets against different treatments of nanoparticles
The contradiction observed between DPPH radical scavenging activity and TAC in Au treatment can have the reason that TAC is collective value of antioxidants and numerous other compounds which are involved in some chain breaking antioxidant activity [22]. As we are applying MNPs and after a long period of inoculation accumulation of these particles occurs and ions are released in cell compartments, so DPPH radical scavenging activity can be lesser in Cu‐treated seeds which have released more ions and these ions already had scavenged the radicals.
3.4 TFC and TPC
As reported by Krishnaraj et al. [34], Ag nanoparticles enhanced the total phenol content in plants; however, AgNO3 produced considerably higher phenolic content. In current paper, total phenolics and flavonoids content were lesser in Ag/Au treated plantlets than Cu treatment (Fig. 5). It is reported earlier that Cu nanoparticles are inducing more stress and thus more secondary metabolites are biosynthesised for protection of plant cells.
Fig. 5.
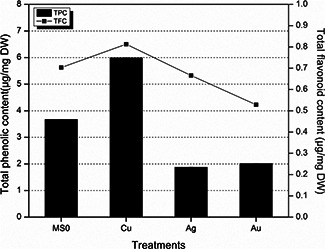
Total flavonoids and TPC after 6 weeks of time interval
3.5 Total protein content, SOD and POD
As shown in Fig. 6, total protein content is comparatively lesser in plantlets treated with Cu nanoparticles and in Ag and Au treated plantlets total protein content is comparable with control, i.e. MS0. Higher total protein content correlates with higher SOD and POD activities. Stress could be the main cause behind this enhanced total protein content. SOD and POD activities were stimulated by nanoparticles. However, these parameters were hampered by Cu ions presence in medium [35]. As shown in Fig. 7, higher levels of SOD and POD activities indicating their protective role against Au nanoparticles‐induced stress [34].
Fig. 6.
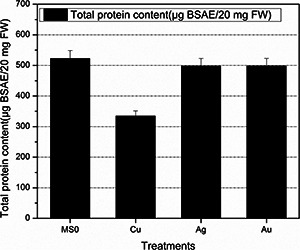
Total protein content of fresh matter after 6 weeks of E. Sativa treated with MNPs
Fig. 7.
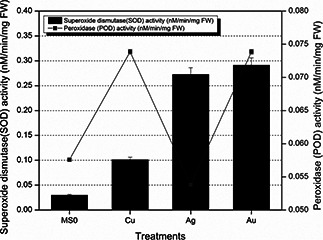
SOD activity and POD activity of fresh matter after 6 weeks of E. Sativa treated with MNPs
4 Conclusions
It is concluded from the current paper that metals at nanoscale showed different behaviours than metals in bulk form. Chemical composition, size and shape of nanoparticles matters a lot to affect plants [33]. Small‐sized nanoparticles are more toxic than larger size nanoparticles and among all the combinations applied Cu nanoparticles are more stress inducing than Ag and Au nanoparticles because of the fact that Cu at bulk level is also more toxic than Au and Ag. These results can be helpful for future studies on phytotoxicity of various nanomaterials especially engineered nanoparticles under certain conditions. Up till now there are very few reports on using nanomaterials in plant tissue culture as a stress inducing factor. Using the results reported in this paper further study in domain of ecotoxicity can be conducted to check environment friendly nanoparticles and nanoparticles with harmful effects.
5 Acknowledgments
The authors are grateful to Miss Shagufta Shafique, National Centre for Bioinformatics and Mr. Tariq Khan, Department of Biotechnology at Quaid‐i‐Azam University for their assistance throughout the manuscript. Mehreen Zaka acknowledges the support provided by Higher Education Commission, Pakistan.
6 References
- 1. Lin D. Xing B.: ‘Phytotoxicity of nanoparticles: inhibition of seed germination and root growth’, Environ. Pollut., 2007, 150, pp. 243 –250 (doi: 10.1016/j.envpol.2007.01.016) [DOI] [PubMed] [Google Scholar]
- 2. Mitsuo M. Takako M. Kohsuke K.: ‘Composition of the essential oil from the leaves of Eruca sativa’, Flavour Fragrance J., 2002, 17, pp. 187 –190 (doi: 10.1002/ffj.1079) [DOI] [Google Scholar]
- 3. Barillari J. Canistro D. Paolini M. et al.: ‘Direct antioxidant activity of purified glucoerucin, the dietary secondary metabolite contained in rocket (Eruca sativa Mill.) seeds and sprouts’, J. Agric. Food Chem., 2005, 53, pp. 2475 –2482 (doi: 10.1021/jf047945a) [DOI] [PubMed] [Google Scholar]
- 4. Khoobchandani M. Ganesh N. Gabbanini S. et al.: ‘Phytochemical potential of Eruca sativa for inhibition of melanoma tumor growth’, Fitoterapia, 2011, 82, pp. 647 –653 (doi: 10.1016/j.fitote.2011.02.004) [DOI] [PubMed] [Google Scholar]
- 5. Alqasoumi S. Al‐Sohaibani M. Al‐Howiriny T. et al.: ‘Rocket ‘Eruca sativa’: a salad herb with potential gastric anti–ulcer activity’, World. J. Gastroenterol., 2009, 15, pp. 1958 –1965 (doi: 10.3748/wjg.15.1958) [DOI] [PMC free article] [PubMed] [Google Scholar]
- 6. Murashige T. Skoog F.: ‘A revised medium for rapid growth and bioassays with tobacco tissue cultures’, Physiologia Plantarum, 1962, 15, pp. 473 –497 (doi: 10.1111/j.1399-3054.1962.tb08052.x) [DOI] [Google Scholar]
- 7. Oggema J.N. Kinyua M.G. Ouma J.P. et al.: ‘Agronomic performance of locally adapted sweet potato (Ipomoea batatas (L.) Lam.) cultivars derived from tissue culture regenerated plants’, Afr. J. Biotechnol., 2007, 6, pp. 1418 –1425 [Google Scholar]
- 8. Pitta‐Alvarez S.I. Spollansky T.C. Giulietti A.M.: ‘The influence of different biotic and abiotic elicitors on the production and profile of tropane alkaloids in hairy root cultures of Brugmansia candida’, Enzyme Microb. Technol., 2000, 26, pp. 491 –504 (doi: 10.1016/S0141-0229(99)00137-4) [DOI] [PubMed] [Google Scholar]
- 9. Gomes S.I.L. Novais S.C. Gravato C. et al.: ‘Effect of Cu‐nanoparticles versus one Cu‐salt: analysis of stress biomarkers response in Enchytraeus albidus (Oligochaeta)’, Nanotoxicology, 2012, 6, pp. 134 –143 (doi: 10.3109/17435390.2011.562327) [DOI] [PubMed] [Google Scholar]
- 10. Shah V. Belozerova I.: ‘Influence of metal nanoparticles on the soil microbial community and germination of lettuce seeds’, Water Air Soil Pollut., 2009, 197, pp. 143 –148 (doi: 10.1007/s11270-008-9797-6) [DOI] [Google Scholar]
- 11. Navarro E. Baun A. Behra R. et al.: ‘Environmental behavior and ecotoxicity of engineered nanoparticles to algae, plants, and fungi’, Ecotoxicology, 2008, 17, pp. 372 –386 (doi: 10.1007/s10646-008-0214-0) [DOI] [PubMed] [Google Scholar]
- 12. Masarovicova E. Kralova K.: ‘Metal nanoparticles and plants’, Ecol. Chem. Eng. S, 2013, 20, pp. 9 –22 [Google Scholar]
- 13. Kim J.S. Kuk E. Yu K.N. et al.: ‘Antimicrobial effects of silver nanoparticles’, Nanomedicine, 2007, 3, pp. 95 –101 (doi: 10.1016/j.nano.2006.12.001) [DOI] [PubMed] [Google Scholar]
- 14. Safavi K.: ‘Evaluation of using nanomaterial in tissue culture media and biological activity’. Second Int. Conf. on Ecological, Environmental and Biological Sciences (EEBS'2012), Bali, Indonesia, 13–14 October 2012. [Google Scholar]
- 15. Abbasi B.H. Khan M.A. Mahmood T. et al.: ‘Shoot regeneration and free‐radical scavenging activity in Silybum marianum L’, Plant Cell Tissue Organ Cult., 2010, 101, pp. 371 –376 (doi: 10.1007/s11240-010-9692-x) [DOI] [Google Scholar]
- 16. Savithramma N. Ankanna S. Bhumi G.: ‘Effect of nanoparticles on seed germination and seedling growth of Boswellia ovalifoliolata – an endemic and endangered medicinal tree taxon’, Nano Vis., 2012, 2, pp. 61 –68 [Google Scholar]
- 17. Ushahra J. Malik C.P.: ‘Putrescine and ascorbic acid mediated enhancement in growth and antioxidant status of Eruca sativa varieties’, CIBTech J. Biotechnol., 2013, 2, pp. 53 –64 [Google Scholar]
- 18. Abdul‐Baki A.A. Anderson J.D.: ‘Vigor determination in soybean and seed multiple criteria’, Crop Sci., 1973, 13, pp. 630 –633 (doi: 10.2135/cropsci1973.0011183X001300060013x) [DOI] [Google Scholar]
- 19. Lee S.K. Zakaria H.M. Cheng H.S. et al.: ‘Evaluation of antioxidant potential of natural products’, Comb. Chem. High Throughput Screen., 1998, 1, pp. 35 –46 [PubMed] [Google Scholar]
- 20. Prieto P. Pineda M. Aguilar M.: ‘Spectrophotometric quantitation of antioxidant capacity through the formation of a phosphomolybdenum complex: specific application to the determination of vitamin E’, Anal. Biochem., 1999, 269, pp. 337 –341 (doi: 10.1006/abio.1999.4019) [DOI] [PubMed] [Google Scholar]
- 21. Aliyu A.B. Ibrahim H. Ibrahim M.A. et al.: ‘Free radical scavenging and total antioxidant capacity of methanol extract of Ethulia conyzoides growing in Nigeria’, Rom. Biotechnol. Lett., 2012, 17, pp. 7458 –7465 [Google Scholar]
- 22. Young I.S.: ‘Measurement of total antioxidant capacity’, J. Clin. Pathol., 2001, 54, p. 339 (doi: 10.1136/jcp.54.5.339) [DOI] [PMC free article] [PubMed] [Google Scholar]
- 23. Singleton V.L. Rossi J.A.: ‘Colorimetry of total phenolics with phosphomolybdic‐phosphotungstic acid reagents’, Am. J. Enol. Viticult., 1965, 16, pp. 144 –153 [Google Scholar]
- 24. Haq I.U. Ullah N. Bibi G. et al.: ‘Antioxidant and cytotoxic activities and phytochemical analysis of Euphorbia wallichii root extract and its fractions’, Iran. J. Pharm. Res., 2012, 11, pp. 241 –249 [PMC free article] [PubMed] [Google Scholar]
- 25. Lowry O.H. Rosebrough N.J. Farr A.L. et al.: ‘Protein measurement with the Folin phenol reagent’, J. Biol. Chem., 1951, 193, pp. 265 –275 [PubMed] [Google Scholar]
- 26. Ullah N. Haq I.U. Safdar N. et al.: ‘Physiological and biochemical mechanisms of allelopathy mediated by the allelochemical extracts of Phytolacca latbenia (Moq.) H. Walter’, Toxicol. Ind. Health, 2015, 31, pp. 931 –937 (doi: 10.1177/0748233713483205) [DOI] [PubMed] [Google Scholar]
- 27. Lagrimini L.M.: ‘Wound‐induced deposition of polyphenols in transgenic plants overexpressing peroxidase’, Plant Physiol., 1991, 96, pp. 577 –583 (doi: 10.1104/pp.96.2.577) [DOI] [PMC free article] [PubMed] [Google Scholar]
- 28. Rahman L.U. Qureshi R. Yasinzai M.M. et al.: ‘Synthesis and spectroscopic characterization of Ag–Cu alloy nanoparticles prepared in various ratios’, Comptes Rendus Chim., 2012, 15, pp. 533 –538 (doi: 10.1016/j.crci.2012.03.012) [DOI] [Google Scholar]
- 29. Munzuroglu O. Geckil H.: ‘Effects of metals on seed germination, root elongation, and coleoptile and hypocotyl growth in Triticum aestivum and Cucumis sativus’, Arch. Environ. Contamination Toxicol., 2002, 43, pp. 203 –213 (doi: 10.1007/s00244-002-1116-4) [DOI] [PubMed] [Google Scholar]
- 30. Wang X. Sun C. Gao S. et al.: ‘Validation of germination rate and root elongation as an indicator to assess phytotoxicity with Cucumis sativus’, Chemosphere, 2001, 44, pp. 1711 –1721 (doi: 10.1016/S0045-6535(00)00520-8) [DOI] [PubMed] [Google Scholar]
- 31. El‐Temsah Y.S. Joner E.J.: ‘Impact of Fe and Ag nanoparticles on seed germination and differences in bioavailability during exposure in aqueous suspension and soil’, Environ. Toxicol., 2012, 27, pp. 42 –49 (doi: 10.1002/tox.20610) [DOI] [PubMed] [Google Scholar]
- 32. Lee W. An Y. Yoon H. et al.: ‘Toxicity and bioavailability of copper nanoparticles to the terrestrial plants mung bean (Phaseolus radiatus) and wheat (Triticum aestivum): plant uptake for water insoluble nanoparticles’, Environ. Toxicol. Chem., 2008, 27, pp. 1915 –1921 (doi: 10.1897/07-481.1) [DOI] [PubMed] [Google Scholar]
- 33. Brunner T.J. Wick P. Manser P. et al.: ‘In vitro cytotoxicity of oxide nanoparticles: comparison to asbestos, silica, and the effect of particle solubility’, Environ. Sci. Technol., 2006, 40, pp. 4374 –4381 (doi: 10.1021/es052069i) [DOI] [PubMed] [Google Scholar]
- 34. Krishnaraj C. Jagan E.G. Ramachandran R. et al.: ‘Effect of biologically synthesized silver nanoparticles on Bacopa monnieri (Linn.) Wettst Plant growth metabolism’, Process Biochem., 2012, 47, pp. 651 –658 (doi: 10.1016/j.procbio.2012.01.006) [DOI] [Google Scholar]
- 35. Nekrasovaa G.F. Ushakova O.S. Ermakov A.E. et al.: ‘Effects of copper (II) ions and copper oxide nanoparticles on elodea densa planch’, Russ. J. Ecol., 2011, 42, pp. 458 –463 (doi: 10.1134/S1067413611060117) [DOI] [Google Scholar]


