Abstract
This study concerns the optimisation of green synthesis of manganese oxide nanoparticles (MnO NPs) with Dittrichia graveolens (L.) extract via response surface methodology (RSM). Central composite design was used to evaluate the effect of pH, time, and the extract to the metal ratio on the synthesised nanoparticles (NPs). Nine runs were designed to investigate the effect of each parameter while NPs were synthesised under different conditions. Considering the p ‐values (p ‐value < 0.05), it is indicated that the extract to the metal ratio was the most effective parameter. The synthesised NPs were characterised using UV–vis. Synthesis of the NPs by polyphenolic compounds of green reducing agent and their stabilisation by curcumin was confirmed by Fourier transform infrared spectra and the surface morphology of the spherical MnO NPs was studied by field‐emission scanning electron microscopy and transmission electron microscope techniques. The present researchers claimed the optimal condition as follows: time = 56.7 min, pH = 7.2, and the extract to the metal ratio = 87.9 v/v. MnO NPs at optimum condition were then employed for degradation of industrial dyes and they showed high dye degradation activity against Rhodamine B and light green dye. The average size of the synthesised MnO NPs at optimal condition was claimed to be nearly 38 nm.
Inspec keywords: dyes, manganese compounds, nanoparticles, nanofabrication, optimisation, response surface methodology, ultraviolet spectra, visible spectra, Fourier transform infrared spectra, surface morphology, field emission scanning electron microscopy, transmission electron microscopy, particle size
Other keywords: optimisation, green synthesis, response surface methodology, manganese oxide nanoparticles, Dittrichia graveolens extract, central composite design, UV‐vis spectra, polyphenolic compounds, reducing agent, curcumin, Fourier transform infrared spectra, surface morphology, field‐emission scanning electron microscopy, transmission electron microscopy, industrial dye degradation, Rhodamine B, light green dye, time 56.7 min, MnO
1 Introduction
Particles with a size up to 100 nm are usually referred as nanoparticles (NPs) [1, 2]. Metal NPs have been extensively studied due to their high specific surface and approved antibacterial and antifungal activities, catalytic, magnetic properties and optical characteristics. Increasing the specific surface area of NP induces their biological effectiveness as a result of an increase in surface energy. Metal oxide NPs are used in generators, vending machines, wrist watches, drug delivery [3] and so on. Nowadays nanotechnology‐based products are extensively used in personal‐care products, cosmetics, and clothing [4]. Interests in green chemistry have been increased in last few decades in order to eliminate or minimise the waste and utilisation of toxic materials [5, 6]. Green chemistry concerns using non‐toxic materials [7], environmentally friendly solvents, and chemicals [8, 9], moreover, it deals with the reduced production of harmful materials [10, 11, 12]. NPs can be synthesised through various methods. Typical methods for synthesis of NPs apply toxic chemicals as reducing agents or as stabilising agents to preclude NPs from agglomeration [12]. The noble therapeutic applications of NP oblige using environmentally friendly methods [13]. Using enzymes [14], plant extracts [2], and microorganisms are the biological methods of synthesis of NPs [15].
Synthesis of NPs is to reduce the metal ions in the solution using a reducing agent. NPs are highly reactive due to their high surface energy, and they are aggregated without protection [6]. Lots of natural and synthetic polymers are being used as stabilising agents to prevent metal NPs from sedimentation, agglomeration, and oxidation [16]. Manganese NPs (MnO NPs) are being widely used in wastewater treatment, rechargeable batteries, and sensors of p‐nitrophenol, molecular sieve, magnetic materials, and catalysis [17, 18, 19, 20, 21].
Dittrichia graveolens (D. graveolens) (L.) is a herbaceous plant belonging to Asteraceae family widespread in Mediterranean area [22]. It has been traditionally used as a remedy for cold and wound infection [23] and the biological activities of the extracted plant such as antioxidant [24], antimicrobial [25], and cytotoxic activities [26] have been reported.
Some of the dyes like azo‐dyes which are released from industrial processes show high cytotoxic effects on the human and animals [27]. The previous study has shown the ability of green synthesised manganese NPs to degrade Congo red and Safranin O dyes [28]. High surface area of MnO NPs makes them one of the most important environmental friendly catalyst materials [28].
In this approach, distilled water was used as an environmental friendly solvent, and D. graveolens (L.) extracts were used as a reducing agent. Curcumin was extracted from turmeric for surface functionalisation of Mn NPs and it was also used as a stabilising agent. Having a wide range of therapeutic effects makes curcumin an important medicinal compound, but because of its low solubility in water, it has low bioavailability. Using curcumin for surface functionalisation of NPs can increase their biological activity [11, 29, 30]. Effective parameters such as time, the ratio of the extracts to the metal and pH were optimised via response surface methodology (RSM) in order to achieve optimal conditions for the synthesis of Mn NPs using D. graveolens (L.). Finally, dye degradation activity of MnO NPs is presented.
2 Materials and methods
2.1 Sample preparation
Aerial parts of the D. graveolens (L.) were collected from Gorgan, Iran in October and washed using distilled water and then air‐dried at room temperature (25°C) under the shad. Then they were ground using an electric grinder.
2.2 Plant extract preparation
10 g of plant materials was boiled in 250 ml distilled water for 2 min. The plant materials were filtered using Whatman no. 1 filter paper and the extracts were centrifuged at 3500 rpm for 15 min and the filtrated extract was dried by evaporating the water with a rotary evaporator. 150 mg of the extract was dissolved in 10 ml distilled water and was stored in an amber bottle, at 10°C until utilisation for the green synthesis of manganese.
For curcumin extraction, 20 g of turmeric was subjected to the Soxhlet apparatus and were extracted with 300 ml of 95% ethanol for 5 h. Turmeric extract was dried at 60°C. 50 mg of the extract was dissolved in 10 ml ethanol and stored in an amber bottle, at 10°C until further uses.
2.3 Green synthesis of MnO NPs
Aqueous solutions of manganese acetate (0.01 M) were prepared in different pH values (4–6–8). Nine runs were designed using Design Expert 10. In order to synthesise MnO NPs, the different volumetric ratio of manganese solution and extracts (15 mg/ml) were mixed (extracts/metal: 10:90, 25:75, and 50:50 v/v). The mixtures remained for 40, 80 and 120 min, and then the fresh extract of curcumin (5 mg/ml) was added to the solutions. The samples were centrifuged at 3500 rpm for 15 min. The NPs were separated from the solutions and then washed for several times using ethanol and distilled water.
3 Statistical analysis
A central composite design from RSM was used to evaluate the effect of various factors in the synthesis of the NPs, and to find an optimum condition as well. The three independent variables including times, extracts to the metal ratio, and pH values were studied (Table 1) to find their influence on the synthesis of the NPs. Analysis of variance (ANOVA) was carried out using Design Expert 10 software. In order to illustrate the capability of the models, the coefficient of determination (R 2), and p ‐values were studied. An insignificant lack of fit and significant model shows the adequacy of the model. The effective factors were represented with a significant p ‐value (p ‐value < 0.05).
Table 1.
Design summary
| Factor | Name | Units | Type | Subtype | Min | Max | Coded values | Coded values | Mean | Std. dev. |
|---|---|---|---|---|---|---|---|---|---|---|
| a | time | min | numeric | continuous | 40 | 120 | −1.000 = 40 | 1.000 = 120 | 80 | 34.641 |
| b | pH | — | numeric | continuous | 4 | 8 | −1.000 = 4 | 1.000 = 8 | 6 | 1.73205 |
| c | EX | % | numeric | continuous | 10 | 50 | −1.000 = 50 | 1.000 = 90 | 28.3333 | 17.5 |
4 Characterisation of MnO NPs
4.1 UV‐vis spectral analysis
The UV–vis spectroscopy is commonly used to characterise different metal NPs in the size range of 2–100 nm [31]. Synthesis of the NP was confirmed by scanning an aqueous solution by UV–vis spectrophotometer at 200–800 nm. All UV–vis spectroscopic measurements of the synthesised MnO NPs were carried out on Perkin Emier, Lambda 25 UV/vis spectrometer.
4.2 Fourier transform infrared (FT‐IR) spectrum analysis
Infrared spectra were recorded by FTIR spectroscopy. 1 mg of the synthesised NPs was mixed with 200 mg KBr and was pressed into a pellet. Infrared spectra were recorded using a (Perkin Elmer – Spectrum 65) FT‐IR spectroscopy, from 4000 to 400 cm−1.
4.3 Field‐emission scanning electron microscopy (FE‐SEM)
FE‐SEM is a commonly used method for characterisation of the morphology and size of NPs [31]. Microstructural characterisation of the synthesised NPs was done by FE‐SEM (HITACHI S‐4160).
4.4 TEM (transmission electron microscope)
The TEM was also used for characterisation of the NPs. The resolution of TEM is 1000‐fold higher than scanning electron microscopy [32]. The NPs were dispersed in 1 ml of distilled water. A few drops of the solution were placed over the carbon‐coated copper grid. After evaporation of the water, TEM measurements were performed using TEM model Philips 30 CM.
4.5 Dye degradation
Light green and Rhodamine B were used to analyse the dye degradation ability of MnO NPs. Dye solutions (50 mg/l) were prepared in distilled water. NPs were dispersed in distilled water (200 μg/ml). Samples containing an equal volume of the dye solution and the NP solution were prepared. The rate of degradation was monitored by measuring the absorbance of the solutions from 400 to 600 nm with a UV–vis spectrophotometer each 5 min.
5 Results and discussions
5.1 Experimental design and optimisation
5.1.1 UV–vis spectra studies
The UV–vis absorption intensity of NP depends on NPs concentration which generally increases with the increase of NPs concentration [17] and an increase in the absorption intensity indicates better solubility and dispersion of the NPs in solution [33, 34]. UV–vis spectroscopy of MnO NPs (Fig. 1) shows the maximum absorption at 284 and 325 nm. This is because of n →π * transition or n →π * and π →π * transitions. Different place of the absorption bands shows that different morphologies and size variations are presented [35]. Maximal absorption at this wavelength indicates the formation of MnO NPs. Maximal absorptions of MnO NPs at 284 nm have summarised in Table 2. The data were analysed and the polynomial equation was presented in Table 3. ANOVA confirmed that the model is significant. The ratio of the extracts to the metal with p ‐value < 0.05 was the only effective parameter (Table 3). Insignificant lack of fit and R 2 = 0.8354 indicate the propriety of the model (Table 3). The effect of each parameter is shown in Fig. 2. The results marks that the most effective parameter was the ratio of the extracts to the metal and Fig. 2 illustrates that the higher ratio of the extract to the metal causes the synthesis of NPs to increase while increasing the time and decreasing the pH provides a minor positive effect. The intensity of the band is seen to be a function of the amount of D. graveolens extract used in the reaction and the increase in the extracts concentration led to an increase in the synthesis of MnO NPs. According to Kumar et al. [21] most of the MnO NPs were synthesised in 30 min and further time did not affect the reaction. Polynomial equations summarised the influence of each factor, and it can be found considering the sign and magnitude of each parameter, e.g. (1) is the final equation in terms of coded and actual factors represented in, e.g. (2).
| (1) |
| (2) |
Fig. 1.
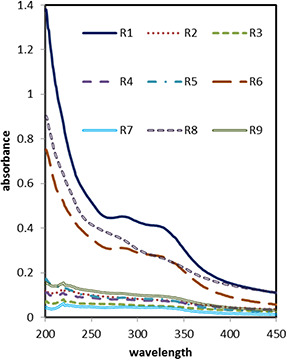
UV–vis spectrum of synthesised MnO NPs
Table 2.
Maximal absorption of Mn NPs at 284 nm
| Stda | Run | Factor 1 A: time | Factor 2 B: pH | Factor 3 C: Ex | Response 1 absorption |
|---|---|---|---|---|---|
| min | % | ||||
| 3 | 1 | 40 | 4 | 50 | 0.4515 |
| 5 | 2 | 40 | 6 | 25 | 0.0981 |
| 2 | 3 | 40 | 8 | 10 | 0.0579 |
| 7 | 4 | 80 | 4 | 25 | 0.0799 |
| 6 | 5 | 80 | 6 | 10 | 0.0463 |
| 1 | 6 | 80 | 8 | 50 | 0.3099 |
| 4 | 7 | 120 | 4 | 10 | 0.046 |
| 9 | 8 | 120 | 6 | 50 | 0.573 |
| 8 | 9 | 120 | 8 | 25 | 0.1068 |
a Standard order.
Table 3.
Analyse of variance
| Source | Sum of squares | dfa | Mean square | Value | p ‐value Prob > F | |
|---|---|---|---|---|---|---|
| model | 0.26 | 3 | 0.088 | 8.46 | 0.0210 | significant |
| a‐time | 2.332 × 10⁻³ | 1 | 2.332 × 10⁻³ | 0.22 | 0.6555 | — |
| b‐pH | 1.761 × 10⁻³ | 1 | 1.761 × 10⁻³ | 0.17 | 0.6975 | — |
| c‐EX | 0.26 | 1 | 0.26 | 24.99 | 0.0041 | significant |
| residual | 0.052 | 5 | 0.010 | — | — | — |
| cor total | 0.32 | 8 | — | — | — | — |
a Degree of freedom.
Fig. 2.

Effect of factors on synthesise of NPs
5.1.2 Optimisation of synthesis of MnO NPs
The normal plot that is shown in Fig. 3 d indicates the normality of the data and the response surface plots shown in Figs. 3 a –c give information about the significance of factor C. Figs. 3 a and b indicate that the increase in the concentration of the extract increases the synthesis of MnO NPs while the increase in pH and time did not change the result significantly (Fig. 3 c). The optimum condition for the synthesis of MnO NP was found to be as follows: time = 56.7 min, pH = 7.2, and Ex% = 87.9 v/v in order to obtain maximal absorption 0.787.
Fig. 3.
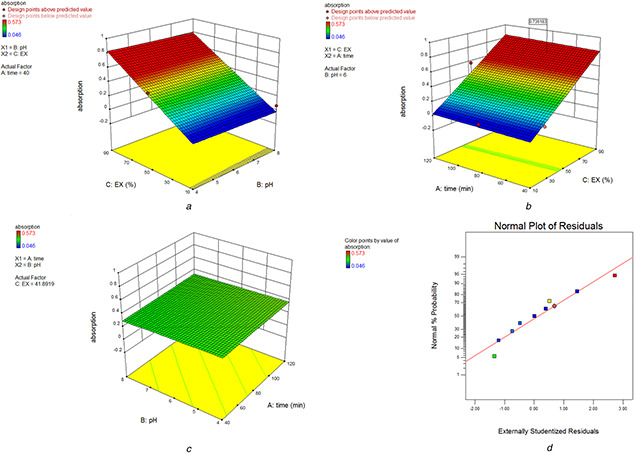
3D plot showing the effect of
(a) pH and Ex, (b) Ex and time, (c) pH and time, (d ) On absorbance and normal plot
5.2 Characterisation of MnO NPs
5.2.1 UV–vis spectral analysis
Fig. 4 indicates the UV–vis plot of MnO NPs stabilised by curcumin in optimum condition. Maximal absorption at 240 nm indicates the presence of MnO NPs which are stabilised by curcumin.
Fig. 4.
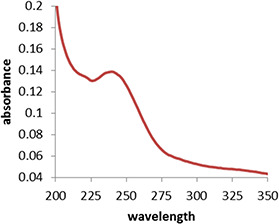
UV–vis spectrum of MnO NPs in optimum condition
5.2.2 FT‐IR studies
It has been reported in the literature that plant constituents play a key role in the reduction of metal ions [36, 37]. FT‐IR spectroscopy was used to identify the responsible functional group existing in the biomolecules of the D. graveolens extract to reduce the manganese ions.
FT‐IR spectra of turmeric and D. graveolens extract are shown in Fig. 5. A spectrum of the MnO NPs is shown in Fig. 5 c. The broad peak at 3420 cm−1 corresponds to an O–H band stretching vibration presence in the system [11]. Peaks around 470, 509, 700 and 798 cm−1 were due to MnO NPs [21, 38]. The peak at 2917 cm−1 relates to –C = C bond, 1500–1560 cm−1 peaks relate to the aromatic C = C bond of curcumin system which surrounds the NPs and prevents them from agglomeration. The C = O bond of curcumin appears at 1650 cm−1. The C–O band of curcumin was assigned by the peak at 1030 cm−1. FT‐IR spectra of the extracts (Figs. 5 a and b) also show the OH bending modes of the phenolic compounds of the extracts which are responsible for the reduction of ions and peaks at 1500–1700 relate to C = C bands of aromatic rings of phenolic compounds.
Fig. 5.
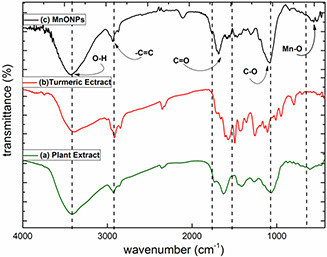
FT‐IR spectrum of
(a) D. graveolens extract, (b) Turmeric extract, (c) MnO NPs
Comparison of the spectra of the extracts and MnO NPs indicates the effect of the extracts in the synthesis of the NPs.
5.2.3 FE‐SEM and TEM studies
FE‐SEM images of MnO NPs at optimum condition were shown in Fig. 6. It is shown that spherical NPs are formed with an average diameter of 38 nm. These results illustrate the formation of MnO NPs using reduction agent (D. graveolens extracts).
Fig. 6.
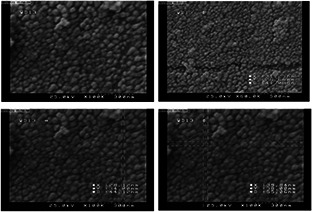
FE‐SEM characterisation of MnO NPs
The morphology and structure of the MnO NPs at higher resolution are shown in the TEM images (Fig. 7). The images obviously indicate the presence of secondary material capping NPs which assigned to bioorganic compounds that synthesised and stabilised the spherical MnO NPs [39, 40, 41].
Fig. 7.
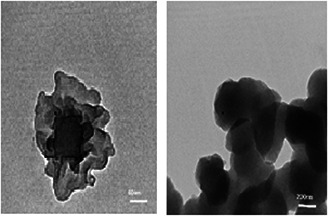
TEM images of MnO NPs
5.3 Dye degradation
The kinetics of light green and Rhodamine B degradation using MnO NPs were monitored using UV–vis spectroscopy. Fig. 8 a shows the UV–vis spectra of the decomposition of the light green over the variation of the time from 0 to 17 min; in addition, a decreasing of absorbance at a maximum wavelength of 625 nm is observed. Light green id degraded almost completely in 17 min. Fig. 8 b illustrates UV–vis spectra of decomposed Rhodamine B dye at different periods of time from 0 to 22 min and shows the maximum absorption wavelength at 540 nm. Absorbance intensities of the Rhodamine B solutions are decreased by the presence of MnO NPs over the variation of the time. Rhodamine B dye is degraded almost completely in 22 min.
Fig. 8.
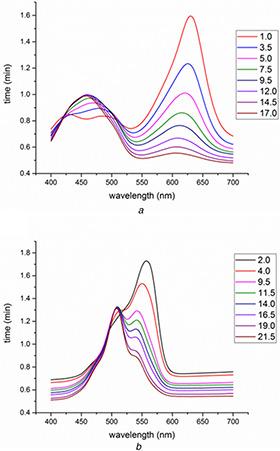
Dye degradation of
(a) Light green and, (b) Rhodamine B using MnO NPs with time
6 Conclusions
In this study, MnO NPs were synthesised using D. graveolens extract. This method is green, fast and economical. This study was carried out to optimise the synthesis of MnO NPs by using RSM. The parameters of enhancement including time, the extract to the metal ratio and pH were observed. The results indicate that the increase in the concentration of the extract increases the synthesis of MnO NPs while the increase in pH and time did not change the result significantly. The morphological study of the synthesised MnO NPs with FE‐SEM and TEM revealed that the NPs were spherical with an average size of 38 nm. FTIR spectra illustrate the effect of plant extracts in the extraction of NPs. The dye degradation activity of the synthesised NPs was carried out by performing the decomposition of Rhodamine B and light green dyes by adding the synthesised MnO NPs which showed that the absorbance of the dye decreased after 20 min.
7 References
- 1. Makkar H.P. Blümmel M. Borowy N.K. et al.: ‘Gravimetric determination of tannins and their correlations with chemical and protein precipitation methods’, J. Sci. Food Agric., 1993, 61, (2), pp. 161 –165 [Google Scholar]
- 2. Bakkali F. Averbeck S. Averbeck D. et al.: ‘Biological effects of essential oils–a review’, Food Chem. Toxicol., 2008, 46, (2), pp. 446 –475 [DOI] [PubMed] [Google Scholar]
- 3. Treutter D.: ‘Significance of flavonoids in plant resistance: a review’, Environ. Chem. Lett., 2006, 4, (3), p. 147 [Google Scholar]
- 4. Handa S.S. Khanuja S.P.S. Longo G. et al.: ‘Extraction technologies for medicinal and aromatic plants’ (Trieste (Italy): Earth, Environmental and Marine Sciences and Technologies, 2008) [Google Scholar]
- 5. Nerio L.S. Olivero‐Verbel J. Stashenko E.: ‘Repellent activity of essential oils: a review’, Bioresour. Technol., 2010, 101, (1), pp. 372 –378 [DOI] [PubMed] [Google Scholar]
- 6. González‐Coloma A. Martín‐Benito D. Mohamed N. et al.: ‘Antifeedant effects and chemical composition of essential oils from different populations of Lavandula luisieri L’, Biochem. Syst. Ecol., 2006, 34, (8), pp. 609 –616 [Google Scholar]
- 7. Haseeb M.T. Hussain M.A. Abbas K. et al.: ‘Linseed hydrogel‐mediated green synthesis of silver nanoparticles for antimicrobial and wound‐dressing applications’, Int. J. Nanomed., 2017, 12, p. 2845 [DOI] [PMC free article] [PubMed] [Google Scholar]
- 8. Vishwasrao C. Momin B. Ananthanarayan L.: ‘Green synthesis of silver nanoparticles using sapota fruit waste and evaluation of their antimicrobial activity’, Waste Biomass Valorization, 2018, pp. 1 –11 [Google Scholar]
- 9. Hussain M.A. Shah A. Jantan I. et al.: ‘One pot light assisted green synthesis, storage and antimicrobial activity of dextran stabilized silver nanoparticles’, J. Nanobiotechnol., 2014, 12, (1), p. 53 [DOI] [PMC free article] [PubMed] [Google Scholar]
- 10. Savelev S. Okello E. Perry N. et al.: ‘Synergistic and antagonistic interactions of anticholinesterase terpenoids in Salvia lavandulaefolia essential oil’, Pharmacol. Biochem. Behav., 2003, 75, (3), pp. 661 –668 [DOI] [PubMed] [Google Scholar]
- 11. Savelev S.U. Okello E.J. Perry E.K.: ‘Butyryl‐and acetyl‐cholinesterase inhibitory activities in essential oils of salvia species and their constituents’, Phytother. Res., 2004, 18, (4), pp. 315 –324 [DOI] [PubMed] [Google Scholar]
- 12. Azwanida N.: ‘A review on the extraction methods use in medicinal plants, principle, strength and limitation’, Med. Aromat Plants, 2015, 4, pp. 196, doi: 2167–0412.1000196 [Google Scholar]
- 13. Miguel M.G.: ‘Antioxidant and anti‐inflammatory activities of essential oils: a short review’, Molecules, 2010, 15, (12), pp. 9252 –9287 [DOI] [PMC free article] [PubMed] [Google Scholar]
- 14. Burt S.: ‘Essential oils: their antibacterial properties and potential applications in foods – a review’, Int. J. Food Microbiol., 2004, 94, (3), pp. 223 –253 [DOI] [PubMed] [Google Scholar]
- 15. Kumar R. Tripathi Y.: ‘Getting fragrance from plants’, ‘Training manual on extraction technology of natural dyes & aroma therapy and cultivation value addition of medicinal plants’ (Forest Research Institute, Dehradun, Indian, 2011, 1 edn.), pp. 77 –102 [Google Scholar]
- 16. Kaufmann B. Christen P.: ‘Recent extraction techniques for natural products: microwave‐assisted extraction and pressurised solvent extraction’, Phytochem. Anal., 2002, 13, (2), pp. 105 –113 [DOI] [PubMed] [Google Scholar]
- 17. Steffen L.M.: ‘Eat your fruit and vegetables’, Lancet, 2006, 367, (9507), pp. 278 –279 [DOI] [PubMed] [Google Scholar]
- 18. Hagerman A.E. Butler L.G.: ‘Choosing appropriate methods and standards for assaying tannin’, J. Chem. Ecol., 1989, 15, (6), pp. 1795 –1810 [DOI] [PubMed] [Google Scholar]
- 19. Becker K. Makkar H.P. Siddhuraju P. et al.: ‘Plant secondary metabolites’, (Springer, Humana Press, 2007), pp. 1 –3 [DOI] [PubMed] [Google Scholar]
- 20. Hagerman A.E. Butler L.G.: ‘Protein precipitation method for the quantitative determination of tannins’, J. Agric. Food Chem., 1978, 26, (4), pp. 809 –812 [Google Scholar]
- 21. Kumar V. Singh K. Panwar S. et al.: ‘Green synthesis of manganese oxide nanoparticles for the electrochemical sensing of P‐nitrophenol’, Int. Nano Lett., 2017, 7, (2), pp. 123 –131 [Google Scholar]
- 22. Blanc M.C. Muselli A. Bradesi P. et al.: ‘Chemical composition and variability of the essential oil of Inula graveolens from Corsica’, Flavour Fragrance J., 2004, 19, (4), pp. 314 –319 [Google Scholar]
- 23. Pieroni A. Giusti M.E. De Pasquale C. et al.: ‘Circum‐Mediterranean cultural heritage and medicinal plant uses in traditional animal healthcare: a field survey in eight selected areas within the RUBIA project’, J. Ethnobiol. Ethnomed., 2006, 2, (1), p. 1 [DOI] [PMC free article] [PubMed] [Google Scholar]
- 24. Giamperi L. Bucchini A. Cara P. et al.: ‘Composition and antioxidant activity of Nepeta foliosa essential oil from Sardinia (Italy)’, Chem. Nat. Compd., 2009, 45, (4), pp. 554 –556 [Google Scholar]
- 25. Mitic V. Jovanovic V.S. Ilic M. et al.: ‘ Dittrichia graveolens (L.) Greuter essential oil: chemical composition, multivariate analysis, and antimicrobial activity’, Chem. Biodivers., 2016, 13, (1), pp. 85 –90 [DOI] [PubMed] [Google Scholar]
- 26. Topcu G. Oksuz S. Shieh H.L. et al.: ‘Cytotoxic and antibacterial sesquiterpenes from Inula‐graveolens ’, Phytochemistry, 1993, 33, (2), pp. 407 –410 [Google Scholar]
- 27. Nony C.R. Bowman M.C. Cairns T. et al.: ‘Metabolism studies of an azo dye and pigment in the hamster based on analysis of the urine for potentially carcinogenic aromatic amine metabolites’, J. Anal. Toxicol., 1980, 4, (3), pp. 132 –140 [DOI] [PubMed] [Google Scholar]
- 28. Moon S.A. Salunke B.K. Alkotaini B. et al.: ‘Biological synthesis of manganese dioxide nanoparticles by Kalopanax pictus plant extract’, IET Nanobiotechnol., 2015, 9, (4), pp. 220 –225 [DOI] [PubMed] [Google Scholar]
- 29. Haslam E.: ‘Vegetable tannins. Biochemistry of plant phenolics’ (Springer, US, 1979), pp. 475 –523 [Google Scholar]
- 30. Hagerman A.E. Butler L.G.: ‘The specificity of proanthocyanidin‐protein interactions’, J. Biol. Chem., 1981, 256, (9), pp. 4494 –4497 [PubMed] [Google Scholar]
- 31. Mittal A.K. Chisti Y. Banerjee U.C.: ‘Synthesis of metallic nanoparticles using plant extracts’, Biotechnol. Adv., 2013, 31, (2), pp. 346 –356 [DOI] [PubMed] [Google Scholar]
- 32. Eppler A.S. Rupprechter G. Anderson E.A. et al.: ‘Thermal and chemical stability and adhesion strength of Pt nanoparticle arrays supported on silica studied by transmission electron microscopy and atomic force microscopy’, J. Phys. Chem. B, 2000, 104, (31), pp. 7286 –7292 [Google Scholar]
- 33. Rathi B. Bodhankar S. Baheti A.: ‘Evaluation of aqueous leaves extract of Moringa oleifera Linn for wound healing in albino rats’, 2006. [PubMed]
- 34. De Castro M.L. Garcıa‐Ayuso L.: ‘Soxhlet extraction of solid materials: an outdated technique with a promising innovative future’, Anal. Chim. Acta, 1998, 369, (1), pp. 1 –10 [Google Scholar]
- 35. Trusheva B. Trunkova D. Bankova V.: ‘Different extraction methods of biologically active components from propolis: a preliminary study’, Chem. Cent. J., 2007, 1, (1), p. 13 [DOI] [PMC free article] [PubMed] [Google Scholar]
- 36. Rajakumar G. Rahuman A.A. Priyamvada B. et al.: ‘ Eclipta prostrata leaf aqueous extract mediated synthesis of titanium dioxide nanoparticles’, Mater. Lett., 2012, 68, pp. 115 –117 [Google Scholar]
- 37. Muzaffar S. Tahir H.: ‘Enhanced synthesis of silver nanoparticles by combination of plants extract and starch for the removal of cationic dye from simulated waste water using response surface methodology’, J. Mol. Liq., 2018, 252, pp. 368 –382 [Google Scholar]
- 38. Ranitha M. Nour A.H. Ziad A. et al.: ‘Optimization of microwave assisted hydrodistillation of Lemongrass (Cymbopogon citratus) using response surface methodology’, Int. J. Res. Eng. Technol., 2014, 3, pp. 5 –14 [Google Scholar]
- 39. Sangeetha G. Rajeshwari S. Venckatesh R.: ‘Green synthesis of zinc oxide nanoparticles by Aloe barbadensis miller leaf extract: structure and optical properties’, Mater. Res. Bull., 2011, 46, (12), pp. 2560 –2566 [Google Scholar]
- 40. Huang J. Li Q. Sun D. et al.: ‘Biosynthesis of silver and gold nanoparticles by novel sundried Cinnamomum camphora leaf’, Nanotechnology, 2007, 18, (10), p. 105104 [Google Scholar]
- 41. Wang M. Na E.K. Kim J.S. et al.: ‘Photoluminescence of ZnO nanoparticles prepared by a low‐temperature colloidal chemistry method’, Mater. Lett., 2007, 61, (19), pp. 4094 –4096 [Google Scholar]


