Abstract
p ‐Hydroxyphenylacetate 3‐hydroxylase component 1 (C 1) is a useful enzyme for generating reduced flavin and NAD+ intermediates. In this study, poly(lactide‐co‐glycolide) (PLGA) nanoparticles (NPs) were used to encapsulate the C 1 (PLGA‐C 1 NPs). Enzymatic activity, stability, and reusability of PLGA‐C 1 NPs prepared using three different methods [oil in water (o/w), water in oil in water (w/o/w), and solid in oil in water (s/o/w)] were compared. The s/o/w provided the optimal conditions for encapsulation of C 1 (PLGA‐C 1,s NPs), giving the highest enzyme activity, stability, and reusability. The s/o/w method improves enzyme activity ∼11 and 9‐fold compared to w/o/w (PLGA‐C 1,w NPs) and o/w (PLGA‐C 1,o NPs). In addition, s/o/w prepared PLGA‐C 1,s NPs could be reused 14 times with nearly 50% activity remaining, a much higher reusability compared to PLGA‐C 1,o NPs and PLGA‐C 1,w NPs. These nanovesicles were successfully utilised to generate reduced flavin mononucleotide (FMN) and supply this cofactor to a hydroxylase enzyme that has application for synthesising anti‐inflammatory compounds. Therefore, this recycling biocatalyst prepared using the s/o/w method is effective and has the potential for use in combination with other enzymes that require reduced FMN. Application of PLGA‐C 1,s NPs may be possible in additional biocatalytic processes for chemical or biochemical production.
Inspec keywords: nanoparticles, enzymes, biotechnology, biochemistry, recycling, catalysts, nanofabrication, encapsulation
Other keywords: reductase component, poly(lactide‐co‐glycolide) nanoparticles, emulsification techniques, p‐hydroxyphenylacetate 3‐hydroxylase component, NAD+ intermediates, PLGA, enzymatic activity, PLGA‐C1 reusability, water in oil in water methods, solid in oil in water methods, oil in water methods, optimal conditions, encapsulation, enzyme stability, enzyme reusability, s/o/w method, reduced flavin mononucleotide, hydroxylase enzyme, anti‐inflammatory compounds, recycling biocatalyst, FMN, biocatalytic processes, biochemical production, chemical production
1 Introduction
The reductase component of p ‐hydroxyphenylacetate hydroxylase (C 1) from Acinetobacter baumannii generates reduced flavin mononucleotide (FMN) [1, 2, 3], an important intermediate in numerous biochemical reactions. For example, C 1 is used in combination with the large component of p ‐hydroxyphenylacetate hydroxylase (C 2) to produce 3,4‐dihydroxyphenylacetate (DHPA) under aerobic conditions. In addition, C 1 can be used to generate intermediates for the synthesis of trihydroxyphenolic acids, high‐value compounds that have anti‐inflammatory and free radical scavenging activities [4, 5]. The C 1 enzyme has the potential for use in many biocatalytic processes; however, its application is limited. Increasing the cost‐effectiveness of utilising C 1 through enhancing stability and regeneration would allow for greater use of the enzyme. Therefore, development of methods to reuse and protect C 1 would be beneficial for both biotechnological and medical applications.
Protein immobilisation approaches using polymeric microparticles/nanoparticles (NPs) has attracted significant interest for improving enzyme reusability and stability [6, 7, 8]. Poly(lactide‐co‐glycolide) (PLGA) has been widely employed for protein encapsulation and immobilisation. This copolymer can be hydrolysed into the natural substrates lactic acid and glycolic acid, which have low toxicity and provide excellent biocompatibility [9, 10]. There are several methods for successful preparation of enzyme encapsulated PLGA microspheres including oil in water (o/w), water in oil in water (w/o/w), and solid in oil in water (s/o/w) [8, 11, 12, 13]. In this study, the three different techniques for preparing enzyme encapsulations in PLGA NPs were compared in terms of loading efficiency (LE), protein release, stability, and reusability of the C 1 loaded PLGA NPs. The NPs prepared using conditions for optimal encapsulation of C 1 were subsequently employed in a coupled enzyme assay with the C 2 hydroxylase to produce DHPA using DHPA dioxygenase (DHPAO).
2 Materials and methods
2.1 Materials
PLGA (MW 60,000 g/mol) was obtained from Akina, Inc. Poly(vinyl alcohol) (PVA) (MW 9,000–10,000 g/mol), FMN, nicotinamide adenine dinucleotide (NADH), hydroxyphenylacetate (HPA), DEAE–sepharose, and phenyl‐sepharose were purchased from Sigma Chemical Co. Dichloromethane (DCM) was supplied by RCI Labscan Ltd. The Micro BCA kit assay was from Thermo scientific and G‐25 was obtained from Pharmacia. Concentrations of the following compounds were determined using known extinction coefficients at pH 7: NADH, Ɛ 340 = 6.22 mM−1 cm−1; FMN, Ɛ 446 = 12.2 mM−1 cm−1; and HPA, Ɛ 277 = 1.55 mM−1 cm−1
2.2 Optimisation of C 1 encapsulated PLGA NP formulation (PLGA‐C 1 NPs)
Enzyme encapsulated PLGA NPs were prepared using o/w, w/o/w, and s/o/w encapsulation methods, modified from the procedures reported by Morales‐Cruz and co‐workers and Montalvo‐Ortiz and co‐workers [8, 9].
The schematic representation of general procedure is shown in Fig. 1. Using the o/w method, aqueous C 1 was added to 2 ml of 5% (w/v) PVA, which acts as a stabiliser/emulsifier (water phase). Then 0.5 ml of the oil phase containing 50 mg of PLGA was added drop‐wise into the water phase while vortexing the solution. The mixed solution was subsequently emulsified by sonication with three cycles of 30 s pulses (38% of amplitude) (VCX 130 sonic with microtip 630‐0422) to produce the PLGA‐C 1 NPs. Following the sonication cycles, the solution was rapidly diluted into 25 ml of 0.3% PVA with stirring. The solution was stirred for an additional 4 h to allow evaporation of the organic solvent. The PLGA NPs were isolated from the mixture by centrifugation at 26,892g for 15 min. PLGA‐NPs were washed three times with deionised water and subsequently dried by lyophilisation.
Fig. 1.
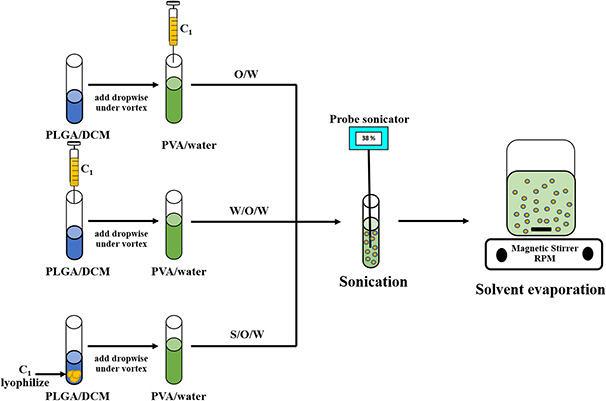
Schematic representation of general procedure of preparation of C1 encapsulated PLGA NPs from o/w, w/o/w, and s/o/w
Preparation of NPs using the w/o/w method was initiated using aqueous C 1 (water phase) followed by addition of 0.5 ml DCM containing 50 mg of PLGA (oil phase). The oil phase (with C 1) was added drop‐wise into 2 ml of 5% (w/v) PVA (water phase), which acts as an emulsifier. The mixture was vortexed during the solution addition. The mixture was emulsified, collected, and stored using the same procedure as described for the o/w method.
NP preparation using the s/o/w method utilised C 1 lyophilised powder (solid) suspended in 50 mg of PLGA dissolved in 0.5 ml DCM (oil phase). The oil phase (with C 1) was added drop‐wise into 2 ml of 5% (w/v) PVA, which acts as an emulsifier (water phase). The mixture was vortexed during the solution addition. The mixture was emulsified, collected, and stored using the same procedure described for the first and second methods. Control PLGA NPs were prepared using the same procedures without the addition of the C 1 enzyme.
2.3 Characterisation of NP size, zeta potential, and morphology
Physico‐chemical characterisations were performed to evaluate the NP preparations. NPs were dispersed in Milli Q water before characterisation. The size and zeta potential of the particles were analysed using a Nanosizer 90 ZS (Malvern Instrument Ltd, Malvern, UK) at 25°C. The results were reported as a mean of three independent readings, with at least ten runs within each analysis, ± standard deviation. The size and surface morphology were characterised using field emission scanning electron microscopy (FESEM) JSM‐7001F (JEOL GmbH, Germany) using the secondary electron image mode. The lyophilised PLGA NPs were fixed on double‐sided adhesive carbon tape, dried under vacuum, and coated with gold. The images were taken at 5 keV.
2.4 Determination of yield, LE, and encapsulation efficiency (EE)
Yields of NPs from various synthesis conditions were determined by measuring the weight of the NPs and compared to the weight of feeding protein and PLGA polymer in the reactions. The percent yields were obtained from the following equation:
| (1) |
Determination of enzyme content within the NPs was performed to evaluate LE and EE. PLGA‐C 1 NPs were dissolved in lysis buffer (5% SDS in 0.1 M NaOH) and incubated overnight at 37°C with shaking 250 rpm before measurement of protein content with the BCATM protein assay kit, according to manufacturer's protocol. LE was determined using (2) whereas EE was calculated from (3).
| (2) |
| (3) |
PLGA is the quantity of NPs obtained, Polymer is the amount of PLGA polymer used for the synthesis of NPs, C 1PLGA is the total amount of C 1 in PLGA NPs, and C 1tot is the total amount of C 1 used in the PLGA‐C 1 NP synthesis.
2.5 C 1 activity assay
Enzyme activity for free C 1 or PLGA‐C 1 NPs was monitored by following the oxidation of NADH at absorbance 340 nm [2]. The assays were performed in 1 ml of sodium phosphate buffer pH 7.5 containing 5 µM FMN, 200 µM NADH, 200 µM HPA, and 0.5 mg/ml of PLGA‐C 1 NPs at 4°C with stirring. The assay solutions were centrifuged at 26,892g at 4°C for 3 min to sediment NPs. The oxidation of NADH was monitored in the supernatant using a UV–Vis spectrophotometer (Agilent 8453 UV‐visible) with each analysis performed in triplicate. One unit of enzyme is defined as the amount of enzyme required for reducing of 1 µmole of NADH per minute under the assay conditions.
2.6 Stability of PLGA‐C 1 NPs
PLGA‐C 1 NPs (0.5 mg) were incubated in 100 µl of sodium phosphate buffer at pH 7 before performing the C 1 enzyme activity assay procedure.
2.7 Reusability of PLGA‐C 1 NPs
The C 1 enzyme activity assay procedure was performed using PLGA‐C 1 NPs after re‐generating the NPs following each round. The value obtained from the PLGA‐C 1 NPs prior to the first run was defined as 100%.
2.8 Production of DHPA
The PLGA‐C 1 NPs were used to generate reduced FMN utilised by the hydroxylase enzyme (C 2) for the production of DHPA. An enzymatic coupled assay containing DHPAO was used to observe the production of DHPA [1, 4]. DHPAO converts DHPA to a yellow compound, 5‐carboxymethyl‐2‐hydroxymuconate semialdehyde (CHS), Ɛ 380 = 38 mM−1 cm−1, that gives the highest absorption at 380 nm. The assay was performed in 1 ml of sodium phosphate buffer pH 7.5 containing 5 µM FMN, 200 µM NADH, 200 µM HPA, 24.6 nM hydroxylase enzyme (C 2), excess DHPAO, and 0.5 mg/ml of PLGA‐C 1 NPs at 4°C with stirring. After incubation, the reaction solution was monitored at 380 nm to observe the production of CHS.
3 Results
3.1 Characterisation of PLGA‐C 1 NPs prepared by o/w (PLGA‐C 1,o), w/o/w (PLGA‐C 1,w), and s/o/w (PLGA‐C 1,s) methods
C 1 (molecular weight 36 kDa) was expressed in E. coli BL21(DE3). The enzyme activity of C 1 was determined by monitoring the decrease of NADH by following absorbance 340 nm (HPA acts as an effector for this enzyme reaction). The specific activity of purified C 1 was 6.4 × 10⁻¹ Uµg−1.
In order to obtain a high yield and retain enzyme activity in monodisperse PLGA‐C 1 NPs, different encapsulation methods and enzyme concentrations were compared. The results of NPs characterisation from different preparation are shown in Table 1.
Table 1.
Characterisation of C 1 encapsulation nanoparticles (PLGA‐C 1 NPs) from different preparation conditions
| Method | Amount of enzyme, mg/ml | Size (nm) ± SD | Zeta potential (mV) ± SD | PdI | C 1 activitya ± SD | Yield, % | EE, % | LE, % |
|---|---|---|---|---|---|---|---|---|
| o/w | 0.0 | 300.9 ± 5.9 | −24.5 ± 0.2 | 0.122 ± 0.055 | 0.00 | 49.2 | 0.00 | 0.00 |
| 0.4 | 327.6 ± 10.6 | −24.7 ± 0.1 | 0.068 ± 0.011 | 2.14 ± 0.46 | 52.19 | 38.85 ± 15.70 | 0.29 ± 0.11 | |
| 2.0 | 303.7 ± 15.6 | −21.9 ± 0.5 | 0.081 ± 0.084 | 1.87 ± 0.46 | 54.5 | 53.79 ± 15.68 | 1.93 ± 0.56 | |
| 4.0 | 323.4 ± 6.3 | −21.3 ± 0.4 | 0.140 ± 0.017 | 8.03 ± 0.80 | 45.76 | 43.41 ± 14.35 | 3.67 ± 1.20 | |
| 6.0 | 340.6 ± 9.8 | −26.5 ± 1.4 | 0.174 ± 0.021 | 5.89 ± 0.46 | 48.3 | 59.54 ± 5.48 | 6.97 ± 0.64 | |
| 8.0 | 315.3 ± 8.4 | −23.8 ± 0.3 | 0.107 ± 0.036 | 4.82 ± 1.39 | 48.14 | 70.72 ± 7.72 | 10.80 ± 1.18 | |
| w/o/w | 0.0 | 300.9 ± 5.9 | −24.5 ± 0.2 | 0.122 ± 0.055 | 0.00 | 49.2 | 0.00 | 0.00 |
| 0.4 | 283.1 ± 3.9 | −23.0 ± 10.6 | 0.065 ± 0.043 | 1.87 ± 0.46 | 41.83 | 77.11 ± 16.77 | 0.92 ± 0.34 | |
| 2.0 | 305.0 ± 13.7 | −25.1 ± 0.5 | 0.115 ± 0.043 | 2.67 ± 0.46 | 49.41 | 47.18 ± 16.61 | 1.87 ± 0.65 | |
| 4.0 | 361.8 ± 22.8 | −23.3 ± 0.7 | 0.192 ± 0.005 | 4.01 ± 0.80 | 49.23 | 56.58 ± 5.69 | 4.42 ± 0.44 | |
| 6.0 | 339.4 ± 9.3 | −24.6 ± 0.0 | 0.087 ± 0.035 | 4.55 ± 1.67 | 56.6 | 45.76 ± 2.92 | 4.57 ± 0.29 | |
| 8 | 291.7 ± 8.1 | −23.0 ± 0.4 | 0.154 ± 0.031 | 9.64 ± 0.80 | 38.88 | 59.32 ± 7.96 | 11.29 ± 1.51 | |
| s/o/w | 0.0 | 300.9 ± 5.9 | −24.5 ± 0.2 | 0.122 ± 0.055 | 0.00 | 49.2 | 0.00 | 0.00 |
| 8.0 | 377.9 ± 9.5 | −30.9 ± 0.7 | 0.194 ± 0.037 | 90.56 ± 9.10 | 38.14 | 34.82 ± 1.35 | 6.76 ± 0.26 | |
| 20 | 374.8 ± 3.8 | −27.0 ± 0.5 | 0.226 ± 0.039 | 4.30 ± 0.79 | 41.41 | 13.23 ± 0.63 | 5.32 ± 0.28 |
a C 1 activity (×10−3) in PLGA NPs (U/mg PLGA NPs).
PLGA NPs and PLGA‐C 1 NPs showed a relatively homogeneous size distribution, as revealed by polydispersity index (PdI) values of <0.2. The different methods and amount of protein did not significantly affect the size distribution and zeta potential. The same NPs size was also observed in BSA loaded PLGA NPs, even though the protein concentration was greater in these preparations [14]. DCM, a non‐miscible solvent in water, was used for the successful preparation of PLGA NPs [11]. Therefore, DCM is used for this enzyme C 1 encapsulation system. PLGA‐C 1,o, and PLGA‐C 1,w NPs have similar %EE of other reported protein encapsulations (ovalbumin, bovine serum albumin), whereas the %EE of PLGA‐C 1, s NPs is reduced due to the low suspension of the lyophilised enzyme in the solvent, similar to previous reports [8, 14, 15, 16].
The optimal protein concentrations for encapsulation by each method were determined by evaluating the NPs that gave the highest enzyme activity within the PLGA NPs. Therefore, the o/w optimal protein concentration was 4 mg/ml; w/o/w, the best protein concentration was 8 mg/ml protein; and s/o/w, optimal protein concentration was 8 mg/ml. The specific activity of PLGA‐C 1 NPs is reduced compared to free enzyme. This difference is likely due to the fragile nature of this enzyme and the harsh immobilisation conditions. During NP preparation, proteins are exposed to organic solvents which may promote protein denaturation. This study illustrates how encapsulation of fragile enzymes can alter activity in each of the three methods examined. The specific activities of PLGA‐C 1 NPs obtained from o/w, w/o/w, and s/o/w using the optimal protein concentrations were determined and are shown in Fig. 2. Interestingly, PLGA‐C 1, s NPs obtained from s/o/w exhibited improved enzyme specific activity, ∼9 and 11 times greater compared to NP from w/o/w and o/w methods, respectively. The improvement of enzymatic activity using s/o/w may be a result of decreased exposure of the enzyme to organic solvent during the preparation of the emulsion in the first step. This would lead to less protein denaturation at interfaces compared to the protein in liquid form used in the other methods.
Fig. 2.
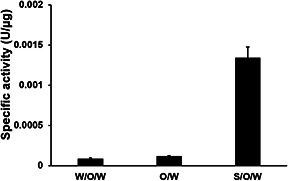
Enzyme activity of PLGA‐C1 NPs prepared from different synthesis conditions: o/w, w/o/w, s/o/w
Another possible cause for low enzyme activity in encapsulated enzyme nanovesicles is that the small pore size of NPs may hinder substrate penetration. Prolonged incubation in buffer results in the hydrolysis of the PLGA NPs which may create larger pores that allow substrates to diffuse into the NPs more easily. The surface morphology of NPs prepared from the optimal conditions was characterised using FESEM is shown in Fig. 3. The images obtained demonstrate that the PLGA and PLGA‐C 1 NPs were uniform, smooth, and spherically shaped, confirming the results previously obtained using dynamic light scattering and shown in Table 1. Overall, the formation of PLGA‐C 1 NPs from o/w (PLGA‐C 1,o), w/o/w (PLGA‐C 1,w), and s/o/w (PLGA‐C 1,s) was successful and the optimal condition from each method was used for further studies.
Fig. 3.
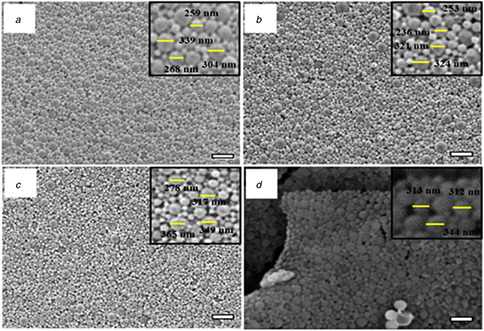
FESEM images of PLGA‐C1 NPs a) PLGA NPs, (b) PLGA‐C 1,o, (c) PLGA‐C 1,w, (d) PLGA‐C 1,s NPs (scale bar = 1 µm)
3.2 Stability of enzyme PLGA‐C 1 NPs
NPs prepared using the optimal conditions for o/w, w/o/w, and s/o/w were used to determine the stability of C 1 in PLGA NPs and shown in Fig. 4. The enzyme assay was performed using different enzyme units for free C 1 (6.39 × 10⁻³ U) and PLGA‐C 1 NPs (4.8 × 10⁻³ U) due to the different specific activity of free C 1 and PLGA‐C 1 NPs. The enzyme activity for C 1 and PLGA‐C 1 NPs were compared to the initial enzyme activity at 0 min for C 1 and PLGA‐C 1 NPs, respectively. At pH 7, enzyme activity remained unchanged, compared to the initial enzyme value at 0 min, for up to 3 days suggesting that the enzymes in both the free and encapsulated forms are stable (Fig. 4 a). In Fig. 4 b, C 1 release was monitored in order to determine the ability of PLGA‐C 1,o, PLGA‐C 1,w, and PLGA‐C 1,s to entrap the enzyme for up to 7 days. Each of the three different PLGA‐C 1 had <40% protein release up to7 days at pH 7, indicating that the PLGA NPs can retain enzyme inside the vesicles. However, the initial protein release of the NPs prepared using w/o/w was less than that seen for NPs from o/w or s/o/w. The reason that the initial release profile from w/o/w is lower than the release profile from o/w and s/o/w methods may be due to the high interfacial area in w/o/w method during the first w/o emulsification step, as previously reported by Alexandra et al. [17]. The C 1 could be absorbed by the hydrophobic polymer at the interphase between the water and oil phase in the primary emulsion method, whereas the other two methods limit protein exposure to the interphase between the water and oil phases. Therefore, C 1 in the w/o/w preparations may have more interaction to the PLGA polymer than the other two methods. The lower initial burst release rate of w/o/w NPs comparing to s/o/w NPs was also observed in insulin encapsulated PLGA [12]. The insulin initial release was <10% when NPs were prepared by w/o/w, whereas a release rate of 30–40% was reported for insulin encapsulation using s/o/w and BSA encapsulation using o/w methods [18, 19].
Fig. 4.
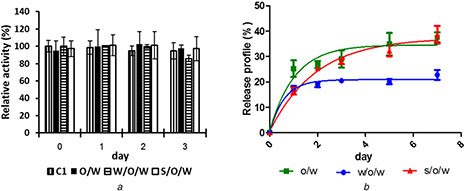
Stability and release profile of PLGA‐C1 NPs from o/w, w/o/w, and s/o/w methods (a) Stability, (b) Release profile
3.3 Reusability of PLGA‐C 1 NPs
The PLGA‐C 1 NPs were further studied in terms of reusability and shown in Fig. 5. This aspect is important for their application in biocatalytic processes. The NPs were separated following the reaction cycle using a simple centrifugation method to regenerate the NPs for the next round of catalysis. The PLGA‐C 1,s NPs are relatively more stable and have higher reusability efficiency than PLGA‐C 1,o, PLGA‐C 1,w, respectively. A decrease in activity of about 50% was observed at the 14th round of regeneration. Activity decreased slowly with subsequent rounds of re‐use and at the 19th round, the enzyme retained only 10% activity. The decrease in C 1 activity may be due to disruption of NPs after multiple rounds of centrifugation.
Fig. 5.

Enzymatic activity of PLGA‐ C1 NPs prepared by o/w, w/o/w, and s/o/w after each regeneration
3.4 Production of DHPA
The PLGA‐C 1,s NPs were used with the hydroxylase (C 2) to demonstrate the potential use of the nanovesicles as a biocatalyst to supply reduced FMN to the hydroxylase enzyme and generate the DHPA product and shown in Fig. 6. To monitor the production of DHPA, a coupled enzyme assay with DHPAO was used (Fig. 6 a). In this experiment, the increasing signal of A 380 from the production of CHS was observed (Fig. 6 b). The rate of CHS production was 68 nM/s. Based on this analysis, PLGA‐C 1 NPs appear to successfully generate reduced FMN for the second enzyme (C 2) to produce the hydroxylated product DHPA.
Fig. 6.
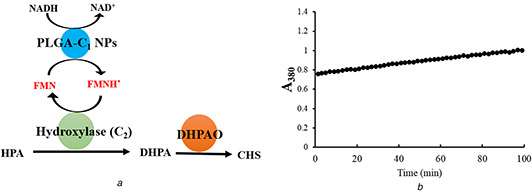
Coupling reaction assay (a) Schematic representation of coupling reaction, (b) Production of CHS from DPAH
4 Conclusions
The reductase component of p ‐hydroxyphenylacetate 3‐hydroxylase (C 1) was successfully encapsulated in biodegradable PLGA NPs using a double emulsion solvent evaporation method. Enzyme encapsulated NPs prepared under distinct conditions exhibited variations in yield, size, stability, EE, LE, and enzymatic activity. The s/o/w method was the optimal condition for preparation of PLGA‐C 1 NPs. NPs prepared using s/o/w exhibited improved enzyme activity and regeneration efficiency from the encapsulated C 1 compared to the o/w or w/o/w approaches.
The improvement of enzyme activity from s/o/w prepared NPs was also observed in lysozyme encapsulation; although w/o/w is more appropriate to prepare insulin encapsulation in PLGA microsphere [8, 12]. For this study, s/o/w was identified as the most appropriate technique for encapsulation of C 1. The PLGA‐C 1 NPs were also successfully utilised as biocatalytic nanovesicles to produce reduced FMN for the hydroxylase C 2. Therefore, PLGA‐C 1 NPs have a high potential to be applied in other biocatalytic systems that require reduced FMN.
5 Acknowledgments
The authors thank Assoc. Prof. Laran T. Jensen for editing work. The proofreading of this manuscript was supported by the Editorial Office, Faculty of Graduate Studies, Mahidol University. This project was supported by Mahidol University and Faculty of Science, Mahidol University, The Thailand Research Fund (IRG5980008, RTA5980001, MRG5980041), Development and Promotion of Science and Technology Talents Project (09/2557). This project was partially supported by CIF grant and Center of Nanoimaging, Faculty of Science, Mahidol University. They also thank Ms Paweena Choochuay and Ms Philaiwarong Kamutira from Enzmart Biotech for helping with SDS‐PAGE analysis of the purified enzymes.
6 References
- 1. Chaiyen P. Suadee C. Wilairat P.: ‘A novel two‐protein component flavoprotein hydroxylase’, Europ. J. Biochem., 2001, 268, (21), pp. 5550 –5561 [DOI] [PubMed] [Google Scholar]
- 2. Sucharitakul J. Chaiyen P. Entsch B. et al.: ‘The reductase of p ‐hydroxyphenylacetate ‐3hydroxylase from acinetobacter baumannii requires p ‐hydroxyphenylacetate for effective catalysis’, Biochemistry, 2005, 44, (30), pp. 10434 –10442 [DOI] [PubMed] [Google Scholar]
- 3. Sucharitakul J. Phongsak T. Entsch B. et al.: ‘Kinetics of a two component p ‐hydroxyphenylacetate hydroxylase explain how reduced flavin is transferred from the reductase to the oxygenase’, Biochemistry, 2007, 46, (29), pp. 8611 –8623 [DOI] [PubMed] [Google Scholar]
- 4. Dhammaraj T. Phintha A. Pinthong C. et al.: ‘ p ‐Hydroxyphenylacetate ‐3hydroxylase as a biocatalyst for the synthesis of trihydroxyphenolic acids’, ACS Catal., 2015, 5, (8), pp. 4492 –4502 [Google Scholar]
- 5. Dhammaraj T. Pinthong C. Visitsatthawong S. et al.: ‘A single‐site mutation at ser146 expands the reactivity of the oxygenase component of p ‐hydroxyphenylacetate ‐3hydroxylase’, ACS Chem. Biol., 2016, 11, (10), pp. 2889 –2896 [DOI] [PubMed] [Google Scholar]
- 6. Homaei A.A. Sariri R. Vianello R. et al.: ‘Enzyme immobilization: an update’, J. Chem. Biol., 2013, 6, (4), pp. 185 –205 [DOI] [PMC free article] [PubMed] [Google Scholar]
- 7. Mohamad N.R. Marzukia N.H. Buanga N.A. et al.: ‘An overview of technologies for immobilization of enzymes and surface analysis techniques for immobilized enzymes’, Biotechnol. Biotechnol. Equip., 2015, 29, (2), pp. 205 –220 [DOI] [PMC free article] [PubMed] [Google Scholar]
- 8. Montalvo‐Ortiz B.L. Sosa B. Griebenow K.: ‘Improved enzyme activity and stability in polymer microspheres by encapsulation of protein nanospheres’, AAPS PharmSciTech, 2012, 13, (2), pp. 632 –636 [DOI] [PMC free article] [PubMed] [Google Scholar]
- 9. Morales‐Cruz M. Flores‐Fernandez G.M. Morales‐Cruz M. et al.: ‘Two step nanoprecipitation for the production of protein‐loaded PLGA nanospheres’, Results Pharma Sci., 2012, 2, pp. 79 –85 [DOI] [PMC free article] [PubMed] [Google Scholar]
- 10. Pirooznia N. Hasannia S. Loft A.S. et al.: ‘Encapsulation of alpha‐1 antitrypsin in PLGA nanoparticles: In vitro characterization as an effective Aerosol formulation in pulmonary diseases’, J. Nanobiotechnol., 2012, 10, pp. 20 –35 [DOI] [PMC free article] [PubMed] [Google Scholar]
- 11. McCall R.L. Sirianni R.W.: ‘PLGA nanoparticles formed by single‐ or double‐emulsion with vitamin E‐TPGS’, J. Vis. Exp., 2013, pp. 51015 –51023 [DOI] [PMC free article] [PubMed] [Google Scholar]
- 12. Andreas K. Zehbe R. Kazubek M. et al.: ‘Biodegradable insulin‐loaded PLGA microspheres fabricated by three different emulsification techniques: investigation for cartilage tissue engineering’, Acta. Biomater., 2011, 7, (4), pp. 1485 –1495 [DOI] [PubMed] [Google Scholar]
- 13. Flores‐Fernández G.M. Griebenow K.: ‘Glycosylation improves ɑ‐chymotrypsin stability upon encapsulation in poly(lactic‐co‐glycolic) acid microspheres’, Results Pharma Sci., 2012, 2, pp. 46 –51 [DOI] [PMC free article] [PubMed] [Google Scholar]
- 14. Azizi M. Farahmandghavi F. Joghataei M. et al.: ‘Fabrication of protein‐loaded PLGA nanoparticles: effect of selected formulation variables on particle size and release profile’, J. Polym. Res., 2013, 20, (4), pp. 110 –123 [Google Scholar]
- 15. Rietscher R. Czaplewskab L.A. Majdanski T.B. et al.: ‘Impact of PEG and PEG‐b‐PAGE modified PLGA on nanoparticle formation, protein loading and release’, Int. J. Pharm., 2016, 500, (1), pp. 187 –195 [DOI] [PubMed] [Google Scholar]
- 16. Maa Y.F. Hsu C.C.: ‘Effect of primary emulsions on microsphere size and protein‐loading in the double emulsion process’, J. Microencapsul., 1997, 14, (2), pp. 225 –241 [DOI] [PubMed] [Google Scholar]
- 17. Alexandra G. Marie‐Claire V.J. Stephane M. et al.: ‘Reversible protein precipitation to ensure stability during encapsulation within PLGA microspheres’, Eur. J. Pharm. Biopharm., 2008, 70, pp. 127 –136 [DOI] [PubMed] [Google Scholar]
- 18. Biswajit M. Kousik S. Gurudutta P. et al.: ‘Preparation, characterization and in‐vitro evaluation of sustained release protein‐loaded nanoparticles based on biodegradable polymers’, Int. J. Nanomed., 2008, 3, (4), pp. 487 –496 [DOI] [PMC free article] [PubMed] [Google Scholar]
- 19. Yamaguchi Y. Tagenaka M. Kitakawa A. et al.: ‘Insulin‐loaded biodegradable PLGA microcapsules: initial burst release controlled by hydrophilic additives’, J. Control Release, 2002, 81, (33), pp. 235 –249 [DOI] [PubMed] [Google Scholar]


