Abstract
To sustained release of an anticancer drug, oxaliplatin (OX), a non‐toxic and biocompatible nanocarrier based on bovine serum albumin (BSA) were synthesised by desolvation method and characterised using Fourier‐transform infrared (FTIR) spectroscopy, field emission scanning electron microscopy (FESEM), atomic force microscopy (AFM) and dynamic light scattering. The results showed that the BSA nanoparticles (BSANPs) with a mean magnitude of 187.9 ± 1.2 nm have spherical morphology with a smooth surface and a uniform distribution. Furthermore, OX was loaded onto the BSANPs and the loading was confirmed by FTIR, AFM and FESEM techniques. The percentage of encapsulation efficiency and drug loading were determined by absorption spectroscopy (UV–vis). The drug release studies showed that release of OX from BSANPs exhibited slower release rate. However, the release kinetics followed the first‐order kinetic for both of them with the non‐Fickian release behaviour. The electrochemical analysis showed stability of OX loaded onto the BSANPs (OX@BSANPs) and confirmed the diffusion mechanism. Furthermore, the results of MTT assay revealed increasing of normal cell viability and cancer cell death in the OX@BSANPs compared to only OX. It was shown that the BSANPs could be safely used as a biocompatible nanocarrier for the sustained release of OX.
Inspec keywords: nanoparticles, drug delivery systems, molecular biophysics, encapsulation, cancer, proteins, drugs, cellular biophysics, light scattering, nanofabrication, atomic force microscopy, biomedical materials, diffusion, toxicology, nanomedicine, field emission scanning electron microscopy, Fourier transform infrared spectra, ultraviolet spectra, visible spectra, surface morphology
Other keywords: cytotoxicity, biocompatible nanocarrier, bovine serum albumin nanoparticles, desolvation method, atomic force microscopy, dynamic light scattering, BSA nanoparticles, FESEM, UV‐visible absorption spectroscopy, drug release rate, nonFickian release behaviour, oxaliplatin anticancer drug, Fourier‐transform infrared spectroscopy, FTIR spectroscopy, spherical morphology, encapsulation efficiency, release kinetics, first‐order kinetics, electrochemical analysis, diffusion mechanism, MTT assay, cell viability, cancer cell death
1 Introduction
The therapeutic power of anticancer drugs with reduction of their complications can be improved by loading into drug delivery systems (DDS) [1]. This strategy facilitates the delivery of drugs in the infected area of the tumour, controlled release of drugs and reduces the toxicity of anticancer drugs. Oxaliplatin (OX) is currently used as an intravenous injection that is spread widely in the body and has severe complications such as immunosuppression and in some cases, pulmonary fibrosis, which is fatal. It also has more blood toxicity than carboplatin and cisplatin and excessive doses have very severe side effects [2, 3]. To date, protein‐based nanocarriers due to the non‐toxic, non‐immunogenic, biodegradable and biocompatible, frequency of its source, its cheap price, its easy separation and purification was used for DDS [4]. Specifically, albumin nanoparticles due to stability in blood circulation, its high ability for ligand binding and its acceptability in the pharmaceutical industry are a suitable candidate for nanocarriers of anticancer drugs [4, 5, 6]. Presence of high amounts of albumin in the body causes injection of significant amounts of it to the body without complications or with low side effects. Also, the history of allergy to albumin is rare in humans [7, 8, 9, 10]. Bovine serum albumin (BSA) is one of the most extensively studied of this group of proteins, particularly because of its structural homology with human serum albumin, the frequency of its source, its cheap price, its easy separation and purification from the serum of bovine blood [11]. BSA nanoparticles (BSANPs) are a suitable candidate for anticancer drugs to reduce the complications of anticancer drugs due to its compatibility with the body. A lot of research has been done on the loading of the drug onto BSANPs such as hydroxycamptotinic and fluoracil anticancer drugs [12, 13]. However, the size range limitations are critical point for formulation where size range between 10 and 200 nm could facilitate passive entry into tumour cells [5].
In the present study, BSANPs were synthesised and characterised with optimal conditions for sustained release of OX as an anticancer drug. The release behaviour and mechanism of OX loaded BSANPs (OX@BSANPs) were evaluated in detail. The cytotoxicity of nanocarriers was assessment onto human foreskin fibroblast normal cell lines, HFFF2 and breast cancer cell lines, MCF7. We hope that the designed DDS enhanced the efficacy and decrease the side effects of anticancer drugs.
2 Experimental
2.1 Materials
BSA powder, phosphate buffered saline (PBS) tablet, dialysis bag (12 kDa), glutaraldehyde 25%, RPMI1640, 3‐(4,5‐dimethylthialzol‐a‐yl)‐2,5‐diphenyltetrazolium bromide (MTT), foetal bovine serum (FBS), penicillin, dimethyl sulfoxide were obtained from Sigma‐Aldrich Co., USA. OX anticancer drug powder was purchased from LG South Korea. Ethanol was purchased from Merck Chemical Co., Germany. HFFF2 and MCF7 cell lines were obtained from the cell bank of Pasteur institute in Tehran, Iran. All of the reagents were used as received. Deionised water was used throughout the experiment.
2.2 Methods
The Fourier‐transform infrared (FTIR) spectra of BSA, BSANPs and OX@BSANPs were carried out (Vector33 model, Bruker, USA) by KBr tablet and were scanned in the range of 400–40,000 cm−1. The hydrodynamic diameter and the distribution of the BSANPs were performed using dynamic light scattering (DLS) (Zetasizer HS C1330–3000 model, Malvern, UK). The structure and morphology of compounds were recorded by field emission scanning electron microscope (FESEM) (Mira 3‐XMU, TESCAN, Czech Republic). The morphological and particle distribution were obtained by atomic force microscopy (AFM) (South Korea's Park Systems Corporation). The absorption spectra were monitored by ultraviolet absorption spectroscopy (UV–vis) (T80 + model, TG instruments, UK). The cyclic voltammograms was recorded by cyclic voltammetry (CV) technique (Potentiometric static model PARSTAT 2273, Pine Research, Inc) in a 1.5 ml three electrode of glassy carbon as the working electrode, a Pt wire as the counter and saturated calomel electrode as reference electrodes. The changes in voltage and current investigated in a voltammogram and the potential ranges from − 0.68 to + 1.85 mV at a scan speed of 25, 50, 75, 100, 125 and 150 mV/s [14]. pH measurements were performed by a Metrohm pH‐meter, model 826 pH mobile, Switzerland.
2.3 Preparation of BSANPs
BSANPs were synthesised by desolvation method [15, 16, 17]. Size of the nanoparticles can be controlled by various factors such as concentration and pH of the BSA solution, the volume and rate of addition of ethanol, the time and amount of cross‐linker, stirring speed, temperature and so on. The optimal amount of these variables was extracted from similar papers [18, 19, 20]. Accordingly, 50 mg of BSA powder was dissolved in 1 ml distilled water at pH 7.4. The resulting solution was stirred at 400 rpm for 5 min at ambient temperature. Then, 8 ml of ethanol as separator was added at a rate of 1 ml/min to the solution. After adding 4 ml of ethanol, the turbidity of solution was observed that showed the formation of nanoparticles. To stabilise the above solution, 0.21 ml of glutaraldehyde 8% as cross‐linker was added to it (that is 0.006 μl of glutaraldehyde for each 1 ml of BSA) and the suspension stirred at 400 rpm for 24 h. The suspension was purified using centrifugation at 11,000 rpm for 10 min to remove excess albumin and additional glutaraldehyde and redispersed in purified water by ultrasonication over 5 min for four times. Finally, the BSANPs was dispersed in PBS and stored at 4°C and protected from light.
2.4 In‐vitro drug release experiment
2.4.1 Drug loading
About 18 mg of OX were dissolved in 1 ml of distilled water and then, 1 ml of BSANPs was added to the suspension and was stirred for 24 h. Then, the suspension containing OX loaded to BSANPs was purified by centrifugation at 11,000 rpm for 10 min. The amount of supernatant was collected and redispersed in a bath sonicator for 9 min. The Beer‐Lambert equation was used in determination of concentration
| (1) |
where A is the amount of absorption of ultraviolet radiation, ɛ is the absorption coefficient, c is the concentration of sample and l is the distance of radiation passing through the material (l = 1 cm). According to (1), the calibration curve of OX (A versus c) plotted at characteristic wavelength of the OX (247 nm) for calculation of drug concentration in drug loading and release experiments. The percentage of encapsulation efficiency (%EE) and drug loading (%DL) were calculated using the following equations [21]:
| (2) |
| (3) |
2.4.2 Drug release
Evaluation of the release of OX in the absence and the presence of BSANPs as a nanocarrier was performed using a dialysis bag. For this purpose, 3 ml of the OX and OX@BSANPs suspension are separately poured into a dialysis bag, and was fully submerged in 15 ml of PBS at pH 7.4 with a magnetic stirrer 200 rpm at 310 K. About 3 ml of release medium was reserved at time intervals and an equal fresh PBS was added to maintain a constant condition. The cumulative drug release percentage was calculated by the following equation [22]:
| (4) |
All of the experiments were performed for three times and the averages and standard deviations were determined.
2.4.3 Drug release mechanisms
Three kinetic models were used to investigate the drug release mechanism of spherical BSANPs as follows [23, 24].
Zero‐order kinetic model
| (5) |
where Mt and M 0 are the amount of drug dissolved in time, t and the initial amount of drug in the solution (most times, M 0 = 0), respectively, and k 0 is the zero‐order release constant. The cumulative amount of drug released versus t were plotted to study the release kinetics.
First‐order kinetic model
| (6) |
where Mt , M 0 and t are the same as defined above and k is the first‐order rate constant. A slope of log Mt /M 0 versus t yields the −k /2.303.
Korsmeyer‐Peppas kinetic model
| (7) |
where Mt /M ∞ is a fraction of drug released at time, kp is the release rate constant and n is the release exponent. log Mt /M ∞ versus log t were plotted where Mt /M ∞ <0.6. kP and n can be determined from the slope and intercept of plot. For spherical shape, n < 0.43 agrees with a Fickian diffusion mechanism and 0.43<n < 0.89 agrees with a non‐Fickian diffusion mechanism. The high determination coefficient (R 2) of each model show the best fit release model.
Furthermore, the other parameters of release kinetic were determined as follows [22, 25]:
| (8) |
Ct is the amount of drug released at time t, β = 1/C max is the inverse of the maximum amount of released drug, α = 1/(C max)2 k rel, k rel is the kinetic constant of release and is the inverse of the initial release rate, r 0.
To further release mechanism study, the cyclic voltammograms of OX (33.33 μM) with increasing of BSANPs (100 μl) was performed using CV analysis at 298 K. The Randles–Sevcik equation was used as follows:
| (9) |
where Ip is the maximum current of different scan rates, n, A, D, C and ν are the number of transferred electrons in the redox event (usually 1), electrode area, diffusion coefficient, concentration and scan rate, respectively. By plotting Ip versus ν1/2 for BSANPs in the presence of OX, a straight line is obtained which is resulted from diffusion controlling [14, 26]. The changes of Gibbs free energy (ΔG) was calculated as follows [14]:
| (10) |
where n, F and E are the number of moles of electrons transferred in the redox event, Faraday's constant (96,485 C/mol) and cell potential, respectively.
2.5 Cytotoxicity assay
2.5.1 Cell culture
Human foreskin fibroblast cell lines, HFFF2 and breast cancer cell lines, MCF7 were cultured separately in RPMI‐1640 medium containing 10% FBS and 1% penicillin–streptomycin antibiotic mixture at 310 K in a humidified incubator with 5% CO2. The culture medium was changed every three days. When the cells reached the appropriate density, they were used for further analysis.
2.5.2 Cell viability
The effect of presence of carrier on cell viability percentage of fibroblast normal cells and breast cancer cell lines were investigated using MTT assay. The cell lines were seeded in 96‐well plates (5 × 10⁴ cells/well) and treated with OX (0–8.4 µM), BSANPs (0–8.4 µM) and OX@BSANPs (1:1, 0–8.4 µM) for 24 h at a temperature of 310 K and 90% humidity. After this incubation, the culture medium was removed from the cells that adhere to the plate bottom. One of the tested solutions was replaced and subjected to the same conditions. After the incubation time, tubes were drained and 10 μl of MTT solution was added to each well. After 4 h, under incubation conditions, 100 μl of DSMO was added to the set to form blue crystals of formazan. The colour change was then analysed by UV–vis spectroscopy at 570 nm by Microplate reader (Biotake, USA). The cell viability value was determined as follows [27]:
| (11) |
where A treated and A control were absorbance of the treated cells and untreated cells, respectively. All experiments were done in three repeats.
2.5.3 Statistical analysis
Statistical significance of results was analysed by one‐way ANOVA and quantitative results were summarised as means ± standard deviations (SD) of three independent experiments.
3 Results and discussion
3.1 Characterisation of BSANPs
The FTIR spectra of BSA and BSANPs were observed in Fig. 1. The main bands of the BSA are 3351 cm−1 (amide A, related to N–H stretching), 2963 cm−1 (amide B, N–H stretching of NH3+ free ion) and 1654 cm−1 (amide I, C = O stretching), 1522 cm−1 (amide II, the C–N stretching and the N–H vibrating bands), 1333 cm−1 (CH2 bending groups), and ∼926 cm−1 (amide III related to C–N stretching and N–H bending) [28, 29, 30]. The characteristic peak positions of BSANPs were significantly changed to 3275, 2935, 1668, 1512, 1310 and 900 cm−1, respectively, due to the formation of nanoparticles. In addition, no new bands appeared or removed. Therefore, the chemical structure of BSA during the preparation process of nanoparticles was conserved.
Fig. 1.
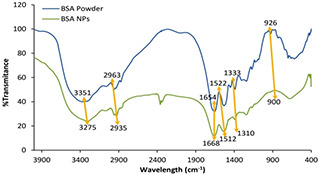
FTIR spectra of BSA powder and BSANPs
The average size of the BSANPs in PBS media was determined using DLS that was 187.9 ± 1.2 nm (Fig. 2 a). The resulting diagram has a narrow peak that indicates the uniformity of the distribution of BSANPs. Generally, the average size and distribution seems to be appropriate for drug release systems [31].
Fig. 2.

Characterisation of BSANPs
(a) Size distribution of BSANPs, (b) FESEM image of BSANPs, (c‐I) AFM image of BSA, (c‐II) AFM image of BSANPs
The FESEM image of BSA and BSANPs was shown in Fig. 2 b, the average size of BSANPs is ∼160.58 ± 20.30 nm. According to the images, the spherical shape of the synthesised nanoparticles has a uniform distribution that is in agreement with the AFM and DLS results. In addition, the difference between particle sizes measured by FESEM and DLS was due to the calculation of hydration layer surrounding of nanoparticles in DLS analysis [32].
AFM images of the BSA and BSANPs were observed in Fig. 2 c. The particle size distribution in BSA is non‐uniform and no geometric ordering is observed at surface of BSA. However, the AFM image of BSANPs showed that the surface is relatively smooth and the spherical shape, therefore, it was appropriate to drug delivery.
3.2 Drug release studies
3.2.1 Entrapment efficiency and drug loading determination
The OX loaded on BSANPs and characterised using FTIR, AFM and FESEM. Based on Fig. 3 a, the characteristic bands of OX and BSANPs were appeared in FTIR spectrum of OX@BSANPs that confirmed there was no change in chemical structure. However, the shifts in peak positions of 1675 and 3472 cm−1 compared with OX (1649 and 3447 cm−1) and BSANPs (as shown in Section 3.1) revealed the attachment of OX and BSANPs thus OX@BSANPs formation.
Fig. 3.

Characterisation of OX@BSANPs
(a) FTIR spectra of OX and OX@BSANPs, (b) AFM image of OX@BSANPs, (c) FESEM image of OX@BSANPs (inset: SEM image of BSANPs in same magnification: 200 nm)
Another confirmative analysis for loading of OX on BSANPs was appropriate dispersity of nanoparticles compared to BSANPs in AFM results (Fig. 3 b). FESEM image clearly showed the drug loading on surface of BSANPs (inset Fig. 3 c) with no significant change in the size of nanoparticles, therefore the drug loaded on BSANPs.
The percentage of drug loading (%DL) and entrapment efficiency (%EE) were calculated according to (2) and (3). The concentration of OX was determined by equation of best fit of the calibration chart (Fig. 4) that was A = 0.2503 [OX], A is absorption of OX in various concentration of OX, [OX]. The %EE and %DL were 53.3%±0.82 and 1.5%±0.05, respectively. These data suggest that the OX were effectively loaded into the BSANPs and it was almost equal with various designed carriers with polymers and other materials such as core–shell nanocomposites without more toxicity [13, 16, 23].
Fig. 4.
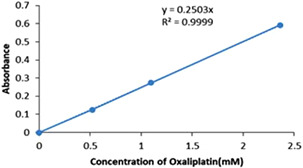
Calibration curve for OX
3.2.2 Drug release
OX release pattern and release rate in absence and presence of BSANPs was shown in Fig. 5. Fig. 5 a revealed explosive in the first 120 min and then a constant and incremental rate were occurred. For OX release, 76% of the drug is released in the first 120 min, while this amount for OX loaded on BSA NP is 56%, hence, BSANPs caused the sustained release of OX. Also, the total release time of the OX was 300 and 360 min in the only OX and OX@BSANPs, respectively. Fig. 5 b indicated that BSANPs medium exhibited higher release rate than OX medium. Therefore, OX@BSANPs system is more stable and has slow release that can play an important role in increasing drug therapeutic index.
Fig. 5.
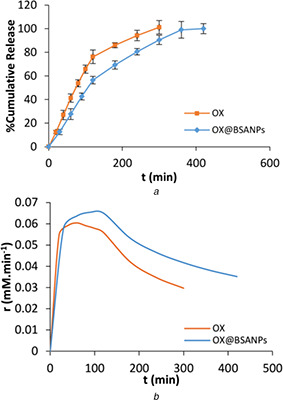
Release behavior of OX from BSANPs
(a) Release curve of OX in absence and presence of BSANPs, (b) r versus t curves
3.2.3 Mechanism of drug release
Three kinetic models were evaluated to the drug release mechanism determination. The plot of each model was drawn according to Section 2.3 and the results were summarised in Table 1. It can be observed that the release of OX follows first‐order model for both of them due to best fitting in this model. Whereas, n value was between 0.43 and 0.89, therefore, the non‐Fickian diffusion mechanism controlled the drug release process.
Table 1.
Kinetic parameters of various mathematical models
| System type | Parameters | OX | OX@BSANPs |
|---|---|---|---|
| zero order | k 0 | 16.25 | 16.88 |
| R 2 | 0.94 | 0.87 | |
| first order | k | −0.20 | −0.38 |
| R 2 | 0.99 | 0.95 | |
| Korsmeyer‐Peppas | n | 0.68 | 0.58 |
| R 2 | 0.97 | 0.88 | |
| kinetic parameters | C max, mM | 13.16 ± 2.14 | 25.51 ± 2.47 |
| k rel × 10−4, mM−1 min | 5.50 ± 0.24 | 1.28 ± 0.13 | |
| r 0 × 103, mM min−1 | 1.80 ± 3.84 | 7.8 ± 4.25 | |
| R 2 | 0.98 | 0.98 |
Furthermore, according to Fig. 6 and Table 1, the maximum amount of released drug and the initial release rate in OX@BSANPs system was significantly greater than OX, while, the kinetic constant of release free OX was greater than OX@BSANPs system. The reason of increasing of the initial release rate in OX@BSANPs system maybe the adsorption of OX that caused fast release of drug from surface of nanoparticles as seen in Fig. 3 c.
Fig. 6.
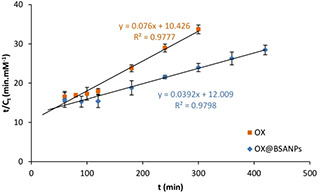
t/Ct versus t curves
To further study the determination of drug release mechanism, cyclic voltammetry technique was performed. Due to the similarity between electrochemical and biological reactions in CV, it can be presumed that the redox mechanisms taking place at the electrode and in the body share similar principles. Therefore, this technique is employed for the evaluation of biomolecules binding parameters [26, 33]. As shown in Fig. 7 a, OX interacted irreversible with BSANPs and the maximum potential and maximum currents of OX, BSANPs and OX@BSANPs were evaluated (Table 2). Based on the obtained results, the maximum potential in the OX is + 0.630 mV which this amount decreased to + 0.604 mV after the combination with BSANPs and also, the maximum current decrease from 514 µA in OX to 506 µA in OX@BSANPs. Reducing the maximum potential and current in OX@BSANPs system indicated the stability of this system and increasing of rate interaction, respectively [14]. Furthermore, according to (10), ΔG has the negative sign that indicated the spontaneous reactions for all of the systems. According to Fig. 7 b, a straight line showed the diffusion control affected the interaction between OX and BSANPs that was in confirmation with UV–vis results.
Fig. 7.
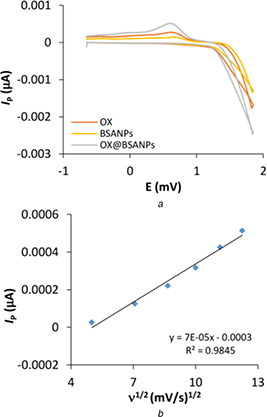
Cyclic voltammetry of BSANPs in interaction with OX
(a) Cyclic voltammograms of BSANPs in absence and presence of OX in 150 mV/s scan rate, (b) I P versus ν1/2 plots of OX in presence of BSANPs
Table 2.
Maximum potential and maximum currents of OX, BSANPs and OX@BSANPs at 150 mV/s scan rate
| System type | Ep , V | Ip , µA | ΔG, kJ |
|---|---|---|---|
| OX | 0.630 | 514 | −121.54 |
| BSANPs | 0.720 | 133 | −138.89 |
| OX@BSANPs | 0.604 | 506 | −116.52 |
3.3 In‐vitro cytotoxicity studies
3.3.1 MTT assay
The toxicity analysis of BSANPs, OX and OX@BSANPs is performed on normal cells (Fig. 8 a) and cancer cells (Fig. 8 b). The results showed that the BSANPs unlike OX and OX@BSANPs were not affected on none of the cell lines. The half maximal inhibitory concentration (IC50) of OX@BSANPs (2.2 μg/μl) is lower than OX (3.4 μg/μl) in cancer cells and it decreased significantly comparison with OX@BSANPs (≈5.4 μg/μl) and OX (4.5 μg/μl) in normal cells. Hence, the cell death percentage of cancer cells in OX drug was increased at the presence of OX@BSANPs system while survival percentage of normal cells was increased in comparison with OX that indicate a significant achievement in reducing drug toxicity on healthy cells and increasing drug efficacy on cancer cells. Consequently, the encapsulation of OX in the BSANPs increased the stability and effectiveness of loaded OX to inhibiting cell proliferation and growth.
Fig. 8.
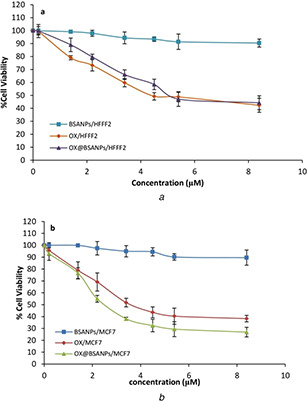
MTT assay of BSANPs, OX and OX@BSANPs on
(a) HFFF2 normal cells, (b) MCF7 cancer cells with increasing of its concentrations
4 Conclusion
In this research, an anticancer drug release system based on BSA nanoparticle was synthesised using desolvation method and their physical properties were evaluated using FTIR, FESEM, AFM, and DLS techniques. The results of FTIR confirmed the formation of BSANPs. DLS results showed that the synthesised nanoparticles were in a uniform size of 187.9 ± 1.2 nm. The results of FESEM and AFM indicated that the morphology of the nanoparticles was spherical and had a relatively smooth surface with low agglomeration. Drug loading and release behaviour were also performed using absorption spectroscopy. Drug release was decreased in OX loaded to BSANPs while its release rate in each time is higher than neutral medium. The release kinetic of the OX from BSANPs was based on the first order and drug release followed by non‐Fickian diffusion mechanism. Finally, CV analysis was used to confirm the mechanism of release of the OX from BSANPs and a reduction in maximum potentials showed the stability of the composition and the linearity of the results at different scans speeds revealed the diffusion mechanism. The cytotoxicity studies were evaluated on HFFF2 and MCF7 using MTT assay that indicated BSANPs were biocompatible while the cell death percentage of OX loaded on BSANPs was increased in cancer cell lines and no significant changes in normal cell lines comparison with only OX. Consequently, it can be concluded that BSANPs can be further investigated as an appropriate carrier for the sustained release of OX as an antitumour drug.
5 Acknowledgment
The authors are grateful for the financial support with research grant (no. 771395055) from the Materials and Energy Research Center (MERC), Karaj, Iran.
6 References
- 1. Xu L. He X.Y. Liu B.Y. et al.: ‘Aptamer‐functionalized albumin‐based nanoparticles for targeted drug delivery’, Colloids Surf. B Biointerfaces, 2018, 171, pp. 24 –30 [DOI] [PubMed] [Google Scholar]
- 2. Kindler H.L. Shulman K.L.: ‘Metastatic colorectal cancer’, Curr. Treat. Option. On., 2001, 2, pp. 459 –471 [DOI] [PubMed] [Google Scholar]
- 3. Li J. Wientjes M.G. Au J.L.: ‘Pancreatic cancer: pathobiology, treatment options, and drug delivery’, AAPS J., 2010, 12, pp. 223 –232 [DOI] [PMC free article] [PubMed] [Google Scholar]
- 4. Chao T. Yon J.C. Chenjie X. et al.: ‘Albumin conjugates and assemblies as versatile bio‐functional additives and carriers for biomedical applications’, J. Mater. Chem. B, 2019, 7, pp. 357 –367 [DOI] [PubMed] [Google Scholar]
- 5. Tan Y.L. Ho H.K.: ‘Navigating albumin‐based nanoparticles through various drug delivery routes’, Drug Discov. Today, 2018, 23, pp. 1108 –1114 [DOI] [PubMed] [Google Scholar]
- 6. Shahraki S. Saeidifar M. Gomroki M.: ‘Probing the in vitro binding mechanism between human serum albumin and La2 O2 CO3 nanoparticles’, IET Nanobiotechnol., 2018, 12, pp. 298 –304 [Google Scholar]
- 7. Encinas‐Basurto D. Ibarra J. Juarez J. et al.: ‘Hybrid folic acid‐conjugated gold nanorods‐loaded human serum albumin nanoparticles for simultaneous photothermal and chemotherapeutic therapy’, Mater. Sci. Eng. C. Mater. Biol. Appl., 2018, 91, pp. 669 –678 [DOI] [PubMed] [Google Scholar]
- 8. Das R.P. Singh B.G. Kunwar A. et al.: ‘Tuning the binding, release and cytotoxicity of hydrophobic drug by bovine Serum albumin nanoparticles: influence of particle size’, Colloids Surf. B Biointerfaces, 2017, 158, pp. 682 –688 [DOI] [PubMed] [Google Scholar]
- 9. Luis de Redin I. Boiero C. Martinez‐Oharriz M.C.: ‘Human serum albumin nanoparticles for ocular delivery of bevacizumab’, Int. J. Pharm., 2018, 541, pp. 214 –223 [DOI] [PubMed] [Google Scholar]
- 10. Venditto V.J. Szoka F.C. Jr: ‘Cancer nanomedicines: so many papers and so few drugs’, Adv. Drug Deliv. Rev., 2013, 65, pp. 80 –88 [DOI] [PMC free article] [PubMed] [Google Scholar]
- 11. Nosrati H. Rakhshbahar A. Salehiabar M. et al.: ‘Bovine serum albumin: an efficient biomacromolecule nanocarrier for improving the therapeutic efficacy of chrysin’, J. Mol. Liq., 2018, 271, pp. 639 –646 [Google Scholar]
- 12. Yang L. Cui F. Cun D. et al.: ‘Preparation, characterization and biodistribution of the lactone form of 10‐hydroxycamptothecin (HCPT)‐loaded bovine serum albumin (BSA) nanoparticles’, Int. J. Pharm., 2007, 340, pp. 163 –172 [DOI] [PubMed] [Google Scholar]
- 13. Maghsoudi A. Shojaosadati S.A. Vasheghani Farahani E.: ‘5‐Fluorouracil‐loaded BSA nanoparticles: formulation optimization and in vitro release study’, AAPS PharmSciTech., 2008, 9, pp. 1092 –1096 [DOI] [PMC free article] [PubMed] [Google Scholar]
- 14. Yadav R.S. Dwivedi Y. Rai S.B.: ‘Structural and optical characterization of nanosized La(OH)3:Sm3 + phosphor’, Spectrochimica. Acta Part A: Mol. Biomol. Spectrosc., 2012, 96, pp. 148 –153 [DOI] [PubMed] [Google Scholar]
- 15. Mikani M. Torabizadeh H. Rahmanian R.: ‘Magnetic soy protein isolate–bovine serum albumin nanoparticles preparation as a carrier for inulinase immobilisation’, IET Nanobiotechnol., 2018, 12, pp. 633 –639 [DOI] [PMC free article] [PubMed] [Google Scholar]
- 16. Salehiabar M. Nosrati H. Javani E. et al.: ‘Production of biological nanoparticles from bovine serum albumin as controlled release carrier for curcumin delivery’, Int. J. Biol. Macromol., 2018, 115, pp. 83 –89 [DOI] [PubMed] [Google Scholar]
- 17. Keshavarzi M. Kiani K. Shakeri S.: ‘Preparation and in vitro investigation of antigastric cancer activities of carvacrol‐loaded human serum albumin nanoparticles’, IET Nanobiotechnol., 2015, 9, pp. 294 –299 [DOI] [PubMed] [Google Scholar]
- 18. Rahimnejad M. Jahanshahi M. Najafpour G.D.: ‘Production of biological nanoparticles from bovine serum albumin for drug delivery’, Afr. J. Biotechnol., 2006, 5, pp. 1918 –1923 [Google Scholar]
- 19. Jose P. Sundar K. Anjali C.H. et al.: ‘Metformin‐loaded BSA nanoparticles in cancer therapy: A new perspective for an old antidiabetic drug’, Cell Biochem. Biophys., 2014, 71, pp. 627 –636 [DOI] [PubMed] [Google Scholar]
- 20. Abbasi S. Paul A. Prakash S.: ‘Investigation of siRNA‐loaded polyethylenimine‐coated human Serum albumin nanoparticle complexes for the treatment of breast cancer’, Cell Biochem. Biophys., 2011, 61, pp. 277 –287 [DOI] [PubMed] [Google Scholar]
- 21. Placente D. Benedini L.A. Baldini M. et al.: ‘Multi‐drug delivery system based on lipid membrane mimetic coated nano‐hydroxyapatite formulations’, Int. J. Pharm., 2018, 548, pp. 559 –570 [DOI] [PubMed] [Google Scholar]
- 22. Ekici S. Saraydin D.: ‘Synthesis, characterization and evaluation of IPN hydrogels for antibiotic release’, Drug Deliv., 2004, 11, pp. 381 –388 [DOI] [PubMed] [Google Scholar]
- 23. Abureesh M.A. Oladipo A.A. Mizwari Z.M. et al.: ‘Engineered mixed oxide‐based polymeric composites for enhanced antimicrobial activity and sustained release of antiretroviral drug’, Int. J. Biol. Macromol., 2018, 116, pp. 417 –425 [DOI] [PubMed] [Google Scholar]
- 24. Anchi P. Khurana A. Swain D. et al.: ‘Sustained‐release curcumin microparticles for effective prophylactic treatment of exocrine dysfunction of pancreas: A preclinical study on cerulein‐induced acute pancreatitis’, J. Pharm. Sci., 2018, 107, pp. 2869 –2882 [DOI] [PubMed] [Google Scholar]
- 25. Singh B. Singh B.: ‘Influence of graphene‐oxide nanosheets impregnation on properties of sterculia gum‐polyacrylamide hydrogel formed by radiation induced polymerization’, Int. J. Biol. Macromol., 2017, 99, pp. 699 –712 [DOI] [PubMed] [Google Scholar]
- 26. Shah A. Nosheen E. Munir S. et al.: ‘Characterization and DNA binding studies of unexplored imidazolidines by electronic absorption spectroscopy and cyclic voltammetry’, J. Photochem. Photobiol. B, Biol., 2013, 120, pp. 90 –97 [DOI] [PubMed] [Google Scholar]
- 27. Fan L. Ge H. Zou S. et al.: ‘Sodium alginate conjugated graphene oxide as a new carrier for drug delivery system’, Int. J. Biol. Macromol., 2016, 93, pp. 582 –590 [DOI] [PubMed] [Google Scholar]
- 28. Rohiwal S.S. Satvekar R.K. Tiwari A.P. et al.: ‘Investigating the influence of effective parameters on molecular characteristics of bovine serum albumin nanoparticles’, Appl. Surf. Sci., 2015, 334, pp. 157 –164 [Google Scholar]
- 29. Li C. Zhang D. Guo H. et al.: ‘Preparation and characterization of galactosylated bovine serum albumin nanoparticles for liver‐targeted delivery of oridonin’, Int. J. Pharmaceutics, 2013, 448, pp. 79 –86 [DOI] [PubMed] [Google Scholar]
- 30. Kong J. Yu S.: ‘Fourier transform infrared spectroscopic analysis of protein secondary structures’, Acta Biochim. Biophys. Sin., 2007, 39, pp. 549 –559 [DOI] [PubMed] [Google Scholar]
- 31. Fonseca S.B. Pereira M.P. Kelley S.O.: ‘Recent advances in the use of cell‐penetrating peptides for medical and biological applications⋆’, Adv. Drug Deliv. Rev., 2009, 61, pp. 953 –964 [DOI] [PubMed] [Google Scholar]
- 32. Hyun H. Park J. Willis K. et al.: ‘Surface modification of polymer nanoparticles with native albumin for enhancing drug delivery to solid tumors’, Biomaterials, 2018, 180, pp. 206 –224 [DOI] [PMC free article] [PubMed] [Google Scholar]
- 33. Tolia C. Papadopoulos A.N. Raptopoulou C.P. et al.: ‘Copper(II) interacting with the non‐steroidal antiinflammatory drug flufenamic acid: structure, antioxidant activity and binding to DNA and albumins’, J. Inorg. Biochem., 2013, 123, pp. 53 –65 [DOI] [PubMed] [Google Scholar]


