Abstract
Biosynthesis of silver nanoparticles (AgNPs) using plant extract is a cheap, easily accessible and natural process in which the phyto‐constituents of the plants act as capping, stabilising and reducing agent. The present study explored the biosynthesis of AgNPs using aqueous leaf extract of Tinospora cordifolia and characterised via various techniques such as Fourier transform infrared, scanning electron microscopy, transmission electron microscopy (TEM), energy dispersive X‐ray analysis and X‐ray diffraction. Here, TEM confirmed the spherical morphology with 25–50 nm size of synthesised AgNPs. Further, anticancer efficiency of AgNPs synthesised using T. cordifolia leaves were evaluated against human lung adenocarcinoma cell line A549 by MTT, trypan blue assay, apoptotic morphological changes using Annexin V‐FITC and Propidium iodide (PI), nuclear morphological changes by DAPI (4, 6‐diamidino‐2‐phenylindole dihydrochloride) staining, reactive oxygen species generation and mitochondrial membrane potential determination. Results confirmed the AgNPs synthesised using T. cordifolia leaves are found to be highly toxic against human lung adenocarcinoma cell line A549.
Inspec keywords: toxicology, cellular biophysics, cancer, silver, biomembranes, drugs, nanofabrication, nanoparticles, transmission electron microscopy, drug delivery systems, nanomedicine, lung, biomedical materials, antibacterial activity, X‐ray diffraction, Fourier transform infrared spectra, scanning‐transmission electron microscopy
Other keywords: cytotoxicity; phytosynthesised silver nanoparticles; A549 cell line; biosynthesis; aqueous leaf; transmission electron microscopy; TEM; X‐ray analysis; X‐ray diffraction; spherical morphology; human lung adenocarcinoma cell line; nuclear morphological changes; 4, 6‐diamidino‐2‐phenylindole dihydrochloride; Tinospora cordifolia leaves; scanning electron microscopy; Fourier transform infrared; energy dispersive X‐ray analysis; Ag; size 25.0 nm to 50.0 nm; anticancer efficiency; trypan blue assay; propidium iodide; Annexin V‐FITC; DAPI staining; reactive oxygen species generation; mitochondrial membrane potential determination
1 Introduction
From time immemorial, use of nanomaterials are increasingly used in biological, therapeutic, medical area as an antimicrobial agent, nanomedicine, transfection vehicles, fluorescent tags and so on [1, 2]. Synthesis of nanoparticles (NPs) has been reported by physical and chemical methods previously [3, 4]. As physical and chemical methods require biohazardous chemicals, high heat and pressure for surface modification of these NPs cause adverse effect to environment and human health. Phyto‐fabrication of metallic NPs by using plant extract as reducing agents is an alternate and advantageous over physical and chemical methods [5]. Several plants viz., Bougainvillea spectabilis, Azhadirachta indica, Crataegus douglasii, Prosopis farcta and Ananas comosus have been reported for efficient and rapid extra cellular synthesis of silver nanoparticles (AgNPs) [6, 7, 8, 9, 10].
Specifically, through literature leaves of Tinospora cordifolia have also been reported to possess numerous secondary metabolites such as bruceatin, boronic acid, A‐benzylphenethylamine, hexanodibutyrin and so on [11]. Hence, the natural compounds present in the aqueous leaf extract function as reducing and capping agent. Since the past decade, AgNPs are extensively used in pharmaceutical, food, agriculture, cosmetics, paints, textiles, electronics and so on [6, 12]. As silver metal is being used as a potent antimicrobial agent in many forms such as in dental treatment, skin burning, in bandages, to clean water and so on. Recently, they have gained much popularity as important anti‐microbial and disinfectant agents in medical field owing to their bactericidal efficacy against gram‐negative and gram‐positive bacteria, fungi and viruses [13, 14]. Cancer is a complex and multilayered disease caused mostly by environmental influences and it is being treated by various therapies. Each and every types of cancer can act differently. Amongst them, lung cancer is unique compared to other cancer types and malignant in nature that starts in the lungs. Death rate of cancer patients as well as cancer therapy is increasing day by day. Nanomedicine is a forthcoming and emerging as it is easily available, safe and cost effective that could possibly make a major effect in the treatment of human cancer [15]. Phytofabricated AgNPs have also been reported in vitro cytotoxic and genotoxic effects against various human cell lines such as skin cancer cell line (A431), cervical carcinoma cells (HeLa), breast cancer cell line (MCF‐7), adenoma colon cancer cell line (HT29) [16, 17, 18, 19, 20, 21]. However, very sparse work has been done on human lung adenocarcinoma cell line A549. Therefore, in the current investigation, an innovative process has been developed for the green synthesis of AgNPs using aqueous leaf extract of T. cordifolia (Willd.) and analysis of their cytotoxicity against human lung adenocarcinoma cell line A549 through MTT assay, trypan blue dye exclusion assay, apoptotic morphological changes using Annexin V‐FITC and propidium iodide (PI), mitochondrial membrane potential determination, assessment of nuclear morphological changes by DAPI (4, 6‐diamidino‐2‐phenylindole dihydrochloride) staining and reactive oxygen species (ROS) generation. The present results exposed the medicinal potential of T. cordifolia to synthesise AgNPs and are found to be bio‐compatible to human lung adenocarcinoma cell line A549.
2 Material and method
Fresh leaves (10.0 g) of T. cordifolia were collected from plant growing naturally and were surface sterilised for 10 min under consecutively tap water followed by immersing in liquid detergent (Tween‐20) (Himedia, India) for 1–2 min to remove adherent dust particles and followed by washing with autoclaved deionised (DI) water.
These surface sterilised leaves were boiled in 100 ml DI water for 10–15 min to prepare aqueous leaf extract. This extract was filtered via membrane filter (0.22 µ) (Merck, Millipore, India) before use. Stock solution of 10 mM was prepared by dissolving 1.69 gm silver nitrate (Himedia, India) in 1000 ml of DI water. This stock solution is diluted at its different concentrations (1–10 mM) for optimisation of silver nitrate concentration and further used for the synthesis of AgNPs. Optimisation was carried out using 10 ml filtrate of aqueous plant extract mixed with 90 ml of AgNO3 solution for each concentration (1–10 mM) separately. Further, leave the reaction mixture without disturbing it until the colour changes and turns dark brown. The brown coloured reaction mixture was proceeded for centrifugation (at 12,000 RPM at 12° C for 15 min) (REMI, India) and the subsequent pellet was carefully washed with autoclaved DI water.
2.1 Characterisation of AgNPs
Preliminary validation of the AgNPs formation was confirmed through UV–Vis spectrophotometer (UV‐1800, Shimadzu, Japan). Fourier transform infrared (FTIR) spectroscopy was carried out to identify capping, reducing and stabilising agents coated AgNPs in the form of functional groups (Nicolet, Thermo Scientific). The IR spectra were noted with in the ranges of 4000–400 cm−1. Scanning electron microscope (EVO18, Carl Zeiss) was used to analyse the surface morphology of synthesised AgNPs. The scanning electron microscopy (SEM) images were taken out at the magnification of 40,000X and operating at 20.00 kV. The occurrence of silver element in synthesised AgNPs was additionally authenticated by the energy‐dispersive X‐ray spectroscopy (INCA X‐act, Oxford). Size of synthesised AgNPs was evaluated by transmission electron microscopy (TEM) analysis (Techani G2 S Twin 200 kV). For TEM analysis samples were prepared through drop suspension method in which the drop of NPs suspended on the carbon coated copper grids. Crystalline nature of fabricated AgNPs was verified by X‐ray diffraction (XRD) of dried power of AgNPs with Cu‐K radiation (XPERT‐PRO).
2.2 In vitro anticancer efficiency of synthesised AgNPs
2.2.1 Cell culture
Human lung carcinoma cells (A549) were taken from NCCS (National centre for cell science), Pune, India. These cells were plated in T 75 cm2 flasks (NEST biotechnology) containing DMEM (Dulbecco's modified of Eagle medium with L‐glutamine and 1000 mg/l glucose) supplemented with 10% FBS (GIBCO), penicillin (100 units/ml), streptomycin (100 µg/ml), in an atmosphere consisting of 5% CO₂ and humidity at 37°C. The consumed media was continuously changed after every 2 days.
2.2.2 Passaging of cells
The phosphate buffered saline (pH 7.3) was used to wash the cells at 80–85% confluence. After washed cells are trypsinised and centrifuged at 1400 rpm for 5 min at room temperature. The medium was prudently removed off and the remaining part, i.e. cells were gently resuspended in the DMEM medium by gentle pipetting up and down 10–15 times. Counting of cells were completed with the help of haemocytometer and then gently resuspended and transferred into sterile culture flasks.
2.2.3 MTT assay
Various concentrations of AgNPs (25, 50, 100, 150 µg/ml) were used to treat A549 cells and the cytotoxicity was detected through (3‐(4, 5‐dimethyl thiazol‐2yl)‐2, 5‐diphenyl tetrazolium bromide), MTT assay. In metabolically active cells MTT is reduced to produce an insoluble purple formazon product. The number of viable or living cells is directly proportional to the obtained product. A549 cells are transferred in 96‐well plates with 5 × 10⁴ cells in each well. After 24 h of seeding, cells were treated with various concentrations of AgNPs (25, 50, 75, 100, 150 µg/ml) and incubated for an additional 24 h. Now 10 µl of MTT solution (5 mg/ml in PBS) was added to each well. An additional 1 h incubation was allowed to develop the colour after that equal amount of DMSO were added in each well which is used to decrease the rate of the reaction and solubilise the formazon crystals. Absorbance (at 570 nm) was taken by using Microplate (ELISA), while the OD of each samples were compared with the control and the graph was plotted. Cell survivability was determined using the following formula:
The mean percentage of viable cells after treatment was calculated relative to the control, and results were expressed as concentration inhibiting cell growth by 50% (IC50).
2.2.4 Trypan blue dye exclusion assay
Trypan blue was widely used to differentiate among viable cells and dead cells. Live cells with complete cell membranes will not retain any colour as the cells are very selective in compounds passing through intact cell membranes [22]. On the other hand, in a dead cell the cell membranes were not intact and a blue colour observed under a microscope. A549 cells were incubated in DMEM medium in a humidified atmosphere consisting of 5% CO₂ at 37°C in a 6‐well plate (NEST Biotechnology) with 5X10⁴ cells per well. After 24 h of incubation A549 cells were treated with different concentrations of AgNPs synthesised using T. cordifolia leaves (25, 50, 75, 100, 150 µg/ml) for 12, 24 and 48 h, respectively, by using 6‐well plates. After these incubations, cells were trypsinised then washed with PBS and suspended in FBS. Now the cells were counted by adding trypan blue with the help of haemocytometer under inverted microscope (Carl Zeiss) at 20X.
2.2.5 Cytomorphological changes in A549 cells
A549 cells were grown in 6‐well plates with 5 × 10⁵ cells/well and after 24 h of incubation, cells were treated with AgNPs (100 µg/ml). Cytomorphological changes were determined by inverted microscope (ZEISS) at 24 and 48 h at the magnification of 20X and 40X. Adobe Photoshop 5.5 (Adobe systems Inc., Mountain View, California) and Picasa 3.9 (Google, USA) software's were used for image detection.
2.2.6 Apoptotic morphological changes using Annexin V‐FITC and PI
Annexin V‐FITC Apoptosis Detection Kit (Clontech Laboratories Inc, USA) was used to determine cellular apoptosis, according to the manufacturer's protocol. A549 cells were seeded in 6‐well plates with 5 × 10⁵ cells/well having cover slips coated with poly‐L‐lysine and further incubated with AgNPs of 100 ppm concentration for 24 h. After this the cover slips were cleaned using 1X Binding Buffer and then resuspended in 200 μl solution of this buffer. Now 10 μl of PI and 5 μl of Annexin V‐FITC were added and then incubated in the dark at room temperature for 30 min. Then the coverslips were viewed under fluorescent microscope (ZEISS) with CCD camera using a dual filter set for FITC (FL‐1 525 nm) and PI (FL‐2 575 nm). Cells in which early apoptosis occur will show green staining (Annexin V‐FITC‐ positive) in their plasma membrane while the cells that has lost membrane integrity will show red staining (PI positive) throughout the cytoplasm with a halo of green staining on the cell surface (plasma membrane) [23]. Images were processed as described above.
2.2.7 Assessment of nuclear morphological changes by DAPI staining
DAPI is a specific fluorescent stain which strongly interacts with adenine–thymine (A–T) rich regions in DNA [24]. The treated A549 cells were washed with PBS and then fixed on coverslips (poly‐lysine coated) with 4% paraformaldehyde (20 min at 4° C and then 5 min at RT), The treated (24 and 48 h) and untreated cells were stained with DAPI. 1 μg/ml concentration of DAPI was added for 60 s in the dark for proper staining of nucleus and then washed. The fluorescent microscope with appropriate filter (461 nm) was used to capture stained images. Images were processed as described above.
2.2.8 ROS generation
ROS was assessed following the procedure described by Jesudason et al. [25], cells were seeded in 6‐well plates with 5 × 10⁵ cells/well with poly‐L‐lysine coated cover slips and incubated with AgNPs of 100 µg/ml concentrations for 24 h. After incubation, cells were treated with 10 µM of 2′, 7′‐dichlorfluorescein‐diacetate (H2 DCF‐DA) which was then kept in incubator for 30 min. H2 DCF‐DA is a non‐fluorescent probe that can penetrate into the intracellular matrix of cells. H2 DCF‐DA is deacetylated by cellular esterases to non‐fluorescent 2′, 7′‐dichlorodihydrofluorescin (H2 DCF‐DA) and oxidised by ROS to fluorescent dichlorofluorescein (DCF). After 30 min incubation period, coverslips were washed with PBS to remove the excess dye and viewed under fluorescent microscope (ZEISS) with CCD camera using green filter. Images were processed as described above.
2.2.9 Mitochondrial membrane potential determination
A549 cells were seeded in 6‐well plates with 5 × 10⁵ cells/well with poly‐L‐lysine coated cover slips and further incubated with 100 µg/ml concentration of AgNPs for 24 h. After incubation 5,5′,6,6′‐tetrachloro‐1,1′,3,3′tetraethylbenzimi‐dazolylcarbocyanine iodide (JC‐1) a lipophilic cationic dye was added to the cells at a concentration of (5 µM). JC‐1 has been widely used as a mitochondrial membrane potential indicator, and possess advantageous features as comparison to other cationic dyes. The selectively entering of JC‐1 into mitochondria leads to colour changes from red to green as the mitochondrial potential reduces [26]. In healthy cells with high mitochondrial potential (ΔΨm), JC‐1 instantly forms complexes recognised as J‐aggregates with high red fluorescence (590 nm) while in unhealthy cells the monomeric form JC‐1 emits green fluorescence at 530 nm owing to the low ΔΨm. After 30 min of incubation the cover slips were washed with PBS to remove the excess dye and viewed under fluorescent microscope (ZEISS) with CCD camera using green and red filters. Images were processed as described above. The comparative measurements of membrane potential between cell populations were determined by using ratio of fluorescence at 590–530 nm (red to green). Observations for each analysis were taken from minimum 20 microscopic fields of each sample. Data were reported as mean ± SD of three independent experiments performed in triplicate.
3 Result and discussion
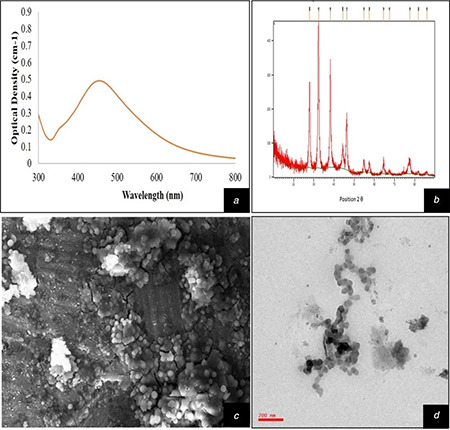
10% leaf extract of T. cordifolia (TCE) when mixed with different concentration of AgNO3 solutions (1–10 mM) separately at room temperature leads to changes in colour from pale yellow to dark brown after 5 min of reaction. Reaction mixture of TCE and AgNO3 solutions (1–10 mM) showed brownish colour which occurred due to surface plasmon resonance of AgNPs [27, 28]. The AgNPs were synthesised by the reduction of silver ions (Ag2+) in to silver metal (Ag0). Colour changes of reaction mixture indicate the biosynthesis of AgNPs and it was favoured by various reports [6, 9, 29]. Out of different tested concentrations of AgNO3, 5 mM showed maximum absorbance at 440 nm which confirmed the optimum concentration of AgNO3 solution. Therefore, 5 mM concentration of AgNO3 solution was used for further set of experiments. AgNO3 at 5 mM has been optimised for AgNPs synthesis through Argemone Mexicana, while 1 mM AgNO3 has also been optimised for AgNPs synthesis through Ocimum tenuiflorum, Solanum tricobatum, Syzygium cumini, Centella asiatica, Caesalpinia pulcherrima and Citrus sinensis [30, 31, 32]. After 4 h the brown colour solution was centrifuged and the received pellet was analysed under UV–Vis spectrophotometer after resuspending in DI water. Maximum absorbance was recorded at 440 nm with broader peak indicating polydispersed nature of AgNPs (Fig. 1 a) and it was due to the slow reduction rate [9].
Fig. 1.
Characterisation of AgNPs
(a) UV–Vis spectrophotometer graph of biosynthesised AgNPs, (b) XRD pattern of AgNPs indicating FCC structure, (c) SEM micrographs of biosynthesised AgNPs showing surface morphology and spherical shape, (d) TEM micrographs of phytofabricated AgNPs describing their shape and size between 25–50 nm
3.1 Characterisation
The FTIR spectra provide information about the organic molecules available on the surface of NPs [33]. The type of stabilising and capping agent were identified by FTIR spectroscopy. Prominent starches at 2924, 2854, 1685, 1462, 1377, 1076, 725, 493 and 455 cm−1 were detected in T. cordifolia synthesised AgNPs solution. The detected peaks at 2924 and 2854 cm−1 are distinguishing for alkyl C–H, 1685 cm−1 is characteristic for C=O group of amides, 1377 cm−1 is typically for C–F of alkyl halides, 1076 cm−1 for C–O of alcohol and 725 cm−1 is owing to C–Cl stretch of alkyl halide (Fig. 2). These starches confirm the presence of various bioactive compounds such as alkaloids, flavonoids and terpenoids which act as capping and stabilisation agents [34].
Fig. 2.
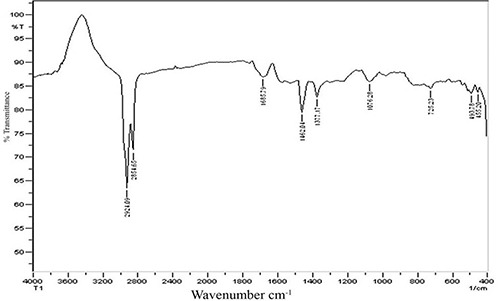
FTIR analysis of biosynthesised AgNPs
Morphology of synthesised AgNPs was analysed through SEM. The SEM micrographs revealed that the AgNPs were in spherical shape (Fig. 1 c). Similar to the present investigation, many reports are available reporting the spherical shape of AgNPs fabricated by using various plants [9, 12, 28]. Energy dispersive X‐ray analysis (EDX) is used to identify the elemental composition of materials. The EDX spectrum showed prominent signal for Ag at 3 kV. TEM images revealed that synthesised AgNPs fall in to 25–50 nm size and spherical shape (Fig. 1 d). TEM images also authenticated the polydisperse nature of synthesised AgNPs as earlier revealed by UV–Vis spectrophotometric observation, which also confirmed the earlier reports regarding the presence of diversity of natural compounds in T. cordifolia [35]. Various results are available in favour to the present observation for polydispersed nature of AgNPs with their variable sizes (20–40 nm) confirmed through TEM in Hibiscus rosasinensis, Terminalia chebula, Mimusops elengi, Myristica fragrans, Centella asiatica, Nyctanthes arbortristis and Hemidesmus indicus [36, 37, 38]. Earlier it was reported that the presence of different kind of reducing and capping agents in plant extract causes variation in size of AgNPs [39]. Phytofabricated AgNPs were further analysed by XRD, which revealed that the diffraction peaks were displaying the range of 2Ɵ (20–80°) which are equivalent to (2 6 4) (1 1 1) (2 0 0) plane (Fig. 1 b). The results confirmed that the AgNPs have FCC (face centred cubic) structure. Similar type of structure was also obtained by other scientists in Morganella spp., Coriandrum Sativum and Elaeagnus latifolia [40, 41].
3.2 Anticancer activity
3.2.1 AgNPs affected human lung carcinoma cell (A549) viability percentage
The in vitro cytotoxic activity of the AgNPs was assessed against human lung carcinoma A549 cells. A dose‐dependent decrease in relative cell viability percentage of the A549 cells after incubation with AgNPs for 24 h was observed from the results of MTT assays [42]. At higher concentrations significant cell mortality was observed. Relatively, cell viability percentage decrease was measured by MTT assay on A549 cell line, treated with AgNPs (25, 50, 75, 100, 150 ppm) for 24 h, in comparison with the untreated control cells represented a dose‐dependent pattern as shown in Fig. 3 a. Using the dose–response curve, IC50 was calculated to be 100 μg/ml (ppm) (Fig. 3 b). The cell viability percentage decreased 50% with 100 ppm AgNPs (IC50 value) in comparison with the control group. 150 ppm dose reduced the viability by 70% after 24 h of incubation. On subsequent experiments, IC50 value of AgNPs, i.e. 100 ppm IC50 concentration was used for further experiments. These results demonstrate that AgNPs mediate a concentration dependent increase in cytotoxicity. Some other studies revealed the potential toxicity of silver NPs in cancer cells [42, 43]. Similarly [44], the same cytotoxic effect of AgNPs on human lung carcinoma A549 cells has been reported.
Fig. 3.
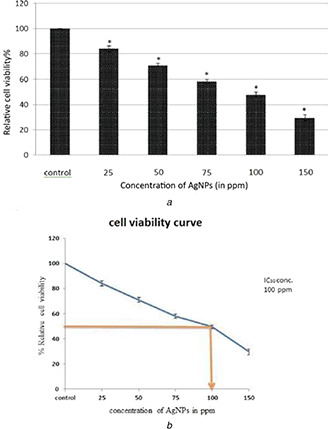
Dose‐dependent cytotoxicity analysis by MTT assay
(a) Cytotoxicity of different concentrations (25, 50, 75, 100, 150 ppm) of AgNPs was measured by MTT assay on A549 cells for 24 h, (b) IC50 value was detected as 100 ppm by MTT assay in treated A549 cells for 24 h. Data is representative of three experiments. *p value<0.05
3.2.2 Cytotoxicity measurement by trypan blue dye exclusion assay
Cell cytotoxicity was also measured by trypan blue dye exclusion assay. A dose‐dependent decrease in relative percentage of the A549 cells after treatment with AgNPs for 12, 24 and 48 h was observed. At higher concentration of AgNPs, significant cell mortality was observed. Relative cell viability percentage was measured by trypan blue dye exclusion assay on A549 cell line treated with 25, 50, 75, 100, 150 ppm of AgNPs after 12, 24 and 48 h of treatment in comparison with the untreated control cells. A dose‐ and time‐dependent decrease in cell viability after treatment was observed as shown in Fig. 4. Some other reports also used trypan blue for cytotoxicity measurement [45].
Fig. 4.
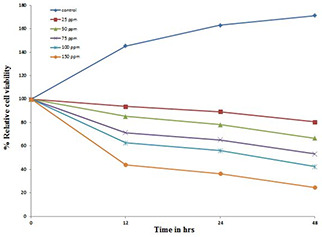
Dose‐ and time‐dependent analysis of relative cell viability percentage by trypan blue dye exclusion method. Decrease in relative cell viability percentage in A549 cells up to 48 h after using AgNPs in different concentrations (25–150 ppm) was determined by microscopic observation of the cells after staining with trypan blue dye. Data is representative of three experiments. *p value<0.05
3.2.3 Cytomorphological changes induced by AgNPs
The cytomorphological examinations of the A549 cell were illustrated using an inverted microscope (20X and 40X). For this experiment IC50 (100 ppm) concentration of the AgNPs was used to treat the A549 cells. Typical polygonal and cobblestone monolayer appearance were observed in the untreated control group in comparison with the AgNPs treated A549 cells. In cells treated with AgNPs, morphological changes were observed. The most recognisable cytomorphological changes in the treated A549 cells for 24 h were the shrinkage of the cells and round shaped cells poorly adhered to the culture flask [46, 47] (Fig. 5 a). Significant decrease of the number of A549 cells treated with AgNPs for 12, 24 and 48 h was observed compared to the untreated control group (Fig. 5 b). Significant reduction in the number of AgNPs treated A549 cells were also reported by various scientists [48].
Fig. 5.
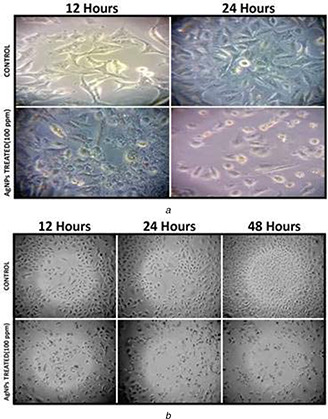
Cytomorphological change analysis
(a) 5×10⁵ cells/well (6‐well plate) A549 cells were treated with 100 ppm AgNPs for 24 h, shrinked and poorly adhered cells were observed under inverted microscope (40X magnification) in comparison with the untreated control cells, (b) Decrease in number of A549 cells after the same treatment (24 and 48 h) was observed under (20X magnification)
3.2.4 Induction of apoptosis by AgNPs
The morphological change of A549 cells was observed after treatment with the IC50 concentration of the AgNPs. The cells were observed under fluorescence microscope after ANNEXIN V‐FITC/PI double staining treated with 100 ppm AgNPs for 24 h. Untreated A549 control cells did not show any fluorescence. Due to intact plasma membrane and inner side presence of phosphatidylserine in live cells, ANNEXIN V – FITC or PI is not able to penetrate and interact with phosphatidylserine (Fig. 6 a). A549 cells after 24 h of treatment with AgNPs have shown changes in cellular morphology, in the cells with early apoptosis a green staining (Annexin V‐FITC) was observed in the plasma membrane, confirming that the phosphatidylserine was redistributed to the outer layer of the plasma membrane and as the Annexin V‐FITC has a strong affinity for the phosphatidylserine counterpart it bind to the phosphatidylserine and a green fluorescence was observed [49, 50]. In the cells with cellular integrity lost, a red staining (PI) throughout the cytoplasm was observed and a halo of green staining on the surface (plasma membrane) (Fig. 6 b). Furthermore, it is stated that AgNPs initiate the cell apoptosis in various cancer cell lines such as human lung carcinoma A549, HepG2, human breast cancer cell MCF‐7, HCT116 [51].
Fig. 6.
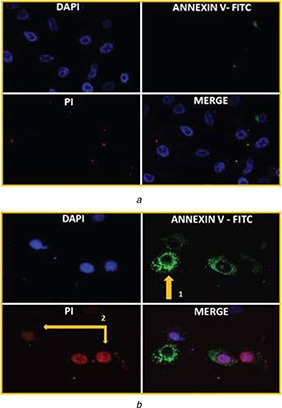
Observation of apoptotic changes in treated cells after double staining with Annexin FITC/PI
(a) Untreated control A549 cells showed no sign of apoptosis after staining with Annexin V‐FITC and PI, (b) Cells treated with AgNPs showed detection of apoptosis after staining with Annexin V‐FITC and PI, (1) AnnexinV‐FITC positive cells indicate early apoptosis and (2) PI positive cells indicate late apoptosis
3.2.5 AgNPs induced nuclear damage in treated carcinoma cells
The nuclear morphology of the untreated control A549 cells and AgNPs treated with IC50 concentration (100 ppm) was analysed. A549 cells were assessed using fluorescence microscopy after staining with DAPI. The untreated control A549 cells (Fig. 7 a) show clear nuclei having no nuclear rupture or fragmented nuclei, but in AgNPs treated A549 cells incubated for 24 h, clear nuclear membrane rupture (Fig. 7 b (i)) and fragmented nuclei that are the index of apoptosis and it were observed (Fig. 7 b (ii)) after 48 h of treatment [5, 52]. The present results were also supported by Kanipandian et al. [53] where apoptosis and DNA contraction in AgNPs treated human lung carcinoma A549 were also reported.
Fig. 7.
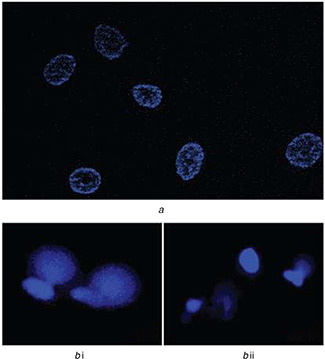
Nuclear damage detection assay
(a) Untreated A549 cells showed undamaged nucleus after staining with nuclear stain DAPI, (b) (i) Cells treated with AgNPs 100 ppm for 24 h showed nuclear membrane rupture under fluorescence microscopy after staining with DAPI. (ii) After 48 h of treatment cells showed fragmented nuclei when stained with DAPI
3.2.6 Measurement of ROS generation using H2 DCF‐DA staining
ROS are free radicals that play important functions in biological species. ROS play multiple roles in living organisms. A slight increase in ROS can help in promoting cell proliferation and cell differentiation [54]. In the present experiment intracellular hydrogen peroxide generation was measured using DCF‐DA staining. It is an indirect method for detection of intracellular ROS generation. In comparison to the untreated control, the intracellular ROS fluorescence intensity in AgNPs treated A549 cells is significantly higher (Fig. 8 a). Comparing untreated A549 cells (control) for ROS fluorescence intensity after 12 and 24 h [fluorescence intensity units (FIU): 12 h, 37.77 ± 3.29; 24 h, 77 ± 3.74] with AgNPs treated A549 cells, the ROS fluorescence intensity was elevated by 4.6 fold (FIU: 173.66 ± 5.43) after 12 h and by 4‐fold (FIU: 297 ± 4.08) after 24 h of treatment with IC50 concentration (100 ppm) of AgNPs (Fig. 8 b). Excessive increase in amount of ROS generation may cause oxidative damage to the cell biomolecule lipids, proteins and can also cause damage to the DNA [55]. ROS generation damages cells by two types of distinct pathways: one is apoptosis and the other is necrosis [56]. Previously available reports also suggested the death of A549 cells and other cancer cell lines might be linked to the induction of apoptosis through the generation of ROS [57].
Fig. 8.
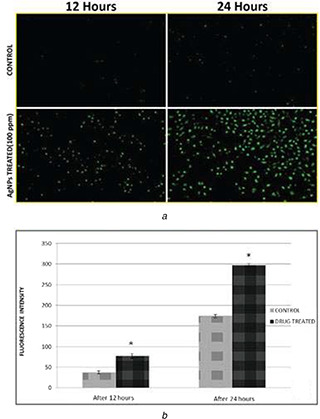
Detection of ROS in treated A549 cells
(a) Time‐dependent (24 and 48 h) increase of green fluorescence intensity in AgNPs treated A549 cells when stained with DCF‐DA stain, clearly indicating ROS generation under fluorescent microscopy, (b) Fluorescence intensity (FI) was plotted against time. The graph indicates time‐dependent increment of F1 in treated cells in comparison with untreated cells. Data is representative of three experiments. *p ‐value <0.05
3.2.7 AgNPs induced loss of mitochondrial membrane potential (ψ m) in treated A549 cells
AgNPs induced loss of mitochondrial membrane potential (ψ m) in A549 treated cells was observed after 24 h post‐treatment with IC50 concentration of AgNPs (100 ppm). In untreated control A549 cells, red fluorescence was more intense than green fluorescence but in AgNPs treated A549 cells green fluorescence was more intense (Fig. 9 a (i) and (ii)). A significant drop in mitochondrial potential (ψ m) of 4‐fold decrease was observed 24 h post‐treatment (590:530 nm ratio: control 2.105 ± 0.163; AgNPs treated 0.55 ± 0.03) (Fig. 9 b), indicating that AgNPs caused sustained hypopolarisation of the mitochondrial membrane potential in A549 cells [58]. AgNPs tend to accumulate in the mitochondria resulting in oxidative stress and potentiate structural damage leads to toxicity of cells [43, 59].
Fig. 9.
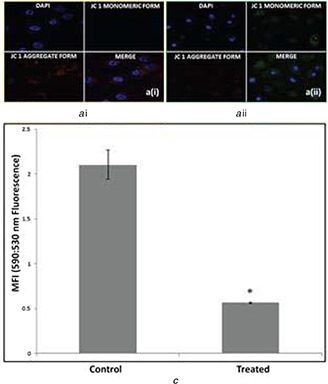
Mitochondrial membrane potential (ψm) decreases in AgNPs treated A549 cells
(a) (i) Untreated control A549 cells with no changes in ψm showing red colour under fluorescence microscopy (590 nm) after staining with JC1 dye. (ii) Cells treated with AgNPs showed decreased ψ m with green florescence (530 nm) after staining with JC1 dye, (b) Ratio of fluorescence at 590–530 nm was plotted against A549 cell types (untreated or treated with AgNPs for 24 h), showing the clear decrease of mitochondrial membrane potential of treated cells. Data is representative of three experiments. *p value <0.05
4 Conclusion
We have established a repeatable, reliable and sustainable method for rapid synthesis of AgNPs using aqueous leaf extracts of T. cordifolia in natural conditions. Synthesis of AgNPs has been started within the 4–5 min of the reaction at room temperature. The concentration of AgNO3 was standardised for the better yield of AgNPs and the synthesised AgNPs were characterised by FTIR, SEM, EDX, TEM and XRD for their surface morphology, size and crystalline nature. The AgNPs showed cytotoxicity against human lung carcinoma A549 cell line. Various methods such as surgery, chemotherapy, radiation therapy and immunotherapy have been in use to cure cancer, however the above‐mentioned methods have been reported post‐treatment adverse effects [60]. Hence, the use of NPs synthesised from T. cordifolia leaf extract can be a suitable alternative to conventional mode of treatments due to its efficiency to kill cancer cells as has been revealed in the present investigation.
5 Acknowledgment
The authors are thankful to Manipal University Jaipur and MHRD, Government of India, National Institute of Technology, Durgapur, WB for providing the required facilities to conduct this collaborative research.
6 References
- 1. Pareek N. Dhaliwal A.S. Malik C.P.: ‘Biogenic synthesis of silver nanoparticles, using bougainvillea spectabilis willd. Bract extract’, Natl. Acad. Sci. Lett., 2012, 35, (5), pp. 383 –388 [Google Scholar]
- 2. Majeed A. Ullah W. Anwar A.W. et al.: ‘Cost‐effective biosynthesis of silver nanoparticles using different organs of plants and their antimicrobial applications: a review’, Mater. Technol., 2018, 33, (5), pp. 313 –320 [Google Scholar]
- 3. Mittal J. Batra A. Singh A. et al.: ‘Phytofabrication of nanoparticles through plant as nanofactories’, Adv. Nat. Sci. Nanosci. Nanotechnol., 2014, 5, (4), pp. 1 –10 [Google Scholar]
- 4. Piacenza E. Presentato A. Zonaro E. et al.: ‘Selenium and tellurium nanomaterials’, Phys. Sci. Rev., 2018, 3, (5), pp. 1 –14 [Google Scholar]
- 5. Fahimirad S. Ajalloueian F. Ghorbanpour M.: ‘Synthesis and therapeutic potential of silver nanomaterials derived from plant extracts’, Ecotoxicol. Environ. Saf., 2019, 168, pp. 260 –278 [DOI] [PubMed] [Google Scholar]
- 6. Lalitha A. Subbaiya R. Ponmurugan P.: ‘Green synthesis of silver nanoparticles from leaf extract azhadirachta indica and to study its anti‐bacterial and antioxidant property’, Int. J. Curr. Microbiol. Appl. Sci., 2013, 2, (6), pp. 228 –235 [Google Scholar]
- 7. Ghaffari‐Moghaddam M. Hadi‐Dabanlou R.: ‘Plant mediated green synthesis and antibacterial activity of silver nanoparticles using Crataegus douglasii fruit extract’, J. Ind. Eng. Chem., 2014, 20, (2), pp. 739 –744 [Google Scholar]
- 8. Miri A. Sarani M. Rezazade Bazaz M. et al.: ‘Plant‐mediated biosynthesis of silver nanoparticles using Prosopis farcta extract and its antibacterial properties’, Spectrochim. Acta A Mol. Biomol. Spectrosc., 2015, 141, pp. 287 –291 [DOI] [PubMed] [Google Scholar]
- 9. Hyllested J.A. Palanco M.E. Hagen N. et al.: ‘Green preparation and spectroscopic characterization of plasmonic silver nanoparticles using fruits as reducing agents’, Beilstein J. Nanotechnol., 2015, 6, (1), pp. 293 –299 [DOI] [PMC free article] [PubMed] [Google Scholar]
- 10. Ramar K. Gnanamoorthy G. Mukundan D. et al.: ‘Environmental and antimicrobial properties of silver nanoparticles synthesized using Azadirachta indica Juss leaves extract’, SN Appl. Sci., 2019, 1, (1), pp. 1 –11 [Google Scholar]
- 11. Mittal J.: ‘In Vitro Studies Biofabrication of Nanoparticles Biochemical and Molecular Analysis of Medicinally Important Plant Tinospora Cordifolia Willd Miers ex Hook F and Thoms’. PhD thesis, Manipal University, 2017. [Google Scholar]
- 12. Haroon Anwar S.: ‘A brief review on nanoparticles: types of platforms, biological synthesis and applications’, Res. Rev. J. Mater. Sci., 2018, 6, (2), pp. 109 –116 [Google Scholar]
- 13. Mittal J. Singh A. Batra A. et al.: ‘Synthesis and characterization of silver nanoparticles and their antimicrobial efficacy’, Part. Sci. Technol., 2017, 35, (3), pp. 338 –345 [Google Scholar]
- 14. Kora A.J. Sashidhar R.B.: ‘Biogenic silver nanoparticles synthesized with rhamnogalacturonan gum: antibacterial activity, cytotoxicity and its mode of action’, Arab. J. Chem., 2018, 11, (3), pp. 313 –323 [Google Scholar]
- 15. Chugh H. Sood D. Chandra I. et al.: ‘Role of gold and silver nanoparticles in cancer nano‐medicine’, Artif. Cells, Nanomed. Biotechnol., 2018, 46, pp. 1210 –1220 [DOI] [PubMed] [Google Scholar]
- 16. Arunachalam K.D. Arun L.B. Annamalai S.K. et al.: ‘Potential anticancer properties of bioactive compounds of Gymnema sylvestre and its biofunctionalized silver nanoparticles’, Int. J. Nanomed., 2014, 10, pp. 31 –41 [DOI] [PMC free article] [PubMed] [Google Scholar]
- 17. Vasanth K. Ilango K. MohanKumar R. et al.: ‘Anticancer activity of Moringa oleifera mediated silver nanoparticles on human cervical carcinoma cells by apoptosis induction’, Colloids Surf. B Biointerfaces, 2014, 117, pp. 354 –359 [DOI] [PubMed] [Google Scholar]
- 18. Firdhouse J. Lalitha P.: ‘Apoptotic efficacy of biogenic silver nanoparticles on human breast cancer MCF‐7 cell lines’, Prog. Biomater., 2015, 4, (2‐4), pp. 113 –121 [DOI] [PMC free article] [PubMed] [Google Scholar]
- 19. Nayak D. Pradhan S. Ashe S. et al.: ‘Biologically synthesised silver nanoparticles from three diverse family of plant extracts and their anticancer activity against epidermoid A431 carcinoma’, J. Colloid Interface Sci., 2015, 457, pp. 329 –338 [DOI] [PubMed] [Google Scholar]
- 20. Scherer M.D. Sposito J.C.V. Falco W.F. et al.: ‘Cytotoxic and genotoxic effects of silver nanoparticles on meristematic cells of Allium cepa roots: A close analysis of particle size dependence’, Sci. Total Environ., 2019, 660, pp. 459 –467 [DOI] [PubMed] [Google Scholar]
- 21. Moshfegh A. Jalali A. Salehzadeh A. et al.: ‘Biological synthesis of silver nanoparticles by cell‐free extract of Polysiphonia algae and their anticancer activity against breast cancer MCF‐7 cell lines’, Micro Nano Lett., 2019, 14, (5), pp. 581 –584 [Google Scholar]
- 22. Lebeau P.F. Chen J. Byun J.H. et al.: ‘The trypan blue cellular debris assay: a novel low‐cost method for the rapid quantification of cell death’, MethodsX., 2019, 6, pp. 1174 –1180 [DOI] [PMC free article] [PubMed] [Google Scholar]
- 23. Foldbjerg R. Dang D.A. Autrup H.: ‘Cytotoxicity and genotoxicity of silver nanoparticles in the human lung cancer cell line, A549’, Arch. Toxicol., 2011, 85, (7), pp. 743 –750 [DOI] [PubMed] [Google Scholar]
- 24. Baharara J. Namvar F. Ramezani T. et al.: ‘Silver nanoparticles biosynthesized using Achillea biebersteinii flower extract: Apoptosis induction in MCF‐7 cells via caspase activation and regulation of bax and bcl‐2 gene expression’, Molecules, 2015, 20, (2), pp. 2693 –2706 [DOI] [PMC free article] [PubMed] [Google Scholar]
- 25. Jesudason E.P. Masilamoni J.G. Jebaraj C.E. et al.: ‘Efficacy of DL‐α lipoic acid against systemic inflammation‐induced mice: antioxidant defense system’, Mol. Cell. Biochem., 2008, 313, (1‐2), pp. 113 –123 [DOI] [PubMed] [Google Scholar]
- 26. Harshkova D. Zielińska E. Aksmann A.: ‘Optimization of a microplate reader method for the analysis of changes in mitochondrial membrane potential in Chlamydomonas reinhardtii cells using the fluorochrome JC‐1’, J. Appl. Phycol., 2019, 31, (6), pp. 3691 –3697 [Google Scholar]
- 27. Krishnaraj C. Ramachandran R. Mohan K. et al.: ‘Optimization for rapid synthesis of silver nanoparticles and its effect on phytopathogenic fungi’, Spectrochim. Acta A Mol. Biomol. Spectrosc., 2012, 93, pp. 95 –99 [DOI] [PubMed] [Google Scholar]
- 28. Begum H.J. Ramamurthy V. Kumar S.S.: ‘Study of synthesis and characterization of silver nanoparticles from tinospora cordifolia’, Pharma Innov. J., 2019, 8, (1), pp. 612 –615 [Google Scholar]
- 29. Jain S. Mehata M.S.: ‘Medicinal plant leaf extract and pure flavonoid mediated green synthesis of silver nanoparticles and their enhanced antibacterial property’, Sci. Rep., 2017, 7, (1), pp. 1 –13 [DOI] [PMC free article] [PubMed] [Google Scholar]
- 30. Singh A. Jain D. Upadhyay M.K. et al.: ‘Green synthesis of silver nanoparticles using Argemone Mexicana leaf extract and evaluation of their antimicrobial activities’, Dig. J. Nanomater. Biostructures, 2010, 5, (2), pp. 483 –489 [Google Scholar]
- 31. Logeswari P. Silambarasan S. Abraham J.: ‘Synthesis of silver nanoparticles using plants extract and analysis of their antimicrobial property’, J. Saudi Chem. Soc., 2015, 19, (3), pp. 311 –317 [Google Scholar]
- 32. Moteriya P. Chanda S.: ‘Biosynthesis of silver nanoparticles formation from Caesalpinia pulcherrima stem metabolites and their broad spectrum biological activities’, J. Genet. Eng. Biotechnol., 2018, 16, (1), pp. 105 –113 [DOI] [PMC free article] [PubMed] [Google Scholar]
- 33. Sana S.S. Dogiparthi L.K.: ‘Green synthesis of silver nanoparticles using Givotia moluccana leaf extract and evaluation of their antimicrobial activity’, Mater. Lett., 2018, 226, pp. 47 –51 [Google Scholar]
- 34. Naseem T. Farrukh M.A.: ‘Antibacterial activity of green synthesis of iron nanoparticles using lawsonia inermis and gardenia jasminoides leaves extract’, J. Chem., 2015, 2015, pp. 1 –8 [Google Scholar]
- 35. Sinku R. Sinha M.R.: ‘Preliminary phytochemical screening and physiochemical analysis of Tinospora cordifolia Miers’, J. Med. Plants., 2018, 6, (1), pp. 177 –180 [Google Scholar]
- 36. Philip D.: ‘Green synthesis of gold and silver nanoparticles using Hibiscus rosa sinensis’, Phys. E, 2010, 42, (5), pp. 1417 –1424 [Google Scholar]
- 37. Kirthika P. Dheeba B. Sivakumar R. et al.: ‘Plant mediated synthesis and characterization of silver nanoparticles’, Int. J. Pharm. Pharm. Sci., 2014, 6, (8), pp. 304 –310 [Google Scholar]
- 38. Basu S. Maji P. Ganguly J.: ‘Rapid green synthesis of silver nanoparticles by aqueous extract of seeds of Nyctanthes arbor‐tristis’, Appl. Nanosci., 2016, 6, (1), pp. 1 –5 [Google Scholar]
- 39. Song J.Y. Kim B.S.: ‘Rapid biological synthesis of silver nanoparticles using plant leaf extracts’, Bioprocess Biosyst. Eng., 2009, 32, (1), pp. 79 –84 [DOI] [PubMed] [Google Scholar]
- 40. Phanjom P. Sultana A. Sarma H. et al.: ‘Plant‐mediated synthesis of silver nanoparticles using Elaeagnus latifolia leaf extract’, Dig. J. Nanomater. Biostructures, 2012, 7, (3), pp. 1117 –1123 [Google Scholar]
- 41. Khan M.Z.H. Tareq F.K. Hossen M.A. et al.: ‘Green synthesis and characterization of silver nanoparticles using Coriandrum sativum leaf extract’, J. Eng. Sci. Technol., 2018, 13, (1), pp. 158 –166 [Google Scholar]
- 42. Uygur B. Craig G. Mason M.D. et al.: ‘Cytotoxicity and genotoxicity of silver nanomaterials’, NSTI‐Nanotech., 2009, 2, (2), pp. 383 –386 [Google Scholar]
- 43. Kim S. Eun J. Choi J. et al.: ‘Toxicology in vitro oxidative stress‐dependent toxicity of silver nanoparticles in human hepatoma cells’, Toxicol. Vitr., 2009, 23, (6), pp. 1076 –1084 [DOI] [PubMed] [Google Scholar]
- 44. Gurunathan S. Jeong J. Han J.W. et al.: ‘Multidimensional effects of biologically synthesized silver nanoparticles in Helicobacter pylori, Helicobacter felis, and human lung (L132) and lung carcinoma A549 cells’, Nanoscale Res. Lett., 2015, 10, (1), pp. 1 –17 [DOI] [PMC free article] [PubMed] [Google Scholar]
- 45. Yuan Y. Zhang S. Hwang J. et al.: ‘Silver nanoparticles potentiates cytotoxicity and apoptotic potential of camptothecin in human cervical cancer cells’, Oxid. Med. Cell Longev., 2018, 2018, pp. 1 –21 [DOI] [PMC free article] [PubMed] [Google Scholar]
- 46. Krishnasamy L. Ponmurugan P. Jayanthi K. et al.: ‘Cytotoxic, apoptotic efficacy of silver nanoparticles synthesized from Indigofera aspalathoids’, Int. J. Pharm. Pharm. Sci, 2014, 6, pp. 245 –248 [Google Scholar]
- 47. Jeyaraj M. Sathishkumar G. Sivanandhan G. et al.: ‘Biogenic silver nanoparticles for cancer treatment: an experimental report’, Colloids Surf. B Biointerfaces, 2013, 106, pp. 86 –92 [DOI] [PubMed] [Google Scholar]
- 48. Fard N.N. Noorbazargan H. Mirzaie A. et al.: ‘Biogenic synthesis of AgNPs using Artemisia oliveriana extract and their biological activities for an effective treatment of lung cancer biogenic synthesis of AgNPs using Artemisia oliveriana extract and their biological activities for an effective treatm’, Artif. Cells Nanomed., Biotechnol., 2018, 46, (S3), pp. S1047 –S1058 [DOI] [PubMed] [Google Scholar]
- 49. Van Engeland M. Ramaekers F.C.S. Schutte B. et al.: ‘A novel assay to measure loss of plasma membrane asymmetry during apoptosis of adherent cells in culture’, Cytometry, 1996, 24, (2), pp. 131 –139 [DOI] [PubMed] [Google Scholar]
- 50. Segawa K. Nagata S.: ‘An apoptotic ‘eat Me’ signal: phosphatidylserine exposure’, Trends Cell Biol., 2015, 25, (11), pp. 639 –650 [DOI] [PubMed] [Google Scholar]
- 51. Saravanakumar K. Chelliah R. Mubarakali D.: ‘Unveiling the potentials of biocompatible silver nanoparticles on human lung carcinoma A549 cells and Helicobacter pylori’, Sci. Rep., 2019, 9, (1), pp. 1 –8 [DOI] [PMC free article] [PubMed] [Google Scholar]
- 52. Vivek R. Thangam R. Muthuchelian K. et al.: ‘Green biosynthesis of silver nanoparticles from Annona squamosa leaf extract and its in vitro cytotoxic effect on MCF‐7 cells’, Process Biochem., 2012, 47, (12), pp. 2405 –2410 [Google Scholar]
- 53. Kanipandian N. Li D. Kannan S.: ‘Induction of intrinsic apoptotic signaling pathway in A549 lung cancer cells using silver nanoparticles from Gossypium hirsutum and evaluation of in vivo toxicity’, Biotechnol. Rep., 2019, 23, p. e00339 [DOI] [PMC free article] [PubMed] [Google Scholar]
- 54. Trachootham D. Alexandre J. Huang P.: ‘Targeting cancer cells by ROS‐mediated mechanisms: A radical therapeutic approach?’, Nat. Rev. Drug Discov., 2009, 8, (7), pp. 579 –591 [DOI] [PubMed] [Google Scholar]
- 55. Tripathy B.C. Oelmüller R.: ‘Reactive oxygen species generation and signaling in plants’, Plant Signal. Behav., 2012, 7, (12), pp. 1621 –1633 [DOI] [PMC free article] [PubMed] [Google Scholar]
- 56. Jeyaraj M. Rajesh M. Arun R. et al.: ‘An investigation on the cytotoxicity and caspase‐mediated apoptotic effect of biologically synthesized silver nanoparticles using Podophyllum hexandrum on human cervical carcinoma cells’, Colloids Surf. B Biointerfaces, 2013, 102, pp. 708 –717 [DOI] [PubMed] [Google Scholar]
- 57. Gon C. Castro‐aceituno V. Abbai R. et al.: Caspase‐3 / MAPK pathways as main regulators of the apoptotic e ff ect of the phyto‐mediated synthesized silver nanoparticle from dried stem of Eleutherococcus senticosus in human cancer cells’, Biomed. Pharmacother., 2018, 99, pp. 128 –133 [DOI] [PubMed] [Google Scholar]
- 58. Rosarin F.S. Arulmozhi V. Nagarajan S. et al.: ‘Antiproliferative effect of silver nanoparticles synthesized using amla on Hep2 cell line’, Asian Pac. J. Trop. Med., 2013, 6, (1), pp. 1 –10 [DOI] [PubMed] [Google Scholar]
- 59. Carlson C. Hussain S.M. Schrand A.M. et al.: ‘Unique cellular interaction of silver nanoparticles: size‐dependent generation of reactive oxygen Species’, J. Phys. Chem. B., 2008, 112, (43), pp. 13608 –13619 [DOI] [PubMed] [Google Scholar]
- 60. Rath M. Panda S.S. Dhal N.K.: ‘Synthesis of silver nano particles from plant extract and its application in cancer treatment: a review’, Int. J. Plant Anim. Environ. Sci., 2014, 4, pp. 137 –145 [Google Scholar]


