Abstract
MiR‐155 plays a critical role in the formation of cancers and other diseases. In this study, the authors aimed to design and fabricate a biosensor based on cross‐linking gold nanoparticles (AuNPs) aggregation for the detection and quantification of miR‐155. Also, they intended to compare this method with SYBR Green real‐time polymerase chain reaction (PCR). Primers for real‐time PCR, and two thiolated capture probes for biosensor, complementary with miR‐155, were designed. Citrate capped AuNPs (18.7 ± 3.6 nm) were synthesised and thiolated capture probes immobilised to AuNPs. The various concentrations of synthetic miR‐155 were measured by this biosensor and real‐time PCR method. Colorimetric changes were studied, and the calibration curves were plotted. Results showed the detection limit of 10 nM for the fabricated biosensor and real‐time PCR. Also, eye detection using colour showed the weaker detection limit (1 µM), for this biosensor. MiR‐133b as the non‐complementary target could not cause a change in both colour and UV–visible spectrum. The increase in hydrodynamic diameter and negative zeta potential of AuNPs after the addition of probes verified the biosensor accurately fabricated. This fabricated biosensor could detect miR‐155 simpler and faster than previous methods.
Inspec keywords: RNA, molecular biophysics, biochemistry, cancer, nanoparticles, gold, aggregation, surface plasmon resonance, molecular configurations, nanosensors, enzymes, calibration, ultraviolet spectra, visible spectra, eye, hydrodynamics, electrokinetic effects, biosensors, nanofabrication
Other keywords: cross‐linking gold nanoparticles aggregation method, localised surface plasmon resonance, quantitative detection, cancers, diseases, biosensor, miR‐155 detection, miR‐155 quantification, SYBR green real‐time polymerase chain reaction, thiolated capture probes, citrate capped AuNPs, synthetic miR‐155, real‐time PCR method, colorimetric changes, calibration curves, eye detection, colour, detection limit, MiR‐133b, noncomplementary target, UV‐visible spectrum, hydrodynamic diameter, negative zeta potential, Au
1 Introduction
MicroRNAs are small (18–24 nucleotides) non‐coding RNAs that are able to inhibit the translation of mRNAs, using their complementary property with the target mRNA [1]. Nevertheless, expression levels of micro‐RNAs may be down‐regulated or up‐regulated and be causing cancers [1, 2] or other diseases, such as diabetes mellitus [3], injuries [4], and graft rejections [5, 6]. Therefore, they are being introduced as the novel biomarkers in the disease diagnosis, and also the novel targets for therapy [7]. Consequently, various methods were designed and performed for the detection of these types of biomarkers including microarray, TaqMan qRT‐PCR [8], Northern blot, and several novel methods based on amplification including loop‐mediated isothermal amplification (LAMP), and rolling cycle amplification (RCA) [9]. Microarray and TaqMan qRT‐PCR approaches are costly methods, notwithstanding their lower detection limit. Moreover, in Northern blot, the label is needed, that has made it very complex method [8, 9]. In LAMP and RCA methods, the probe designing is a complicated step. Also, another disadvantage of these methods is the requirement to multiple enzymes [9]. Consequently, simple, inexpensive, and label‐free detection methods are new topics in the detection of microRNAs. Gold nanoparticle (AuNP)‐based biosensing techniques are suitable subjects for this purpose.
Optical nano‐biosensors made by nanostructures do not need the label and can be causing a high‐throughput diagnosis [10]. Localised surface plasmon resonance (LSPR) is one of the unique property of nanoparticles that make them useful for biosensing [11]. LSPR is an optical phenomenon in that noble metal nanostructures can create sharp spectral absorption and scattering peaks [12]. Every metal nanostructures have LSPR property and can be used by LSPR‐based nanobiosensors. Silver and gold are used commonly [13, 14]. Despite this, the LSPR signals of AuNPs are stronger than silver nanoparticles [15]. Each gold particle (a quantum box) can trap free mobile electrons and create LSPR [16]. Consequently, the redshift of LSPR peak occurs, after the increase in the refractive index of AuNPs [13]. Several previous studies were performed based on the using the LSPR properties of AuNPs in colloidal biosensors, for detection of various chemicals and biologicals including DNA, small molecules, proteins, and ions such as Hg2+, Cu2+ [17, 18, 19].
MiR‐155 plays a critical role in the formation of cancers and other diseases [20]. The accurate detection of miR‐155 can help in the appropriate diagnosis of these diseases. In this study, we aimed to design and fabricate a biosensor based on the cross‐linking AuNPs aggregation for detection and quantification of miR‐155. Also, we intended to compare quantification power of this technique with SYBR Green real‐time polymerase chain reaction (PCR). Furthermore, we evaluated detection limit of the fabricated nano‐biosensor and verified it using some characterisation methods.
2 Materials and methods
2.1 Experimental design
In this research, we designed a model for the fabrication of a biosensor based on cross‐linking AuNPs aggregation. Therefore, we need two probes to be conjugated to AuNPs, separately. Fig. 1 shows a schematic design of this model. With this intention, thiolated capture probes, complementary with mir‐155, were designed and ordered for synthesis. Also, synthetic miR‐155, as the specific target, and synthetic miR‐133b, as a non‐specific target, were ordered. The sequences of all these oligonucleotides are shown in Table 1. All synthetic oligonucleotides were synthesised by the Bioneer company (Daejeon, Seoul, South Korea).
Fig. 1.
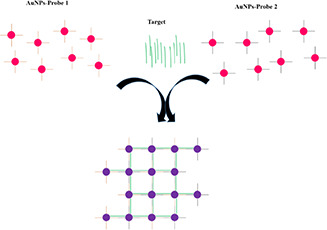
Schematic design of cross‐linking AuNPs aggregation. As observed, two probes with different sequences are conjugated to AuNPs, separately. AuNPs were shown with pink colour, and probes are shown with red and black lines. Then, with the addition of complementary sequences (in our research, miR‐155 that was shown with green colour in the figure) in a mixture of two AuNPs probe conjugates, they can make cross‐linkage between two types of AuNPs probes and cause the aggregation of AuNPs
Table 1.
Sequences of used oligonucleotides for the LSPR assays
| Name | Sequences (5′‐3′) | Modification |
|---|---|---|
| capture probe 1 | ACCCCTATCAC | 5′‐thiol |
| capture probe 2 | GATTAGCATTAA | 3′‐thiol |
| hsa‐miR‐155‐5p(specific target) | GCAGTTAATGCTAATCGTGATAGGG | — |
| hsa‐miR‐133b(non‐specific target) | GGTCCCCTTCAACCAGCTA | — |
hsa: Homo Sapience.
2.2 AuNPs synthesis and characterisation
AuNPs were synthesised based on our previous report using Turkevich method [21, 22]. Briefly, under vigorous stirring 100 ml of gold (III) chloride trihydrate (HAuCl4. 3H2 O, Merck, Germany) solution (0.25 mM) was boiled in a 250 ml round‐bottom flask equipped with a condenser. About 1 ml of 140 mM trisodium citrate (Na₃C₆H₅O₇, Merck, Germany) was injected in this solution. After 20 min, the solution was cooled down to room temperature.
Synthesised AuNPs were characterised by using ZEISS EM 1030 Transmission Electron Microscope, UV–visible Spectrophotometer Bioaquarius (CE7250, CECIL Co., UK), and Dynamic Light Scattering (DLS) (Scatter Scope 1, Korea) systems. The average size of synthesised AuNPs was calculated by DigitalMicrograph® and origin 9.1 software using five different transmission electron microscopy (TEM) micrographs and UV–visible spectrum. Also, to determine particles hydrodynamic size, DLS was performed in 25°C with these settings for Au nanoparticles: refractive index (0.1986), and absorption coefficient of 3.2279 cm−1.
2.3 Immobilising of thiolated capture probes to AuNPs
About 250 µl of each thiolated capture probe (100 µM) was added to 3 ml AuNPs (45 µg/ml), separately. The solution incubated at 50°C for 24 h. Later, SDS and Tris‐HCl (pH: 7.4) were added to reach 0.1% SDS and 10 Mm Tris‐HCl in final concentration. After 1 h incubation at room temperature, NaCl was added to the solution gradually in 48 h until to achieve 0.7 M concentration [23]. Subsequently, to remove unattached oligonucleotides, AuNPs probes were centrifuged twice at 14,000 RPM for 30 min. The supernatant was discarded and then sediment was redispersed into dilution buffer (SDS 0.1% and Tris‐HCl 10 Mm, pH: 7.4, NaCl 0.7 M). Then, the equal amounts of two AuNPs probe conjugates were combined together.
To characterise and to determine changes in the size and surface charge following the addition of probes to AuNPs, DLS (Scatter Scope 1, Korea), and Zetasizer (Malvern ZEN3600) systems were used.
2.4 Biosensing assays
Synthetic mir‐155 was diluted in ultrapure water, and its serial dilutions were made including: M (100 µM), M (10 µM), M (1 µM), M (100 nM), M (10 nM), M (1 nM), M (100 pM). Also, a high concentration of miR‐133b (100 µM) was prepared. Subsequently, 20 µl of these dilutions were added in 250 µl of prepared AuNPs probes, respectively, and separately, in 0.5 ml tubes. Then, they incubated on thermal conditions, 5 min at 80°C, and 5 min at 50°C, in an Applied Biosystems™ Veriti 96 Well thermal cycler system. Samples were placed in 300 µl quartz cuvette sand UV–visible spectra from 350–800 nm wavelengths were taken by UV–visible spectrophotometer Bioaquarius (CE7250, CECIL Co., UK). This process was repeated three times for each sample.
2.5 Real‐time quantitative reverse transcriptase PCR
2.5.1 Polyadenylation of miRNAs
3′‐end polyadenylation of miR‐155 was performed using E. coli Poly(A) Polymerase (New England BioLabs, Ipswich, Massachusetts, USA. Cat. No: M0276S). Each polyadenylation reaction consisted of 10 µl miR‐155 [with seven prepared concentrations (100 pM–100 µM), separately], 2 µl 10X buffer, 1 µl 1 mM ATP, and 0.5 µl (5000 units/ml) poly‐A polymerase in ultimate volume of 20 µl. The incubations were performed for 1 h at 37°C for the activation of enzyme, and then 20 min at 65°C for enzyme inactivation in an Applied Biosystems™ Veriti 96 Well thermal cycler system.
2.5.2 Primers
First strand of cDNA was synthesised using poly‐T adaptor cDNA synthesis primer, as is described by Shi et al. [24]. RT primer for cDNA synthesis and universal poly(T) adaptor reverse primer were obtained from this article [24]. Forward primer was designed according to the Shi et al. and Busk et al. protocol [24, 25]. All the primers were requested to be synthesised by the Bioneer company (Daejeon, Republic of Korea). The sequences of all primers are shown in Table 2.
Table 2.
Sequences of primers for real‐time PCR
| Name | Sequences | T m |
|---|---|---|
| poly T adaptor primer | GCGAGCACAGAATTAATACGACTCACTATAGG(T)12VNa | — |
| universal reverse primer | GCGAGCACAGAATTAATACGAC | 57.90°C |
| forward primer | GCAGTTAATGCTAATCGTGATAGGG | 59.88°C |
a V = G, C, A; N = G, A, C, T.
2.5.3 CDNA synthesis
First strand of cDNAs was synthesised with GeneAll HyperScript TM Reverse Transcriptase (Pd. No: 3033528). Each reverse transcription reaction contained 10 µl of polyadenylation reaction, 3 µl of RT primer (10 µM), and 3 µl of 10X buffer. This mixture was first incubated at 65°C for 5 min, and then at least a min in ice. Subsequently, 1 µl RNase inhibitor (40 U/µl), 1 µl of 0.1 mM DTT, 1 µl of 10 mM dNTP mix, and 1 µl HyperScript reverse transcriptase enzyme (200 U/µl) were added to reach the final volume (20 µl). Incubation was then performed at 40°C for 1 h in the thermal cycler.
2.5.4 Real‐time PCR
For the amplification of cDNAs, Corbett Rotor‐Gene 3000 system was used. The reaction mixture included: 2 µl of cDNA synthesised in previous stage, 1 µl of 5 µM concentration of forward and revers primers (0.5 µM), and 10 µl of 2X Amplicon SYBR green real‐time PCR master mix (Catalog Number: 4309155) in final volume of 20 µl.
Optimized thermal conditions for PCR reactions were 95°C for 15 min (activation of Taq DNA polymerase), 40 cycles for 15 s at 95°C, 30 s at 60°C, and 30 s at 72°C, and then a thermal denaturation at 65–95°C for drawing the melting curve. The CT values of all concentrations were used to plot calibration curve. The CT values >35 were removed from analysis.
2.6 Statistical analysis
Statistical analysis was done by SPSS® version 21 computer software. One‐way analysis of variance (ANOVA) was employed for the comparison of mean changes in hydrodynamic size, and surface charge (zeta potential) of AuNPs before and after the addition of probes, and also after the addition of miR‐155. Data were shown as mean ± standard deviation. All p ‐values <0.05 were considered statistically significant.
All graphs were analysed or drawn by DigitalMicrograph®, GraphPad Prism 6.0, and Origin 9.1 computer software.
3 Results and discussion
3.1 AuNPs characterisation
TEM micrographs showed 18.7 ± 3.6 nm size average for synthesised AuNPs. Fig. 2 a shows the TEM micrographs of AuNPs. The size distribution of AuNPs is shown in Fig. 2 b. As observed, the size distribution of AuNPs was narrow. UV–visible (350–800 nm) spectrum of AuNPs showed a peak at 521 nm (Fig. 2 a). The size of the AuNPs was estimated by UV–visible spectrum using the Haiss et al. approach [26]. The calculated size using this approach was 15 nm. TEM is more reliable than UV–visible spectroscopy for the size estimation of nanoparticles. Therefore, we had 18.7 ± 3.6 nm AuNPs.
Fig. 2.
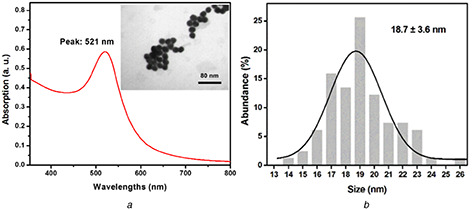
TEM micrographs of AuNPs and particles size distribution
(a) UV–visible spectrum and TEM micrograph of synthesised AuNPs, (b) Particles size distribution
3.2 MiR‐155 could shift the LSPR peak
The spectra in Fig. 3 were obtained using the biosensing assays at a time. The change in the λm of the UV–visible spectrum to higher wavenumber (redshift) was caused by the ssDNA probes attachment to AuNPs. As observed in Fig. 3, the λm of AuNPs in 521 nm (number 1 in Fig. 3) changed to 524 nm (one of five spectra with number 2 in Fig. 3) after the probes immobilisation.
Fig. 3.
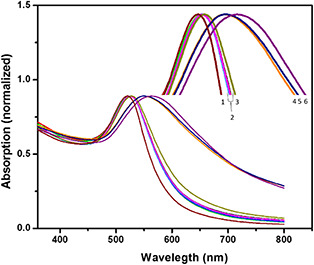
UV–visible spectra of miR‐155 biosensing assays. As observed in maximised picture, there are several spectra consisting of 1. AuNPs, 2. AuNPs probes, AuNPs probes miR133 – 100 µM, AuNPs probes miR155–100 pM, AuNPs probes miR155–1 nM, and AuNPs probes miR155 – 10 nM, 3. AuNPs probes miR155–100 nM, 4. AuNPs probes miR155–1 µM, 5. AuNPs probes miR155 – 10 µM, 6. AuNP probes miR155 – 100 µM
Also, with the addition of different concentrations of miR‐155 to AuNPs probes, the peak of the UV–visible spectra of AuNPs probes shifted to upper wavelength. As observed in Fig. 3, by the addition of 100 µM concentration of mir‐155, the peak shifted from 524 to 563 (Fig. 3, number 6). The λm (524 nm) shifted to 55, 547.5, and 527.5 nm after the addition of 10 µM, 1 µM, and 100 nM of miR‐155, respectively (Fig. 3, numbers 5, 4, and 3, respectively). Also, 10 nM of miR‐155 could shift the λm to 525.5 nm. This spectrum was shown with number 2 in Fig. 3 in the overlapped form approximately with the other spectra. The lower concentrations of miR‐155 (1 nM, and 100 pM) could not change the λm (Fig. 3, number 2). In addition, miR‐133b as a non‐target sequence did not change the absorption peak of 524 nm (Fig. 3, number 2).
3.3 Plotting the calibration curves
The difference between the λm after the addition of miR‐155 (AuNPs probes mir155) and λm before the addition of miR‐155 (AuNPs probes) could be a criterion to plot the calibration curve of miR‐155 detection using this fabricated biosensor. Results showed that the mean difference between λ max (ΔLSPR) of AuNPs probes had a relationship with the miR‐155 concentrations (10 nM–100 µM). A calibration curve was plotted with R ‐square value of 0.95217 (Fig. 4 a).
Fig. 4.
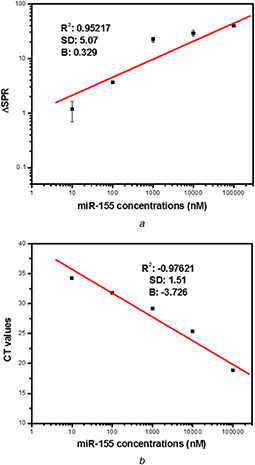
Calibration curves of miR‐155 detection using
(a) LSPR method, (b) qRT‐PCR method
We observed a calibration curve that plotted by five concentrations of synthetic miR‐155 (10 nM–100 µM). The R ‐square value of LSPR calibration curve (0.95217) indicates the strong direct relationship between miR‐155 concentrations and ΔSPRs. Also, the R ‐square value of real‐time PCR calibration curve (0.97621) indicates a strong inverse relationship between miR‐155 concentrations and CT values
Also, five concentrations of mir‐155 (10 nM–100 µM) could be detected using real‐time PCR at CT point before 35 cycles. Two other concentrations (1 nM and 100 pM) had no CT point before 35 cycles. Consequently, a calibration curve was plotted using five points (R ‐square value of 0.97621) such as LSPR‐based calibration curve (Fig. 4 b).
According to the results, the detection limit of fabricated biosensor based on AuNPs aggregation is similar to the real‐time PCR method. In many previous studies, AuNPs aggregation method was used for nucleic acids detection with another helping methods including PCR [27, 28], LAMP [27], and hybridisation chain reaction amplification [29]. In these methods, because of utilisation of additional techniques that increased the complexity of the system, the detection limit was better than our study. However, in our study, we used the gold nanoparticles aggregation method without any label, enzyme, plus additional method. These features have simplified our technique. Furthermore, SYBR green real‐time PCR technique was used as an inexpensive method in comparison with TaqMan probes [30, 31] and LNA primers [32, 33] methods, in our research. So, we compared the LSPR‐based biosensor with a more routine, simpler, and cheaper method than other real‐time PCR methods. Also, in many previous studies based on LSPR property of AuNPs, AuNPs were immobilised on a glass chip. This method has advantages towards our method including the higher detection limit. However, a complicated step (immobilising the Au NPs to chip) has been added to the method and makes it harder. A non‐cross‐linking AuNPs aggregation method had been employed by Baptista et al. in 2011 [34]. They detected RNAs with 0.2 µM (or 200 nM) limit of detection for an RNA, and for another RNA with 50 nM detection limit. The detection limit of our study was lower than their research detection limit. Furthermore, in our study, a microRNA, that its detection is harder than the detection of longer RNAs, was investigated.
3.4 Verify the function of biosensor
Hydrodynamic diameter and zeta potential were changed after immobilising the probes and also after the addition of target to AuNPs probes. The average diameter of AuNPs based on the DLS was 33.9 ± 4.3 nm. After the immobilisation of ssDNA as probe 1, and probe 2 to AuNPs, hydrodynamic diameter was changed to 58.3 ± 3.04, and 168.3 ± 54 for AuNPs probe 1, and AuNPs probe 2, respectively. The significant increase in DLS‐based average size was seen (4000 ± 269), with the addition of miR‐155 as the specific target. These changes were displayed by a point graph in Fig. 5 a.
Fig. 5.
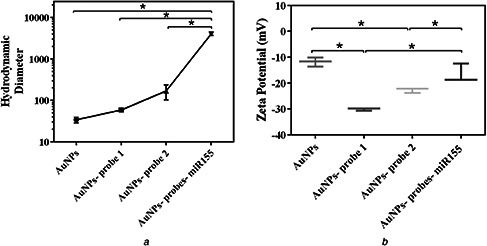
Hydrodynamic size and surface charge of AuNPs
(a) Hydrodynamic size, (b) Surface charge of AuNPs after the addition of probes and miR‐155
*p <0.05
AuNPs had negative zeta potential (−11.83 mV). One‐way ANOVA analysis showed that the mean negative zeta potential of AuNPs significantly increased to −30.13 and −22.70 mV, respectively, after immobilising the probe 1, and probe 2 (p <0.05). Also, the negative charge of AuNPs probes after the addition of 100 µM concentration of miR‐155 back changed to lower negative charge (−16 mv). These changes were significant statistically (Fig. 5 b).
As observed, the measured diameter of AuNPs by TEM image was 18.7 ± 3.6, in the event the measured diameter by DLS was 33.9 ± 4.3. Commonly, the hydrodynamic size based DLS is higher than macroscopic techniques size determination. Also, the hydrodynamic diameter of particles is affected by all substances adsorbed on the surface of the nanoparticles. DLS results showed the increase in the hydrodynamic size of Au NPs after addition of probes, and also after addition of miR‐155. As demonstrated in other previous studies [35, 36] DNA attachment could increase the hydrodynamic diameter of AuNPs. After the addition of miR‐155, AuNPs aggregation occurred and then very significant increase in hydrodynamic diameter of AuNPs is quite acceptable. The negative zeta potential of AuNPs increased after the immobilisation of probes that indicates the attachment of ssDNA to AuNPs surface. Phosphates in ssDNA backbone had caused the more negative surface charge. The increase in the negative surface charge could lead to repulsion interaction of AuNPs and increased stability. However, after the addition of complementary target (miR‐155) and formation of RNA–DNA hybrid, the AuNPs aggregation was performed and consequently, zeta potential amount converted to the less negative amount.
3.5 Colorimetric detection
MiR‐155 as the target of immobilised probes to AuNPs could change the colour of AuNPs. Colorimetric changes (red to purple) were observed, after the addition of three different concentrations (1, 10, and 100 µM) of miR‐155 (Fig. 6 a). In contrast, colour did not change with the addition of other concentrations (100 pM–100 nM) of miR‐155 and a high selected concentration of miR‐133b as a non‐specific target (Figs. 6 b, and c). As observed in Fig. 6, we were able to realise colour changes with the addition of three high concentrations of the target (miR‐155) in nano‐biosensor solution.
Fig. 6.
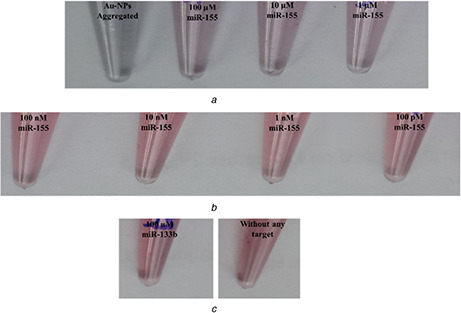
Colorimetric detection of miR‐155
(a) High concentrations of miR‐155 could cause to change the colour of AuNPs probes solution, (b) Lower concentrations (100 nM–100 µM) of miR‐155, (c) miR‐133 and water (without any target), could not cause to change the colour of AuNPs probes solution
We found that miR‐155 concentrations ≥1 µM are detectable by this fabricated biosensor. In the previous study, Sato et al. [37] had detected one concentration of target (DNA) using the non‐cross‐linking aggregation method, however, in this research, we investigated various concentrations of miR‐155. Sato et al. had investigated the mispair mutation in DNA. However, we investigated only the comparison of two miRNA (miR‐155 versus miR‐133b), by this method. Until now, the colorimetric detection of microRNAs using AuNPs aggregation method was not reported.
4 Conclusions
In this study, an optical biosensing method based on AuNPs aggregation was investigated, for the detection of miR‐155. Colorimetric changes were studied, and the calibration curve was drawn using UV–visible spectra of AuNPs probes (ΔSPR) after the addition of serial dilutions of synthetic miR‐155. Furthermore, LSPR biosensing method was compared to the real‐time PCR method. Results showed the detection limit of 10 nM for this biosensor that was approximately similar to the detection limit of real‐time PCR. Also, eye detection, using the colour, showed the weaker detection limit (1 µM). MiR‐133b as the non‐complementary target could not cause a change in both colour and UV–visible spectrum.
The small size of the target (mir‐155) is a limitation in detection with high sensitivity. Until now, the detection of microRNAs was not performed using the biosensors based on AuNPs aggregation. Many methods based on nanoparticles were established for highly sensitive detection of microRNAs in the fM range. To solve the limitation of small size in detection of microRNAs, in all of these methods, a linker was ligated to microRNAs and increased the length [38, 39, 40, 41]. Therefore, AuNP aggregation method was converted to the more complex and difficult system, with the additional enzymatic step. Our fabricated biosensor detected miR‐155 in one step and was simpler than those methods. We hope this research can help in the detection of microRNAs for cancer diagnosis. In future, we will continue to increase the detection limit of our method.
5 Acknowledgment
This research was supported by Tehran University of Medical Sciences. The authors thank all the experts of research laboratory of Tehran University of Medical Sciences who helped them to advance this research.
6 References
- 1. Esteller M.: ‘Non‐coding RNAs in human disease’, Nat. Rev. Genet., 2011, 12, (12), pp. 861 –874 [DOI] [PubMed] [Google Scholar]
- 2. Mitchell P.S. Parkin R.K. Kroh E.M. et al.: ‘Circulating microRNAs as stable blood‐based markers for cancer detection’, Proc. Natl. Acad. Sci. USA, 2008, 105, (30), pp. 10513 –10518 [DOI] [PMC free article] [PubMed] [Google Scholar]
- 3. Guay C. Regazzi R.: ‘Circulating microRNAs as novel biomarkers for diabetes mellitus’, Nat. Rev. Endocrinol, 2013, 9, (9), pp. 513 –521 [DOI] [PubMed] [Google Scholar]
- 4. Wang K. Zhang S. Marzolf B. et al.: ‘Circulating microRNAs, potential biomarkers for drug‐induced liver injury’, Proc. Natl. Acad. Sci. USA, 2009, 106, (11), pp. 4402 –4407 [DOI] [PMC free article] [PubMed] [Google Scholar]
- 5. Van Huyen J.P.D. Tible M. Gay A. et al.: ‘MicroRNAs as non‐invasive biomarkers of heart transplant rejection’, Eur. Heart. J, 2014, 35, (45), pp. 3194 –3202 [DOI] [PubMed] [Google Scholar]
- 6. Han Z.‐B. Zhong L. Teng M.‐J. et al.: ‘Identification of recurrence‐related microRNAs in hepatocellular carcinoma following liver transplantation’, Mol. Oncol, 2012, 6, (4), pp. 445 –457 [DOI] [PMC free article] [PubMed] [Google Scholar]
- 7. Kasinski A.L. Slack F.J.: ‘MicroRNAs en route to the clinic: progress in validating and targeting microRNAs for cancer therapy’, Nat. Rev. Cancer, 2011, 11, (12), pp. 849 –864 [DOI] [PMC free article] [PubMed] [Google Scholar]
- 8. Chen Y. Gelfond J.A. McManus L.M. et al.: ‘Reproducibility of quantitative RT‐PCR array in miRNA expression profiling and comparison with microarray analysis’, BMC genomics, 2009, 10, (1), p. 407 [DOI] [PMC free article] [PubMed] [Google Scholar]
- 9. Tian T. Wang J. Zhou X.: ‘A review: microRNA detection methods’, Org. Biomol. Chem, 2015, 13, (8), pp. 2226 –2238 [DOI] [PubMed] [Google Scholar]
- 10. Sepúlveda B. Angelomé P.C. Lechuga L.M. et al.: ‘LSPR‐based nanobiosensors’, Nano Today, 2009, 4, (3), pp. 244 –251 [Google Scholar]
- 11. Howes P.D. Chandrawati R. Stevens M.M.: ‘Colloidal nanoparticles as advanced biological sensors’, Science, 2014, 346, (6205), p. 1247390 [DOI] [PubMed] [Google Scholar]
- 12. Mayer K.M. Hafner J.H.: ‘Localized surface plasmon resonance sensors’, Chem. Rev, 2011, 111, (6), pp. 3828 –3857 [DOI] [PubMed] [Google Scholar]
- 13. Anker J.N. Hall W.P. Lyandres O. et al.: ‘Biosensing with plasmonic nanosensors’, Nat. Mater, 2008, 7, (6), pp. 442 –453 [DOI] [PubMed] [Google Scholar]
- 14. Chan G.H. Zhao J. Hicks E.M. et al.: ‘Plasmonic properties of copper nanoparticles fabricated by nanosphere lithography’, Nano. Lett, 2007, 7, (7), pp. 1947 –1952 [Google Scholar]
- 15. Chan G.H. Zhao J. Schatz G.C. et al.: ‘Localized surface plasmon resonance spectroscopy of triangular aluminum nanoparticles’, J. Phys. Chem. A, 2008, 112, (36), p. 13958 [Google Scholar]
- 16. Li N. Zhao P. Astruc D.: ‘Anisotropic gold nanoparticles: synthesis, properties, applications, and toxicity’, Angew. Chem. Int. Ed, 2014, 53, (7), pp. 1756 –1789 [DOI] [PubMed] [Google Scholar]
- 17. Xu X. Daniel W.L. Wei W. et al.: ‘Colorimetric Cu2 + detection using DNA‐modified gold‐nanoparticle aggregates as probes and click chemistry’, Small, 2010, 6, (5), pp. 623 –626 [DOI] [PMC free article] [PubMed] [Google Scholar]
- 18. Xia F. Zuo X. Yang R. et al.: ‘Colorimetric detection of DNA, small molecules, proteins, and ions using unmodified gold nanoparticles and conjugated polyelectrolytes’, Proc. Natl. Acad. Sci. USA, 2010, 107, (24), pp. 10837 –10841 [DOI] [PMC free article] [PubMed] [Google Scholar]
- 19. Lee J.S. Han M.S. Mirkin C.A.: ‘Colorimetric detection of mercuric ion (Hg2 + ) in aqueous media using DNA‐functionalized gold nanoparticles’, Angew. Chem. Int. Ed, 2007, 46, (22), pp. 4093 –4096 [DOI] [PubMed] [Google Scholar]
- 20. Tili E. Michaille J.‐J. Wernicke D. et al.: ‘Mutator activity induced by microRNA‐155 (miR‐155) links inflammation and cancer’, Proc. Natl. Acad. Sci. USA, 2011, 108, (12), pp. 4908 –4913 [DOI] [PMC free article] [PubMed] [Google Scholar]
- 21. Emami T. Madani R. Golchinfar F et al.: ‘Comparison of gold nanoparticle conjugated secondary antibody with non‐gold secondary antibody in an ELISA Kit model’, Monoclon. Antib. Immunodiagn. Immunother, 2015, 34, (5), pp. 366 –370 [DOI] [PubMed] [Google Scholar]
- 22. Kimling J. Maier M. Okenve B. et al.: ‘Turkevich method for gold nanoparticle synthesis revisited’, J. Phys. Chem. B, 2006, 110, (32), pp. 15700 –15707 [DOI] [PubMed] [Google Scholar]
- 23. Cordray M.S. Amdahl M. Richards‐Kortum R.R.: ‘Gold nanoparticle aggregation for quantification of oligonucleotides: optimization and increased dynamic range’, Anal. Biochem, 2012, 431, (2), pp. 99 –105 [DOI] [PMC free article] [PubMed] [Google Scholar]
- 24. Shi R. Sun Y.‐H. Zhang X.‐H. et al.: ‘Poly (T) adaptor RT‐PCR’. Next‐Generation MicroRNA Expression Profiling Technology: Methods and Protocols, 2012, pp. 53 –66 [DOI] [PubMed]
- 25. Busk P.K.: ‘A tool for design of primers for microRNA‐specific quantitative RT‐qPCR’, BMC bioinformatics, 2014, 15, (1), p. 29 [DOI] [PMC free article] [PubMed] [Google Scholar]
- 26. Haiss W. Thanh N.T. Aveyard J. et al.: ‘Determination of size and concentration of gold nanoparticles from UV − Vis spectra’, Anal. Chem, 2007, 79, (11), pp. 4215 –4221 [DOI] [PubMed] [Google Scholar]
- 27. Muangchuen A. Chaumpluk P. Suriyasomboon A. et al.: ‘Colorimetric detection of ehrlichia canis via nucleic acid hybridization in gold nano‐colloids’, Sensors, 2014, 14, (8), pp. 14472 –14487 [DOI] [PMC free article] [PubMed] [Google Scholar]
- 28. Cai M. Li F. Zhang Y. et al.: ‘One‐pot polymerase chain reaction with gold nanoparticles for rapid and ultrasensitive DNA detection’, Nano. Res, 2010, 3, (8), pp. 557 –563 [Google Scholar]
- 29. Liu P. Yang X. Sun S. et al.: ‘Enzyme‐free colorimetric detection of DNA by using gold nanoparticles and hybridization chain reaction amplification’, Anal. Chem, 2013, 85, (16), pp. 7689 –7695 [DOI] [PubMed] [Google Scholar]
- 30. Schmittgen T.D. Lee E.J. Jiang J. et al.: ‘Real‐time PCR quantification of precursor and mature microRNA’, Methods, 2008, 44, (1), pp. 31 –38 [DOI] [PMC free article] [PubMed] [Google Scholar]
- 31. Varkonyi‐Gasic E. Wu R. Wood M. et al.: ‘Protocol: a highly sensitive RT‐PCR method for detection and quantification of microRNAs’, Plant Methods, 2007, 3, (1), p. 12 [DOI] [PMC free article] [PubMed] [Google Scholar]
- 32. Andreasen D. Fog J.U. Biggs W. et al.: ‘Improved microRNA quantification in total RNA from clinical samples’, Methods, 2010, 50, (4), pp. S6 –S9 [DOI] [PubMed] [Google Scholar]
- 33. Balcells I. Cirera S. Busk P.K.: ‘Specific and sensitive quantitative RT‐PCR of miRNAs with DNA primers’, BMC biotechnology, 2011, 11, (1), p. 70 [DOI] [PMC free article] [PubMed] [Google Scholar]
- 34. Baptista P.V. Doria G. Conde J.: ‘Alloy metal nanoparticles for multicolor cancer diagnostics’, SPIE BiOS, 2011, 7909, pp. 79090K1 –79090K10 [Google Scholar]
- 35. Zimbone M. Baeri P. Calcagno L. et al.: ‘Dynamic light scattering on bioconjugated laser generated gold nanoparticles’, PloS One, 2014, 9, (3), p. e89048 [DOI] [PMC free article] [PubMed] [Google Scholar]
- 36. Dai Q. Liu X. Coutts J. et al.: ‘A one‐step highly sensitive method for DNA detection using dynamic light scattering’, J. Am. Chem. Soc, 2008, 130, (26), pp. 8138 –8139 [DOI] [PubMed] [Google Scholar]
- 37. Sato K. Hosokawa K. Maeda M.: ‘Rapid aggregation of gold nanoparticles induced by non‐cross‐linking DNA hybridization’, J. Am. Chem. Soc, 2003, 125, (27), pp. 8102 –8103 [DOI] [PubMed] [Google Scholar]
- 38. Fan Y. Chen X. Trigg A.D. et al.: ‘Detection of microRNAs using target‐guided formation of conducting polymer nanowires in nanogaps’, J. Am. Chem. Soc, 2007, 129, (17), pp. 5437 –5443 [DOI] [PubMed] [Google Scholar]
- 39. Li J. Schachermeyer S. Wang Y. et al.: ‘Detection of microRNA by fluorescence amplification based on cation‐exchange in nanocrystals’, Anal. Chem, 2009, 81, (23), pp. 9723 –9729 [DOI] [PubMed] [Google Scholar]
- 40. Alhasan A.H. Kim D.Y. Daniel W.L. et al.: ‘Scanometric microRNA array profiling of prostate cancer markers using spherical nucleic acid–gold nanoparticle conjugates’, Anal. Chem, 2012, 84, (9), pp. 4153 –4160 [DOI] [PMC free article] [PubMed] [Google Scholar]
- 41. Elbehery A.H. Azzazy H.M.: ‘Nanoparticle‐based detection of cancer‐associated RNA’, Wiley. Interdiscip. Rev. Nanomed. Nanobiotechnol, 2014, 6, (4), pp. 384 –397 [DOI] [PubMed] [Google Scholar]


