Abstract
The forefront horizon of biomedical investigations in recent decades is parcelling‐up and delivery of drugs to achieve controlled/targeted release. In this regard, developing green‐based delivery systems for a spatiotemporal controlling therapeutic agent have drawn a lot of attention. A facile route based on cyclic carbonate ring‐opening reaction has been utilised to synthesise a bio‐based polyol‐containing urethane bond [polyol‐urethane (POU)] as a nanoparticulate drug delivery system of olanzapine in order to enhance its bioavailability. After characterisation, the nanoparticles were also estimated for in vitro release, toxicity, and pharmacokinetic studies. As olanzapine has shown poor bioavailability and permeability in the brain, the sustained release of olanzapine from the designed carriers could enhance pharmacokinetic effectiveness. POU in the aqueous solution formed micelles with a hydrophobic core and embedded olanzapine under the influence of its hydrophobic nature. Drug release from the nanoparticles (90 ± 0.43 nm in diameter) indicated a specific pattern with initial burst release, and then a sustained release behaviour (82 ± 3% after 168 h), by the Higuchi‐based release mechanism. Pharmacokinetics assessments of POU‐olanzapine nanoparticles were carried in male Wistar rats through intravenous administration. The obtained results paved a way to introduce the POU as an efficient platform to enhance the bioavailability of olanzapine in therapeutic methods.
Inspec keywords: hydrophobicity, nanomedicine, nanofabrication, nanoparticles, drug delivery systems, biomedical materials, polymers, brain
Other keywords: cyclic carbonate ring‐opening reaction, nanoparticulate drug delivery system, bioavailability, drug release, initial burst release, Higuchi‐based release mechanism, POU‐olanzapine nanoparticles, sunflower oil‐based polyol‐urethane nanoparticles, forefront horizon, biomedical investigations, green‐based delivery systems, spatiotemporal controlling therapeutic agent, bio‐based polyol‐containing urethane bond, polyol‐urethane, toxicity, pharmacokinetic studies, olanzapine, aqueous solution, micelles, hydrophobic core, Pharmacokinetics, male Wistar rats, brain
1 Introduction
Architecting polymers have possessed the key role in pharmacy which novel platforms can enhance the efficacy of therapeutic agent and reduce the toxicity. Polymeric platforms have tailorable properties which can cover the vast expectation, which has caused hierarchical progress in drug delivery system as a spatiotemporal release platform in a passive and stimulated pattern [1, 2, 3]. In the drug delivery system, the drug‐to‐carrier ratio should be considered precisely because the drug exhibits the therapeutic effect and may be the high dose of carrier resulted in toxicity. Polymeric carriers have been prepared from monomeric sequences in which monomer sources can be natural or chemical. Chemical compounds exhibit higher toxicity and hazardous effect in comparison with natural‐based compounds. Green‐based polymers such as non‐toxic compounds can reduce the toxicity and enhance efficiency [4, 5, 6].
Currently, numerous natural and synthetic polymers are prone to degradation by either hydrolytic or enzymatic mechanism have been synthesised. Among the myriad renewable resources used in polymer industry, vegetable oils are applied in polymer synthesis including polyesters, polyurethanes (PUs), softening agents, polymeric implants as well as tissue engineering scaffolds [7, 8, 9]. Vegetable oils are potential resources for the synthesis of polyols used in polyurethane synthesis because they are inexpensive, readily available, and renewable [10, 11, 12]. The ester linkages in the chemical structure of vegetable oils make them capable of hydrolysing to small parts in physiological condition. In the design of different drug delivery systems, development of sustained‐release formulations is of high importance; nevertheless, various defects attributed to sustained delivery systems consisted of high initial bursts release following minimal release and low entrapment efficiency should be solved [13]. In addition, the polymers used in the design of intelligent drug delivery systems should not produce any toxic compound after metabolisation [14, 15, 16]; therefore, in order to address this goal, applying natural materials such as vegetable oils instead of petroleum‐based materials in drug delivery systems are necessitated [17].
PUs are one of the unique polymers applied in drug delivery systems, medicinal sciences and are made from various biocompatible and biodegradable polyols in the presence of diversified diisocyanates via step‐growth polymerisation. The excellent mechanical properties and biocompatibility of some types of PUs, which are both due to ester and urethane bonds provided an opportunity for scientists to apply them in biomedical devices such as blood pumps, valves etc. [18, 19]. The biodegradation of PUs is crucial for the diffusion of therapeutic agents and eliminates any necessity for removing PUs remaining from the body after degradation. The drug release from biodegradable PUs relies mainly on the swollen process. It has been reported that the polyurethane family can be prepared with various properties in which its properties can be tuned with the desired aim [20, 21].
In this regard, flexible chemistry of polyurethane endows various features, which drug vehicle can be equipped by different properties such as pH, temperature, and electrical sensitivity. Currently, the developments of colloidal delivery systems including micelles, nanoparticles (NPs) that can easily self‐assemble from biodegradable polymers have grabbed the attention of scientists. It has been reported that the low‐critical micelle concentration (CMC) value leads to micelle stability against dilutions [22, 23], and the particle shape has a profound effect on drug release. The most fascinating release, zero‐order release, was achieved with the spherical shape [24, 25]. Although miscellaneous polyols were used in the synthesis of PUs, polyols as carriers are in the initial path for applying in drug delivery. In our previous study, vegetable oil‐based polyol was applied in drug delivery system for the first time and led to sustained release of raloxifene‐hydrochloride [8]. Olanzapine (OZ) 2‐methyl‐4‐(4‐methyl‐1‐piperazinyl)‐10H‐thieno (Fig. 1) is a typical antipsychotic drug, which replaced the traditional medicinal treatments of schizophrenia [26]. Schizophrenia is a severe long‐term mental health disorder, which is recognised by the failure to recognise reality [27]. Although the oral route is a more convenient method for drug administration, OZ is now available as either tablets or vials for injection. Owing to the poor bioavailability, low permeability into the brain, various side effects such as dyslipidemia, obesity or diabetes, the clinical application of the drug is limited and brain delivery of OZ possess a big challenge [28]. With these considerations and in order to cope with the mentioned defects, sustained release of OZ would be beneficial to improve drug utilisation. In addition, appropriate carriers as NPs encapsulate drugs and overcome the nasal mucosal barrier by protecting the encapsulated drug from chemical degradation. OZ embedding in NP enhances its bioavailability and reduces the administered drug because of controlled release which can decline the side effects. OZ is antagonist for dopamine D1–4, 5‐HT2, muscarinic cholinergic, α‐1 receptors [29].
Fig. 1.
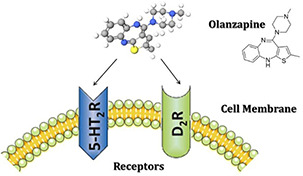
OZ chemical structure and its mechanism of action
It has been reported that poly(lactic acid)–poly(glycolic acid) copolymer exhibited proper biodegradability, biocompatibility, and non‐toxic nature as an OZ delivery vehicle [30]. It is hypothesised that NPs based on poly(lactic‐co‐glycolic acid) and solid lipid NPs for OZ delivery would provide brain targeting and sustained release of OZ within the brain. This benefit would help to improve its clinical utility, decrease the dose and frequency of dosing, reduce side effects and improve therapeutic efficacy [30, 31].
The main advantage of this study was the fact that we synthesised an amphiphilic polyol and at the same time endow urethane bonds to synthesised polyol. Furthermore, the synthesised polyol‐urethane (POU) had urethane bonds without applying toxic molecules containing isocyanates and was prepared to apply cyclocarbonate and amines. Thanks to low CMC, spherical NPs in the presence of OZ and high barrier permeability, POUs are able to offer improved biodistribution for therapeutic agents, and consequently minimise untoward side effects via preferential accumulation at the target site [32, 33].
2 Materials and methods
2.1 Materials
Sunflower oil (SFO) was purchased from Oila Company. Formic acid, methanol, propargyl alcohol, hydrogen peroxide (H2 O2, 35%, w/v), anhydrous magnesium sulphate (MgSO4), potassium hydroxide (KOH), and acetic anhydride were purchased from Merck Chemical Co., Germany. Dulbecco's modified Eagle's medium (DMEM), 2‐mercaptoethanol, boron trifluoride diethyl etherate (BF3 ·O(C2 H5)2), and foetal bovine serum (FBS) were purchased from Gibco, Carlsbad, USA (Part of Invitrogen). 96 well plates were purchased from Corning, USA. The cytotoxicity was measured on the NIH/3T3 cell line using 3‐(4,5‐dimethylthiazol‐2‐Yl)‐2,5‐diphenyltetrazolium bromide (MTT) purchased from Promega, USA. All of the solvents were distilled before their utilisation for chemical synthesis. OZ was purchased from Sigma‐Aldrich Company and used as supplied. All the solvents and chemicals used for the analytical methods purchased from Merck Chemical Co., Germany.
2.2 Characterisation
2.2.1 Hydrogen‐1 nuclear magnetic resonance (1 HNMR)
The 1 HNMR spectra of all the prepared samples were recorded in CDCl3 using 1 HNMR Bruker Avance, Germany, 300‐MHz operating at 300.13 MHz [34].
2.2.2 Fourier transform infrared (FTIR) spectroscopy
A Shimadzu 470 spectrometer equipped with a deuterated triglycine sulphate detector was applied for FTIR analysis. The tablets from potassium bromide (KBr) were made for FTIR analysis and 32 scans were coded with a resolution of 4 cm−1 in the spectral region of 400–4000 cm−1 [35].
2.2.3 Thermogravimetric analysis (TGA)
TGA of POU was performed on a TGA Instrument STA 503 (BAHR Thermoanalyse). POU was heated from room temperature to 350°C at a heating rate of 20°C/ min in the air [36].
2.2.4 X‐ray diffraction (XRD)
A waxy sample of POU was loaded into an aluminium sample holder. In order to improve particles’ statistics and diminish orientation effects, the holder was rotated during data collection with 1 s/step in the 0–80 2θ range on a STOE STADI P θ /θ diffractometer (Germany), which was equipped with a scintillation detector, a secondary monochromator, Cu‐Kα1 radiation 1.5406 Å. Generator settings were 40 kV and 40 mA. Slits were divergence slits of 1.0 mm, anti‐scatter slits of 1.0 mm and receiving slits of 0.2 mm [37].
2.2.5 Dynamic light scattering (DLS)
DLS (Brookhaven Instruments Corp., USA) was performed applying a Nano‐ZS ZEN3600 device using a 633 nm red laser (at 90° angle).
2.2.6 Scanning electron microscopy (SEM)
The surface morphology of NPs was imaged using a Philips CM‐30 with accelerating voltages of 150 and 250 kV instrument by drop casting the sample on a Formvar‐coated copper grid [38].
2.2.7 Ultraviolet–visible (UV–Vis) spectrometer
The single beam conventional UV‐Vis spectrometer (Shimadzu UV‐2100) was used for determining drug loaded on NPs and drug released from NPs. The light sources, samples, and detector were all in one line where the light orientation was straight relative to samples. A 10 mm Analytik‐Jena quartz cell (820‐60099‐0) was used in the experiments [39].
2.3 Preparation of epoxidised SFO (ESFO)
Epoxidation of SFO was carried out in the presence of a mixture of formic acid and H2 O2, 35%, w/v. Briefly, 2 ml (0.04 mole) of formic acid was added to 14.3 g (0.016 mole) of SFO in a three‐neck round‐bottom flask and the reaction was done at a temperature of 60°C with continuous stirring. Then, 15.71 ml (0.175 mole) of H2 O2 was added dropwise to the mixture and the reaction continued for 6 h. In order to avoid overheating of the reaction mixture due to the exothermic process of epoxidation, an appropriate precaution was taken. The obtained mixture was cooled to room temperature and rinsed with distilled water and sodium bicarbonate solution repeatedly until neutral pH was obtained. ESFO was obtained after drying with MgSO4, filtering, evaporation of organic solvent by rotary evaporation, and drying in a vacuum oven overnight [40].
2.4 Synthesis of carbonate SFO (CSFO)
CSFO was synthesised according to the previous work with a porphyrin‐based catalytic system [41]. Briefly, 14 g ESFO was added to tetrakis(4‐methoxyphenyl)‐porphinate manganese and tetrabutylammonium bromide (4/4% w/w) in a three‐neck round‐bottom flask and the solvent‐free reaction was carried out under a CO2 atmosphere at a temperature of 100°C for 30 h. At the end of the reaction, the reaction mixture was dissolved in ethyl acetate and washed with distilled water and saline five–six times. Then, the organic phase was removed and the remaining mixture was dehydrated with MgSO4 and filtered. The organic solvent was evaporated using a rotary evaporator and CSFO was obtained as a viscose brown liquid.
2.5 Synthesis of POU
CSFO was mixed with the excess amounts of ethanol diamine in a ratio of 1/5.5 at 80°C for 8 h without using any solvent. Finally, the reaction mixture was dissolved in dichloromethane and was washed five–six times with distilled water and saline. The organic phase was extracted, dried by MgSO4 and filtered. Finally, the organic solvent was evaporated using a rotary evaporator and the POU was obtained.
2.6 Determination of hydroxyl number
The hydroxyl number of POU was determined according to the ASTM standard test method [42]. In summary, 1 g POU was added into a flask containing 5 ml of pyridine and its dilution was prepared by addition of 4 ml acetic anhydride. Then, the mixture was purged with gaseous nitrogen by heating to 95–100°C for 30 min. The deionised water (10 ml) was used for hydrolysis of excess amount of acetic anhydride and then the mixture was heated to 95–100°C for 5 min. The titration of both standard and POU solutions was carried out with 0.5 N KOH after cooling.
2.7 Fluorescence measurements
To investigate the self‐aggregation behaviour of POU micelles in an aqueous medium, the fluorescence spectra were recorded on a Varian Cary Eclipse spectrofluorophotometer. Initially, 1 ml of 6 × 10⁻⁶ M pyrene solution in acetone was added to vials, and acetone was allowed to evaporate at room temperature. Then, 10 ml aqueous POU solutions at various concentrations were added to the containers containing the pyrene residue. After 24 h solubilisation, the equilibrium of pyrene in the aqueous phase was determined. A CMC value was obtained from the ratios of pyrene intensities at 335 (I3) and 337 (I1) nm and estimated from the intersection of two tangent plots of I3 /I1 versus log concentrations of POU.
2.8 Preparation of micellar OZ NPs (OZ‐NPs)
OZ‐NPs were prepared by the co‐precipitation method. Briefly, OZ (5 mg) was dissolved in delineated proportion of acetone/water (2 ml) and 50 mg of POU was added to the same solution [43]. The prepared solution was added drop‐wise to purified water at 30 min at ambient temperature. The acetone was evaporated to obtain OZ‐NPs solution and the aggregate POU was filtered by a microfilter with a pore size of 1.2 microns. The solution was centrifuged at 14,000 rpm (20,379 relative centrifugal force) for 30 min and the unloaded drug of the supernatant was estimated using UV–Vis at 258 nm against a solvent blank. The loading efficiency (LE) and loading capacity (LC) were determined according to (1) and (2). The re‐suspension of sediment was carried out by adding 1 ml deionised water to sediment and then OZ‐NPs suspension was lyophilised in a freeze drier (Christ, Alpha 2‐4 LD, Germany, contained 0.04 mbar pressure and −50°C temperature and 48 h time) for drug release study and other characterisations
| (1) |
| (2) |
2.9 Release kinetic studies
In order to analyse drug release from OZ‐NPs and the mechanism of transport, several different kinetic models were used and optimal release and transport kinetics for OZ in OZ‐NPs was obtained. The zero order kinetics indicates uniform drug release from the matrix with respect to the time and is used to investigate systems where the rates of drug release and transport are independent of the concentration of drugs in the matrix
| (3) |
where Mt /M ∞, K 0, and t are fractional drug release, zero‐order kinetic constant and time, respectively. Equation (4) is based on the first‐order kinetics, which indicates that drug release is dependent on drug concentration. First‐order kinetics is demonstrated as
| (4) |
where K 1 (first order kinetic constant) is fitted according to the experimental data. Another model is the Hixson–Crowell cube root, which states that the mechanism of drug release depends upon the change in either surface area or particle size (5)
| (5) |
where M 0 and M t are the initial amount of the drug in the carrier and the amount of drug released at time t, respectively and K HC is a kinetic constant. The drug release from a matrix as a diffusion process based on Fick's law is described by the Higuchi model and demonstrated as the square root of a time‐dependent process. The equation for the Higuchi model is as follows:
| (6) |
where Mt /M ∞ and K H are the fractional drug release and Higuchi constant, respectively. Equation (7) is the Korsmeyer–Peppas model that represents power law release kinetics which follows a non‐Fickian release mechanism where drug release has an exponential relationship with respect to time
| (7) |
where n was determined by fitting release and transport data with respective models and K P depicts the power law constant. It is notable that both the parameters are experimentally demonstrated factors and are totally depend on the geometry of carrier boundaries [44].
2.10 Biodegradation study of NPs
The hydrolytic degradation of prepared OZ‐NPs was studied in the phosphate buffer saline (pH 7.4) in a thermostat water bath at 37 ± 2°C with gentle shaking for 1 week. The morphology of NPs in each time was investigated after first, 2, 4, and 7 days [45].
2.11 In vitro drug release studies
In vitro release of OZ from OZ‐NPs was estimated by applying a dialysis bag, which was pre‐soaked in the phosphate buffer for 30 min. 1 mg/ml OZ‐NPs solution was placed in a dialysis bag (cut‐off 10 kDa; Himedia, Mumbai, India) and was placed in phosphate buffer saline (pH 7.4) as a release medium to create a sink condition. The dialysis bag was immersed in a 20 ml receptor compartment containing phosphate buffer and incubated at 37 ± 2°C with shaking at 100 rpm. At predominate times (12 h, 1, 2, 3, 4, 5, 6, 7 days), samples were withdrawn and replaced with the same amount of fresh phosphate buffer (all measurements were performed in triplicate (n = 3)). The UV–Vis method used for LE and LC determination was applied for evaluation of release percentage according to (8) [46] based on the standard curves obtained from free OZ in the phosphate buffer solution
| (8) |
where m OZ is the amount of OZ encapsulated in the OZ‐NPs, V 0 represents the volume of the release medium (V 0 = 20 ml), V r is the volume of the replaced medium (V r = 1 ml), and Cn represents the concentration of OZ in the sample.
2.12 MTT assay
MTT assay was carried out to determine the in‐vitro cytotoxicity of OZ‐NPs. The NIH/3T3 cell line was checked for mycoplasma according to the protocol used in previous studies [47]. The NIH/3T3 cells were plated at a density of 10,000 cell/cm2 (4000 cells/well) in DMEM containing 10% FBS and 15% antibiotics for 24 h at 37°C in a humidified atmosphere containing 5% CO2. Next, the OZ‐NPs were dispersed in DMEM and added to the full‐growth media of confluent NIH/3T3 cells to obtain various concentrations of 0.1, 0.5, 1, 5 mg/ml of OZ‐NPs and incubated for 1, 3 and 7 days. MTT assay was performed at several time points (days 1, 3 and 7 days) in order to estimate cell viability. A plate reader was used for determination of absorbance of the solution at 540 nm and the number of viable cells in each plate was investigated and per cent control was reported. It is notable that all experiments were performed in triplicate [48].
2.13 In vivo pharmacokinetic evaluation in plasma
The in vivo performance of the prepared OZ‐NPs was characterised. All animal studies were performed in accordance with ‘The basic of laboratory animal science’ prepared and published by Royan Institute, 2013, ISBN: 978‐600‐92587‐8‐9. A group of healthy rats was selected for the study. Six male rats in each group were used for pharmacokinetics and bio‐distribution studies. All the rats were fasted overnight before the experiments and had free access to water. 0.3% w/v drug suspension in carboxy methyl cellulose and OZ‐NPs were administered intravenously by caudal vein at a dose of 0.18 mg. Since the human dose is 10 mg, the conversion factor is 0.018. After administration, blood samples (0.5 ml) were separately collected via the caudal vein at specific intervals (0, 1, 2, 4, 6, 8, 12 and 24 h) and were placed into heparinised tubes containing 0.3 ml of anticoagulant solution and centrifuged immediately. After centrifugation, the plasma obtained was stored at −20° C until further analysis by applying high performance liquid chromatography (HPLC).
2.14 Quantification of plasma concentration
OZ plasma concentration was determined by HPLC analysis. A solution of 0.5 ml butyl acetate:dichloromethane (4:1 v/v) and 2 µl of 10% (m/v) vitamin C was used to extract 0.1 ml plasma. The samples were shaken vigorously for 30 s at room temperature using a Vortex mixer and then centrifuged (400 rpm) for about 15 min. Then, the supernatant was separated, dissolved in pure mobile phase and analysed. The drug assay detection was performed using HPLC [49]. Initially, OZ standard solutions were prepared by dissolving OZ in methanol to obtain a nominal concentration of 1 mg/ml and further diluted in methanol to produce standards (5, 10, 20, 40, 80, 100 µg/ml). The concentration of OZ in plasma samples was determined from the area of the chromatographic peak using the calibration curve prepared by linear regression analysis of the plot of the peak area against the concentration of OZ.
3 Results and discussion
3.1 Synthesis of POU
The POU was synthesised and resulted in a macromolecule with miscellaneous OH bonds. In this study, the POU synthesis was performed by cyclic carbonate ring opening reaction following the addition of ethanol diamine.
The obtained POU contained one primary and secondary hydroxyl group per epoxy group. The facile method of POU synthesis was as follow: initially, the epoxidation of SFO was carried out by H2 O2 and formic acid (Fig. 2 a)]. Then, epoxy groups of ESFO were coupled via CO2 (Fig. 2 b) and in the third step, the POU was prepared with an inexpensive as well as green method through the addition of ethanol amine (Fig. 2 c).
Fig. 2.
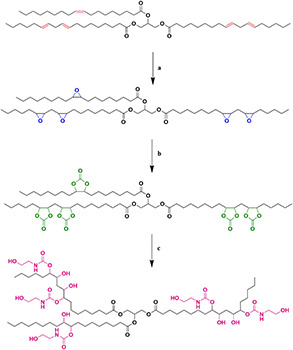
Synthesis route of POU
(a) H2 O2 and formic acid, (b) CO2, (c) Ethanol amine
3.1.1 FTIR analysis
The spectra of POU are shown in Fig. 3 and indicate that POU has been synthesised. The SFO before and after epoxidation are shown in Figs. 3 a and b, respectively. The epoxidation results in drastic reduction of the C=C–H absorption band in 3000 cm−1 and the appearance of the epoxide bands around 820–840 cm−1. As is depicted in Fig. 3 c, the synthesis of carbonate groups is proved by the appearance of carbonyl stretch bonds in 1795–1805 cm−1, the stretch bonds of C–O in 1050 cm−1, the rotation bonds of C–H in 870 cm−1 and elimination of epoxide groups' peaks. Finally, elimination of carbonyl bonds of carbonate groups and appearance of carbonyl bonds of urethane groups in 1640 cm−1 and the width peaks of hydroxyl groups (types 1 and 2) in 3250–3500 cm−1 corroborate the synthesis of POU.
Fig. 3.
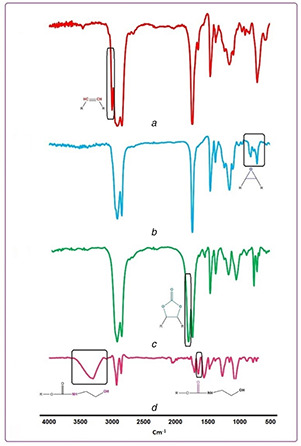
FTIR spectra of
(a) SFO, (b) ESFO, (c) CSFO, (d) POU
3.1.2 Hydrogen‐1 nuclear magnetic resonance (1 HNMR)
The successful synthesis of POU was also confirmed using 1 HNMR (Fig. 4). The spectra of SFO and ESFO are indicated in Fig. 4 a and b, respectively. The disappearance of the peak of C=C bonds (peaks between 5.3 and 5.6 ppm) in SFO and appearance of epoxy groups (peaks between 2.8 and 3.2 ppm) approve the successful epoxidation of SFO. In Fig. 4 c, diminish in the height of epoxides groups' peaks (2.8–3.1) and revealing peaks in 4.4–4.9 indicate that carbonate groups were produced. Finally, the carbonate groups were eliminated and the urethane groups were synthesised and demonstrated that POU was synthesised (Fig. 4 d).
Fig. 4.
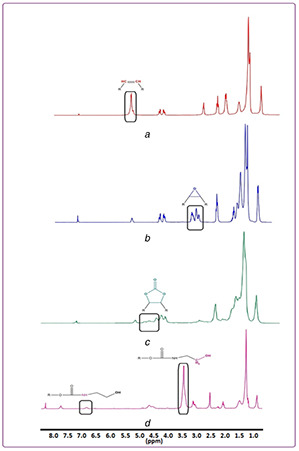
1 HNMR of
(a) SFO, (b) ESFO, (c) CSFO, (d) POU
3.1.3 Carbon‐13 nuclear magnetic resonance (13 CNMR)
13 CNMR of CSFO and POU are shown in Figs. 5 a and b, respectively. As is evident in Fig. 5 a, the C=O of the carbonate group has a chemical shift in 154 ppm. According to Fig. 5 b, the peaks of C=O of ester bonds and urethane bonds are in 173 and 158 ppm, respectively. Furthermore, carbon adjacent to hydroxyl type 2 obtained from carbonate ring opening was investigated in 68 ppm. The peaks in 44 and 62 ppm are related to methylene neighbouring urethane groups and methylene neighbouring to hydroxyl type 1, respectively.
Fig. 5.
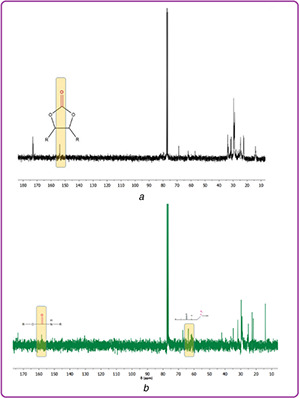
13 CNMR of
(a) CSFO, (b) POU
3.1.4 Thermogravimetry analysis (TGA)–X‐ray diffraction (XRD)
The thermal stability of POU is depicted in Fig. 6 a. At around 160°C, the ester bonds began to degrade. Then, at around 200°C the urethane bonds degraded and led to primary or secondary amines, olefin, and carbon dioxide. Finally, the stability of POU is approved by TGA thermogram. The crystallography analyses on POU were investigated using XRD (Fig. 6 b). The peaks were observed in 19 and 43°, indicating the crystalline zones with inter‐planar spacing. The intense peak indicated microcrystallinity in hard domains and the other referred to the soft domain [50].
Fig. 6.
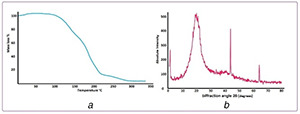
Thermal gravimetric analysis
(a) Thermogram of POU, (b) X‐ray diffraction (XRD) of POU
3.2 Determination of CMC
The CMC values are estimated to determine the self‐aggregation behaviour of polyol micelles in an aqueous medium by the fluorescence probe technique using pyrene as a fluorescence probe. Pyrene molecules have a strong inclination towards the hydrophobic core of micelles when they are exposed to an aqueous solution. The enhancement ratio in absorptions of 337 (I3)/ 334.5 (I1) was obtained with an increase of POU concentration when the pyrene transferred into its hydrophobic core and the micelle structure was made. Thus, the obtained low CMC value (2.17 × 10⁻⁴ mg/ml) (Fig. 7) demonstrated that the micelle is stable against dilution [51].
Fig. 7.
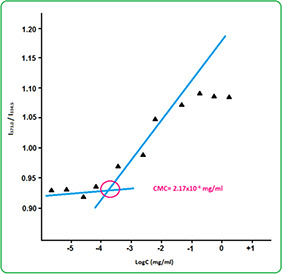
Fluorescence excitation spectra of pyrene in POU micelle solutions in different concentrations
3.3 Determination of hydroxyl number of POU, epoxy content of ESFO and iodine value of SFO
The epoxy content of ESFO was determined according to ASTM D 1652‐04 and was 4.7 mole/kg. The results of titration demonstrated that the hydroxyl number of POU was 337 mg KOH/g, analogous the theoretical hydroxyl value of 377.1 mg KOH/g. In addition, the iodine value of SFO was estimated 138.0 g of I2 /100 g, which was determined by ASTM D.
3.4 Biobased content
Biobased content was defined as the amount of biobased carbon in the material as a per cent of the weight (mass) of the total organic carbon in the specific product. This method allows one to determine the proportion of carbon within a biobased product derived from biomass [42]. In addition, radiocarbon analysis was carried out in accordance with ASTM (ASTM D6866‐05 is a suitable method for experimentally determination of biobased content). Therefore, the biobased content is indicated as a per cent of biobased carbon atoms in the total carbon atoms of the final product. It is notable that sucrose soyates made of sugar and soybean oil and epoxidised sucrose soyates are 100 per cent biobased. On a weight basis, the CSFO and petroleum‐based ethanolamine have 72.7 and 54% carbons, respectively. In supposition that 1 mole (1179 g) CSFO reacts with 5 mole ethanol diamine (305.25 g), the biobased content of POU is theoretically obtained 83.87% according to
Thus, the synthesised POU has high biobased content.
3.5 Size and morphology of OZ‐NPs
The degradation of OZ‐NPs is dependent on particle size and shape [52]. Moreover, regardless of the mode of administration, transport of particles in the body will be affected by particle shape. Both diameter and shape dictate particle velocity, diffusion, and adhesion to walls in blood vessels, intestine, and airways. The lower size of NPs results in a lower level of reticuloendothelial system uptake and minimum renal excretion [53]. Furthermore, movements of spherical particles are easier due to their symmetry. The spherical morphology of OZ‐NPs was determined by SEM micrograph (Fig. 8 b) using CLEMEXV R particles image analysis software package and was proved by the DLS result where the size and particle size distribution were 90 ±0.43 nm and 0.36 ± 0.01, respectively (Fig. 8 a). The obtained results indicated that POU may self‐assemble into micelles in an aqueous solution (Fig. 8 c) and the prepared OZ‐NPs are appropriate for drug delivery. POU has a dual character in view of hydrophobic and hydrophilic segments present in an amphiphilic chain. The hydrophobic segment forms core because of the water repulsion, while hydrophobic chain encapsulates them as a shell. Therefore, the micelles can form in the aqueous solution, from which NPs can be seen in the SEM image [54].
Fig. 8.
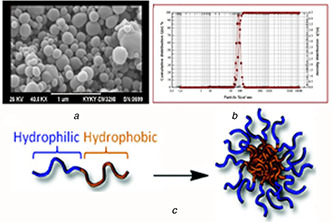
A scanning electron microscope (SEM)
(a) Micrograph of OZ‐NPs, (b) Dynamic light scattering (DLS) of micrograph of OZ‐NPs, (c) Self‐assembly mechanism of OZ‐NPs
3.6 In vitro degradation
One of the important advantages of synthesised POU was its biodegradability because there are a plethora of ester and amide bonds in its structure. Hydrolysis of the ester group resulted in chain degradation to carboxylic group and alcohol. Moreover, urethane and urea hydrolysis resulted in chain degradation to amine and alcohol. The degradation process was determined for 7 days. The decomposition of micelles is evident and the cavities enhanced by the day of 7 are due to the cleavage of ester and amide bonds of POU in phosphate buffer (Fig. 9). Degradation rate can be tuned by altering the groups on the NP surface, which itself is responsible for a tuned controlled release.
Fig. 9.
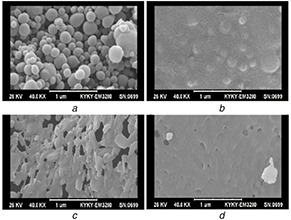
SEM images of degraded OZ‐NPs
(a) First day, (b) 2 days, (c) 4 days, (d) 7 days incubation in the phosphate buffer saline (pH 7.4), at 37°C
3.7 Loading and in vitro release of OZ
The obtained LE and LC of OZ‐NPs were 83 ± 4.5 and 12.5 ± 0.6%, respectively, demonstrating that OZ was effectively loaded into OZ‐NPs. The POU could easily self‐assemble thanks to its amphiphilicity in an aqueous solution. OZ is a hydrophobic drug when encountered with an aqueous solution so that because of the water repulsion it tended to be encased within the POU. The in‐vitro release study of OZ from OZ‐NPs is shown in Fig. 10. The percentage of the release of OZ from POU was ∼82 ± 3% after 168 h (7 days). Controlled release systems will result in a reduction of toxicity effects in the human body and yield sustained release. It is noticeable that the nature of the carrier is one of the preeminent factors that affect drug release. As the synthesised POU is in crystalline form, the microchannel structures are created by the polymer that results in the first burst release of OZ from NPs. Furthermore, as OZ is in crystalline as well as in hydrophobic form, it is prone to represent slow‐release behaviour [55]. The first stage observed in the release plot during the first 12 h (25%) is due to the water infusion to the POU‐NPs and the second stage is because of degradation of ester bonds of POU. Furthermore, the urethane bonds' degradation beside of ester bonds led to a high release rate.
Fig. 10.
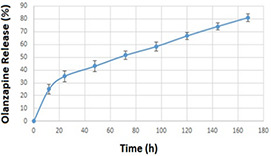
Release profile of OZ from OZ‐NPs, data are shown as mean ± SD of three samples
3.8 Theoretical drug release studies
All experimental release data were fitted by five mathematical models to determine the best equations that demonstrate OZ release's profiles in physiological situations. All the results for fitting OZ‐NPs release profiles into respective equations are provided in Table 1. It has been manifested that the OZ‐NPs release profile was more suitable for the Higuchi model, with a correlation coefficient of 0.9938 (Fig. 11). As is evident, Higuchi describes drug release as a diffusion process based on Fick's law, square root time dependent. This model can be used to explain the drug dissolution from several types of modified release pharmaceutical dosage forms, as in the case of some transdermal systems and matrix tablets with water soluble drugs [56].
Table 1.
Release parameters for OZ‐NPs after fitting data with five different mathematical models of drug release kinetics
| Fitted theoretical models | ||||
|---|---|---|---|---|
| Zero order | First order | Hixson–Crowell | Higuchi | Korsmeyer–Peppas |
| K 0 : 0.4086 | K 1 : 0.0068 | K HC : 0.0103 | K H : 5.9607 | K H : 9.57 |
| R 2 : 0.9121 | R 2 : 0.9287 | R 2 : 0.9717 | R 2 : 0.9938 | R 2 : 0.9936; n : 0.3949 |
Fig. 11.
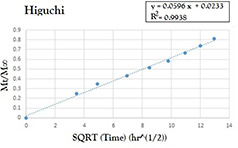
Model fit of the experimentally determined amounts of OZ‐NPs
3.9 In vitro cytotoxicity of OZ‐NPs
One of the major points that is important in drug delivery systems is the lower toxicity of the carrier. The relative cytotoxicity of the OZ‐NPs was evaluated on NIH/3T3 cell‐line using MTT viability assay and performed at predetermined intervals (1, 3 and 7 days) and various concentrations from 0.1 to 5 mg/ml. All experiments were run three times and as shown in Fig. 12, at lower concentrations of 0.1 and 0.5 mg/ml cell viability percentage has not demonstrated a dramatic change during 7 days. At higher concentrations of 1 and 5 mg/ml, the cell viability was increased to 81.77 ± 5.1 and 73.87 ± 4.2%, respectively, after 7 days. It should be mentioned that the cell viability of all the OZ‐NPs was well preserved at different concentrations; nonetheless, the cell viability at a concentration of 0.5 mg/ml after 7 days was higher than other concentrations. The biocompatibilities of the prepared OZ‐NPs were confirmed, for the cell viability results after 1, 3 and 7 days indicated that the degraded products of OZ‐NPs were not generally toxic.
Fig. 12.
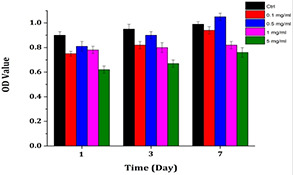
Comparison of cell viabilities upon 1‐, 3‐, and 7‐day incubation of cells in the extraction media of OZ‐NPs at four concentrations. Control groups are cells incubated in cell culture media
3.10 In vivo studies
Pharmacokinetic parameters of OZ after intravenous administration are shown in Table 2. The obtained individual plasma concentration in every time profile made the calculation of both C max and T max possible. The bioavailability of the drug was determined using the area under the curve (AUC) presented in Fig. 13. This figure demonstrates both the concentration–time curve of OZ‐NPs and OZ solution. A possible explanation for significantly higher (p < 0.05) AUC, t 1/2 and mean residence time (MRT) for POU‐NPs than OZ suspension is due to the slower release of OZ from OZ‐NPs compared to OZ suspension.
Table 2.
Pharmacokinetic parameters for OZ in the plasma after intravenous administration
| Time | Formulation | Pure drug |
|---|---|---|
| AUC0–t | 1521.37 ± 0.039 | 491.21 ± 0.059 |
| Keli, h−1 | 1.61 ± 0.023 | 2.23 ± 0.068 |
| t 1/2, h | 0.43 ± 0.029 | 0.31 ± 0.051 |
| AUC0–∞ | 7732.54 ± 1.71 | 3921.71 ± 1.3 |
| AUMC0–t | 7932.39 ± 2.12 | 1361.32 ± 1.79 |
| AUMC0–∞ | 11,642.91 ± 1.39 | 1728.9 ± 2.17 |
| MRT | 1.51 ± 0.23 | 0.44 ± 0.16 |
| Fr | 1.97 ± 0.11 | 1 |
Fig. 13.
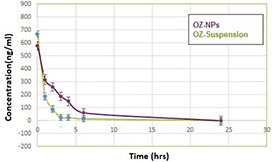
Concentration–time curve of OZ‐NPs and OZ‐suspension
According to relative bioavailability (Fig. 13), when the OZ‐NPs were injected, the OZ concentration was present even after 7 h; nonetheless, the OZ concentration in OZ suspension was decreased in 3 h. After intravenous administration of OZ suspension, the mean measured peak was approximately half of the one in OZ‐NPs. In other words, free OZ is accessible and is easily solubilised in plasma in comparison with OZ entrapped in POU. The initial OZ concentration at 30 min for OZ suspension is higher than OZ concentration which is released from OZ‐NPs. The drug concentration after injection of both OZ suspension and OZ‐NPs has been decreased; however, this trend is slower for OZ‐NPs because the POU microcrystalline structure containing urethane bonds and ester bonds hampered the fast release of OZ and led to sustained release of drug and enhancement of OZ bioavailability. It was reported that OZ stimulates apoptosis and autophagy in malignant glioma cell simultaneously [57].
Controlled release of OZ resulted in interaction of OZ with desired receptors such as dopamine receptor D2 and the 5‐HT2 receptors are a subfamily of 5‐HT receptors that bind the endogenous neurotransmitter serotonin (5‐hydroxytryptamine, 5‐HT), hence, its unwanted interaction with other receptors is inhibited and its side effect such as obesity can be inhibited. The mechanism of OZ causing obesity is illustrated in Fig. 14 in which OZ declines the proopiomelanocortin (POMC) messenger RNA (mRNA) expression and cannabinoid type 1 receptor binding density, while simultaneously enhance neuropeptide Y and glutamic acid decarboxylase mRNA expression. POMC is one of the anorexigenic peptides, which its extended inhibition resulted in obesity [58]. Moreover, OZ has an impact on growth inhibition as well as autophagy, so that OZ‐induced autophagy plays a tumour‐suppressing role [57].
Fig. 14.
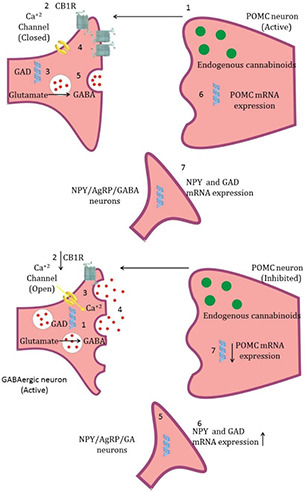
Mechanism of OZ‐induced weight gain. Normal condition (upper), and OZ treated condition (lower)
4 Conclusion
In this work, we reported the synthesis procedure and characteristics of an amphiphilic polyol in which urethane bonds are its main parts. As recent works are going to endow both biodegradability and biocompatibility to the structure of polymers, it is noticeable that the synthesised POU has intrinsically ester bonds that make it attractive for applying in drug delivery systems. The bio‐based structure of prepared POU is an outstanding property of this carrier because, during a drug delivery procedure, the carrier settled near the tissue produce no toxic material after degradation. The hydrophobic OZ was effectively loaded into micelles and encapsulation efficiency of 87 ± 4.5 wt% achieved. SEM monitored the hydrolytic degradation of prepared OZ‐NPs through 7 days and the cavities in the OZ‐NPs confirmed their degradation and in‐vitro release study revealed the sustained release of OZ from OZ‐NPs. The presence of urethane bonds besides ester bonds in the structure of hyperbranched POU as a carrier is a superior property that distinguished this carrier from other biodegradable materials such as biodegradable POUs and lactic acid. Furthermore, formulated POU with OZ showed a significant increase in relative bioavailability of OZ compared with pure OZ suspension. 1 HNMR, FTIR, TGA, XRD, DLS, SEM and fluorescence spectroscopy all confirmed the structure of prepared samples. Cell viability study of OZ‐NPs firmly proved that the fabricated micelles are not harmful to a live body. Based on obtained results, it can be concluded that the POU can be an effective carrier to enhance the bioavailability of OZ as a model drug and can be also prototyped as a carrier for other drugs, which have poor bioavailability.
5 References
- 1. Hafshejani T.M. Zamanian A. Venugopal J.R. et al.: ‘Antibacterial glass‐ionomer cement restorative materials: a critical review on the current status of extended release formulations’, J. Control. Release, 2017, 262, pp. 317 –328 [DOI] [PubMed] [Google Scholar]
- 2. Mohebbi S. Nezhad M.N. Zarrintaj P. et al.: ‘Chitosan in biomedical engineering: a critical review’, Curr. Stem Cell Res. Ther., 2019, 14, pp. 93 –116 [DOI] [PubMed] [Google Scholar]
- 3. Sargazi G. Afzali D. Mostafavi A. et al.: ‘Chitosan/polyvinyl alcohol nanofibrous membranes: towards green super‐adsorbents for toxic gases’, Heliyon, 2019, 5, p. e01527 [DOI] [PMC free article] [PubMed] [Google Scholar]
- 4. Dai L. Liu K. Si C. et al.: ‘Ginsenoside nanoparticle: a new green drug delivery system’, J. Mater. Chem. B, 2016, 4, pp. 529 –538 [DOI] [PubMed] [Google Scholar]
- 5. Bakhshandeh B. Zarrintaj P. Oftadeh M.O. et al.: ‘Tissue engineering; strategies, tissues, and biomaterials’, Biotechnol. Genet. Eng. Rev., 2017, 33, pp. 144 –172 [DOI] [PubMed] [Google Scholar]
- 6. Zarrintaj P. Mostafapoor F. Milan P.B. et al.: ‘Theranostic platforms proposed for cancerous stem cells: a review’, Curr. Stem Cell Res. Ther., 2019, 14, pp. 137 –145 [DOI] [PubMed] [Google Scholar]
- 7. Omrani I. Farhadian A. Babanejad N. et al.: ‘Synthesis of novel high primary hydroxyl functionality polyol from sunflower oil using thiolyne reaction and their application in polyurethane coating’, Eur. Polym. J., 2016, 82, pp. 220 –231 [Google Scholar]
- 8. Babanejad N. Farhadian A. Omrani I. et al.: ‘Design, characterization and in vitro evaluation of novel amphiphilic block sunflower oil‐based polyol nanocarrier as a potential delivery system: raloxifene‐hydrochloride as a model’, Mater. Sci. Eng. C, 2017, 78, pp. 59 –68 [DOI] [PubMed] [Google Scholar]
- 9. Zarrintaj P. Manouchehri S. Ahmadi Z. et al.: ‘Agarose‐based biomaterials for tissue engineering’, Carbohydr. Polym., 2018, 187, pp. 66 –84 [DOI] [PubMed] [Google Scholar]
- 10. Pan X. Webster D.C.: ‘New biobased high functionality polyols and their use in polyurethane coatings’, ChemSusChem., 2012, 5, pp. 419 –429 [DOI] [PubMed] [Google Scholar]
- 11. Hu M. Chen M. Li G. et al.: ‘Biodegradable hyperbranched polyglycerol with ester linkages for drug delivery’, Biomacromolecules, 2012, 13, pp. 3552 –3561 [DOI] [PubMed] [Google Scholar]
- 12. Zarrintaj P. Moghaddam A.S. Manouchehri S. et al.: ‘Can regenerative medicine and nanotechnology combine to heal wounds? The search for the ideal wound dressing’, Nanomedicine, 2017, 12, pp. 2403 –2422 [DOI] [PubMed] [Google Scholar]
- 13. Wang B. Yuan H. Zhu C. et al.: ‘Polymer‐drug conjugates for intracellar molecule‐targeted photoinduced inactivation of protein and growth inhibition of cancer cells’, Sci. Rep., 2012, 2, p. 807 [DOI] [PMC free article] [PubMed] [Google Scholar]
- 14. Nilforoushzadeh M.A. Zare M. Zarrintaj P. et al.: ‘Engineering the niche for hair regeneration – a critical review’, Nanomed. Nanotechnol. Biol. Med., 2019, 15, (1), pp, 70 –85 [DOI] [PubMed] [Google Scholar]
- 15. Farokhi M. Mottaghitalab F. Fatahi Y. et al.: ‘Silk fibroin scaffolds for common cartilage injuries: possibilities for future clinical applications’, Eur. Polym. J., 2019, 115, pp. 251 –267 [Google Scholar]
- 16. Nilforoushzadeh M.A. Amirkhani M.A. Zarrintaj P. et al.: ‘Skin care and rejuvenation by cosmeceutical facial mask’, J. Cosmet. Dermatol., 2018, 17, pp. 693 –702 [DOI] [PubMed] [Google Scholar]
- 17. Motevalizadeh S.F. Khoobi M. Babanejad N. et al.: ‘Novel pH‐responsive multilayer magnetic nanoparticles for controlled drug delivery’, J. Iran. Chem. Soc., 2016, 13, pp. 1653 –1666 [Google Scholar]
- 18. Najafi F. Bakhshandeh E. Hadavand B.S. et al.: ‘Toward UV‐curable urethane acrylate/silica hybrid coatings: introducing urethane methacrylate trimethoxysilane (UAMS) as organic–inorganic coupling agent’, Prog. Org. Coat., 2014, 77, pp. 1957 –1965 [Google Scholar]
- 19. Wu Y. Wang L. Guo B. et al.: ‘Electroactive biodegradable polyurethane significantly enhanced Schwann cells myelin gene expression and neurotrophin secretion for peripheral nerve tissue engineering’, Biomaterials, 2016, 87, pp. 18 –31 [DOI] [PubMed] [Google Scholar]
- 20. Zhao X. Dong R. Guo B. et al.: ‘Dopamine‐incorporated dual bioactive electroactive shape memory polyurethane elastomers with physiological shape recovery temperature, high stretchability, and enhanced C2 C12 myogenic differentiation’, ACS Appl. Mater. Interfaces, 2017, 9, pp. 29595 –29611 [DOI] [PubMed] [Google Scholar]
- 21. Hekmatjoo N. Ahmadi Z. Afshar Taromi F. et al.: ‘Modeling of glycolysis of flexible polyurethane foam wastes by artificial neural network methodology’, Polym. Int., 2015, 64, pp. 1111 –1120 [Google Scholar]
- 22. Zarrintaj P. Bakhshandeh B. Saeb M.R. et al.: ‘Oligoaniline‐based conductive biomaterials for tissue engineering’, Acta Biomater., 2018, 72, pp. 16 –34 [DOI] [PubMed] [Google Scholar]
- 23. Baghaei B. Jafari S.H. Khonakdar H.A. et al.: ‘A multioptimization approach to assessment of drug delivery of PLGA nanoparticles: simultaneous control of particle size and release behavior’, Int. J. Polym. Mater. Polymer. Biomater., 2015, 64, pp. 641 –652 [Google Scholar]
- 24. Baghaei B. Saeb M.R. Jafari S.H. et al.: ‘Modeling and closed‐loop control of particle size and initial burst of PLGA biodegradable nanoparticles for targeted drug delivery’, J. Appl. Polym. Sci., 2017, 134, p. 45145 [Google Scholar]
- 25. Dunne M. Corrigan O.I. Ramtoola Z.: ‘Influence of particle size and dissolution conditions on the degradation properties of polylactide‐co‐glycolide particles’, Biomaterials, 2000, 21, pp. 1659 –1668 [DOI] [PubMed] [Google Scholar]
- 26. Kumar M. Misra A. Mishra A.K. et al.: ‘Mucoadhesive nanoemulsion‐based intranasal drug delivery system of olanzapine for brain targeting’, J. Drug Targeting, 2008, 16, pp. 806 –814 [DOI] [PubMed] [Google Scholar]
- 27. Babu P.V. Gorja D.R. Meda C.L.T. et al.: ‘Synthesis of n‐(3‐arylprop‐2‐ynyl) substituted olanzapine derivatives as potential inhibitors of PDE4B’, Tetrahedron Lett., 2014, 55, pp. 3176 –3180 [Google Scholar]
- 28. Stahl S.M. Mignon L. Meyer J.M.: ‘Which comes first: atypical antipsychotic treatment or cardiometabolic risk?’, Acta Psychiatr. Scand., 2009, 119, pp. 171 –179 [DOI] [PubMed] [Google Scholar]
- 29. Ahn J. Ko J. Lee S. et al.: ‘Microfluidics in nanoparticle drug delivery; from synthesis to pre‐clinical screening’, Adv. Drug Deliv. Rev., 2018, 128, pp. 29 –53 [DOI] [PubMed] [Google Scholar]
- 30. Seju U. Kumar A. Sawant K.K.: ‘Development and evaluation of olanzapine‐loaded PLGA nanoparticles for nose‐to‐brain delivery: in vitro and in vivo studies’, Acta Biomater., 2011, 7, pp. 4169 –4176 [DOI] [PubMed] [Google Scholar]
- 31. Martins S.M. Sarmento B. Nunes C. et al.: ‘Brain targeting effect of camptothecin‐loaded solid lipid nanoparticles in rat after intravenous administration’, Eur. J. Pharm. Biopharm., 2013, 85, pp. 488 –502 [DOI] [PubMed] [Google Scholar]
- 32. Mishra B. Patel B.B. Tiwari S.: ‘Colloidal nanocarriers: a review on formulation technology, types and applications toward targeted drug delivery’, Nanomed. Nanotechnol. Biol. Med., 2010, 6, pp. 9 –24 [DOI] [PubMed] [Google Scholar]
- 33. Vashist A. Kaushik A. Jayant R.D. et al.: ‘Hydrogels: stimuli responsive to on‐demand drug delivery systems’, in Kaushik A. Jayant R. Nair M. (ed.): ‘Advances in personalized nanotherapeutics’ (Springer, Cham, 2017), pp. 117 –130 [Google Scholar]
- 34. Zarrintaj P. Bakhshandeh B. Rezaeian I. et al.: ‘A novel electroactive agarose‐aniline pentamer platform as a potential candidate for neural tissue engineering’, Sci. Rep., 2017, 7, p. 2 [DOI] [PMC free article] [PubMed] [Google Scholar]
- 35. Manouchehri S. Bagheri B. Rad S.H. et al.: ‘Electroactive bio‐epoxy incorporated chitosan‐oligoaniline as an advanced hydrogel coating for neural interfaces’, Prog. Org. Coat., 2019, 131, pp. 389 –396 [Google Scholar]
- 36. Sadeghi‐Kiakhani M. Khamseh S. Rafie A. et al.: ‘Thermally stable antibacterial wool fabrics surface‐decorated by TiON and TiON/Cu thin films’, Surf. Innov., 2018, 6, pp. 258 –265 [Google Scholar]
- 37. Nemati A. Saghafi M. Khamseh S. et al.: ‘Magnetron‐sputtered Ti x N y thin films applied on titanium‐based alloys for biomedical applications: composition–microstructure–property relationships’, Surf. Coat. Technol., 2018, 349, pp. 251 –259 [Google Scholar]
- 38. Bagher Z. Atoufi Z. Alizadeh R. et al.: ‘Conductive hydrogel based on chitosan‐aniline pentamer/gelatin/agarose significantly promoted motor neuron‐like cells differentiation of human olfactory ecto‐mesenchymal stem cells’, Mater. Sci. Eng. C, 2019, 101, pp. 243 –253 [DOI] [PubMed] [Google Scholar]
- 39. Atoufi Z. Zarrintaj P. Motlagh G.H. et al.: ‘A novel bio electro active alginate‐aniline tetramer/agarose scaffold for tissue engineering: synthesis, characterization, drug release and cell culture study’, J. Biomater. Sci., Polym. Ed., 2017, 28, pp. 1617 –1638 [DOI] [PubMed] [Google Scholar]
- 40. Shendi H.K. Omrani I. Ahmadi A. et al.: ‘Synthesis and characterization of a novel internal emulsifier derived from sunflower oil for the preparation of waterborne polyurethane and their application in coatings’, Prog. Org. Coat., 2017, 105, pp. 303 –309 [Google Scholar]
- 41. Farhadian A. Gol Afshani M.B. Babaei Miyardan A. et al.: ‘A Facile and green route for conversion of bifunctional epoxide and vegetable oils to cyclic carbonate: a green route to CO2 fixation’, ChemistrySelect, 2017, 2, pp. 1431 –1435 [Google Scholar]
- 42. Norton G.A. Devlin S.L.: ‘Determining the modern carbon content of biobased products using radiocarbon analysis’, Bioresour. Technol., 2006, 97, pp. 2084 –2090 [DOI] [PubMed] [Google Scholar]
- 43. Omrani I. Babanejad N. Shendi H.K. et al.: ‘Preparation and evaluation of a novel sunflower oil‐based waterborne polyurethane nanoparticles for sustained delivery of hydrophobic drug’, Eur. J. Lipid Sci. Technol., 2017, 119, p. 1600283 [Google Scholar]
- 44. Ilgin P. Ozay H. Ozay O.: ‘A new dual stimuli responsive hydrogel: modeling approaches for the prediction of drug loading and release profile’, Eur. Polym. J., 2019, 113, pp. 244 –253 [Google Scholar]
- 45. Zarrintaj P. Urbanska A.M. Gholizadeh S.S. et al.: ‘A facile route to the synthesis of anilinic electroactive colloidal hydrogels for neural tissue engineering applications’, J. Colloid Interface Sci., 2018, 516, pp. 57 –66 [DOI] [PubMed] [Google Scholar]
- 46. Korsmeyer R.W. Gurny R. Doelker E. et al.: ‘Mechanisms of solute release from porous hydrophilic polymers’, Int. J. Pharm., 1983, 15, pp. 25 –35 [Google Scholar]
- 47. Asadi E. Abdouss M. Leblanc R.M. et al.: ‘Synthesis, characterization and in vivo drug delivery study of a biodegradable nano‐structured molecularly imprinted polymer based on cross‐linker of fructose’, Polymer, 2016, 97, pp. 226 –237 [Google Scholar]
- 48. Babanejad N. Nikjeh M.M.A. Amini M. et al.: ‘A nanoparticulate raloxifene delivery system based on biodegradable carboxylated polyurethane: design, optimization, characterization, and in vitro evaluation’, J. Appl. Polym. Sci., 2014, 131 [Google Scholar]
- 49. Liu X. Deng C. Cao S. et al.: ‘Acute effects of oral olanzapine treatment on the expression of fatty acid and cholesterol metabolism‐related gene in rats’, Life Sci., 2015, 128, pp. 72 –78 [DOI] [PubMed] [Google Scholar]
- 50. Zhang Z.‐P. Song X.‐F. Cui L.‐Y. et al.: ‘Synthesis of polydimethylsiloxane‐modified polyurethane and the structure and properties of its antifouling coatings’, Coatings, 2018, 8, p. 157 [Google Scholar]
- 51. Omrani I. Babanejad N. Shendi H.K. et al.: ‘Fully glutathione degradable waterborne polyurethane nanocarriers: preparation, redox‐sensitivity, and triggered intracellular drug release’, Mater. Sci. Eng. C, 2017, 70, pp. 607 –616 [DOI] [PubMed] [Google Scholar]
- 52. Hsieh D.S. Rhine W.D. Langer R.: ‘Zero‐order controlled‐release polymer matrices for micro‐and macromolecules’, J. Pharm. Sci., 1983, 72, pp. 17 –22 [DOI] [PubMed] [Google Scholar]
- 53. Prabaharan M. Grailer J.J. Pilla S. et al.: ‘Gold nanoparticles with a monolayer of doxorubicin‐conjugated amphiphilic block copolymer for tumor‐targeted drug delivery’, Biomaterials, 2009, 30, pp. 6065 –6075 [DOI] [PubMed] [Google Scholar]
- 54. Zarrintaj P. Ahmadi Z. Reza Saeb M. et al.: ‘Poloxamer‐based stimuli‐responsive biomaterials’, Mater. Today, Proc., 2018, 5, pp. 15516 –15523 [Google Scholar]
- 55. Fontana M.C. Beckenkamp A. Buffon A. et al.: ‘Controlled release of raloxifene by nanoencapsulation: effect on in vitro antiproliferative activity of human breast cancer cells’, Int. J. Nanomed., 2014, 9, pp. 2979 –2991 [DOI] [PMC free article] [PubMed] [Google Scholar]
- 56. Ramteke K.H. Dighe P.A. Kharat A.R. et al.: ‘Mathematical models of drug dissolution: a review’, Sch. Acad. J. Pharm., 2014, 3, pp. 388 –396 [Google Scholar]
- 57. Wang Y.‐X. Xu S.‐Q. Chen X.‐H. et al.: ‘Autophagy involvement in olanzapine‐mediated cytotoxic effects in human glioma cells’, Asian Pac. J. Cancer Prev., 2014, 15, pp. 8107 –8113 [DOI] [PubMed] [Google Scholar]
- 58. Weston‐Green K. Huang X.‐F. Deng C.: ‘Alterations to melanocortinergic, GABAergic and cannabinoid neurotransmission associated with olanzapine‐induced weight gain’, PLOS ONE, 2012, 7, p.e33548 [DOI] [PMC free article] [PubMed] [Google Scholar]


