Abstract
Superparamagnetic cobalt ferrite nanoparticles (CoFe2 O4) possess favourite advantages for theranostic applications. Most of previous studies reported that CoFe2 O4 magnetic nanoparticles (MNPs) are suitable candidates for induction of hyperthermia and transfection agents for drug delivery. The present study synthesized and investigated the potential use of CoFe2 O4 as a contrast agent in magnetic resonance imaging (MRI) by using a conventional MRI system. The CoFe2 O4 were synthesized using co‐precipitation method and characterized by TEM, XRD, FTIR, EDX and VSM techniques. Relaxivities r 1 and r 2 of CoFe2 O4 were then calculated using a 1.5 Tesla clinical magnetic field. The cytotoxicity of CoFe2 O4 was evaluated by the MTT assay. Finally, the optimal concentrations of MNPs for MRI uses were calculated through the analysis of T 2 weighted imaging cell phantoms. The superparamagnetic CoFe2O4 NPs with an average stable size of 10.45 nm were synthesized. Relaxivity r 1, 2 calculations resulted in suitable r 2 and r 2 / r 1 with values of 58.6 and 51 that confirmed the size dependency on relaxivity values. The optimal concentration of MNPs for MR image acquisition was calculated as 0.154 mM. Conclusion: CoFe2 O4 synthesized in this study could be considered as a suitable T 2 weighted contrast agent because of its high r 2 /r 1 value.
Inspec keywords: nanoparticles, phantoms, transmission electron microscopy, superparamagnetism, ferrites, cellular biophysics, precipitation (physical chemistry), magnetisation, cobalt compounds, nanomagnetics, magnetic particles, nanofabrication, biomedical MRI, nanomedicine, X‐ray diffraction, Fourier transform infrared spectra, X‐ray chemical analysis, particle size, medical image processing
Other keywords: superparamagnetic cobalt ferrite nanoparticles, T2 contrast agent, MRI, in vitro study, magnetic resonance imaging, coprecipitation method, transmission electron microscopy, X‐ray diffraction, Fourier‐transform IR spectra, energy dispersive X‐ray analysis, vibrating sample magnetometer, clinical magnetic field, cytotoxicity, MTT assay, T2 weighted imaging cell phantoms, T2 weighted contrast agent, stable size, size dependency, relaxivity values, MR image acquisition, magnetic flux density 1.5 T, CoFe2 O4
1 Introduction
Magnetic nanoparticles (MNPs) have been widely employed for various applications including magnetic resonance imaging (MRI), cancer hyperthermia, drug delivery, tissue imaging [1, 2]. Ferrite‐based MNPs have been widely‐explored as magnetic nanomaterials because of their excellent magnetic properties and multifunctional agents [3, 4]. Because of superparamagnetic properties of some ferrite‐based nanoparticles, they have been largely employed to enhance the proton relaxivity for improved contrast and sensitivity of MR image acquisition [5]. In addition, ferrite‐based MNPs could enhance the efficiency of hyperthermia owing to their high anisotropy, making them suitable candidates for theranostic applications. [6]. Among various ferrite‐based MNPs, cobalt ferrite (CoFe2 O4) nanoparticles have been recognised as a favourite contrast agent. They have hard magnetic material properties such as high saturation magnetisation, strong anisotropy and mechanical hardness [7]. Size and nanostructure of MNPs affect their magnetic properties that could be highly modulated by the preparation methods [8]. Water‐soluble ferrite MNPs could be synthesised by a co‐precipitation method for the biological applications [9]. Ferrite‐based MNPs are used as contrast agents for T 2 ‐weighted MR images. Based on theoretical models and experimental reports, r 2 relaxivity depends on the particles size and aggregation, the square of the saturation magnetisation and the applied magnetic field strength [10]. For small MNPs, which satisfy the motional averaging regime (MAR), ΔωτD < 1, the outer sphere theory could be applied. This theory is not applicable for larger sizes of MNPs. The static dephasing regime is dominant for too large sizes. In this regard, r 2 enhances as size increases [2, 11]. According to Ta et al. [12] r 2 relaxivity increased as magnetic field strength enhanced from 1.5 to 9.4 T and then decreased. r 2 /r 1 is an indicator of MRI efficiency that increases with the increment of field strength [13]. Some studies evaluated CoFe2 O4 MNPs as MR contrast agent in different sizes and various magnetic fields, confirming the above‐mentioned content [2, 14, 15, 16, 17]. The studies indicated that high r 2 /r 1 was obtained in large sizes and high magnetic fields. For clinical applications of superpramagnetic CoFe2 O4, it is necessary to obtain high r 2 and r 2 /r 1 in conventional MRI systems. A contrast agent with optimal efficiency within the range of clinical magnetic field might find clinical applications. In this study, the superparamagnetic CoFe2 O4 MNPs were synthesised with high size stability, and characterised by high r 2 /r 1 in clinical magnetic field strength. In addition, the cytotoxicity of this multifunctional agent was evaluated.
2 Material and methods
2.1 Materials
Co (II) and Fe (III) were purchased from Aldrich, Scharlau and Alfa Aesar. NaOH was obtained from Merck. MTT (3‐(4, 5‐ Dimethylthiazol‐2‐yl)‐2, 5‐diphenyltetrazolium Bromide) was purchased from Sigma Aldrich. Agarose gel and deionised water (DI water) were used during the tests.
2.2 Preparation of CoFe2 O4 MNPs
CoFe2 O4 MNPs were synthesised by co‐precipitation method in an alkaline aqueous environment. The reaction mixture was prepared from iron sulphate (Fe2 (SO4)3 salts) and cobalt chloride (CoCl2 salt) with 0.1 M concentration of metal salts. All components of the reaction mixture were deoxygenated with nitrogen gas before mixing. In the next step, 5.0 M NaOH solution was added with vigorously stirring of mixing reaction until reaching a pH of 12.4. The obtained solution was then replaced while stirring at 80°C for 3 h under continuous nitrogen gas bubbling. Finally, the obtained sedimentary solution was centrifuged at 8500 rpm for 3 min, and was carefully rinsed 3 times using 10 ml of DI water. The sediment was then rinsed with ethanol. Afterwards, CoFe2 O4 MNPs were dried at 50°C in dry heat [18].
2.3 Characterisation
2.3.1 Transmission electron microscopy (TEM)
TEM was carried out to evaluate the morphology and size distribution of the synthesised particles. A 200 keV field emission Tecnia F 20 (FE) TEM was used to get a high‐resolution TEM (HRTEM) and selected area (electron) diffraction (SAED) pattern. The particle size histogram was determined by measuring the diameter of ∼508 NPs and fitted by a Gaussian distribution.
2.3.2 Scanning electron microscopy (SEM)
SEM was carried out to evaluate the morphology and surface structure of the MNPs. A 20 kV High Voltage MIRA3 TESCAN in 1.38 µm of the field of view was used for SEM.
2.3.3 Phase structure
The X‐ray diffraction (XRD) indicated CoFe2 O4 MNPs with crystal lattice structures. The data was collected at the room temperature on an X‐ray diffractometer (GNR EXPLORER, ITALY). The Pure CoFe2 O4 MNPs was obtained at a calcination temperature of 550°C [19]. The XRD system was run at 40 kV and 30 mA in a 2θ range of 20°–80°. In the present study, dimensions of CoFe2 O4 MNPs crystal (D) were estimated using the XRD information through the Sherrer's equation.
2.3.4 Infrared spectra
Fourier‐transform IR (FTIR) spectroscopy was used to identify functional groups and chemical structural changes in materials. For preparation of sample: the powder sample and KBr salt were ground to reduce the particles size. Then, a small amount of powder sample (about 0.1–2% of the KBr amount) was mixed with the KBr powder. Subsequently, the mixture was ground for 3–5 min. Uniformly fine‐grained powders were prepared using milling the mixture using a mechanical vibrator or a mill. A thin and transparent pellet was obtained under pressure. Then, the pellet was put onto the sample holder in the FTIR system. The infrared spectrum was recorded by FTIR spectrometer (AVATAR 370 FT‐IR Thermo Nicolet Spectrum) that operated at room temperature. It was performed by 64 scans and the samples were analysed in transmittance mode [20]. The Spectral resolution of the system was set at 4 cm−1 [21].
2.3.5 Energy dispersive X‐Ray spectroscopy (EDS or EDX) spectrum
EDX spectrum indicated the presence of Fe, Co and O elements for the elemental analysis or chemical characterisation of samples.
2.3.6 Magnetometry
A vibrating sample magnetometer (vibrating sample magnetometer) VSM (manufactured by Danesh Pajoush Magnetis Company of Kashan, VSMF model, Iran) was used to measure the magnetic field‐dependent magnetisation loop from −15,000 to 15,000 Oe at room temperature.
2.4 Relaxometry
Contrast agents in MRI could change relaxation times in tissues of interest. They can reduce T 1 and T 2 relaxation times that can be introduced as positive or negative contrast agents in MR images, respectively. CoFe2 O4 MNPs are often used to enhance T 2 contrast are referred to as T 2 weighted images. T 2 and r 2 of water protons through the synthesised CoFe2 O4 MNPs were calculated at 1.5 T MRI scanner (Avanto/Siemens. Kamyab Hospital). An in vitro phantom containing CoFe2 O4 MNPs with various concentrations of 0.03, 0.04, 0.8, 0.12, 0.21, 0.25, 0.31, 0.36 and 0.42 mM was used to measure r 1 and r 2 values. All curve fitting routines, which were used to determine relaxation rate maps, were performed by Excel and R Software. T 1 ‐weighted image was acquired at TE: 8.7 ms; TR1/TR2/TR3/TR4/TR5/TR6: 100/300/600/900/1200/2000 ms; flip angle: 20°; matrix: 256 × 192; the field of view: 260 mm; 100%; averages: 1, echo train length: 1; slice thickness:5 mm. T 2 ‐weighted images were obtained by a T 2 spin‐echo multisection pulse sequence with fixed repetition time (TR) of 2000 ms; TE1/TE2/TE3/TE4/TE5/TE6/TE7/TE8/TE9/TE10/TE11/TE12/TE13/TE14/TE15/TE16/:13.8/27.6/41.4/55.2/69/82.8/96.6/110.4/124.2/138/151/165.6/179.4/193.2/207/220.8, flip angle: 20°; matrix: 256 × 192; field of view: 260 mm; 100%; averages: 1, echo train length: 1.
2.5 In‐vitro MR imaging of cell phantoms
In vitro experiments were performed using KYSE 30 (RRID: CVCL1351), an oesophagus cancer cell line (CCLE) from Homo sapiens (Human), extracted from a 64‐year‐old man. KYSE 30 cells were seeded at a density of 2 × 10⁶ at T12.5 culture flasks. After 24 h, different concentrations of CoFe2 O4 composite 0.04, 0.8, 0.12, 0.21, 0.25, 0.31 mM) were added to the culture flasks. Culture flasks were then rinsed by PBS. The cells were then detached and centrifuged at a microtube (2 cc). Few drops of agarose gel were added to every microtube to fix cells followed by sonication to remove air bubbles. MR imaging of cell phantoms was performed for two times using a 1.5 T MRI system (Avanto/ SIEMENS. KAMYAB HOSPITAL). A T 2 ‐Tse‐cor gradient‐echo sequence was acquired using the following sequence parameters: TR: 4000 ms, TE: 81 ms; flip angle: 20°; matrix: 256 × 192 interpolated; the field of view: 260 mm; averages: 1, echo train length: 1; slice thickness: 8 mm; 4 slices. The signal intensity (SI) was obtained from different concentrations of MNPs using Radiant Software (4.6.8 evaluation version) in cell phantoms. Percentage of ΔSI ((SI/SIControl) × 100) was calculated in which SIControl refers to cell phantom without MNPs.
2.6 Cytotoxicity of CoFe2 O4 MNPs
KYSE 30 was seeded at a density of 104 cells/well in a 96 well plate and incubated at 37°C for a doubling time of KYSE30 cell line for sufficient growth. CoFe2 O4 MNPs in concentrations of 0.05, 0.1, 0.2, 0.3, 0.4, 0.5, 0.75 and 1 mM were separately added to microwells. Cells were then incubated for 24 h. Finally, MTT (3‐(4, 5‐Dimethylthiazol‐2‐yl)‐2, 5‐diphenyltetrazolium Bromide) test was performed to determine the cell death percentage.
3 Results
3.1 XRD pattern
Fig. 1 shows the obtained XRD result of CoFe2 O4 MNPs. The XRD profile from CoFe2 O4 MNPs, prepared by co‐precipitation method, revealed the maximum XRD peak occurred at 2θ value of 35.87° that represented a typical CoFe2 O4 with an interlayer spacing value of 3.83242 A. The structural analysis of XRD pattern indicated that CoFe2 O4 MNPs had an inverse cubic spinel‐type. Mean size of crystals (D) was estimated by the Sherrer's equation: D = Kλ /β cosθ where K is the Scherrer constant (0.94), λ is the wavelength, β is the FWHM (in radians), and θ is the peak angular position. Consequently, the size of the CoFe2 O4 crystal was calculated by the most intensive peak (311) with a value of 11.67 nm [1, 2, 22, 23, 24]. The peaks of (111), (220), (311), (400), (511), and (440) were the main peaks of the typical inverse cubic CoFe2 O4 MNPs XRD spectrum [25, 26, 27, 28]. The peak (311) was used to obtain the lattice constant (a) of CoFe2 O4 MNPs according to the following equation [29]:
where dhkl is an interplanar distance; h, k and l refer to Miller indices and the lattice constant. The constant (a) of CoFe2 O4 crystal was computed according to the peak (31 1) with a value of 0.83 nm.
Fig. 1.
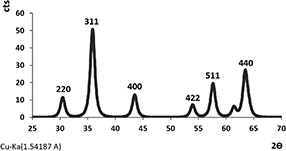
XRD pattern of sample CoFe2 O4 synthesised by a co‐precipitation method. The XRD system acted at 40 kV and 30 mA in a 2θ range of 20–80 [26, 30]
3.2 High‐resolution TEM
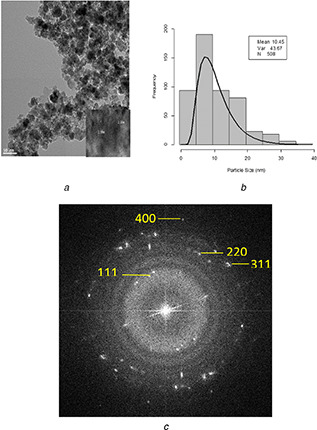
Fig. 2 a shows the HRTEM image of CoFe2 O4 MNPs. It is clear that CoFe2 O4 MNPs synthesise were aggregated and had non‐uniform shapes. Fig. 2 b shows the nanoparticle size distribution in the histogram. Size distribution was determined by measuring the mean diameter of about 508 particles on HRTEM image. The average size was 10.45 nm that was fitted by a Gaussian distribution. The SAED pattern (Fig. 2 c) shows at least four well‐defined diffraction rings. The rings were indexed with estimating their d‐spacing as (111), (311), (220) and (400) reflections of the cubic CoFe2 O4 MNPs that are in agreement with the XRD results.
Fig. 2.
HRTEM images of CoFe2 O4 MNPs
(a) HRTEM of CoFe2 O4 MNPs, (b) Size distribution histogram of CoFe2 O4 MNPs with Gaussian distribution, (c) SAED pattern of CoFe2 O4 MNPs [31, 32]
3.3 SEM
Fig. 3 shows the SEM image of CoFe2 O4 MNPs that used to confirm the morphology of the synthesised MNPs. The obtained results show that CoFe2 O4 MNPs had non‐uniform shape. The average size was estimated as 25.6 nm using SEM analysis. Size estimation was performed by ImageJ software.
Fig. 3.
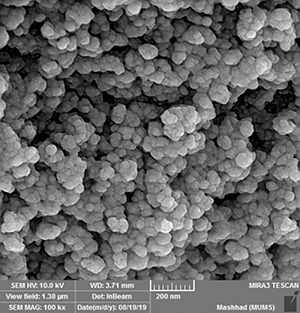
SEM images of CoFe2 O4 MNPs. Size estimation was performed by imageJ software
3.4 VSM
Magnetic properties of the synthesised CoFe2 O4 MNPs were evaluated using a SQUID system. Magnetic hysteresis curves of MNPs were obtained at the magnetic field within the range of −15,000–15,000 Oe at room temperature. The magnetisation of CoFe2 O4 MNP samples was not saturated by the SQUID (✗Fig. 4). Therefore, the saturation magnetisation was obtained through extrapolation with a value of 7.5 emu/g [33].
Fig. 4.
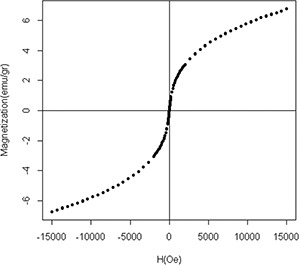
Magnetic hysteresis curves for CoFe2 O4 MNPs. It was obtained at the magnetic field in the range of −15,000 to 15,000 Oe at the room temperature
3.5 EDX spectrum
EDX spectrum of CoFe2 O4 MNPs shows the presence of elements of Fe, Co and O (Fig. 5). The peaks in the EDX pattern were perfectly assigned to the elements present in CoFe2 O4 nanoparticles.
Fig. 5.
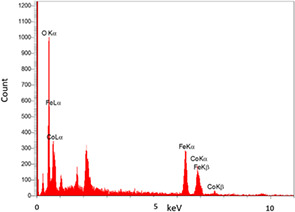
Energy dispersive X‐ray spectroscopy (EDS or EDX) profile obtained from CoFe2 O4 MNPs
3.6 FTIR spectra
Fig. 6 shows the FTIR of CoFe2 O4 MNPs. Two main bands at 590.31 and 416.35 cm−1 are assigned to M–O bond in octahedral and tetrahedral sites. 416.3 cm−1 is related to Co–O band and 590.3 cm−1 is associated with Fe–O band that confirmed the formation of CoFe2 O4 in the sample. The FT‐IR spectra showed board bands at 3380 cm−1 which are related to the OH group on the surface of nanoparticles. The bands at 3414.3 and 1349.9 cm−1 are assigned due to the stretching of H–O–H bindings [34].
Fig. 6.
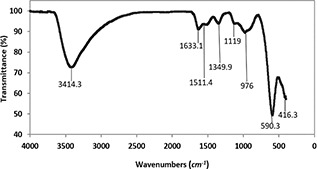
FTIR spectroscopy of CoFe2 O4 MNPs
3.7 Relaxivity r 2
The MR capability of CoFe2 O4 MNPs was tested using a 1.5 T MRI system. T 1 (longitudinal relaxation) and T 2 (transverse relaxation) are two independent relaxation processes to generate an MR image. In the presence of MNPs, the relaxation rate () increases linearly with the MNPs concentration according to the following equation:
where is the relaxation rate of pure water and C is the concentration of MNPs [35]. T 2 spin‐echo multisection pulse sequence with fix TR of 2000 ms and different TEs ranging between 13.8 and 220 ms were acquired for T 2 measurement. Suspensions of CoFe2 O4 MNPs at various concentrations (0.03–0.42 mM) were prepared in the DI water in 2 ml microtubes and DI water acted as controls in experiments. T 2 relaxation rates (1/T 2) were obtained by analysing the TE‐dependent SI curve for various concentrations of CoFe2 O4 MNPs (Fig. 7). T 2 weighted image of this nanostructure showed noticeable darkening by changing concentrations of MNPs in DI water. Thus, the SI of samples decreased at higher CoFe2 O4 MNPs concentrations (Fig. 8 a). The r 2 relativity was calculated as 58.6 mM−1 s−1 according to the linear plot slope of the CoFe2 O4 MNPs concentration depending on the inverse T 2 with R = 0.99 (Fig. 8 b).
Fig. 7.
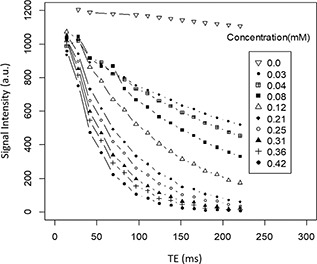
SI as a function of time of echo (TE) in various concentration of CoFe2 O4 MNPs. Spin‐echo multisection pulse sequence with fix time of repetition (TR) of 2000 ms and different TEs ranging between 13.8 and 220 ms for T2 measurement at various concentrations (0.03–0.42 mM) that were prepared in the DI water and DI water played roles as a control sample
Fig. 8.
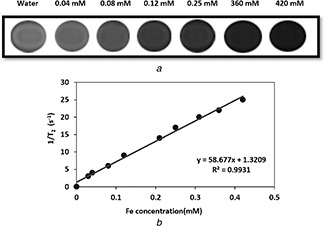
MR Image and calculated T2 relaxation rates and relaxivity
(a) T 2 ‐weighted MR image of CoFe2 O4 MNPs in water medium obtained by a conventional spin‐echo pulse sequence on a 1.5 T MRI system, (b) T 2 relaxation rates (1/T 2) depending on the concentration, calculated T 2 relaxivity (r 2) at various Fe concentrations of (0.03 to 0.42 mM)
3.8 Relaxivity r 1
Using the same token, r 1 was calculated by spin‐echo with fix TE of 8.7 ms value and changing TR (from 100 to 2000 ms). T 1 weighted image of this MNPs showed low darkening by changing concentrations of this MNPs (Fig. 9). According to Fig. 10, the longitudinal relaxation rate, r 1, was 1.15 mM−1 s−1 for CoFe2 O4 MNPs in DI water.
Fig. 9.
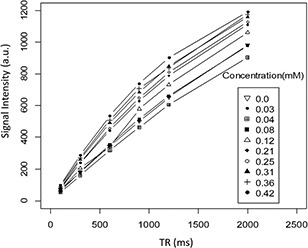
Spin echo sequence with fixed time of echo (TE) of 8.7 value and changing time of repetition (TR) (from 100 to 2000 ms) for T1 measurement at various concentrations (0.03–0.42 mM) of CoFe2 O4 MNPs that were prepared in the DI water
Fig. 10.
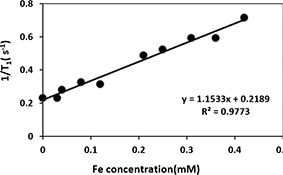
Calculated T1 relaxation rates and relativity at 1.5 T with varying Fe concentration of CoFe2 O4 MNPs (0.03 to 0.42 mM)
r2 /r1 ratio : The r 2 /r 1 ratio is an interesting sensitive parameter that is used to identify the category of the contrast agents (T 1 or T 2 contrast agent). The r 2 /r 1 ratio was calculated as 51 in the present study.
3.9 In vitro MR imaging of cell phantom
To optimise the clinical application of CoFe2 O4 MNPs, SI and ΔSI ((SI/SIcontrol) × 100) were obtained from cell phantom T 2 weighted image (✗Table 1). The results indicated that the optimal concentration of CoFe2 O4 MNPs was 0.154 mM to obtain 75% of maximum decay (Fig. 11).
Table 1.
Changes in SI and percentage of ΔSI ((SI/SIcontrol) × 100) which SIcontrol was related to cell phantom without MNPs) with concentration in cell phantoms image
| Concentration, mM | Signal intensity | ΔSI, % |
|---|---|---|
| 0 | 464 | — |
| 0.04 | 372 | 20 |
| 0.8 | 284 | 38 |
| 0.12 | 105 | 77 |
| 0.21 | 93.5 | 79 |
| 0.31 | 71.3 | 84 |
Fig. 11.
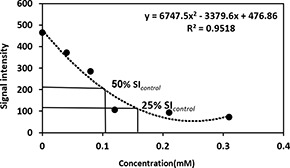
SI depended on concentration T2 ‐ weighted MR image. 50 and 75% SIcontrol accrue at concentrations of 0.87 and 0.154 mM, respectively
Cytotoxicity of CoFe2 O4 MNPs: The cytotoxicity of CoFe2 O4 MNPs was evaluated by analysing the cell survival MTT assay using KYSE30 cells. CoFe2 O4 MNPs were incubated at various concentrations within the rage of 0.01–1 mM for 24 h. The test showed a survival rate of more than 80% for the maximum concentration of 1 mM (Fig. 12). Statistical analysis was performed by One‐Way ANOVA test to compare control cells with the treated cells. Significant p ‐value was obtained by 0.009 and 0.028 for 0.75 and 1 mM of the MNPs concentrations, respectively. Morphology images of the treated KYSE30 cells with various concentrations of CoFe2 O4 MNPs are shown in Fig. 13.
Fig. 12.
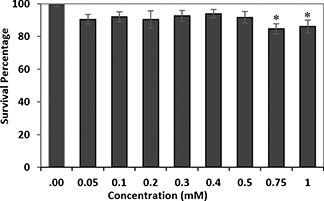
In vitro cytotoxicity of CoFe2 O4 MNPs tested on KYSE 30 cell line for 24 h by MTT assay. The * sign indicates the significance of the statistic test
Fig. 13.

Morphology image of KYSE 30 cell
(a) Without treatment (control), (b) Treated by 0.75 mM of CoFe2 O4 MNPs, (c) Treated by 0.1 mM of CoFe2 O4 MNPs
4 Discussion
This study aimed to synthesise and evaluate the performance of using superparamagnetic CoFe2 O4 MNPs as a suitable T 2 contrast in clinical magnetic field strengths. Small size CoFe2 O4 MNPs were synthesised through co‐precipitation method that could be the result of using a good multifunctional agent. Relaxometry of CoFe2 O4 MNPs, the optimal concentration of MNPs for MR imaging, and cytotoxicity effects of the MNPs were investigated.
HRTEM image of the synthesised CoFe2 O4 MNPs shows a non‐uniform and heterogeneous morphology. Also, there was an aggregation. Previous studies reported that smaller particles have a higher aggregation tendency due to lower energy barriers [36, 37]. The size distribution obtained from the HRTEM image revealed an average sizeof 10.45 nm for the synthesised MNPS. This size range was chosen for two reasons. Firstly, the superparamagnetic nanoparticles were characterised by size of <20 nm [38]. Secondly, MNPs smaller than 7 nm could not positively affect the r 2 relaxivity. However, slightly higher sizes could be optimal for the enhancement of the r 2 relaxivity [15, 17].
SAED pattern revealed that the synthesised sample is in polycrystalline nature (Fig. 2 c). It shows dotted rings pattern corresponding to spinel cubic CoFe2 O4 MNPs [31, 39, 40].
According to the SEM image, the synthesised MNPs showed non‐uniform shape. Agglomeration of the MNPS could be the reason for higher size in SEM image that could be due to Van der Waals forces between the particles [41].
Through the analysis of XRD pattern, the crystal size of the synthesised CoFe2 O4 MNPs (D) was estimated by theSherrer's equation with a small value of 11.67 nm. Subsequently, the lattice constant was estimated at 0.834 nm.
This finding is in agreement with the studies of Kalamet al. [42] and Houshiar et al. [1] indicating that the constant (a) of nanocrystalline depends on the size and synthesis method.
According to the hysteresis curve analysis of the CoFe2 O4 MNPs, the lack of Hc and Mr refer to the superparamagnetic properties of the sample [33]. The small size effect and increased surface area of nanoparticles leading to superparamagnetic properties and the hysteresis curve without any loop [43]. The saturation magnetisation (M S) of small‐sized MNPs can be described by a magnetic‐dead layer model.
It can be explained by the demagnetisation of surface spin due to the surface‐to‐volume ratio effect. According to this model, the reduced MNP size increased the surface‐to‐volume ratio, and thus the increased dead layer component decreased M S [15].
After the characteristics of MNPs, MR images of CoFe2 O4 MNPs were performed in an aqueous environment to evaluate the contrast between different concentrations of MNPs. T 2 weighted imaging of MNPs show a noticeable contrast by changing concentrations of MNPs. Therefore, CoFe2 O4 MNPs could be considered as a negative contrast agent. Dephasing of the magnetic moment of protons could be caused by inhomogeneity in the magnetic field of environmental molecules in the presence of MNPs [44].
The r 2 value of CoFe2 O4 MNPs was estimated at 58.6 by a magnetic relaxometry of CoFe2 O4 MNPs suspension at a 1.5 T conventional MRI system. The r 2 value highly depends on size, M S and the magnetic field strength [6]. The obtained r 2 was consistent with reports by Kanget al. indicating that T 2 relativity depends on the particle size, mass magnetisation and the concentration of MNPs [2, 45, 46]. The result was consistent with the study performed by Joos et al. [11] who proved that smaller MNPs, r 2 and r *2 decreased in a higher range of particle size because of the high surface spin anisotropy [47]. It was also consistent with the MAR theory. The size‐dependent effect was strongly observable at low frequencies [15]. Consequently, the value of r 2 is related to small synthesised CoFe2 O4 MNPs, low frequency and M S that depended on the magnetic‐dead layer. Despite these results, Venkatesha et al. [48] showed that with decreasing the size of CoFe2 O4, an increase of r 2 could be achieved. This result could be due to many sharp edges on the surface of MNPs that leads to higher magnetic gradient.
In this study, r 1 value was estimated at 1.15 mM−1 s−1. The longitudinal relaxivity, r 1, was related to the dead layer of paramagnetic material by the free spin on the surface of NPs. r 1 also highly depended on the applied magnetic field. In this way, the increase of magnetic field strength decreases the value of r 1 [49, 50]. Some reports indicated that for MNPs of below 20 nm, r 1 increases with size [51].
The high value of r 2 /r 1 ratio indicated T 2 contrast agent and vice versa [6, 52]. Some studies used cobalt ferrite as a contrast agent in the aqueous medium as shown in ✗Table 2. According to the data of Table 2, the higher r 2 /r 1 was achieved in large sizes of MNPs and high magnetic field values. In this study, the calculated high r 2 /r 1 (51) compared to similar studies, indicated CoFe2 O4 MNPs as a good candidate for a negative contrast agent in clinical magnetic field strength. The optimal concentrations of MNPs for MR image were calculated for the clinical applications. The research result indicated that higher concentrations of 0.154 mM of MNPs did not have any clinical value to obtain higher signal decay. Recent studies have found that MFe2 O4 (M = Co, Ni, Cu or Zn) could induce the cytotoxicity and apoptosis by ROS generation and oxidative stress. The cytotoxicity of CoFe2 O4 nanoparticles and risks for biological systems must be checked because of their widespread application [53, 54, 55, 56]. Few research studies reported the toxic potential of cobalt MNPs [57, 58]. However, there are studies indicating the lack of toxicity of cobalt ferrite nanoparticles [59, 60, 61]. The cytotoxicity study of CoFe2 O4 MNPs in this study indicated that concentrations of above 0.75 mM were toxic and the result agrees with the finding of Ravichandran et al. [14].
Table 2.
Some studies information using cobalt ferrite as a MRI contrast agent in aqueous medium
| Reporter | Sample name | Size (nm) (TEM) | B, T | M s, emu/g | r 1, s−1 m M−1 | r 2, s−1 mM−1 | r 2/r 1 |
|---|---|---|---|---|---|---|---|
| Present study | CoFe2 O4 | 10.5 | 1.5 | 7.5 | 1.15 | 58 | 51 |
| Vamvakidis‐2018 [35] | CoFe2 O4 cluster | 95 ± 12 | 1.5 | 116 | 0.2 | 3.1 | 14.8 |
| Iatridi‐2016 [62] | MnFe2 O4 :CoFe2 O4 ‐Copolymer | <100 | 1.5 | 1.85 | 39.87 | 21.55 | |
| Sitthichai‐2017 | CoFe2 O4 | 20 | 1.5 | 40.36 | — | 1313 | — |
| CoFe2 O4 coated | 12 | 1.5 | 99 | — | 176 | — | |
| DMSA | |||||||
| Venkatesha‐2014 | CoFe2 O4 | 6,9,14 | 9.4 | 9.9, 34.2, 44.7 | — | 32, 2, 5 | — |
| Liu‐2013 | CoFe2 O4 /H + /citrate | 12.98–37.89 | 0.47 | 28.42–45.50 | 12.8–27.8 | 16.6–75.1 | 1.3–2.7 |
| CoFe2 O4 /H + /citrate | 12.98–37.89 | 0.93 | 7.1–9.1 | 12.4–51 | 1.75–5.6 | ||
| Cheongwon‐ 2013 | CoFe2 O4 | 10.5 | 4.7 | — | — | 66 | — |
| CoFe2 O4 @ SiO2 | 15.8 | — | — | 179 | — | ||
| 20 | — | — | 208 | — | |||
| 24/2 | — | — | 302 | — | |||
| 70.8 | 130 | ||||||
| Ravichandran‐ 2015 | CoFe2 O4 nanowhisker | 40–90 | 7 | 74 | 2.367 | 256 | 108 |
| Georgiadou‐2015 | CoFe2 O4 ‐SBR | 9–16 | 4 | 87 | — | 167.4 | — |
5 Conclusion
In this study, CoFe2 O4 MNPs were synthesised by a co‐precipitation method. It successfully produced approximately small superparamagnetic cobalt ferrite MNPs by the average size of 10.45 nm. T 1 and T 2 relaxation times of hydrogen protons in aqueous solutions of varying concentrations were determined with a conventional MRI. T 1 and T 2 relaxivities (r 1 and r 2) were determined to be 1.15 and 58 mM−1 s−1, respectively. Owing to the high value of r 2 /r 1 (51), this research demonstrated the potential use of the synthesised MNPs as appropriate negative contrast agents at the conventional MRI system at low applied concentration. In addition, our results suggest that the CoFe2 O4 MNPs represent a perspective contrast agent suitable for cell labelling. The optimal concentration of CoFe2 O4 MNP as an MR contrast agent was obtained at 0.154 mM which is within a non‐toxic concentration range.
In vitro cell viability assays indicate that the CoFe2 O4 MNPs showed no cellular viability reduction for concentrations up to 0.75 mM. As a result, it is suggested that this MNPs can be considered in further studies as a theranostic agent for improving the diagnostic and therapeutic application.
6 Acknowledgments
Results of this study were derived from a PhD thesis (Thesis #951622) in the Department of Medical Physics at Mashhad University of Medical Sciences. The work was financially supported by the Research Deputy of Mashhad University of Medical Sciences. The research did not receive any specific grant from other funding agencies in the public, commercial, or non‐profit sectors.
7 References
- 1. Houshiar M. Zebhi F. Razi Z.J. et al.: ‘Synthesis of cobalt ferrite (CoFe2 O4) nanoparticles using combustion, coprecipitation, and precipitation methods: a comparison study of size, structural, and magnetic properties’, J. Magn. Magn. Mater., 2014, 371, pp. 43 –48 [Google Scholar]
- 2. Kang J. Lee H. Kim Y.‐N. et al.: ‘Size‐regulated group separation of CoFe2 O4 nanoparticles using centrifuge and their magnetic resonance contrast properties’, Nanoscale Res. Lett., 2013, 8, (1), p. 376 [DOI] [PMC free article] [PubMed] [Google Scholar]
- 3. Kherlopian A.R. Song T. Duan Q. et al.: ‘A review of imaging techniques for systems biology’, BMC Syst. Biol., 2008, 2, (1), p. 74 [DOI] [PMC free article] [PubMed] [Google Scholar]
- 4. Sharma P. Singh A. Brown S.C. et al.: ‘Multimodal nanoparticulate bioimaging contrast agents’, in ‘Cancer nanotechnology’ (Humana Press, New Jersey, 2010), 624, pp. 67 –81 [DOI] [PubMed] [Google Scholar]
- 5. Venkatesha N. Poojar P. Ashwini R. et al.: ‘Ultrafine graphene oxide–CoFe2 O4 nanoparticle composite as T 1 and T 2 contrast agent for magnetic resonance imaging’, RSC Adv., 2016, 6, (21), pp. 17423 –17429 [Google Scholar]
- 6. Rollet A.‐L. Neveu S. Porion P. et al.: ‘New approach for understanding experimental NMR relaxivity properties of magnetic nanoparticles: focus on cobalt ferrite’, Phys. Chem. Chem. Phys., 2016, 18, (48), pp. 32981 –32991 [DOI] [PubMed] [Google Scholar]
- 7. Zhang M. Lu J. Zhang J.‐N. et al.: ‘Magnetic carbon nanotube supported Cu (CoFe2 O4 /CNT‐Cu) catalyst: a sustainable catalyst for the synthesis of 3‐Nitro‐2‐Arylimidazo [1, 2‐a] pyridines’, Catal. Commun., 2016, 78, pp. 26 –32 [Google Scholar]
- 8. Özdinçer M. Durmuş S. Dalmaz A.: ‘Magnetic spinel‐type CoFe2 O4 nanoparticles: synthesis and investigation of structural, morphological properties’, Süleyman Demirel Üniversitesi Fen Bilimleri Enstitüsü Dergisi, 2017, 21, (2), pp. 311 –315 [Google Scholar]
- 9. Colombo M. Carregal‐Romero S. Casula M.F. et al.: ‘Biological applications of magnetic nanoparticles’, Chem. Soc. Rev., 2012, 41, (11), pp. 4306 –4334 [DOI] [PubMed] [Google Scholar]
- 10. Hadera H.T.: ‘Iron oxide nanocrystals clustered in oil‐in‐water nanoemulsions: preparation, characterization, and transverse relaxivities’. NTNU, 2015. [Google Scholar]
- 11. Joos A. Löwa N. Wiekhorst F. et al.: ‘Size‐dependent MR relaxivities of magnetic nanoparticles’, J. Magn. Magn. Mater., 2017, 427, pp. 122 –126 [Google Scholar]
- 12. Ta H.T. Li Z. Wu Y. et al.: ‘Effects of magnetic field strength and particle aggregation on relaxivity of ultra‐small dual contrast iron oxide nanoparticles’, Mater. Res. Express, 2017, 4, (11), p. 116105 [Google Scholar]
- 13. Qin J. Laurent S. Jo Y.S. et al.: ‘A high‐performance magnetic resonance imaging T2 contrast agent’, Adv. Mater., 2007, 19, (14), pp. 1874 –1878 [Google Scholar]
- 14. Ravichandran M. Oza G. Velumani S. et al.: ‘Cobalt ferrite nanowhiskers as T2 MRI contrast agent’, RSC Adv., 2015, 5, (22), pp. 17223 –17227 [Google Scholar]
- 15. Liu F. Laurent S. Roch A. et al.: ‘Size‐controlled synthesis of CoFe2 O4 nanoparticles potential contrast agent for MRI and investigation on their size‐dependent magnetic properties’, J. Nanomater., 2013, 2013, p. 127 [Google Scholar]
- 16. Georgiadou V. Tangoulis V. Arvanitidis I. et al.: ‘Unveiling the physicochemical features of CoFe2 O4 NPs synthesized via a variant hydrothermal method: NMR relaxometric properties’ J. Phys. Chem. C., 2015, 119, (15), pp. 8336 –8348 [Google Scholar]
- 17. Menelaou M. Iatridi Z. Tsougos I. et al.: ‘Magnetic colloidal superparticles of Co, Mn and Ni ferrite featured with comb‐type and/or linear amphiphilic polyelectrolytes; NMR and MRI relaxometry’, Dalton Trans., 2015, 44, (24), pp. 10980 –10990 [DOI] [PubMed] [Google Scholar]
- 18. Mikalauskaitė A. Kondrotas R. Niaura G. et al.: ‘Gold‐coated cobalt ferrite nanoparticles via methionine‐induced reduction’, J. Phys. Chem. C, 2015, 119, (30), pp. 17398 –17407 [Google Scholar]
- 19. Rajput A.B. Hazra S. Ghosh N.N.: ‘Synthesis and characterisation of pure single‐phase CoFe2 O4 nanopowder via a simple aqueous solution‐based EDTA‐precursor route’, J. Exp. Nanosci., 2013, 8, (4), pp. 629 –639 [Google Scholar]
- 20. Moreno A.G. Guerrero M.L. Alonso E.V. et al.: ‘Development of a new FT‐IR method for the determination of iron oxide. Optimization of the synthesis of suitable magnetic nanoparticles as sorbent in magnetic solid phase extraction’, New J. Chem., 2017, 41, (17), pp. 8804 –8811 [Google Scholar]
- 21. Faghihzadeh F. Anaya N.M. Schifman L.A. et al.: ‘Fourier transform infrared spectroscopy to assess molecular‐level changes in microorganisms exposed to nanoparticles’, Nanotechnol. Environ. Eng., 2016, 1, (1), p. 1 [Google Scholar]
- 22. George M. Nair S.S. John A.M. et al.: ‘Structural, magnetic and electrical properties of the sol‐gel prepared Li0.5 Fe2.5 O4 fine particles’, J. Phys. D: Appl. Phys., 2006, 39, (5), p. 900 [Google Scholar]
- 23. Duong G.V. Turtelli R.S. Hanh N. et al.: ‘Magnetic properties of nanocrystalline Co1−x Zn x Fe2 O4 prepared by forced hydrolysis method’, J. Magn. Magn. Mater., 2006, 307, (2), pp. 313 –317 [Google Scholar]
- 24. Phong P. Phuc N. Nam P. et al.: ‘Size‐controlled heating ability of CoFe2 O4 nanoparticles foráhyperthermia applications’, Phys. B, 2018, 531, pp. 30 –34 [Google Scholar]
- 25. Zhao S. Ma D.: ‘Preparation of CoFe2 O4 Nanocrystallites by Solvothermal Process and Its Catalytic Activity on the Thermal Decomposition of Ammonium Perchlorate’, J. Nanomater., 2010, 2010, (48), pp. 1 –5 [Google Scholar]
- 26. Nabiyouni G. Sharifi S. Ghanbari D. et al.: ‘A simple precipitation method for synthesis CoFe2 O4 nanoparticles’, J. Nanostruct., 2014, 4, (3), pp. 317 –323 [Google Scholar]
- 27. Shahjuee T. Masoudpanah S.M. Mirkazemi S.M.: ‘Coprecipitation synthesis of CoFe2 O4 nanoparticles for hyperthermia’, J. Ultrafine Grained Nanostruct. Mater., 2017, 50, (2), pp. 105 –110 [Google Scholar]
- 28. Khodaei M. Fayazzadeh S.: ‘Magnetic properties of CoFe2 O4 nanoparticle synthesized by salt‐assisted sol‐gel auto‐combustion method’, Mater. Res. Express, 2019, 6, (8), p. 086115 [Google Scholar]
- 29. Ramalho M. Gama L. Antonio S. et al.: ‘X‐ray diffraction and Mössbauer spectra of nickel ferrite prepared by combustion reaction’, J. Mater. Sci., 2007, 42, (10), pp. 3603 –3606 [Google Scholar]
- 30. Hedayati K. Azarakhsh S. Ghanbari D.: ‘Synthesis and magnetic investigation of cobalt ferrite nanoparticles prepared via a simple chemical precipitation method’, J. Nanostruct., 2016, 6, (2), pp. 127 –131 [Google Scholar]
- 31. Darwish M.S. Kim H. Lee H. et al.: ‘Synthesis of magnetic ferrite nanoparticles with high hyperthermia performance via a controlled co‐precipitation method’, Nanomaterials, 2019, 9, (8), p. 1176 [DOI] [PMC free article] [PubMed] [Google Scholar]
- 32. Chandekar K.V. Mohan Kant K.: ‘Synthesis and characterization of low temperature superparamagnetic cobalt ferrite nanoparticles’, Adv. Mater. Lett., 2017, 8, (4), pp. 435 –443 [Google Scholar]
- 33. Alsmadi A. Bsoul I. Mahmood S. et al.: ‘Magnetic study of M‐type doped barium hexaferrite nanocrystalline particles’, J. Appl. Phys., 2013, 114, (24), p. 243910 [Google Scholar]
- 34. Vinosha P.A. Mely L.A. Mary G.I.N. et al.: ‘Study on cobalt ferrite nanoparticles synthesized by co‐precipitation technique for photo‐Fenton application’, Mech. Mater. Sci. Eng. J., 2017, 9, (1), pp. 110 –115 [Google Scholar]
- 35. Vamvakidis K. Mourdikoudis S. Makridis A. et al.: ‘Magnetic hyperthermia efficiency and MRI contrast sensitivity of colloidal soft/hard ferrite nanoclusters’, J. Colloid Interface Sci., 2018, 511, pp. 101 –109 [DOI] [PubMed] [Google Scholar]
- 36. Marimón‐Bolívar W. González E.E.: ‘Study of agglomeration and magnetic sedimentation of glutathione@ Fe3 O4 nanoparticles in water medium’, Dyna, 2018, 85, (205), pp. 19 –26 [Google Scholar]
- 37. Gambinossi F. Mylon S.E. Ferri J.K.: ‘Aggregation kinetics and colloidal stability of functionalized nanoparticles’, Adv. Colloid Interface Sci., 2015, 222, pp. 332 –349 [DOI] [PubMed] [Google Scholar]
- 38. Ishizaki T. Yatsugi K. Akedo K.: ‘Effect of particle size on the magnetic properties of Ni nanoparticles synthesized with trioctylphosphine as the capping agent’, Nanomaterials, 2016, 6, (9), p. 172 [DOI] [PMC free article] [PubMed] [Google Scholar]
- 39. Qasim M. Asghar K. Das D.: ‘Preparation and characterization of CoFe2 O4 and CoFe2 O4 @ albumen nanoparticles for biomedical applications’, Ceram. Int., 2019, 45, (18), pp. 24971 –24981 [Google Scholar]
- 40. Saccone F.D. Ferrari S. Errandonea D. et al.: ‘Cobalt ferrite nanoparticles under high pressure’, J. Appl. Phys., 2015, 118, (7), p. 075903 [Google Scholar]
- 41. Joseph A.M. Thangaraj B. Gomathi R.S. et al.: ‘Synthesis and characterization of cobalt ferrite magnetic nanoparticles coated with polyethylene glycol’, AdvNanoBioM&D., 2017, 1, (1), pp. 71 –77 [Google Scholar]
- 42. Kalam A. Al‐Sehemi A.G. Assiri M. et al.: ‘Modified solvothermal synthesis of cobalt ferrite (CoFe2 O4) magnetic nanoparticles photocatalysts for degradation of methylene blue with H2 O2 /visible light’, Results Phys., 2018, 8, pp. 1046 –1053 [Google Scholar]
- 43. Theivasanthi T. Alagar M.: ‘Innovation of superparamagnetism in lead nanoparticles’, arXiv preprint arXiv:1402.1431, 2014.
- 44. Zhou Z. Tian R. Wang Z. et al.: ‘Artificial local magnetic field inhomogeneity enhances T2 relaxivity’, Nat. Commun., 2017, 8, (1), pp. 1 –10 [DOI] [PMC free article] [PubMed] [Google Scholar]
- 45. Jun Y.‐W. Huh Y.‐M. Choi J.‐S. et al.: ‘Nanoscale size effect of magnetic nanocrystals and their utilization for cancer diagnosis via magnetic resonance imaging’, J. Am. Chem. Soc., 2005, 127, (16), pp. 5732 –5733 [DOI] [PubMed] [Google Scholar]
- 46. Shapiro E.M. Skrtic S. Sharer K. et al.: ‘MRI detection of single particles for cellular imaging’, Proc. Natl. Acad. Sci., 2004, 101, (30), pp. 10901 –10906 [DOI] [PMC free article] [PubMed] [Google Scholar]
- 47. Issa B.: ‘Reduction of T2 relaxation rates due to large volume fractions of magnetic nanoparticles for all motional regimes’, Appl. Sci., 2018, 8, (1), p. 101 [Google Scholar]
- 48. Venkatesha N. Srivastava C. Hegde V.: ‘Synergetic effect of size and morphology of cobalt ferrite nanoparticles on proton relaxivity’, IET Nanobiotechnol., 2013, 8, (4), pp. 184 –189 [DOI] [PubMed] [Google Scholar]
- 49. Rohrer M. Bauer H. Mintorovitch J. et al.: ‘Comparison of magnetic properties of MRI contrast media solutions at different magnetic field strengths’, Invest. Radiol., 2005, 40, (11), pp. 715 –724 [DOI] [PubMed] [Google Scholar]
- 50. Weerakoon B.S. Osuga T. Konishi T.: ‘Enhancement effect of superparamagnetic iron oxide nanoparticle‐based MRI contrast agent at different concentrations and magnetic field strengths’, World Academy of Sci. Eng. Technol. Int. J. Chem. Mol. Nuclear, Mater. Metallurgical Eng., 2016, 10, (1), pp. 50 –53 [Google Scholar]
- 51. Davies G.L. Corr S.A. Meledandri C.J. et al.: ‘NMR relaxation of water in nanostructures: analysis of ferromagnetic Cobalt–Ferrite polyelectrolyte nanocomposites’, ChemPhysChem, 2011, 12, (4), pp. 772 –776 [DOI] [PubMed] [Google Scholar]
- 52. Issa B. Obaidat I.M. Albiss B.A. et al.: ‘Magnetic nanoparticles: surface effects and properties related to biomedicine applications’, Int. J. Mol. Sci., 2013, 14, (11), pp. 21266 –21305 [DOI] [PMC free article] [PubMed] [Google Scholar]
- 53. Thunus L. Lejeune R.: ‘Overview of transition metal and lanthanide complexes as diagnostic tools’, Coord. Chem. Rev., 1999, 184, (1), pp. 125 –155 [Google Scholar]
- 54. Sijens P.E. Van Den Bent M.J. Nowak P.J. et al.: ‘1 h chemical shift imaging reveals loss of brain tumor choline signal after administration of Gd‐contrast’, Magn. Reson. Med., 1997, 37, (2), pp. 222 –225 [DOI] [PubMed] [Google Scholar]
- 55. Chang C.A.: ‘Magnetic resonance imaging contrast agents design and physicochemical properties of gadodiamide’, Invest. Radiol., 1993, 28, pp. S21 –S27 [DOI] [PubMed] [Google Scholar]
- 56. Xiao Y.‐D. Paudel R. Liu J. et al.: ‘MRI contrast agents: classification and application’, Int. J. Mol. Med., 2016, 38, (5), pp. 1319 –1326 [DOI] [PubMed] [Google Scholar]
- 57. Naqvi S. Samim M. Abdin M. et al.: ‘Concentration‐dependent toxicity of iron oxide nanoparticles mediated by increased oxidative stress’, Int. J. Nanomed., 2010, 5, p. 983 [DOI] [PMC free article] [PubMed] [Google Scholar] [Retracted]
- 58. Huang G. Chen H. Dong Y. et al.: ‘Superparamagnetic iron oxide nanoparticles: amplifying ROS stress to improve anticancer drug efficacy’, Theranostics, 2013, 3, (2), p. 116 [DOI] [PMC free article] [PubMed] [Google Scholar]
- 59. Ahmad F. Liu X. Zhou Y. et al.: ‘An in vivo evaluation of acute toxicity of cobalt ferrite (CoFe2 O4) nanoparticles in larval‐embryo Zebrafish (Danio Rerio)’, Aquat. Toxicol., 2015, 166, pp. 21 –28 [DOI] [PubMed] [Google Scholar]
- 60. Song M.‐M. Song W.‐J. Bi H. et al.: ‘Cytotoxicity and cellular uptake of iron nanowires’, Biomaterials, 2010, 31, (7), pp. 1509 –1517 [DOI] [PubMed] [Google Scholar]
- 61. Cao J. Liu Y. Jia L. et al.: ‘Curcumin attenuates acrylamide‐induced cytotoxicity and genotoxicity in HepG2 cells by ROS scavenging’, J. Agric. Food Chem., 2008, 56, (24), pp. 12059 –12063 [DOI] [PubMed] [Google Scholar]
- 62. Iatridi Z. Vamvakidis K. Tsougos I. et al.: ‘Multifunctional polymeric platform of magnetic ferrite colloidal superparticles for luminescence, imaging, and hyperthermia applications’, ACS Appl. Mater. Interfaces, 2016, 8, (51), pp. 35059 –35070 [DOI] [PubMed] [Google Scholar]


