

Abstract
Although recent clinical trials targeting amyloid-β in Alzheimer’s disease have shown promising results, there is increasing evidence suggesting that understanding alternative disease pathways that interact with amyloid-β metabolism and amyloid pathology might be important to halt the clinical deterioration. In particular, there is evidence supporting a critical role of astroglial activation and astrocytosis in Alzheimer’s disease. However, so far, no studies have assessed whether astrocytosis is independently related to either amyloid-β or tau pathology in vivo.
To address this question, we determined the levels of the astrocytic marker GFAP in plasma and CSF of 217 amyloid-β-negative cognitively unimpaired individuals, 71 amyloid-β-positive cognitively unimpaired individuals, 78 amyloid-β-positive cognitively impaired individuals, 63 amyloid-β-negative cognitively impaired individuals and 75 patients with a non-Alzheimer’s disease neurodegenerative disorder from the Swedish BioFINDER-2 study. Participants underwent longitudinal amyloid-β (18F-flutemetamol) and tau (18F-RO948) PET as well as cognitive testing.
We found that plasma GFAP concentration was significantly increased in all amyloid-β-positive groups compared with participants without amyloid-β pathology (P < 0.01). In addition, there were significant associations between plasma GFAP with higher amyloid-β-PET signal in all amyloid-β-positive groups, but also in cognitively normal individuals with normal amyloid-β values (P < 0.001), which remained significant after controlling for tau-PET signal. Furthermore, plasma GFAP could predict amyloid-β-PET positivity with an area under the curve of 0.76, which was greater than the performance achieved by CSF GFAP (0.69) and other glial markers (CSF YKL-40: 0.64, soluble TREM2: 0.71). Although correlations were also observed between tau-PET and plasma GFAP, these were no longer significant after controlling for amyloid-β-PET. In contrast to plasma GFAP, CSF GFAP concentration was significantly increased in non-Alzheimer’s disease patients compared to other groups (P < 0.05) and correlated with amyloid-β-PET only in amyloid-β-positive cognitively impaired individuals (P = 0.005). Finally, plasma GFAP was associated with both longitudinal amyloid-β-PET and cognitive decline, and mediated the effect of amyloid-β-PET on tau-PET burden, suggesting that astrocytosis secondary to amyloid-β aggregation might promote tau accumulation.
Altogether, these findings indicate that plasma GFAP is an early marker associated with brain amyloid-β pathology but not tau aggregation, even in cognitively normal individuals with a normal amyloid-β status. This suggests that plasma GFAP should be incorporated in current hypothetical models of Alzheimer’s disease pathogenesis and be used as a non-invasive and accessible tool to detect early astrocytosis secondary to amyloid-β pathology.
Keywords: astrocytosis, GFAP, Aβ-PET, tau-PET, cognition
Pereira et al. show that plasma GFAP is an early and independent marker of astrocytosis associated with Aβ pathology. Plasma GFAP correlated with cognitive decline and mediated the effect of Aβ-PET on tau-PET burden, suggesting that astrocytosis secondary to Aβ aggregation may promote tau accumulation.
Introduction
There is increasing evidence suggesting that the pathogenesis of Alzheimer’s disease is not restricted to amyloid-β plaques and tau tangles but also includes strong interactions with immunological mechanisms.1 In line with this, astrocyte reactivity or astrocytosis is a well-known pathological process that is commonly found surrounding amyloid-β plaques in the brains of patients with Alzheimer’s disease.2 Although the exact role of astrocytosis is not clear, several studies have shown that reactive astrocytes penetrate amyloid-β plaques with their processes, possibly in an attempt to isolate the plaques from the surrounding neuropil and phagocytize them.3,4 This close relationship between astrocytes and plaques has been further supported by neuropathological reports showing that reactive astrocytes follow the same spatial distribution of amyloid-β plaques in the association cortex of patients with Alzheimer’s disease.5,6
In contrast to the association between astrocytosis and amyloid-β plaques, the relationship between reactive astrocytes and tau tangles has been less investigated. The few available studies that have assessed this showed that reactive astrocytes also interact with tau, but only in advanced stages of Alzheimer’s disease by penetrating the extracellular ghost tau tangles.7,8 In addition, it has also been found that the association between reactive astrocytes and tau tangles parallels the progression of Alzheimer's disease9; however, it is not clear whether this association is independent of amyloid-β plaques, which are normally present in the brains of patients with Alzheimer’s disease who have tau tangles.
Thanks to the development of biomarkers to measure astrocytosis, such as glial fibrillary acidic protein (GFAP), it is now possible to address this question and disentangle the underlying effects of reactive astrocytes on both amyloid-β and tau pathology in vivo. In particular, recent assays that allow the measurment of GFAP concentrations in the blood have already demonstrated the potential of plasma GFAP in distinguishing different stages of Alzheimer’s disease and detecting amyloid-β positivity on PET.10-18 However, no study has yet assessed whether plasma GFAP is also associated with tau-PET burden. Moreover, so far, it is not known whether astrocytosis is independently related to both amyloid-β and tau pathology, respectively, in vivo. This is important for several reasons including the fact that amyloid-β and tau pathology are not independent processes, showing a synergistic and complex interaction over the course of Alzheimer’s disease that may become exacerbated in the presence of other pathological processes such as astrocytosis.19 Thus, a better understanding of when reactive astrocytes emerge in the progression of Alzheimer’s disease and how they relate to the classic Alzheimer’s disease pathologies is crucial to determine their clinical value as diagnostic or prognostic tools as well as to inform the development of anti-inflammatory drugs in clinical trials.
Moreover, to our knowledge, no studies have yet compared the performance of plasma and CSF GFAP in detecting Alzheimer’s disease pathology to other glial markers such as the soluble triggering receptor expressed on myeloid cells 2 (sTREM2) or chitinase 3-like 1 (YKL-40). TREM2 is an innate immune receptor expressed by microglia, which is associated with cytokine release, phagocytosis, proliferation and migration.20 The Alzheimer’s disease-associated TREM2 variants seem to cause loss of function of TREM2 and reduce the ability of microglia to respond to toxic metabolites and clear them from the brain.21 Although initial studies examining the differences in CSF sTREM2 concentrations between patients with Alzheimer’s disease and healthy individuals did not show any differences,22 or showed reduced concentrations in patients with Alzheimer’s disease compared with healthy controls,23 later studies have found higher concentrations of CSF sTREM2 in patients with mild cognitive impairment and Alzheimer’s disease.24–29 On the other hand, YKL-40 is a secreted glycoprotein that is involved in the activation of the innate immune system as well as cell processes in relation to extracellular matrix remodelling.30–33 During neuroinflammatory processes, YKL-40 increases its expression in reactive astrocytes and microglial cells.34 Several studies have found that YKL-40 is increased in the CSF of patients with mild cognitive impairment and Alzheimer’s disease dementia as well as cognitively normal individuals with amyloid pathology.35–37 Moreover, YKL-40 levels have been found to be elevated in mutations carriers of autosomal dominant Alzheimer’s disease 15 to 19 years before estimated symptom onset, shortly after the beginning of brain amyloid accumulation.38
The aim of this study was to assess whether plasma and CSF GFAP concentrations change across different stages of Alzheimer’s disease, and investigate the independent relationships between these markers with amyloid-β and tau pathology measured using 18F-flutemetamol PET and 18F-RO948 PET, respectively. Moreover, we compared the performance of GFAP to CSF sTREM2 and CSF YKL-40 to detect amyloid-β and tau-PET pathology to determine the specificity of our findings. We also evaluated the prognostic ability of baseline GFAP markers to predict longitudinal changes in PET burden and cognitive decline. Finally, we conducted sensitivity analyses in a separate group of patients with non-Alzheimer’s disease disorders to assess the ability of GFAP markers to detect amyloid-β-positivity determined with CSF amyloid-β42/40.
Materials and methods
Participants
This study included 504 individuals from the Swedish BioFINDER-2 cohort (NCT03174938), a prospective study with the aim of developing new biomarkers for the early diagnosis of Alzheimer’s disease and other neurodegenerative disorders. All participants were recruited at Skåne University Hospital and the Hospital of Ängelholm in Sweden between 2017 and 2020, and included cognitively unimpaired controls, patients with mild cognitive impairment, Alzheimer’s disease dementia and non-Alzheimer’s disease disorders.40 Further details regarding the inclusion and exclusion criteria of the participant included in the different BioFINDER-2 cohorts can be found in the Supplementary material.
For the purposes of this study, only participants with baseline plasma and CSF levels of GFAP in addition to other glial markers (YKL-40, sTREM2), 18F-flutemetamol PET, 18F-RO948 PET and Mini-Mental State Examination scores (MMSE) were included. In addition, a subsample (n = 196) also underwent longitudinal PET imaging and cognitive assessments (n = 185). Finally, a group of 75 patients with non-Alzheimer’s disease neurodegenerative disorders without 18F-flutemetamol PET data was also included. This group included 21 patients with dementia with Lewy bodies, 14 patients with unspecified dementia, 12 with vascular dementia, 10 with frontotemporal dementia, six with progressive supranuclear palsy, five with Parkinson’s disease dementia, four with semantic dementia, one with progressive non-fluent aphasia, one with Parkinson’s disease without dementia and one with amyotrophic lateral sclerosis.
Plasma and CSF biomarkers
Plasma and CSF samples were collected in the morning during the same visit, with participants non-fasting.40 Blood was collected in six EDTA-plasma tubes and centrifuged (2000g, +4°C for 10 min). Following centrifugation, plasma was aliquoted into 1.5-ml polypropylene tubes (1 ml plasma in each tube) and stored at −80°C within 30–60 min of collection. CSF was collected by lumbar puncture and stored at −80°C in polypropylene tubes.40 The following assays were used to measure the different biomarkers of interest to this study: GFAP Simoa Discovery kits for HD-X (Quanterix®) for plasma GFAP; Elecsys assays (NeuroToolKit robust prototype, Roche Diagnostics) for CSF GFAP, YKL-40 and sTREM2; and Meso Scale Discovery immunoassays (MSD) for CSF amyloid-β42 and CSF amyloid-β40.40,41 Considering that GFAP in plasma and CSF were measured using different platforms we compared these assays to each other in a separate cohort, finding a high agreement in plasma (Supplementary material). In all participants, amyloid-β status was established using CSF amyloid-β42/40 levels with a previously established cut-off of 0.0752 defined with mixture modelling,42 because CSF amyloid-β42/40 was available in all cases (by study design), whereas amyloid-β-PET was only available in non-demented cases.40 We would like to highlight that the criteria for amyloid-β-PET availability was specific for the BioFINDER-2 cohort, which is the cohort we used in the current study (in BioFINDER-1, amyloid-β-PET scans were also available for Alzheimer’s disease demented cases).
Imaging acquisition and preprocessing
All participants underwent 18F-flutemetamol PET and 18F-RO948 PET on General Electrics Discovery MI scanners. 18F-flutemetamol PET images were acquired 90 to 110 min after injection of 185 MBq 18 F-flutemetamol and 18F-RO948 PET images were acquired 70 to 90 min after injection of 370 MBq 18F-RO948. Images were reconstructed using VPFX-S (ordered subset expectation maximization combined with corrections for time-of-flight and point spread function).
All 18F-flutemetamol and 18F-RO948 PET images were motion-corrected, time-averaged and coregistered to their corresponding skull stripped, longitudinally preprocessed T1-weighted images. 18F-Flutemetamol scans were normalized using a reference region that included the whole cerebellum, brainstem and eroded subcortical white matter,43 whereas 18F-RO948 images were normalized by a reference region consisting of the inferior cerebellar grey matter.44
For 18F-flutemetamol images, we calculated the standardized uptake value ratios (SUVRs) for a global composite region that included the caudal anterior cingulate, frontal, lateral parietal and lateral temporal gyri.43 In contrast, for 18F-RO948 PET images we calculated the SUVRs for three composite regions that corresponded to Braak stages I–II (entorhinal cortex), III–IV (parahippocampal, fusiform, amygdala, inferior temporal, middle temporal) and V–VI (posterior cingulate, caudal anterior cingulate, rostral anterior cingulate, precuneus, inferior parietal, superior parietal, insula, supramarginal, lingual, superior temporal, medial orbitofrontal, rostral middle frontal, lateral orbitofrontal, caudal middle frontal, superior frontal, lateral occipital, precentral gyrus, postcentral gyrus and paracentral gyrus).45 Finally, voxel-wise analyses were conducted using the preprocessed 18F-flutemetamol and 18F-RO948 PET images using the statistical parametric mapping software SPM12 (https://www.fil.ion.ucl.ac.uk/spm/) after applying a smoothing kernel of 8 mm.
Statistical analyses
Logarithmic or reciprocal transformations were applied to the variables that were not normally distributed. Then, a set of pairwise t-tests was used to compare plasma and CSF GFAP levels between amyloid-β-negative cognitively unimpaired, amyloid-β-positive cognitively unimpaired, amyloid-β-positive cognitively impaired, amyloid-β-negative cognitively impaired and non-Alzheimer’s disease patients, while adjusting for age and sex, and using CSF amyloid-β42/40 to determine the amyloid-β status.
To assess the ability of CSF and plasma GFAP markers to predict amyloid-β and tau pathology, we used two different approaches: one based on regions of interest and the other based on whole brain voxel-wise analyses. For the first approach, we built separate linear regression models with plasma or CSF GFAP as the dependent variable and global amyloid-β, tau stages I-II, tau stages III–IV or tau stages V–VI SUVRs as the outcome, controlling for age and sex. In all models, we verified that the residuals were normally distributed, there was no heteroscedasticity and no multicollinearity. For the second approach, we conducted voxel-wise regression analyses using plasma or CSF GFAP as the dependent variable and the smoothed preprocessed 18F-flutemetamol or 18F-RO948 PET images as the outcome, including age and sex as covariates. All region of interest-based and voxel-wise analyses were carried out in amyloid-β-negative cognitively unimpaired, amyloid-β-positive cognitively unimpaired, all cognitively unimpaired participants, amyloid-β-positive cognitively impaired and amyloid-β-negative cognitively impaired individuals.
For the PET variables showing a significant relationship with plasma and CSF GFAP, we performed three additional analyses. First, we built spline models46 to determine the trajectories of GFAP markers as a function of higher PET burden over the course of Alzheimer’s disease. Because of previous evidence showing that Alzheimer’s disease progresses from amyloid-β-negative cognitively unimpaired to amyloid-β-positive cognitively unimpaired and finally amyloid-β-positive cognitively impaired,47 we only included these groups in this analysis. Second, to determine the impact of astrocytosis on the relationship between the two classical Alzheimer’s disease hallmarks, we conducted mediation analyses to test whether the relationship between amyloid-β-PET and tau-PET burden could be explained by a mediation of GFAP, while controlling for age and sex. The significance of the mediation was assessed by calculating bias-corrected 95% confidence intervals (CIs) using bootstrapping (500 resamples). Third, to establish the area under the curve (AUC), sensitivity, specific and accuracy of GFAP markers in determining an amyloid-β-positive status, we calculated receiver operating curves using a bootstrap procedure with 1000 permutations in the groups who had 18F-flutemetamol PET data: all cognitively unimpaired participants, all cognitively impaired participants and in the whole sample. Since non-Alzheimer’s disease patients did not have 18F-flutemetamol scans, the analyses in this group were conducted using CSF amyloid-β42/40 to determine amyloid-β positivity. All receiver operating curve analyses included YKL-40 and sTREM2 to assess the value of GFAP with respect to other glial markers and their performance was compared using the DeLong test.
Finally, to test whether plasma and CSF GFAP markers were associated with longitudinal changes in cognition and PET burden we applied linear mixed effect models. These models used longitudinal MMSE scores or PET SUVRs as a dependent variable and the GFAP markers, time, age, sex as fixed effects. We also included the interaction between biomarker levels and time (together with the main effects), and random effects for intercepts. Separate models were built for plasma and CSF GFAP, which were ran in all cognitively unimpaired participants, all cognitively impaired individuals and in the whole sample. The models ran across the entire sample included amyloid-β and cognitive status as additional covariates. In addition, to assess whether the effects of GFAP on cognition were independent of amyloid-β-PET, longitudinal changes in amyloid-β-PET burden were also included as a covariate in a secondary analysis.
Statistical analyses were carried out using SPSS 25.0 (IBM Corp., Armonk, NY, USA), R (version 3.5.1) or SPM12. The analyses conducted in R and SPSS were adjusted for multiple comparisons using false discovery rate (FDR) corrections (q < 0.05, two-tailed).48 Similarly, the voxel-wise analyses using PET images were adjusted for multiple comparisons with topological FDR corrections in SPM12 (P < 0.05, two-tailed).49
Data availability
Anonymized data will be shared by request from a qualified academic investigator for the sole purpose of replicating procedures and results presented in the article and as long as data transfer is in agreement with EU legislation on the general data protection regulation and decisions by the Ethical Review Board of Sweden and Region Skåne, which should be regulated in a material transfer agreement.
Results
Study participants
In total, 504 participants were included in this study, of which 217 were amyloid-β-negative cognitively unimpaired, 71 were amyloid-β-positive cognitively unimpaired, 78 were amyloid-β-positive cognitively impaired (mild cognitive impairment or Alzheimer’s disease dementia), 63 were amyloid-β-negative cognitively impaired (mild cognitive impairment) and 75 had a non-Alzheimer’s disease neurodegenerative disorder (Table 1). There was a moderate correlation between plasma GFAP and CSF GFAP in the entire sample (r = 0.582, P < 0.001). Both plasma and CSF GFAP were positively associated with age (plasma GFAP: r = 0.528, P < 0.001; CSF GFAP: r = 0.602, P < 0.001) and females had higher plasma GFAP values compared to males [F(2,502) = 6.24, P = 0.013] in the whole sample.
Table 1.
Baseline sample characteristics
| CU Aβ− (n = 217) | CU Aβ+ (n = 71) | CI Aβ+ (n = 78) | CI Aβ− (n = 63) | Non-AD (n = 75) | P-value | |
|---|---|---|---|---|---|---|
| Age | 63.8 (41.2–87.9) | 72.1 (51.0–88.7) | 73.0 (53.7–93.3) | 67.9 (45.2–83.4) | 73.5 (52.5–87.3) | <0.001 |
| Sex, male/female | 98/119 | 35/36 | 34/44 | 36/27 | 50/25 | 0.369 |
| Education | 12.4 (6–25) | 11.5 (7–19) | 13.0 (6–33) | 11.9 (7–20) | 11.6 (7–22) | 0.069 |
| MMSE | 28.9 (26–30) | 28.9 (24–30) | 26.5 (18–30) | 27.3 (23–30) | 23.1 (10–30) | <0.001 |
| APOE ε4 (%) | 38.7 | 70.4 | 76.9 | 28.6 | 31 | <0.001 |
| CSF Aβ42/40 | 1.1 (0.8–1.4) | 0.55 (0.3–0.7) | 0.52 (0.3–0.7) | 1.1 (0.8–1.5) | 0.92 (0.4–1.3) | <0.001 |
| Plasma GFAP (pg/ml) | 179.6 (31.1–534.9) | 252.1 (86.1–672.9) | 262.6 (94.0–650.7) | 166.9 (24.5–476.0) | 241.7 (76.6–823.7) | <0.001 |
| CSF GFAP (pg/ml) | 13.5 (4.3–34.6) | 16.1 (5.8–35.1) | 17.7 (5.5–35.6) | 14.7 (5.4–31.2) | 18.4 (8.2–40.6) | <0.001 |
| CSF YKL40 (ng/ml)a | 162.0 (38.3–458.2) | 211.2 (80.9–374.8) | 220.3 (63.9–523.5) | 184.6 (68.1–371.0) | 221.1 (79.3–517.8) | <0.001 |
| CSF sTREM2 (ng/ml)b | 10.3 (4.9–22.9) | 12.3 (4.7–21.9) | 11.5 (5.5–29.6) | 10.8 (6.2–24.7) | 12.2 (6.7–20.1) | <0.001 |
| Global | 0.61 (0.5–0.9) | 0.85 (0.6–1.3) | 1.0 (0.6–1.4) | 0.62 (0.5–0.7) | – | <0.001 |
| Aβ-PET SUVR | ||||||
| Braak I–II | 1.1 (0.8–1.4) | 1.28 (0.9–1.9) | 1.6 (1.0–3.1) | 1.13 (0.9–1.5) | 1.3 (0.8–3.3) | <0.001 |
| Tau-PET SUVR | ||||||
| Braak III–IV | 1.1 (0.9–1.3) | 1.20 (1.0–1.6) | 1.5 (1.0–3.2) | 1.14 (0.8–1.3) | 1.2 (0.9–2.0) | <0.001 |
| Tau-PET SUVR | ||||||
| Braak V–VI | 1.0 (0.8–1.3) | 1.0 (0.8–1.2) | 1.2 (0.9–1.8) | 1.02 (0.7–1.2) | 1.0 (0.7–1.5) | <0.001 |
| Tau-PET SUVR |
Data are presented as median (range). P-values were derived from Kruskal–Wallis tests for continuous non-normally distributed measures and chi-squared tests for categorical measures. Aβ = amyloid-β; AD = Alzheimer's disease; CI = cognitively impaired; CU = cognitively unimpaired.
YKL-40 values were missing for two participants (one cognitively unimpaired amyloid-β-positive, one cognitively impaired amyloid-β-positive).
sTREM2 values were missing for two participants (one cognitively impaired amyloid-β-positive, one non-Alzheimer’s disease).
Plasma GFAP is associated with early amyloid-β pathology
Our findings revealed that plasma GFAP concentration was lowest in amyloid-β-negative cognitively impaired, followed by amyloid-β-negative cognitively unimpaired, amyloid-β-positive cognitively unimpaired and amyloid-β-positive cognitively impaired individuals (Fig. 1A). The group comparisons showed that both amyloid-β-positive cognitively unimpaired and cognitively impaired individuals showed elevated plasma GFAP levels compared to the amyloid-β-negative cognitively unimpaired group [F(2,286) = 8.33, P = 0.004, F(2,293) = 12.90, P < 0.001, respectively] and to the amyloid-β-negative cognitively impaired group [F(2,132) = 18.06, P < 0.001; F(2,139) = 24.14, P < 0.001, respectively]. These findings indicate that plasma GFAP is elevated in individuals with amyloid-β pathology.
Figure 1.
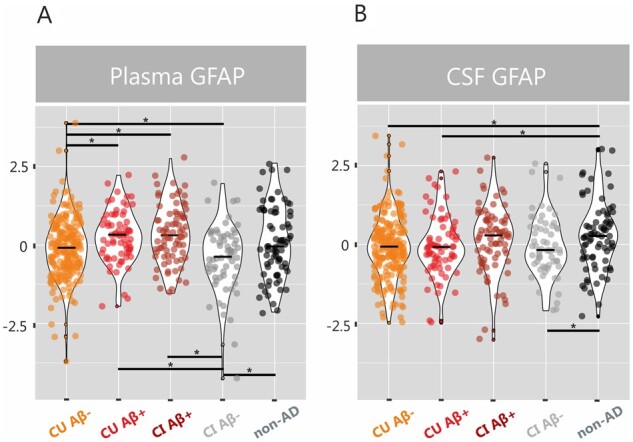
Plasma and CSF GFAP concentrations are increased in amyloid-β-positive groups. Violin plots with median values for plasma and CSF GFAP (z-scores) in amyloid-β-negative cognitively unimpaired individuals (CU Aβ−), amyloid-β-positive cognitively unimpaired individuals (CU Aβ+), amyloid-β-positive cognitively impaired individuals (CI Aβ+), amyloid-β-negative cognitively impaired individuals (CI Aβ−) and non-Alzheimer’s disease disorders, after adjusting for age and sex. *Significant group differences after adjusting for multiple comparisons with FDR corrections (q < 0.05).
In contrast to plasma GFAP, CSF GFAP was significantly elevated in patients with a non-Alzheimer’s disease disorder compared to both amyloid-β-negative cognitively unimpaired individuals [F(2,290) = 9.61, P = 0.002] and amyloid-β-positive cognitively unimpaired individuals [F(2,144) = 5.71, P = 0.018] (Fig. 1B). These findings suggest that CSF GFAP might be sensitive to different underlying pathological processes unrelated to Alzheimer’s disease and might be better suited for the detection of non-Alzheimer’s disease disorders.
Plasma and CSF GFAP concentrations are associated with amyloid-β-PET independently of tau-PET burden
To assess whether GFAP biomarkers were associated with the severity of amyloid-β deposition, we built linear regression models using global amyloid-β-PET SUVR values as the outcome in addition to plasma or CSF GFAP as the predictors. We found that increasing GFAP levels in plasma were associated with greater global amyloid-β-PET burden in all cognitively unimpaired individuals (t = 4.24, P < 0.001) (Fig. 2A), amyloid-β-negative cognitively unimpaired individuals (t = 2.31, P = 0.022) (Fig. 2B), amyloid-β-positive cognitively unimpaired individuals (t = 2.11, P = 0.039) (Fig. 2C) and amyloid-β-positive cognitively impaired individuals (t = 2.88, P = 0.005) (Fig. 2D). These results were further confirmed by the voxel-wise analyses, which showed that plasma GFAP correlated with higher amyloid-β-PET deposition in several neocortical regions in all cognitively unimpaired individuals (Fig. 3A) as well as in amyloid-β-positive cognitively unimpaired individuals (Fig. 3B). In contrast to plasma GFAP, CSF GFAP only showed a significant association with higher amyloid-β-PET deposition in amyloid-β-positive cognitively impaired participants (t = 2.92, P = 0.005) (Fig. 2E). To determine whether these results were independent of tau pathology, we repeated all of these analyses including tau-PET SUVR values of different Braak stage regions of interest as covariates. These analyses showed that amyloid-β-PET burden was still related to increased plasma GFAP in the same groups (all cognitively unimpaired individuals: t = 4.50, P < 0.001; amyloid-β-negative cognitively unimpaired individuals: t = 2.70, P = 0.007; amyloid-β-positive cognitively unimpaired individuals: t = 2.32, P = 0.024; amyloid-β-positive cognitively impaired individuals: t = 2.08, P = 0.041) and to increased CSF GFAP in amyloid-β-positive cognitively impaired individuals (t = 2.18, P = 0.032), after controlling for tau-PET.
Figure 2.

Plasma and CSF GFAP concentrations are associated with amyloid-β-PET independently of tau-PET burden. Results of the linear regression analyses showing a significant relationship between amyloid-β burden measured on PET (Aβ-PET) (z-scores) and plasma GFAP (z-scores) in (A) all cognitively unimpaired individuals (CU), (B) amyloid-β-negative cognitively unimpaired individuals (CU Aβ−), (C) amyloid-β-positive cognitively unimpaired individuals (CU Aβ+), and (D) amyloid-β-positive cognitively impaired individuals (CI Aβ+), after adjusting for age and sex. In addition, a significant relationship between amyloid-β-PET and CSF GFAP (z-scores) was also found in (E) amyloid-β-positive cognitively unimpaired individuals (CU Aβ+). The top panel shows correlation plots between amyloid-β-PET and GFAP markers, whereas the bottom panel shows box plots depicting how amyloid-β-PET values vary according to GFAP quartiles. All associations remained significant after controlling for tau-PET burden.
Figure 3.
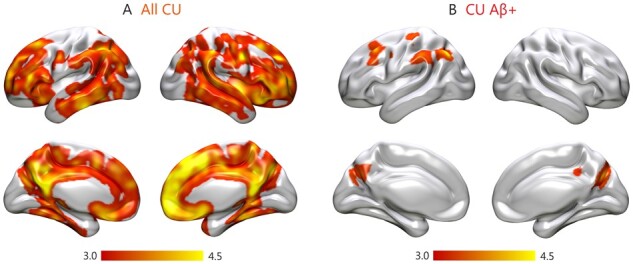
Voxel-wise associations between plasma GFAP and amyloid-β-PET. Results of the voxel-wise regression analyses showing a significant relationship between amyloid-β burden measured on PET images and plasma GFAP in (A) all cognitively unimpaired individuals (CU) and (B) amyloid-β-positive cognitively unimpaired individuals (CU Aβ+), and (D) amyloid-β-positive cognitively impaired individuals (CI Aβ+), after adjusting for age and sex. All results were adjusted for multiple comparisons using FDR (q < 0.05).
To assess whether the GFAP biomarkers were associated with the severity of tau deposition, we built linear regression models using the tau-PET SUVR values across different Braak stage regions of interest as the outcome in addition to plasma or CSF GFAP as the predictors. We found that increasing plasma GFAP levels were only associated with tau-PET burden across Braak stages III–IV and V–VI in amyloid-β-positive cognitively impaired individuals (III–IV: t = 2.86, P = 0.006; V–VI: t = 2.97, P = 0.004). However, these associations lost their significance after including global amyloid-β-PET as a covariate (III–IV: t = 1.60, P = 0.114; V–VI: t = 2.00, P = 0.050), indicating that they were not independent of amyloid-β pathology.
Plasma GFAP concentration shows early increases with amyloid-β-PET burden
To determine the trajectories of plasma and CSF GFAP concentrations over the course of Alzheimer’s disease, we fitted spline models for these markers using global amyloid-β-PET SUVR as a proxy for time. These analyses did not include non-Alzheimer’s disease patients or amyloid-β-negative cognitively impaired individuals since they are not considered to be part of the Alzheimer’s disease spectrum.47 The results of these analyses revealed that both models were significant, with the one having plasma GFAP as a predictor showing a better model fit (r2: 0.21, P < 0.001) compared to the one with CSF GFAP (r2: 0.14, P < 0.001). These differences between models were statistically significant (F = 15.92, P < 0.001). The trajectories of these models revealed initial increases for both plasma GFAP (Fig. 4A) and CSF GFAP (Fig. 4B), which continued rising after reaching the threshold for amyloid-β-PET positivity and then later came to a plateau. Despite showing similar trajectories, when we compared the splines of plasma and CSF GFAP, we could observe that plasma GFAP showed steeper initial increases, overcoming CSF GFAP levels even before amyloid-β-PET positivity (Fig. 4C). These results indicate that plasma GFAP might exhibit greater changes with increasing amyloid-β pathology during Alzheimer’s disease compared to CSF GFAP.
Figure 4.

Plasma GFAP shows early increases with amyloid-β-PET burden. Spline models showing the trajectories for (A) plasma GFAP and (B) CSF GFAP using global amyloid-β-PET SUVR as a proxy for time. Both models were significant; however, when the splines of plasma and CSF GFAP were compared, plasma GFAP showed steeper initial increases, overcoming CSF GFAP levels even before amyloid-β-PET positivity (C). Aβ = amyloid-β.
Plasma GFAP may partially mediate the relationship between amyloid-β-PET and tau-PET over the course of Alzheimer’s disease
To further investigate the role of astrocytosis in relation to the classical Alzheimer’s disease pathologies over the course of the disease we conducted mediation analyses in all cognitively unimpaired participants as well as amyloid-β-positive cognitively impaired individuals. These analyses showed that plasma GFAP mediated the effect between global amyloid-β-PET and both tau-PET stages I–II (−0.027, 95% CI: 0.00 to −0.056, P = 0.035) and stages III–IV (−0.027, 95% CI: −0.056 to −0.01, P = 0.010) in cognitively unimpaired individuals. Moreover, plasma GFAP also mediated the effects between global amyloid-β-PET and tau-PET stages V–VI (0.131, 95% CI: 0.00 to 0.33, P = 0.046) in cognitively impaired individuals. These findings indicate that astrocytosis secondary to amyloid-β accumulation might be one the factors contributing to tau accumulation in Alzheimer’s disease.
Plasma GFAP identifies an amyloid-β-positive status more accurately than CSF GFAP and other glial markers
To determine the performance of the glial biomarkers (GFAP, YKL-40 and sTREM2) to detect amyloid-β positivity, we conducted receiver operating curve analyses in the whole sample, all cognitively unimpaired individuals, all cognitively impaired individuals as well as non-Alzheimer’s disease patients, regardless of their amyloid-β status, which were defined using amyloid-β-PET or CSF amyloid-β42/40 (non-Alzheimer’s disease patients only) (Table 2). These analyses showed that plasma GFAP showed an AUC of 0.761 in the whole sample (Fig. 5A), 0.754 in all cognitively unimpaired individuals (Fig. 5B), 0.779 in all cognitively impaired individuals (Fig. 5C) and 0.755 in non-Alzheimer’s disease patients (Fig. 5D). These performances were significantly better than the ones achieved by CSF GFAP (Z = 2.68, P = 0.007), CSF sTREM2 (Z = 3.31, P < 0.001) and almost CSF YKL-40 (Z = 1.77, P = 0.077) in the whole sample; by CSF GFAP (Z = 2.24, P = 0.024) in cognitively unimpaired individuals; by CSF GFAP (Z = 2.24, P = 0.025), CSF sTREM2 (Z = 3.08, P = 0.002) and CSF YKL-40 (Z = 2.72, P = 0.006) in cognitively impaired individuals and by CSF YKL-40 (Z = 2.42, P = 0.016) and almost CSF sTREM2 (Z = 1.80, P = 0.072) in non-Alzheimer’s disease patients. Altogether, these analyses indicate that plasma GFAP can detect an amyloid-β-positive status more accurately than the other glial markers.
Table 2.
Diagnostic accuracy of plasma and CSF biomarkers to detect amyloid-β positivity on PET or CSF amyloid-β42/40
| AUC | Accuracy | Sensitivity | Specificity | |
|---|---|---|---|---|
| Whole sample | ||||
| Plasma GFAP | 0.761 | 70.6% | 71.3% | 70.4% |
| CSF GFAP** | 0.694 | 60.1% | 81.2% | 51.8% |
| CSF sTREM2*** | 0.643 | 61.5% | 68.6% | 58.6% |
| CSF YKL-40 | 0.706 | 59.5% | 83.5% | 50.0% |
| All cognitively unimpaired individuals | ||||
| Plasma GFAP | 0.754 | 70.8% | 73.1% | 70.3% |
| CSF GFAP* | 0.675 | 66.0% | 67.3% | 65.7% |
| CSF sTREM2 | 0.699 | 61.8% | 78.9% | 58.1% |
| CSF YKL-40 | 0.735 | 57.5% | 88.5% | 50.6% |
| All cognitively impaired individuals | ||||
| Plasma GFAP | 0.779 | 70.9% | 71.4% | 70.4% |
| CSF GFAP* | 0.679 | 65.3% | 87.1% | 43.7% |
| CSF sTREM2** | 0.601 | 61.4% | 73.9% | 49.3% |
| CSF YKL-40** | 0.639 | 62.9% | 81.2% | 45.1% |
| Non-Alzheimer’s disease patients | ||||
| Plasma GFAP | 0.755 | 70.0% | 83.3% | 62.8% |
| CSF GFAP | 0.624 | 73.3% | 29.2% | 94.1% |
| CSF sTREM2 | 0.526 | 60.0% | 58.3% | 60.8% |
| CSF YKL-40* | 0.585 | 58.1% | 66.7% | 54.0% |
The analyses conducted in the whole sample, cognitively unimpaired and cognitively impaired individuals were performed using amyloid-β-PET, whereas the analyses conducted in a separate non-Alzheimer’s disease group were performed using CSF amyloid-β42/40.
P < 0.05 versus plasma GFAP.
P < 0.01 versus plasma GFAP.
P < 0.001 versus plasma GFAP.
Figure 5.

Plasma GFAP has a greater diagnostic accuracy in identifying an amyloid-β-positive status compared to other glial markers. Results of the receiver-operating curve analyses showing that plasma GFAP showed a better classification performance in distinguishing amyloid-β-PET-positive from amyloid-β-PET-negative individuals in (A) the whole sample, (B) all cognitively unimpaired individuals (CU) and (C) all amyloid-β-positive cognitively impaired individuals (CI). Moreover, plasma GFAP also showed a better classification performance in distinguishing patients with abnormal and normal CSF amyloid-β42/40 levels in a group of patients with non-Alzheimer’s disease disorders (D). AD = Alzheimer's disease; AUC = area under the curve.
Plasma GFAP concentration is associated with longitudinal amyloid-β accumulation determined by PET
For the subsample that underwent longitudinal amyloid-β-PET [n = 196, number of visits: median = 2, follow-up time: median = 1.7 years, interquartile range (IQR) = 0.3], we used linear mixed models to evaluate whether the GFAP markers were also associated with amyloid-β changes over time in a neocortical composite region. These analyses showed that plasma GFAP predicted longitudinal amyloid-β deposition in the whole sample (t = 2.888, P = 0.004) (Fig. 6A), whereas CSF GFAP did not (t = 1.478, P = 0.141), after controlling for age, sex, baseline amyloid-β status and presence of cognitive impairment. Notably, these analyses remained significant after adjusting also for tau-PET burden (t = 2.905, P = 0.004), indicating they were independent of tau pathology. However, no significant results when the analyses were conducted in the cognitively unimpaired and cognitively impaired groups separately.
Figure 6.

Relationship between plasma and CSF GFAP with longitudinal amyloid-β accumulation and cognitive decline. Predicted trajectories for longitudinal amyloid-β (Aβ) accumulation determined by PET and MMSE scores (z-scores) in relation to plasma and CSF GFAP in the whole sample, after adjusting for covariates. The models were fit using continuous GFAP values but for illustration purposes the plots show the trajectories for individuals with high and low plasma GFAP for longitudinal amyloid-β-PET (A) and longitudinal MMSE (B) as well as for individuals with high and low CSF GFAP for longitudinal MMSE (C). All results were adjusted for multiple comparisons using FDR (q < 0.05).
Plasma and CSF GFAP concentrations are associated with longitudinal cognitive decline
For the subsample that underwent longitudinal cognitive assessment (total n = 185, cognitively unimpaired = 133, cognitively impaired = 52, number of visits: median = 3, follow-up time: median = 1.9 years, IQR = 0.7), we also used linear mixed models to evaluate whether the GFAP markers were associated with cognitive changes over time. These analyses showed that both plasma GFAP and CSF GFAP predicted cognitive decline in the whole cohort, even after adjusting for longitudinal amyloid-β-PET changes (plasma GFAP: t = −3.303, P = 0.001; CSF GFAP: t = −2.485, P = 0.014) (Fig. 6B and C). These results indicate that, in addition to being a marker of amyloid-β pathology, astrocytosis could have an independent negative impact on longitudinal cognition. No significant results were found when the analyses were conducted in the cognitively unimpaired and cognitively impaired groups separately.
Discussion
Although emerging evidence suggests that inflammation has a causal role in Alzheimer’s disease,11–18 the detection of inflammatory markers has not yet been established as a valuable method for the early diagnosis and monitoring of patients with Alzheimer’s disease.1 Our findings show that plasma GFAP holds great potential as an early and specific marker of amyloid-β deposition even during the earliest stages of Alzheimer’s disease. Moreover, we found that plasma GFAP was a prognostic marker of both longitudinal amyloid-β accumulation and cognitive decline and a mediator of the effects of amyloid-β-PET on tau-PET burden. In light of the invasiveness of lumbar punctures for CSF and the high cost of PET imaging, our findings suggest that plasma GFAP could become a widely available screening tool to identify astrocytosis in early Alzheimer’s disease. Moreover, it could also be used to evaluate the effects of anti-amyloid-β therapies on glial activation as well as to better understand the role of astrocytosis over the course of Alzheimer’s disease.
Activated glia in the form of reactive astrocytes is one of the most prominent neuropathological features of Alzheimer’s disease, being normally found surrounding amyloid-β plaques in post-mortem brain tissue.50 The role of these reactive astrocytes has been debated over the past few years, with some studies suggesting they are part of an endogenous defensive mechanism to eliminate the plaques, whereas others defend that their persistent activation induces a toxic inflammatory process that contributes to worsening Alzheimer’s disease progression.51 Regardless of their role, several studies have used biomarkers such as GFAP to measure astrocytosis in vivo in the CSF or more recently in the blood plasma. Although studies assessing GFAP in CSF have reported somewhat inconsistent findings across different stages of Alzheimer’s disease,52,53 recent studies on plasma GFAP showed more promising results. In particular, elevated plasma GFAP was recently found in participants with subjective cognitive decline, mild cognitive impairment and Alzheimer’s disease dementia with a positive amyloid-β-PET scan.15 In addition, an association between longitudinal plasma GFAP and conversion to dementia was also found in a prospective clinical cohort, highlighting its potential value as a prognostic tool.54 In the current study, we extend these previous findings by showing that plasma GFAP is not only elevated in participants with amyloid-β pathology but also correlates with continuous amyloid-β-PET values, even in individuals with normal CSF amyloid-β42/40 levels. Interestingly, when we conducted our analyses at the voxel-level we found that elevated plasma GFAP was associated with higher amyloid-β-PET burden in neocortical regions where amyloid-β accumulation is normally observed in Alzheimer’s disease both in all cognitively unimpaired as well as amyloid-β-positive cognitively unimpaired individuals. This result is in agreement with previous studies showing that astrocytes show dynamic changes over the course of Alzheimer's disease, with reactive astrocytes being more prominent in earlier disease stages.51 In addition, this result is also in line with a previous report showing that reactive astrocytes follow the same spatial distribution of amyloid-β plaques in the association cortex of patients with Alzheimer’s disease.5
Compared to amyloid-β plaques, the potential associations between reactive astrocytes and neurofibrillary tangles have been much less studied. Immunohistochemical and electron microscopy studies have shown that reactive astrocytes can also penetrate with their processes the extracellular ghost tangles in the midst of the neuropil in advanced Alzheimer’s disease.7,8 Moreover, in another study, a significant linear rise of astrocytosis in the vicinity of neurofibrillary tangles was found with increasing Alzheimer’s disease progression, although this relationship was weaker than the one observed between astrocytosis and amyloid-β plaques.55 Finally, in a study using autoradiography, tau deposits were observed in similar brain areas as activated astrocytes, supporting a pathological interconnection.56 To our knowledge, no studies have assessed whether astrocytic markers such as plasma and CSF GFAP are associated with in vivo regional tau-PET pathology in the course of Alzheimer’s disease. Here, we show that greater tau-PET signal in middle and late Braak stages was associated with increasing plasma GFAP in amyloid-β-positive cognitively impaired individuals. However, when these associations were adjusted for amyloid-β-PET burden their significance was lost, in contrast to the correlations between plasma GFAP and amyloid-β-PET, which remained unchanged after adjusting for tau-PET signal. These findings indicate that astrocytosis measured by initial increases in GFAP is specifically associated with amyloid-β pathology, challenging previous assumptions that both amyloid-β and tau pathology can trigger reactive astrocytes in Alzheimer’s disease.6,55
In contrast to plasma GFAP, CSF GFAP was only associated with amyloid-β pathology in cognitively impaired individuals, showed less-steep increases with increasing amyloid-β-PET burden in the spline models, and was significantly elevated in patients with non-Alzheimer’s disease disorders. These findings suggest that plasma and CSF GFAP might be measuring partially different pathological processes, with the former being more closely related to abnormal amyloid-β accumulation due to Alzheimer’s disease, whereas the latter also incorporating other neuroinflammatory changes unrelated to amyloid-β pathology. Moreover, together with sTREM2 and YKL-40, CSF GFAP showed a lower sensitivity and specificity in detecting amyloid-β positivity compared to plasma GFAP. In fact, the ability of plasma GFAP to identify amyloid-β-PET or CSF amyloid-β42/40 pathology was quite consistent across the whole sample, cognitively unimpaired individuals, cognitively impaired individuals and non-Alzheimer’s disease disorders with an AUC above 0.75 in all cases. These results were somewhat worse than the values obtained in two previous studies using plasma GFAP to identify a positive amyloid PET scan. In one of these studies, the analyses were conducted in cognitively normal individuals resulting in an AUC of 0.79.15 In another study, the analyses were performed in a sample of patients with subjective cognitive complaints, mild cognitive impairment and Alzheimer’s disease dementia resulting in an AUC of 0.81.17 The differences between our results and the ones of previous studies could potentially be related to differences in cohort characteristics. For example, in the study by Verberk et al.,17 the higher AUC value was obtained when the analyses were conducted across the entire cohort, which had many patients with Alzheimer’s disease dementia (n = 132), in contrast to our sample, which included very few Alzheimer’s disease dementia cases due to the study design (almost all patients with Alzheimer’s disease did not undergo amyloid PET imaging in BioFINDER-2). Altogether, our results indicate that plasma GFAP can be reliably used to detect amyloid-β-positivity across different disease stages as well as non-Alzheimer’s disease disorders. The differences between plasma and CSF GFAP could be related to different clearance pathways of the molecule into the biofluids. For instance, astrocytic end-feet projections to the neurovascular unit may provide a direct clearance pathway of the molecule into the bloodstream, and there may also be relationships with vascular amyloid pathology, which is common in Alzheimer’s disease.57
Regarding the prognostic value of GFAP, we found that both CSF and plasma predicted global cognitive decline to the same degree, even after adjusting for changes in amyloid-β-PET accumulation. It has been previously suggested that, although glial responses are initially triggered by amyloid-β burden, they can become progressively independent of amyloid-β with disease progression and contribute to neurodegenerative and cognitive changes.55 Our findings seem to confirm this assumption as the associations between plasma GFAP and cognitive decline were still significant after adjusting for amyloid-β-PET burden, indicating that astrocytosis has a negative impact on cognition that goes beyond its link to amyloid-β pathology, in line with the findings of a recent longitudinal study.54 This suggests that astrocytosis may play a role in promoting cognitive deterioration in Alzheimer’s disease and that therapies targeting this neuroinflammatory process could at least partially ameliorate cognitive symptoms. In addition, regarding longitudinal amyloid-β accumulation, we found that plasma GFAP was a better predictor of amyloid-β-PET burden over time, even after controlling for tau-PET signals, suggesting that plasma GFAP is a more sensitive tool to identify not only baseline but also future amyloid-β pathology. Finally, our mediation analyses revealed that plasma GFAP also mediated the associations between amyloid-β-PET and tau-PET in cognitively unimpaired and cognitively impaired individuals in a stage-dependent manner, indicating that astrocytosis might be contributing to tau accumulation, although this effect is not independent of amyloid-β pathology. These findings should be interpreted with caution since the mediation analysis does not allow inferring a direct causal relationship between variables, it only assesses whether amyloid PET influences plasma GFAP, which in turn influences tau-PET. Thus, this analysis shows that plasma GFAP can be used to at least partially clarify the nature of the relationship between amyloid and tau. However, these findings should be confirmed by future studies in independent cohorts. If they are confirmed, they could have important implications for current treatments in Alzheimer’s disease and suggest that a combination of anti-amyloid therapies with anti-inflammatory treatments could potentially reduce the formation of tau aggregates.
Our study has several strengths, including the large number of participants with several glial biomarkers and longitudinal amyloid-β-PET, longitudinal tau-PET and global cognition. However, a few limitations should also be recognized, such as the fact that we did not have serial longitudinal measures of plasma and CSF GFAP, which would have been useful to determine their trajectories over the course of Alzheimer’s disease and determine their potential clinical value as longitudinal monitoring tools. At the time of the study, there was only one follow-up available for amyloid-β-PET and two follow-ups available for cognition within a period of ∼2 years. This may have limited our ability to detect stronger effects since a longer time period may be required to observe more prominent amyloid-β-PET and cognitive changes. Finally, the inclusion of a PET imaging tracer such as 11C-deuterium-l-deprenyl58 would have been interesting to include to assess the relationship between plasma GFAP and regional brain astrocytosis.
In summary, here we show that baseline plasma GFAP seems to be a very early marker of astrocytosis associated with amyloid-β pathology suggesting it can be used to detect baseline amyloid-β positivity and predict future amyloid-β accumulation and cognitive decline. In addition, contrary to previous assumptions, astrocytosis measured with GFAP was not associated with tau pathology after controlling for amyloid-β, indicating it is not only an early but also a quite specific marker for amyloid-β pathology. Although current models of Alzheimer’s disease have adopted a neurocentric view that starts with amyloid-β accumulation, followed by tau deposition and neurodegeneration, it is well known that neurons cannot function properly without the proper support of glial cells such as astrocytes.31 Thus, our findings highlight the importance of including astroglial markers in the cascade of pathological changes occurring in Alzheimer’s disease, particularly plasma GFAP, which could potentially be used as a non-invasive tool to evaluate the effects of anti-amyloid-β drugs or anti-inflammatory treatments on astrocytosis in clinical trials.
Funding
The Swedish BioFINDER-2 study was supported by the Swedish Research Council (2016–00906 and 2018–02052), the Knut and Alice Wallenberg foundation (2017–0383), the Marianne and Marcus Wallenberg foundation (2015.0125), the Strategic Research Area MultiPark (Multidisciplinary Research in Parkinson’s disease) at Lund University, the Swedish Alzheimer Foundation (AF-939932), the Swedish Brain Foundation (FO2019-0326), The Parkinson foundation of Sweden (1280/20), the Skåne University Hospital Foundation (2020-O000028), Regionalt Forskningsstöd (2020–0314) and the Swedish federal government under the ALF agreement (2018-Projekt0279). The precursor of 18F-flutemetamol was sponsored by GE Healthcare. The precursor of 18F-RO948 was provided by Roche. J.B.P. is supported by grants from the Swedish Research Council (#2018–02201), The Center for Medical Innovation (#20200695), a Senior Researcher Position grant at Karolinska Institute, Gamla Tjänarinnor and Stohnes. K.B. is supported by the Swedish Research Council (#2017–00915), the Alzheimer Drug Discovery Foundation (ADDF), USA (#RDAPB-201809–2016615), the Swedish Alzheimer Foundation (#AF-742881), Hjärnfonden, Sweden (#FO2017-0243), the Swedish state under the agreement between the Swedish government and the County Councils, the ALF agreement (#ALFGBG-715986) and European Union Joint Program for Neurodegenerative Disorders (JPND2019-466–236). H.Z. is a Wallenberg Scholar supported by grants from the Swedish Research Council (#2018–02532), the European Research Council (#681712), Swedish State Support for Clinical Research (#ALFGBG-720931) and the UK Dementia Research Institute at UCL.
Competing interests
S.P. has served at scientific advisory boards for Geras Solutions and Hoffmann-La Roche. H.Z. has served at scientific advisory boards for Denali, Roche Diagnostics, Wave, Samumed and CogRx, has given lectures in symposia sponsored by Fujirebio, Alzecure and Biogen, and is a co-founder of Brain Biomarker Solutions in Gothenburg AB, a GU Ventures-based platform company at the University of Gothenburg. K.B. has served as a consultant or at advisory boards for Abcam, Axon, Biogen, Lilly, MagQu, Novartis and Roche Diagnostics, and is a co-founder of Brain Biomarker Solutions in Gothenburg AB, a GU Venture-based platform company at the University of Gothenburg. O.H. has acquired research support (for the institution) from AVID Radiopharmaceuticals, Biogen, Eli Lilly, Eisai, GE Healthcare, Pfizer and Roche. In the past 2 years, he has received consultancy/speaker fees from AC Immune, Alzpath, Biogen, Cerveau and Roche. All other authors report no competing interests.
Supplementary material
Supplementary material is available at Brain online.
Supplementary Material
Glossary
- MMSE
Mini-Mental State Examination
- SUVR
standardized uptake value ratio
References
- 1. Heneka MT, Carson MJ, El Khoury J, et al. Neuroinflammation in Alzheimer's disease. Lancet Neurol. 2015;14(4):388–405. [DOI] [PMC free article] [PubMed] [Google Scholar]
- 2. Osborn LM, Kamphuis W, Wadman WJ, Hol EM.. Astrogliosis: An integral player in the pathogenesis of Alzheimer's disease. Prog Neurobiol. 2016;144:121–141. [DOI] [PubMed] [Google Scholar]
- 3. Itagaki S, McGeer PL, Akiyama H, Zhu S, Selkoe D.. Relationship of microglia and astrocytes to amyloid deposits of Alzheimer disease. J Neuroimmunology. 1989;24(3):173–182. [DOI] [PubMed] [Google Scholar]
- 4. Frost GR, Li YM.. The role of astrocytes in amyloid production and Alzheimer's disease. Open Biol. 2017;7(12):170228. [DOI] [PMC free article] [PubMed] [Google Scholar]
- 5. Beach TG, McGeer EG.. Lamina-specific arrangement of astrocytic gliosis and senile plaques in Alzheimer's disease visual cortex. Brain Res. 1988;463(2):357–361. [DOI] [PubMed] [Google Scholar]
- 6. Perez-Nievas BG, Serrano-Pozo A.. Deciphering the astrocyte reaction in Alzheimer’s disease. Front Aging Neurosci. 2018;10:114. [DOI] [PMC free article] [PubMed] [Google Scholar]
- 7. Ikeda K, Haga C, Akiyama H, Kase K, Iritani S.. Coexistence of paired helical filaments and glial filaments in astrocytic processes within ghost tangles. Neurosci Lett. 1992;148(1-2):126–128. [DOI] [PubMed] [Google Scholar]
- 8. Ikeda K, Haga C, Oyanagi S, Iritani S, Kosaka K.. Ultrastructural and immunohistochemical study of degenerate neurite-bearing ghost tangles. J Neurol. 1992;239(4):191–194. [DOI] [PubMed] [Google Scholar]
- 9. Simpson JE, Ince PG, Lace G, et al. ; MRC Cognitive Function and Ageing Neuropathology Study Group. Astrocyte phenotype in relation to Alzheimer-type pathology in the ageing brain. Neurobiol Aging. 2010;31(4):578–590. [DOI] [PubMed] [Google Scholar]
- 10. Rajan KB, Aggarwal NT, McAninch EA, et al. Remote blood biomarkers of longitudinal cognitive outcomes in a population study. Ann Neurol. 2020;88(6):1065–1076. [DOI] [PMC free article] [PubMed] [Google Scholar]
- 11. Oeckl P, Halbgebauer S, Anderl-Straub S, et al. ; Consortium for Frontotemporal Lobar Degeneration German. Glial fibrillary acidic protein in serum is increased in Alzheimer’s disease and correlates with cognitive impairment. J Alzh Dis. 2019;67(2):481–488. [DOI] [PubMed] [Google Scholar]
- 12. Elahi FM, Casaletto KB, La Joie R, et al. Plasma biomarkers of astrocytic and neuronal dysfunction in early-and late-onset Alzheimer's disease. Alzheimers Dem. 2020;16(4):681–695. [DOI] [PMC free article] [PubMed] [Google Scholar]
- 13. Thijssen EH, Verberk IM, Stoops E, Boxer AL, Teunissen CE.. Amyloid, pTau, NfL, and GFAP as biomarkers for Alzheimer’s disease: Clinical study results of Alzheimer’s disease blood biomarkers. Alzheimers Dem. 2020;16:e038179. [Google Scholar]
- 14. Asken BM, Elahi FM, La Joie R, et al. Plasma glial fibrillary acidic protein levels differ along the spectra of amyloid burden and clinical disease stage [published correction appears in J Alzheimers Dis. 2021;80(1):471–474]. J Alzheimers Dis. 2020;78(1): 265–276. [DOI] [PubMed] [Google Scholar]
- 15. Chatterjee P, Pedrini S, Stoops E, et al. Plasma glial fibrillary acidic protein is elevated in cognitively normal older adults at risk of Alzheimer’s disease. Trans Psych. 2021;11:27. [DOI] [PMC free article] [PubMed] [Google Scholar]
- 16. Cicognola C, Janelidze S, Hertze J, et al. Plasma glial fibrillary acidic protein detects Alzheimer pathology and predicts future conversion to Alzheimer dementia in patients with mild cognitive impairment. Alzheimers Res Ther. 2021;13(1):68. [DOI] [PMC free article] [PubMed] [Google Scholar]
- 17. Verberk IM, Thijssen E, Koelewijn J, et al. Combination of plasma amyloid beta (1-42/1-40) and glial fibrillary acidic protein strongly associates with cerebral amyloid pathology. Alzheimers Res Ther. 2020;12:1–4. [DOI] [PMC free article] [PubMed] [Google Scholar]
- 18. Simrén J, Leuzy A, Karikari TK, et al. The diagnostic and prognostic capabilities of plasma biomarkers in Alzheimer's disease. Alzheimers Dem. 2021;17(7):1145–1156. [DOI] [PMC free article] [PubMed] [Google Scholar]
- 19. Busche MA, Hyman BT.. Synergy between amyloid-β and tau in Alzheimer’s disease. Nat Neurosci. 2020;23(10):1183–1193. [DOI] [PMC free article] [PubMed] [Google Scholar]
- 20. Gratuze M, Leyns CE, Holtzman DM.. New insights into the role of TREM2 in Alzheimer’s disease. Mol Neurodegen. 2018;13(1):66. [DOI] [PMC free article] [PubMed] [Google Scholar]
- 21. Ulland TK, Colonna M.. TREM2—a key player in microglial biology and Alzheimer disease. Nat Rev Neurol. 2018;14(11):667–675. [DOI] [PubMed] [Google Scholar]
- 22. Henjum K, Almdahl IS, Årskog V, et al. Cerebrospinal fluid soluble TREM2 in aging and Alzheimer’s disease. Alzheimers Res Ther. 2016;8(1):17. [DOI] [PMC free article] [PubMed] [Google Scholar]
- 23. Kleinberger G, Yamanishi Y, Suárez-Calvet M, et al. TREM2 mutations implicated in neurodegeneration impair cell surface transport and phagocytosis. Sci Transl Med. 2014;6(243):243ra86. [DOI] [PubMed] [Google Scholar]
- 24. Piccio L, Deming Y, Del-Águila JL, et al. Cerebrospinal fluid soluble TREM2 is higher in Alzheimer disease and associated with mutation status. Acta Neuropathol. 2016;131(6):925–933. [DOI] [PMC free article] [PubMed] [Google Scholar]
- 25. Heslegrave A, Heywood W, Paterson R, et al. Increased cerebrospinal fluid soluble TREM2 concentration in Alzheimer’s disease. Mol Neurodegener. 2016;11:3. [DOI] [PMC free article] [PubMed] [Google Scholar]
- 26. Suárez-Calvet M, Kleinberger G, Araque Caballero MÁ, et al. sTREM2 cerebrospinal fluid levels are a potential biomarker for microglia activity in early-stage Alzheimer’s disease and associate with neuronal injury markers. EMBO Mol Med. 2016;8(5):466–476. [DOI] [PMC free article] [PubMed] [Google Scholar]
- 27. Carmona S, Zahs K, Wu E, Dakin K, Bras J, Guerreiro R.. The role of TREM2 in Alzheimer's disease and other neurodegenerative disorders. Lancet Neurol. 2018;17(8):721–730. [DOI] [PubMed] [Google Scholar]
- 28. Rauchmann BS, Schneider-Axmann T, Alexopoulos P, Perneczky R, Alzheimer's Disease Neuroimaging Initiative. CSF soluble TREM2 as a measure of immune response along the Alzheimer's disease continuum. Neurobiol Aging. 2019;74:182–190. [DOI] [PMC free article] [PubMed] [Google Scholar]
- 29. Ewers M, Franzmeier N, Suárez-Calvet M, et al. Increased soluble TREM2 in cerebrospinal fluid is associated with reduced cognitive and clinical decline in Alzheimer’s disease. Sci Trans Med. 2019;11(507):eaav6221. [DOI] [PMC free article] [PubMed] [Google Scholar]
- 30. Rathcke CN, Vestergaard H.. YKL-40, a new inflammatory marker with relation to insulin resistance and with a role in endothelial dysfunction and atherosclerosis. Inflamm Res. 2006;55(6):221–227. [DOI] [PubMed] [Google Scholar]
- 31. Shao R, Hamel K, Petersen L, et al. YKL-40, a secreted glycoprotein, promotes tumor angiogenesis. Oncogene. 2009;28(50):4456–4468. [DOI] [PMC free article] [PubMed] [Google Scholar]
- 32. Johansen JS. Studies on serum YKL-40 as a biomarker in diseases with inflammation, tissue remodelling, fibroses and cancer. Dan Med Bull. 2006;53(2):172–209. [PubMed] [Google Scholar]
- 33. Villar-Piqué A, Schmitz M, Hermann P, et al. Plasma YKL-40 in the spectrum of neurodegenerative dementia. J Neuroinflamm. 2019;16(1):145. [DOI] [PMC free article] [PubMed] [Google Scholar]
- 34. Llorens F, Thüne K, Tahir W, et al. YKL-40 in the brain and cerebrospinal fluid of neurodegenerative dementias. Mol Neurodegener. 2017;12(1):83. [DOI] [PMC free article] [PubMed] [Google Scholar]
- 35. Baldacci F, Lista S, Cavedo E, Bonuccelli U, Hampel H.. Diagnostic function of the neuroinflammatory biomarker YKL-40 in Alzheimer’s disease and other neurodegenerative diseases. Expert Rev Proteomics. 2017;14(4):285–299. [DOI] [PubMed] [Google Scholar]
- 36. Lleó A, Alcolea D, Martínez-Lage P, et al. Longitudinal cerebrospinal fluid biomarker trajectories along the Alzheimer's disease continuum in the BIOMARKAPD study. Alzheimers Dement. 2019;15(6):742–753. [DOI] [PubMed] [Google Scholar]
- 37. Palmqvist S, Insel PS, Stomrud E, et al. Cerebrospinal fluid and plasma biomarker trajectories with increasing amyloid deposition in Alzheimer's disease. EMBO Mol Med. 2019;11(12):e11170. [DOI] [PMC free article] [PubMed] [Google Scholar]
- 38. Janelidze S, Mattsson N, Stomrud E, et al. CSF biomarkers of neuroinflammation and cerebrovascular dysfunction in early Alzheimer disease. Neurology. 2018;91(9):e867–e877. [DOI] [PMC free article] [PubMed] [Google Scholar]
- 39. Schindler SE, Li Y, Todd KW, et al. ; Dominantly Inherited Alzheimer Network. Emerging cerebrospinal fluid biomarkers in autosomal dominant Alzheimer's disease. Alzheimers Dement. 2019;15(5):655–665. [DOI] [PMC free article] [PubMed] [Google Scholar]
- 40. Palmqvist S, Janelidze S, Quiroz YT, et al. Discriminative accuracy of plasma phospho-tau217 for Alzheimer disease vs other neurodegenerative disorders. JAMA. 2020;324(8):772–781. [DOI] [PMC free article] [PubMed] [Google Scholar]
- 41. Palmqvist S, Janelidze S, Stomrud E, et al. Performance of fully automated plasma assays as screening tests for alzheimer disease–related b-amyloid status. JAMA Neurol. 2019;76(9):1060–1069. [DOI] [PMC free article] [PubMed] [Google Scholar]
- 42. Bertens D, Tijms BM, Scheltens P, Teunissen CE, Visser PJ.. Unbiased estimates of cerebrospinal fluid beta-amyloid 1-42 cutoffs in a large memory clinic population. Alzheimers Res Ther. 2017;9(1):8. [DOI] [PMC free article] [PubMed] [Google Scholar]
- 43. Landau SM, Fero A, Baker SL, et al. Measurement of longitudinal β-amyloid change with 18F-florbetapir PET and standardized uptake value ratios. J Nucl Med. 2015;56(4):567–574. [DOI] [PMC free article] [PubMed] [Google Scholar]
- 44. Ossenkoppele R, Rabinovici GD, Smith R, et al. Discriminative accuracy of [18F] flortaucipir positron emission tomography for Alzheimer disease vs other neurodegenerative disorders. JAMA. 2018;320(11):1151–1162. [DOI] [PMC free article] [PubMed] [Google Scholar]
- 45. Cho H, Choi JY, Hwang MS, et al. In vivo cortical spreading pattern of tau and amyloid in the Alzheimer disease spectrum. Ann Neurol. 2016;80(2):247–258. [DOI] [PubMed] [Google Scholar]
- 46. Palmqvist S, Insel PS, Stomrud E, et al. Cerebrospinal fluid and plasma biomarker trajectories with increasing amyloid deposition in Alzheimer's disease. EMBO Mol Med. 2019;11(12):e11170. [DOI] [PMC free article] [PubMed] [Google Scholar]
- 47. Jack CR Jr, Knopman DS, Jagust WJ, et al. Tracking pathophysiological processes in Alzheimer's disease: An updated hypothetical model of dynamic biomarkers. Lancet Neurol. 2013;12(2):207–216. [DOI] [PMC free article] [PubMed] [Google Scholar]
- 48. Benjamini Y, Hochberg Y.. Controlling the false discovery rate: A practical and powerful approach to multiple testing. J Royal Stat Soc Series B. 1995;57(1):289–300. [Google Scholar]
- 49. Chumbley J, Worsley K, Flandin G, Friston K.. Topological FDR for neuroimaging. Neuroimage. 2010;49(4):3057–3964. [DOI] [PMC free article] [PubMed] [Google Scholar]
- 50. Medeiros R, LaFerla FM.. Astrocytes: Conductors of the Alzheimer disease neuroinflammatory symphony. Exp Neurol. 2013;239:133–138. [DOI] [PubMed] [Google Scholar]
- 51. Carter SF, Herholz K, Rosa-Neto P, Pellerin L, Nordberg A, Zimmer ER.. Astrocyte biomarkers in Alzheimer’s disease. Trends Mol Med. 2019;25(2):77–95. [DOI] [PubMed] [Google Scholar]
- 52. Olsson B, Lautner R, Andreasson U, et al. CSF and blood biomarkers for the diagnosis of Alzheimer's disease: A systematic review and meta-analysis. Lancet Neurol. 2016;15(7):673–684. [DOI] [PubMed] [Google Scholar]
- 53. Van Hulle C, Jonaitis EM, Betthauser TJ, et al. An examination of a novel multipanel of CSF biomarkers in the Alzheimer's disease clinical and pathological continuum. Alzheimers Dement. 2021;17(3):431–445. [DOI] [PMC free article] [PubMed] [Google Scholar]
- 54. Verberk IM, Laarhuis MB, van den Bosch KA, et al. Serum markers glial fibrillary acidic protein and neurofilament light for prognosis and monitoring in cognitively normal older people: A prospective memory clinic-based cohort study. Lancet Healthy Long. 2021;2(2):e87–e95. [DOI] [PubMed] [Google Scholar]
- 55. Serrano-Pozo A, Mielke ML, Gómez-Isla T, et al. Reactive glia not only associates with plaques but also parallels tangles in Alzheimer's disease. Am J Pathol. 2011;179(3):1373–1384. [DOI] [PMC free article] [PubMed] [Google Scholar]
- 56. Lemoine L, Saint-Aubert L, Nennesmo I, Gillberg PG, Nordberg A.. Cortical laminar tau deposits and activated astrocytes in Alzheimer’s disease visualised by 3 H-THK5117 and 3 H-deprenyl autoradiography. Sci Rep. 2017;7:45496–45491. [DOI] [PMC free article] [PubMed] [Google Scholar]
- 57. Bourassa P, Tremblay C, Schneider JA, Bennett DA, Calon F.. Beta-amyloid pathology in human brain microvessel extracts from the parietal cortex: Relation with cerebral amyloid angiopathy and Alzheimer’s disease. Acta Neuropathol. 2019;137(5):801–823. [DOI] [PMC free article] [PubMed] [Google Scholar]
- 58. Rodriguez-Vieitez E, Carter SF, Chiotis K, et al. Comparison of early-phase 11C-deuterium-l-deprenyl and 11C-Pittsburgh compound B PET for assessing brain perfusion in Alzheimer disease. J Nucl Med. 2016;57(7):1071–1077. [DOI] [PubMed] [Google Scholar]
Associated Data
This section collects any data citations, data availability statements, or supplementary materials included in this article.
Supplementary Materials
Data Availability Statement
Anonymized data will be shared by request from a qualified academic investigator for the sole purpose of replicating procedures and results presented in the article and as long as data transfer is in agreement with EU legislation on the general data protection regulation and decisions by the Ethical Review Board of Sweden and Region Skåne, which should be regulated in a material transfer agreement.