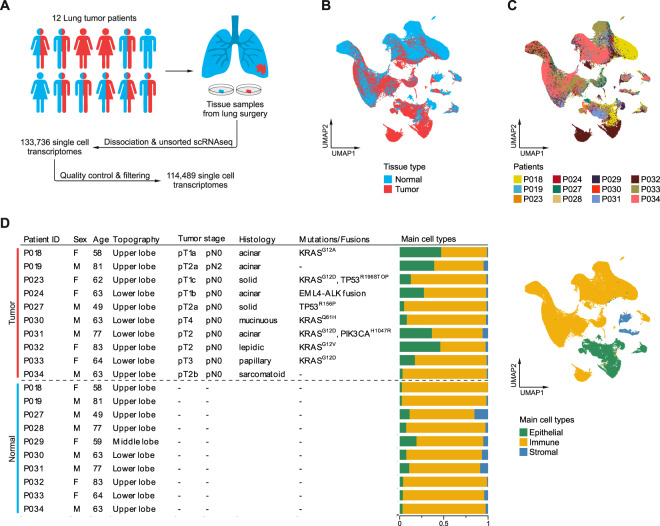
Fig. 1. Single-cell RNA sequencing of lung adenocarcinomas.
A Schematic representation of the workflow, ten normal (blue) and ten tumor (red) tissue samples were obtained from 12 patients. B, C UMAPs based on the top 15 principal components of all single-cell transcriptomes after filtering, color-coded by (B) tissue type, or (C) patient. D Overview of clinical features, clinically relevant oncogenic mutations and gene fusions; quantification of main cell types per patient and UMAP of all single-cell transcriptomes color-coded by main cell type.

