

Abstract
Circulating tumor DNA (ctDNA) is an emerging biomarker for many cancers, but the limited sensitivity of current detection methods reduces its utility for diagnosing minimal residual disease. Here we describe phased variant enrichment and detection sequencing (PhasED-Seq), a method that uses multiple somatic mutations in individual DNA fragments to improve the sensitivity of ctDNA detection. Leveraging whole-genome sequences from 2,538 tumors, we identify phased variants and their associations with mutational signatures. We show that even without molecular barcodes, the limits of detection of PhasED-Seq outperform prior methods, including duplex barcoding, allowing ctDNA detection in the parts-per-million range in patient samples. We profiled 678 specimens from 213 patients with B-cell lymphomas, including serial cell-free DNA samples before and during therapy for diffuse large B-cell lymphoma. In patients with undetectable ctDNA by CAPP-Seq after two cycles of therapy, an additional 25% have ctDNA detectable by PhasED-Seq and have worse outcomes. Finally, we demonstrate the application of PhasED-Seq to solid tumors.
Editorial summary
The sensitivity of circulating tumor DNA detection is improved by identifying sequences with two or more mutations.
Introduction
Analysis of somatic mutations from circulating cell-free DNA (cfDNA) has broad applications for detecting and characterizing cancer1–10. Detection of circulating tumor-derived DNA (ctDNA) has been shown in principle in most cancer types5. However in practice, the current limits of detection (LOD) for ctDNA analysis are imperfect, and are inherently restricted by two key factors – low input DNA amounts from a typical blood collection and background error rates of current sequencing technologies11.
Recent approaches have improved ctDNA MRD performance by tracking multiple somatic mutations with error-suppressed sequencing2,12,13. This approach has allowed detection limits as low as 2–10 parts in 100,000 from limited cfDNA using off-the-shelf panels or personalized assays2,11. Detection of residual disease during or after treatment is a powerful prognostic tool, with detectable MRD representing an adverse sign even during radiographic remission14,15. However, current detection limits are insufficient to universally detect residual disease in patients destined for disease relapse. This ‘loss of detection’ is exemplified in diffuse large B-cell lymphoma (DLBCL). Here, a threshold-response in ctDNA after only two cycles of curative-intent therapy is strongly prognostic for favorable clinical outcomes (Major Molecular Response, MMR)14. Despite this, nearly one-third of patients experiencing eventual disease progression do not have detectable ctDNA at this interim landmark when using either immunoglobulin or targeted sequencing14,15, thus representing ‘false-negative’ measurements. Such high false-negative rates have also been observed using alternative methodologies to track disease in colon8 and breast cancers16. More sensitive methods are therefore needed to improve residual disease detection across cancers.
Prior methods aimed at lowering the LOD have focused on somatic variants detected on both of the complementary strands of parental DNA duplexes (Extended Data Fig 1a)2,17,18. ‘Duplex sequencing’ reduces the background error-rate due to the requirement of two concordant events for detection of a single nucleotide variant (SNV). In previous studies utilizing duplex sequencing for ctDNA analysis, an analytical LOD as low as 1 molecule in 400,000 was achievable2. However, this approach is limited by inefficient recovery of DNA duplexes – recovery of both original strands occurs in a minority (typically 20–25%)2,17 of all recovered molecules. This inefficiency makes duplex sequencing suboptimal for real-world ctDNA detection, where input DNA from practical blood volumes is limited (~4,000–8,000 genomes per standard 10 mL blood collection tube) and maximal recovery of genomes is essential19. To improve MRD detection, methods that simultaneously achieve low analytical detection limits and high molecular recovery for multiple mutations are still needed (Extended Data Fig 1b).
Here we introduce an alternative to duplex sequencing for reducing the background error rate that involves detection of ‘phased variants’ (PVs), where two or more mutations occur in cis (i.e., on the same strand of DNA Fig 1a, Extended Data Fig 1). Similar to duplex sequencing, this method provides lower error profiles due to the concordant detection of two separate non-reference events in individual molecules. However, unlike duplex sequencing, both events occur on the same sequencing read-pair, thereby increasing the efficiency of genome recovery. We find that phased mutations are present in diverse cancer types, but occur in stereotyped portions of the genome in B-cell malignancies, likely due to physiological and aberrant somatic hypermutation (aSHM)20,21. We therefore develop and apply Phased variant Enrichment and Detection Sequencing (PhasED-Seq), a novel method to detect ctDNA through phased variants to tumor fractions on the order of parts per million. We demonstrate that PhasED-Seq can meaningfully improve detection of ctDNA in clinical samples both during therapy and prior to disease relapse. Finally, we apply PhasED-Seq to patients with solid tumors through personalized identification of PVs, demonstrating the broad applicability of PhasED-Seq for improved MRD detection.
Figure 1. Discovery of phased variants and their mutational signatures via analysis of whole-genome sequencing data.
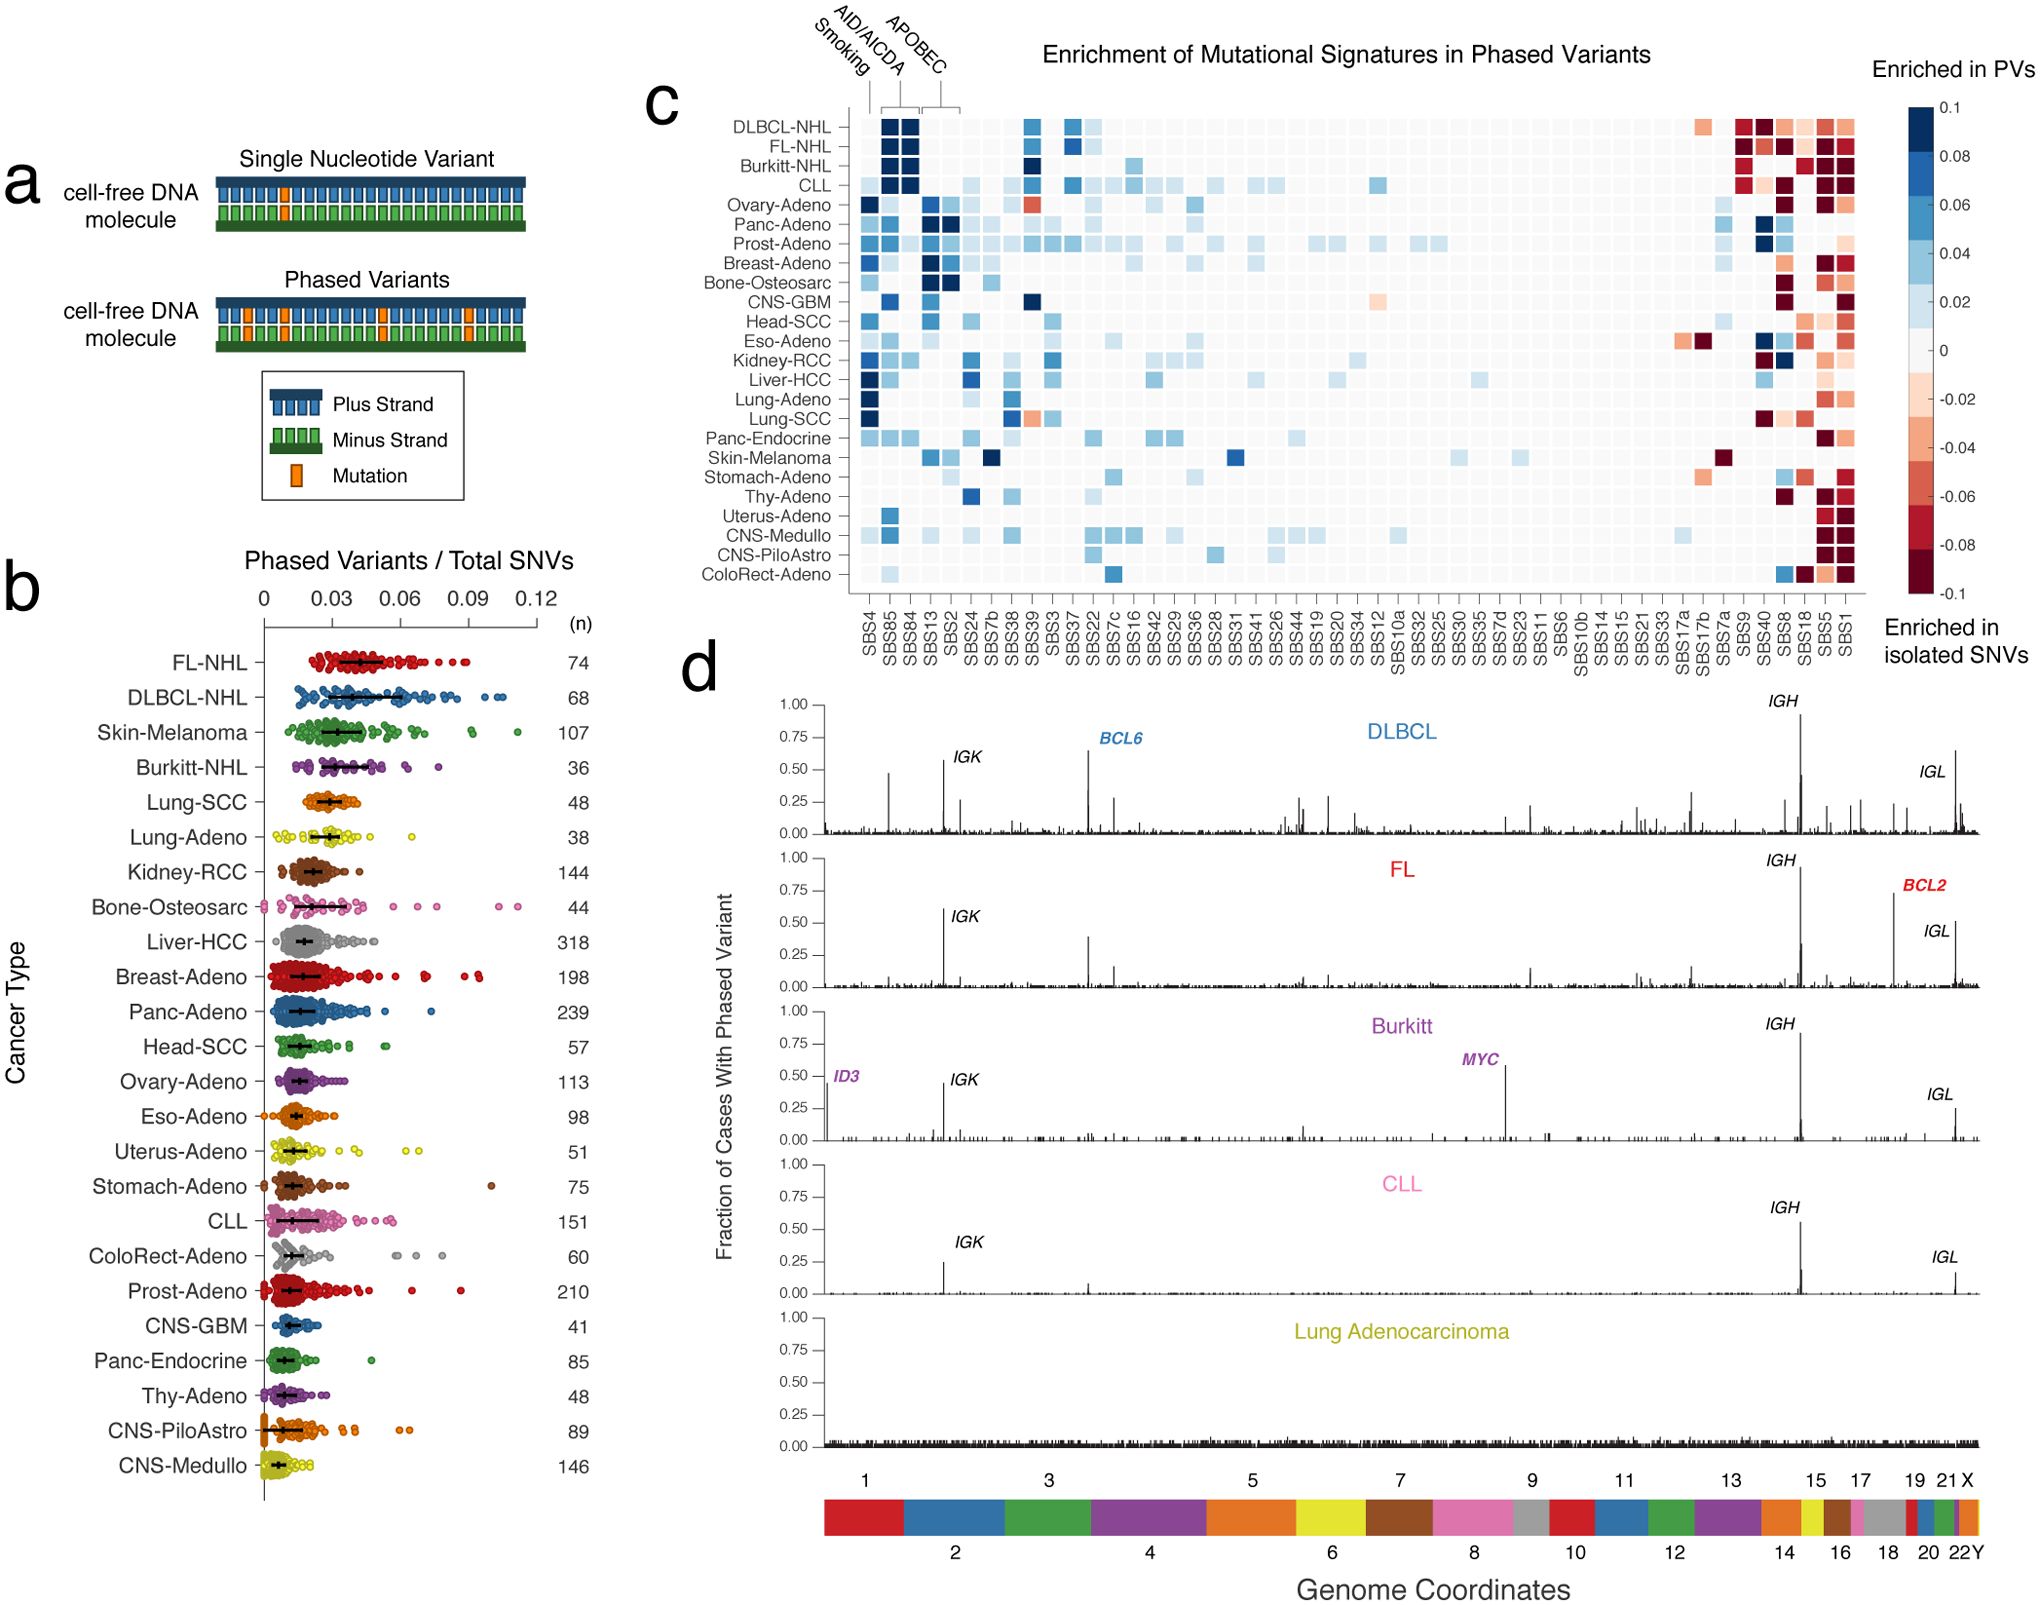
a) A cartoon depicting the difference between a single nucleotide variant (SNV) (top) and multiple variants ‘in-phase’ (phased variants, PVs; bottom) on DNA molecules. In theory, PVs are more specific events than isolated SNVs.
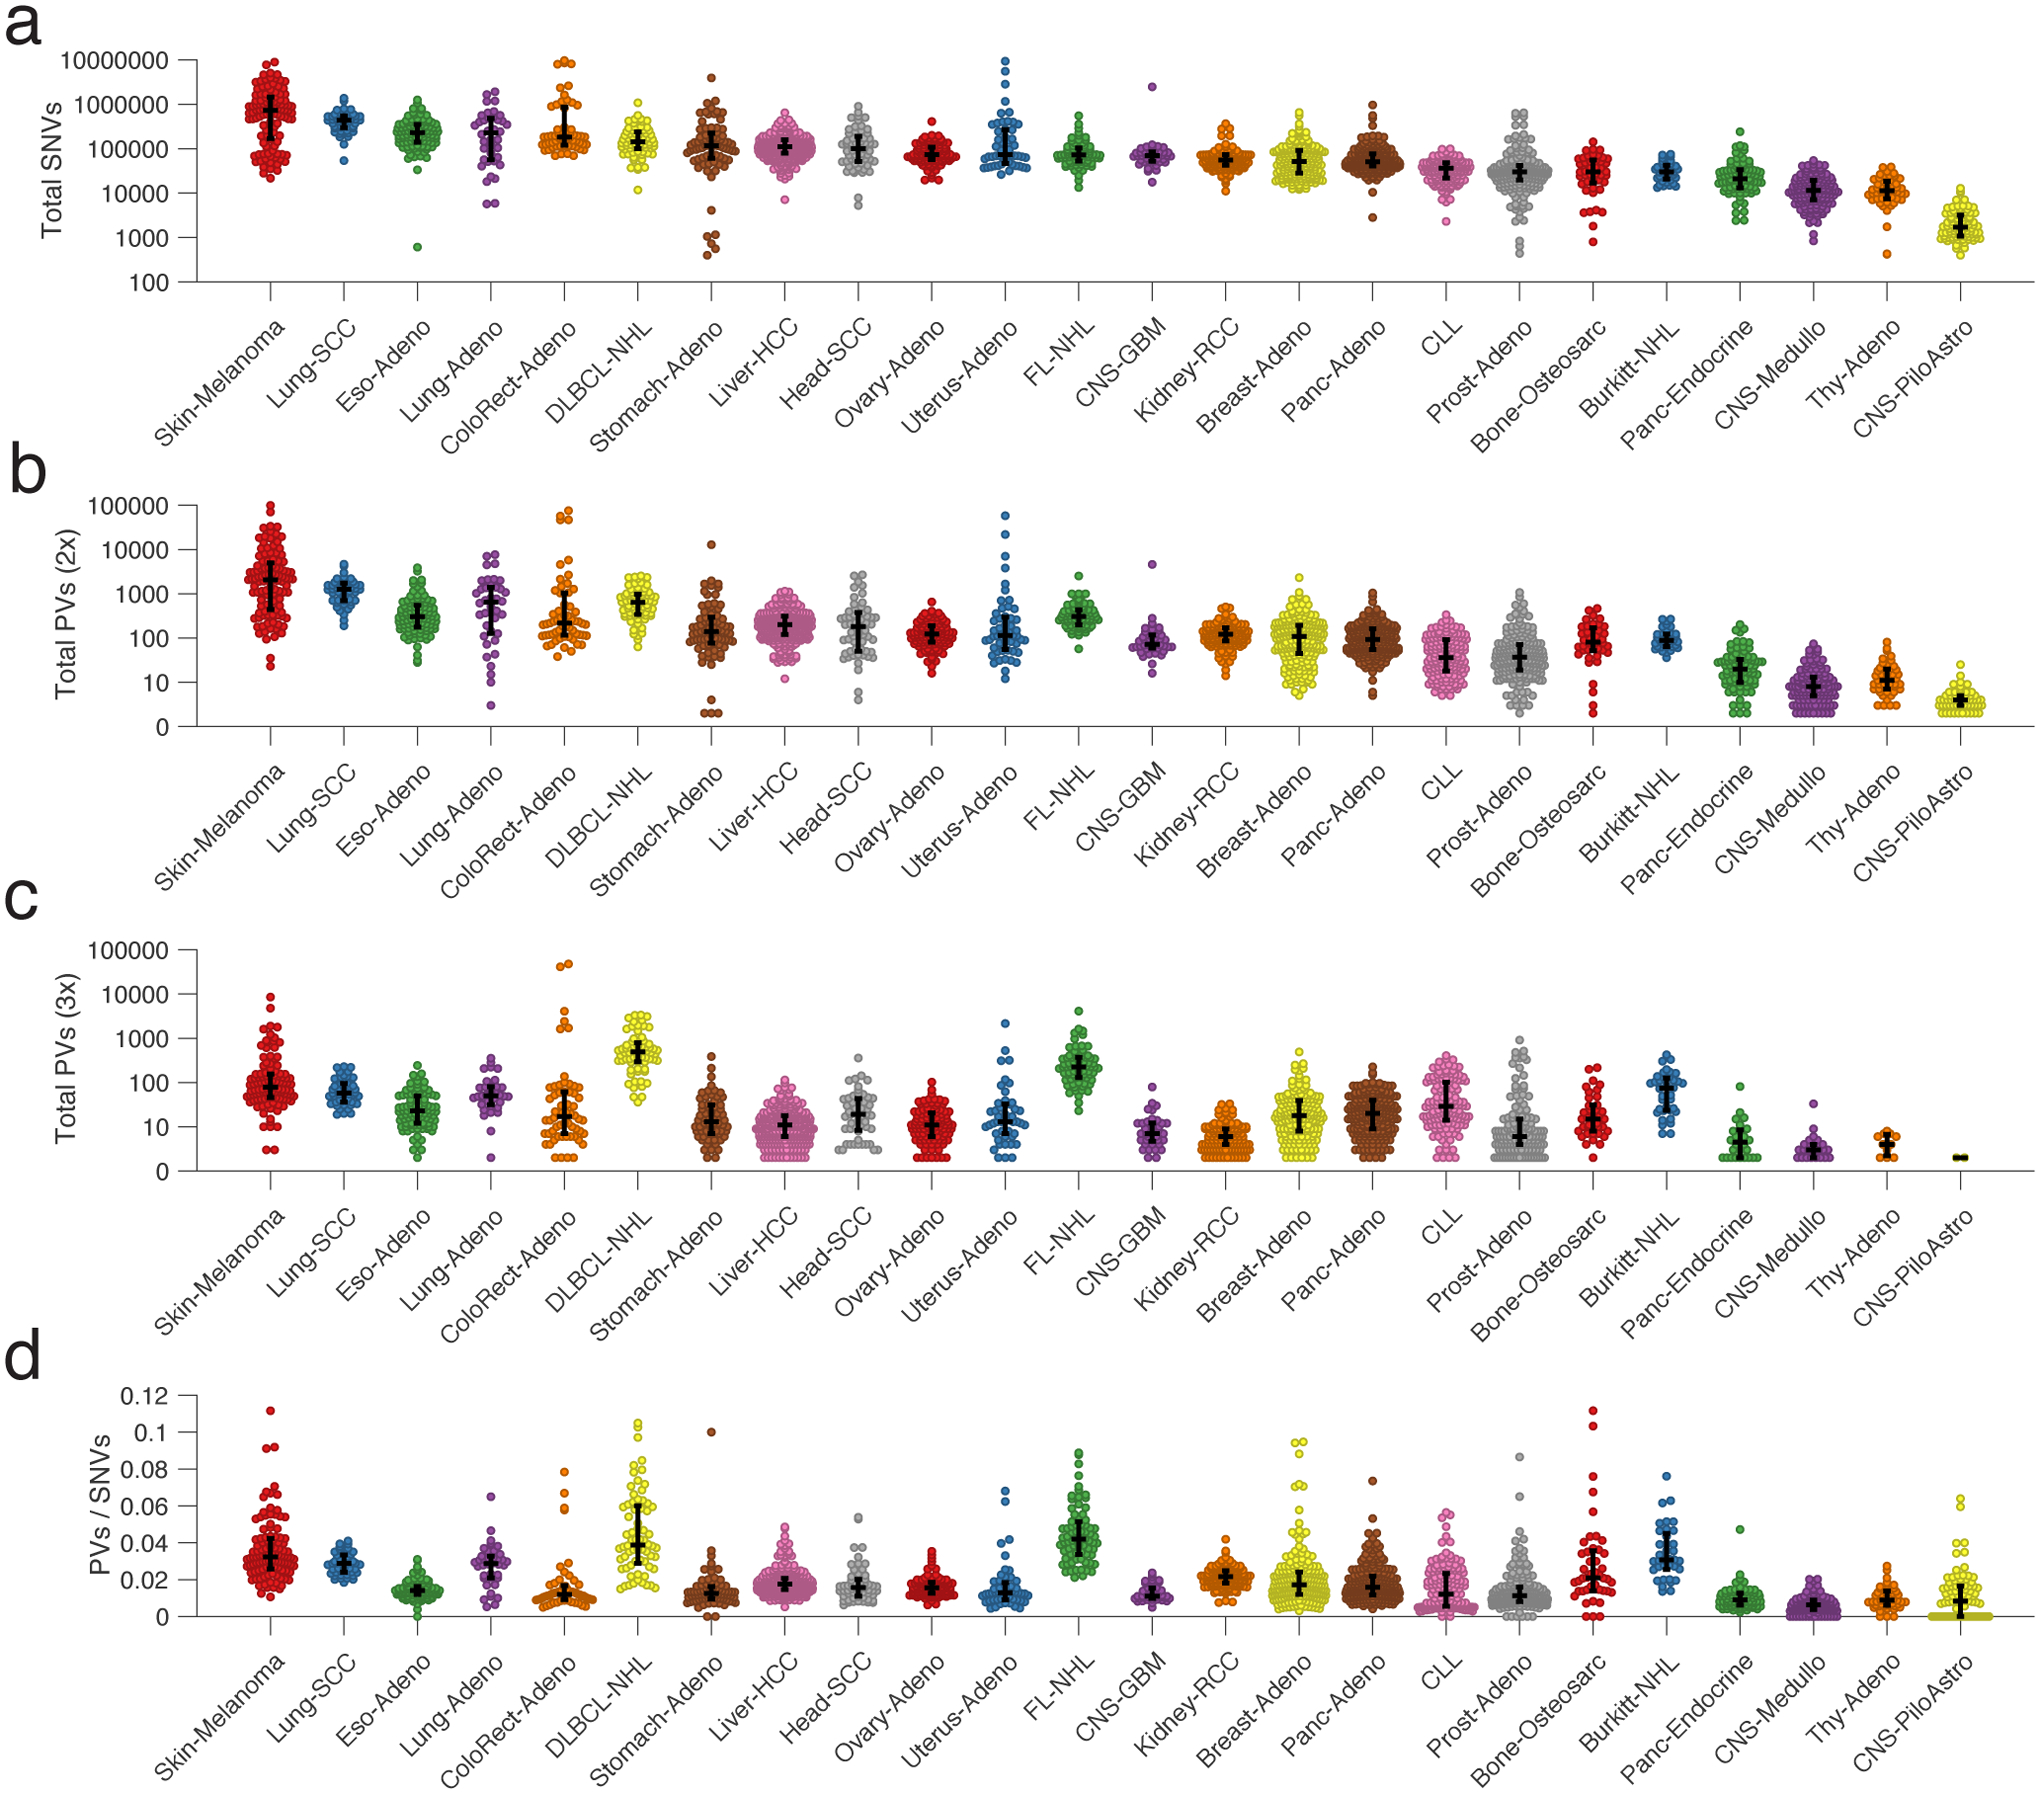
b) A scatter plot showing the distribution of PVs from WGS data for 24 different cancer histologies, normalized by total SNVs. Bars represent the median and interquartile range (IQR). (FL-NHL, follicular lymphoma; DLBCL-NHL, diffuse large B-cell lymphoma; Burkitt-NHL, Burkitt lymphoma; Lung-SCC, squamous cell lung cancer; Lung-Adeno, lung adenocarcinoma; Kidney-RCC, renal cell carcinoma; Bone-Osteosarc, osteosarcoma; Liver-HCC, hepatocellular carcinoma; Breast-Adeno, breast adenocarcinoma; Panc-Adeno, pancreatic adenocarcinoma; Head-SCC, head and neck squamous cell carcinoma; Ovary-Adeno, ovarian adenocarcinoma; Eso-Adeno, esophageal adenocarcinoma; Uterus-Adeno, uterine adenocarcinoma; Stomach-Adeno, stomach adenocarcinoma; CLL, chronic lymphocytic leukemia; ColoRect-Adeno, colorectal adenocarcinoma; Prost-Adeno, prostate adenocarcinoma; CNS-GBM, glioblastoma multiforme; Panc-Endorcine, pancreatic neuroendocrine tumor; Thy-Adeno, thyroid adenocarcinoma; CNS-PiloAstro, piloastrocytoma; CNS-Medullo, medulloblastoma.)
c) Heatmap demonstrating enrichment in SBS mutational signatures for PVs versus single SNVs across cancer types. Blue represents signatures enriched in PVs; red represents signatures where un-phased, single SNVs are enriched. Only signatures with a significant difference between PVs and unphased SNVs after correcting for multiple hypotheses are shown; other signatures are grey (Methods). See https://phasedseq.stanford.edu for additional details.
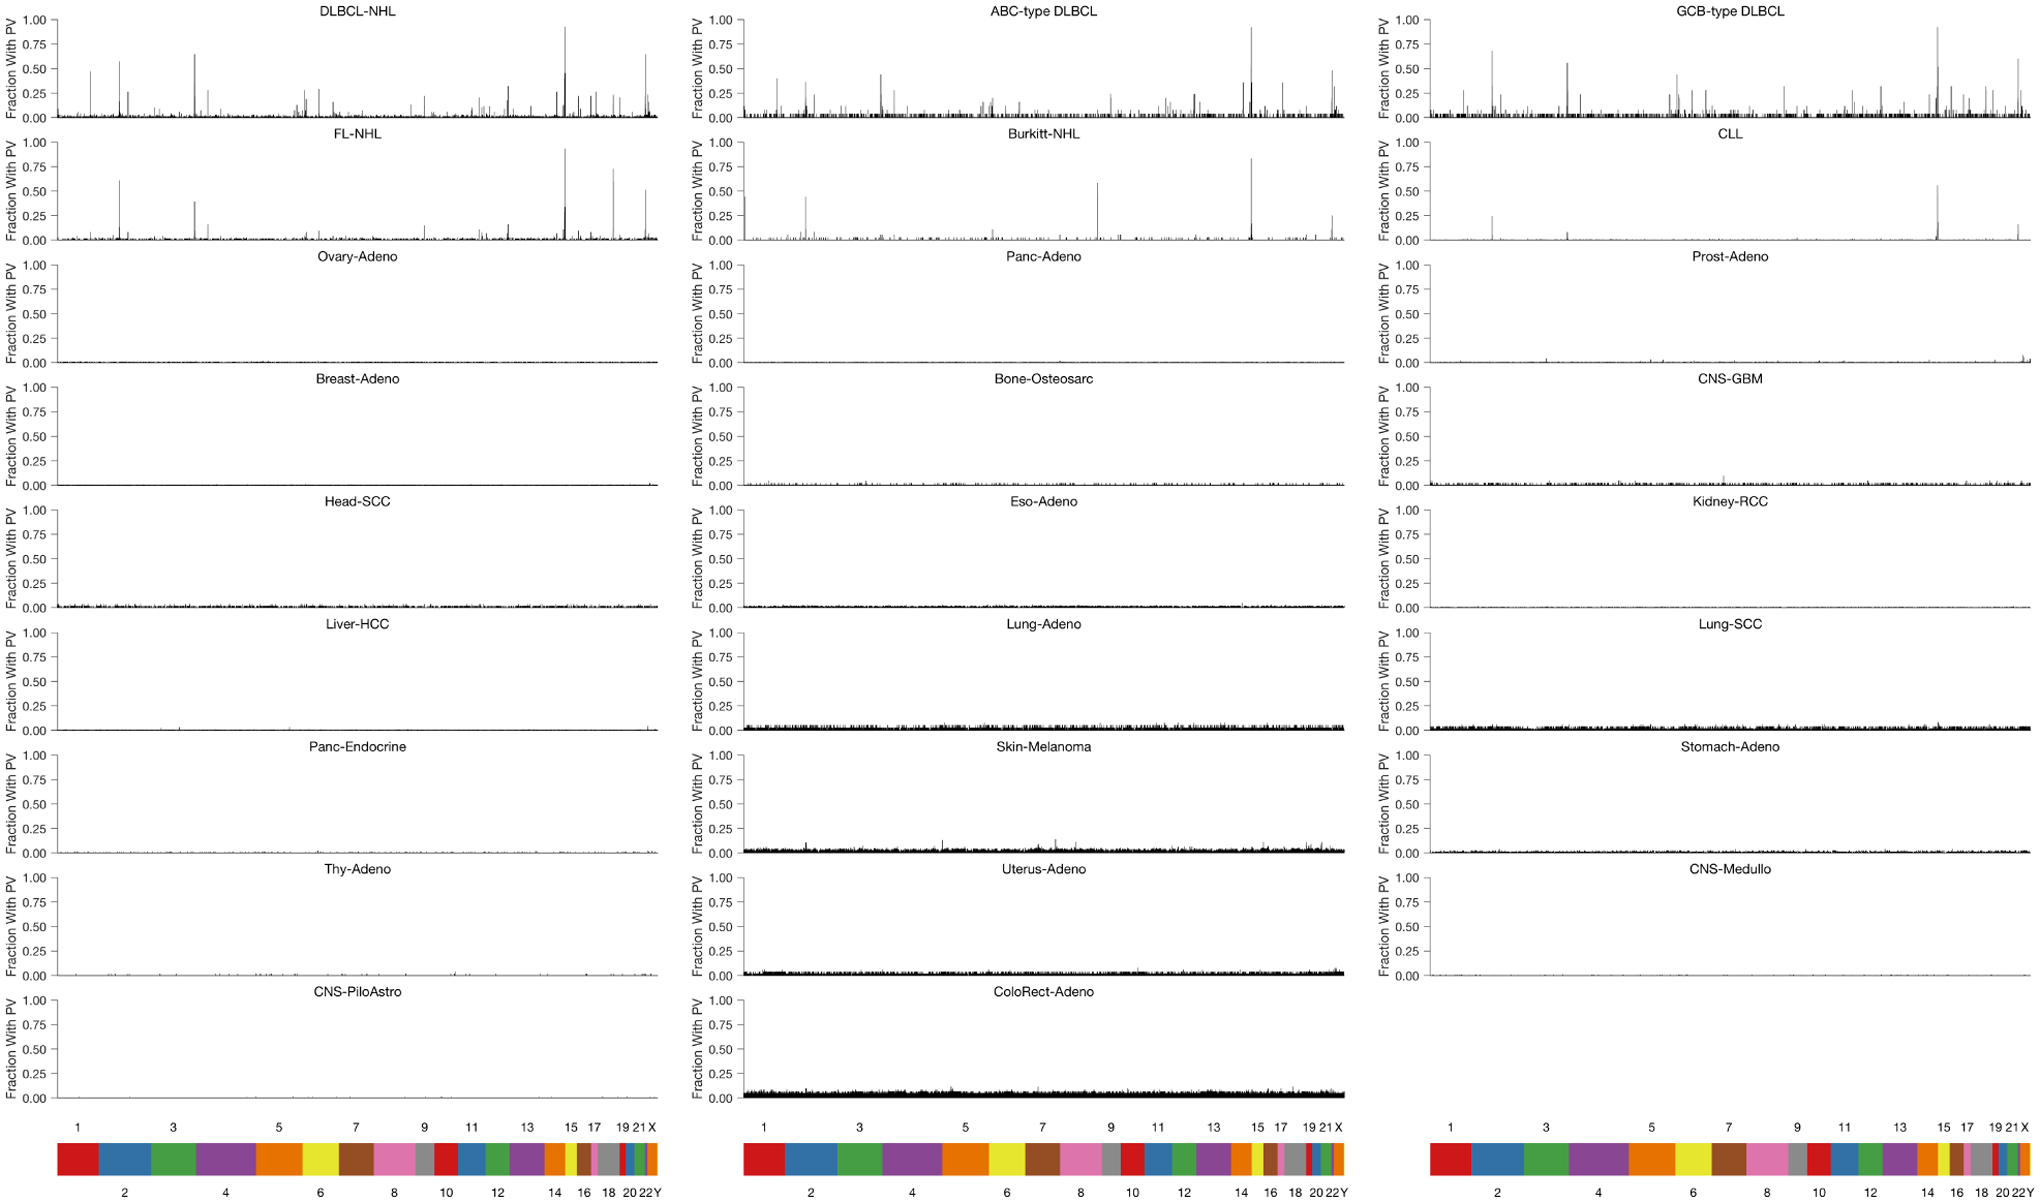
d) Bar plots showing the distribution of PVs in stereotyped regions across the genome in B-lymphoid malignancies and lung adenocarcinoma. The genome was divided into 1000bp bins, and the fraction of sampleswith a PV in each bin was calculated. Only bins that have at least a 2 percent recurrence frequency in any cancer subtype are shown.
Results
Genomic Distribution of Phased Variants
To identify malignancies where PVs could potentially improve disease detection, we assessed the frequency of PVs across cancer types. We analyzed publicly available whole-genome sequencing data to identify sets of variants occurring at a distance of <170bp apart, which represents the typical length of a single cfDNA fragment22 consisting of a single core nucleosome and associated linker. We identified and summarized the frequency of these ‘putative phased variants,’ (Methods) controlling for the total number of SNVs, from 2538 tumors across 24 cancer histologies including solid tumors and hematological malignancies (Fig 1b, Extended Data Fig 2, Table S1). Interestingly, PVs were most significantly enriched in two B-cell lymphomas (DLBCL and follicular lymphoma, FL, P<0.05 vs all other histologies), a group of diseases with known hypermutation driven by AID/AICDA.
Mutational Mechanisms Underlying PVs
To investigate the origin of PVs, we compared the single base substitution (SBS) mutational signatures23 contributing to SNVs occurring within 170bp of another SNV, and SNVs occurring in isolation (Methods). As expected, PVs were highly enriched in several mutational signatures associated with clustered mutations24. Signatures of clustered mutations associated with activity of AID (SBS84 and SBS85) were significantly enriched in PVs from B-cell lymphomas and CLL, while signatures associated with activity of APOBEC3B (SBS2 and SBS13) – another known mechanism of kataegis hypermutation – were significantly enriched in PVs from multiple solid cancer histologies (Fig 1c)24,25. Interestingly, PVs from multiple tumor types were also associated with SBS4, a signature associated with tobacco use. In contrast, aging-associated mutational signatures such as SBS1 and SBS5 were significantly enriched in isolated SNVs26.
PVs Occur in Stereotyped Genomic Regions in Lymphoid Cancers
To assess the genomic distribution of putative PVs, we binned these events into 1-kb regions across the genome. We observed a strikingly stereotyped distribution of PVs in individual lymphoid neoplasms (i.e., DLBCL, FL, Burkitt lymphoma (BL), and CLL; Fig 1d, Extended Data Fig 3). In contrast, non-lymphoid cancers did not exhibit substantial recurrence of PVs in stereotyped regions. This lack of stereotype in PV-containing loci was true even when considering melanomas and lung cancers, diseases with frequent PVs.
Across lymphomas, the majority of hypermutated regions were shared between lymphoma subtypes, with the highest densities in known targets of SHM27,28 including BCL2, BCL6, and MYC, as well as the immunoglobulin (Ig) loci IGH, IGK, and IGL (Table S2, Fig 1d), with DLBCL harboring the most recurrently affected regions (Supplementary Fig 1a). Among 1639 1-kb regions recurrently containing PVs, nearly one-third fell into genomic areas previously associated with physiological or aberrant SHM in B-cells. Specifically, 19% (315/1639) were located in Ig regions, while 13% (218/1639) were in portions of 68 previously identified targets of aSHM (Table S2). While most PVs fell into noncoding regions of the genome, we also identified additional recurrently affected loci not previously described as targets of aSHM, including XBP1, LPP, and AICDA, among others.
Interestingly, the distribution of PVs within each lymphoma correlated with known oncogenic features associated with the corresponding disease, including PVs in BCL2 in FL29 and PVs in MYC and ID3 in Burkitt lymphoma30 (Fig 1d, Supplementary Fig 1b–d). DLBCL molecular subtypes associated with distinct cell-of-origin31 also demonstrated distinct distributions of PVs (Table S2), including significant enrichments in PVs in BCL2 in GCB-DLBCLs and IGH class-switch regions (Sγ1, and Sγ3) in ABC-DLBCLs, consistent with previous reports32 (Supplementary Fig 1e).
Design and Validation of PhasED-Seq Panel for Lymphoma
To validate these PV-rich regions and assess their utility for disease detection from ctDNA, we designed a sequencing panel targeting putative PVs identified within WGS from three independent cohorts of patients with DLBCL, as well as in patients with CLL33–36 (Fig 2a, Methods). This final Phased variant Enrichment and Detection Sequencing (PhasED-Seq) panel targeted ~115kb of genomic space focused on PVs, along with an additional ~200kb targeting genes known to be recurrently mutated in B-NHLs; this single panel was used for both identification of PVs from tumor and/or plasma samples and tracking residual disease (Fig 2b). While the 115kb of space dedicated to PV-capture targets only 0.0035% of the human genome, it captures 26% of phased variants observed by WGS (Extended Data Fig 4a), yielding a ~7500-fold enrichment over WGS.
Figure 2. Design of phased variant enrichment sequencing.
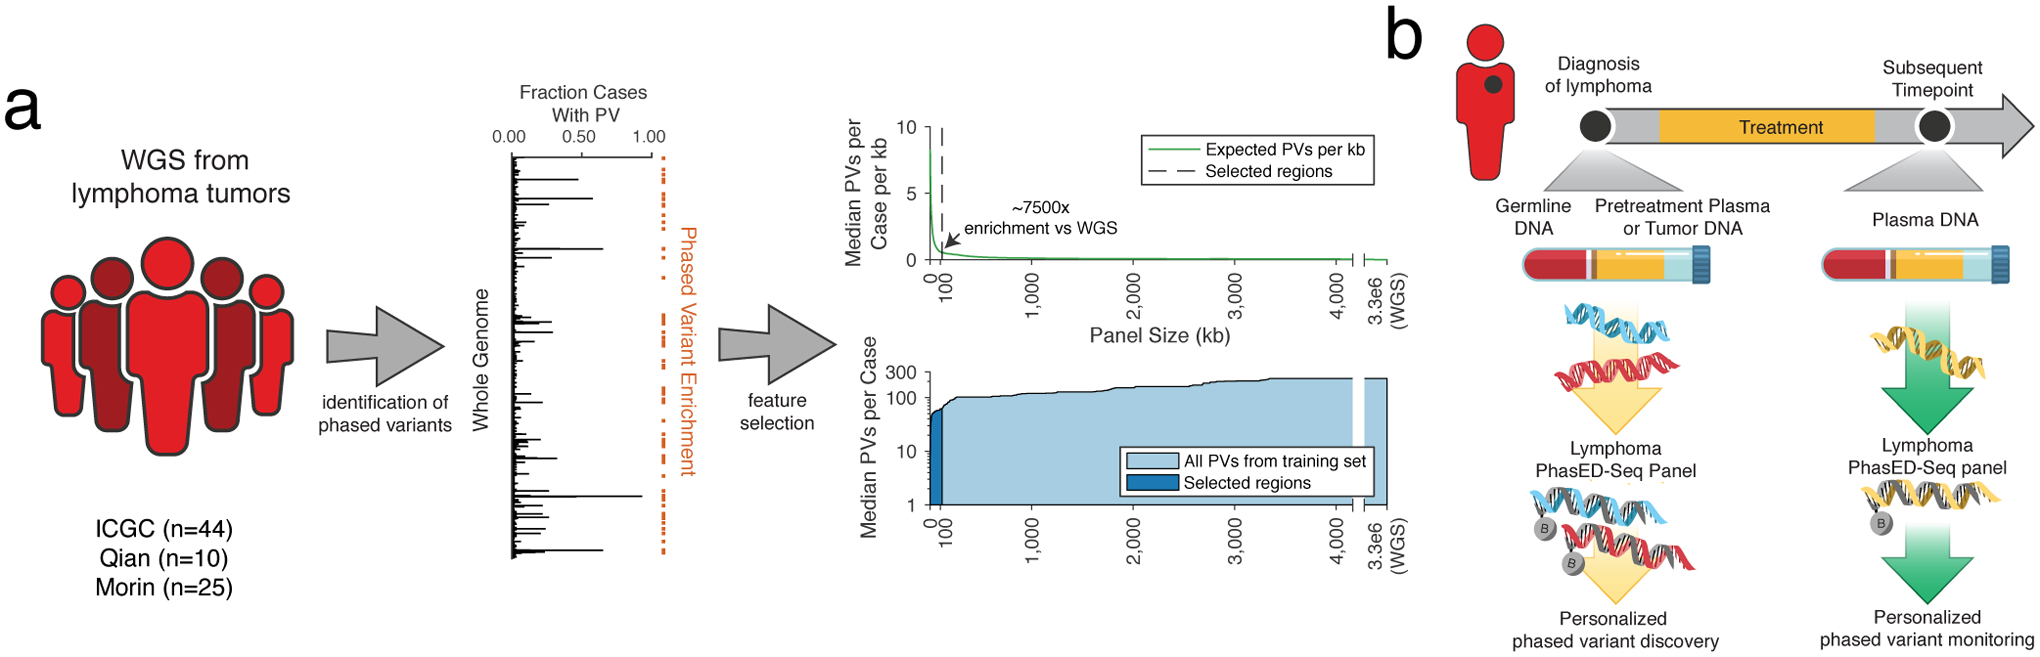
a) A cartoon showing the design of PhasED-Seq. WGS data from DLBCL tumors were aggregated (left), and recurrent PVs were identified (middle). A panel capturing regions recurrently containing PVs was designed (right). The top right panel shows the expected number of PVs / kb for increasing panel sizes. The dashed line shows the selected regions. The bottom right panel shows the median total expected PVs per case for increasing panel sizes. The dark area shows the selected regions.
b) A schematic for the use of PhasED-Seq in patients with B-cell malignancies. At time of diagnosis, a tumor or plasma sample, along with matched germline, are sequenced to identify a personalized set of PVs. These PVs can then be tracked in future plasma samples.
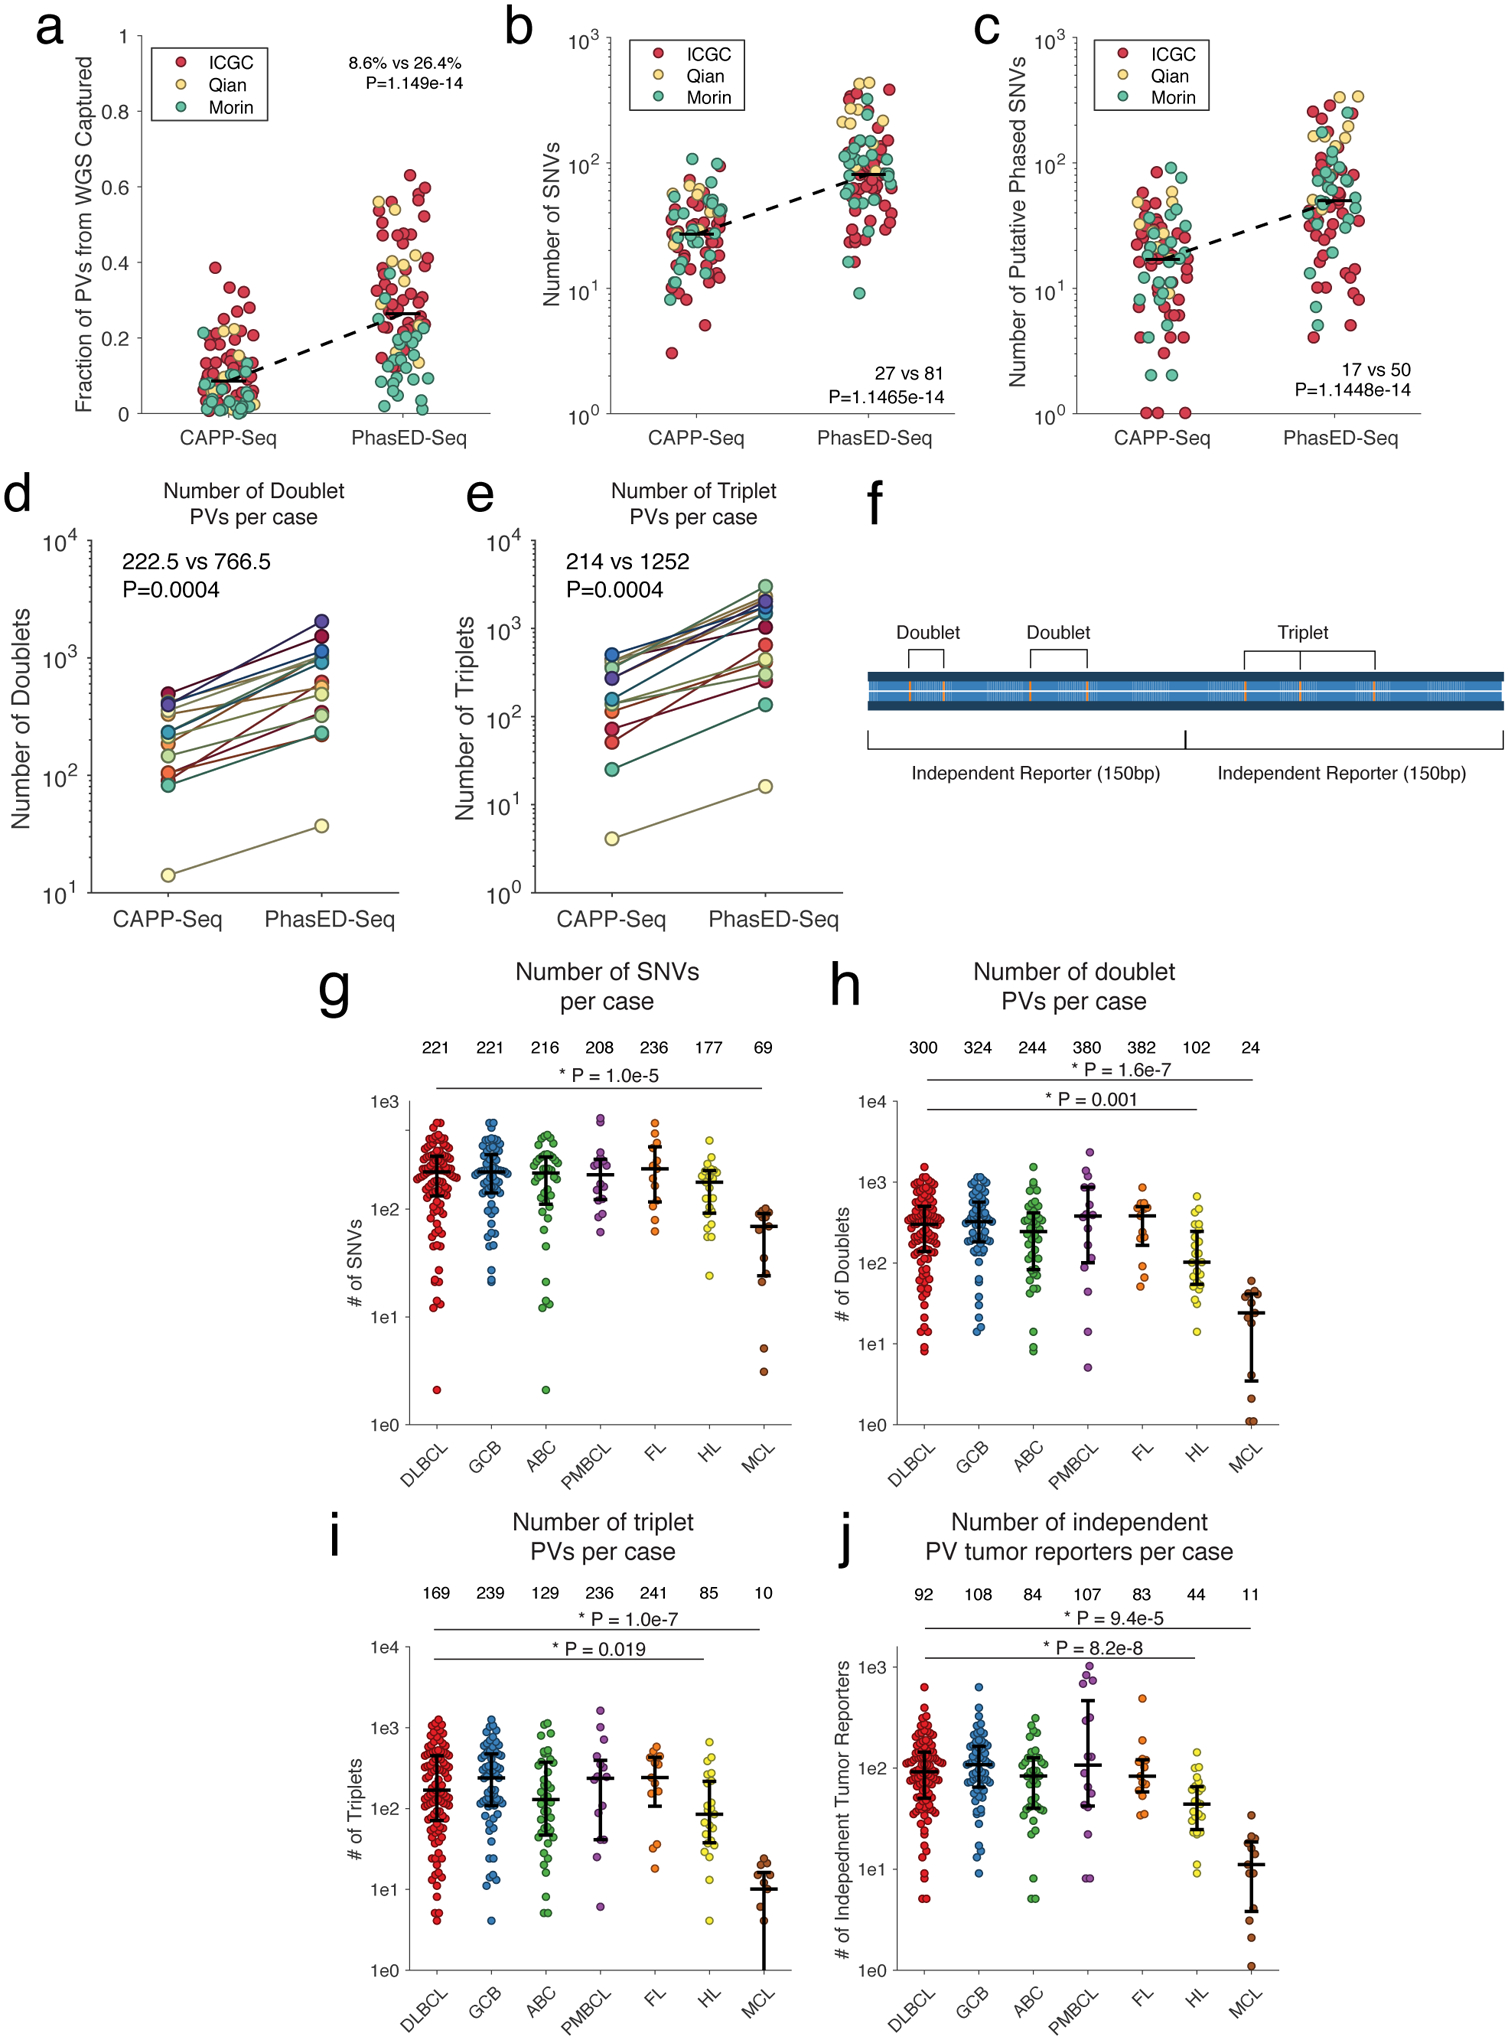
We next compared expected SNV and PV recovery to a previously reported 228kb lymphoma ctDNA panel designed to maximize SNVs per patient from WES data (i.e., CAPP-Seq) in B-cell lymphomas (Extended Data Fig 4a–c)3. Compared to this prior panel, PhasED-Seq covered 3.0x more SNVs and 2.9x more PVs in available WGS data33–35. To validate these yield improvements, we profiled 16 pretreatment tumor or plasma DNA samples from patients with DLBCL (Table S3). We applied both panels to each specimen and sequenced to high unique molecular depths (Fig 3a, Extended Data Fig 4d–e). Compared to the expected enrichment, we observed similar improvements in yield of SNVs by PhasED-Seq compared to the prior panel (2.7x; median 304.5 vs. 114). However, we found a larger improvement in the number of PVs recovered by PhasED-Seq (5.8x; median 2461 vs 423 PVs/case; Fig 3a). We also observed robust correlation between the frequency of PVs in WGS and targeted data across 101 DLBCL samples (Fig 3b).
Figure 3. Validation and application of phased variant enrichment sequencing.
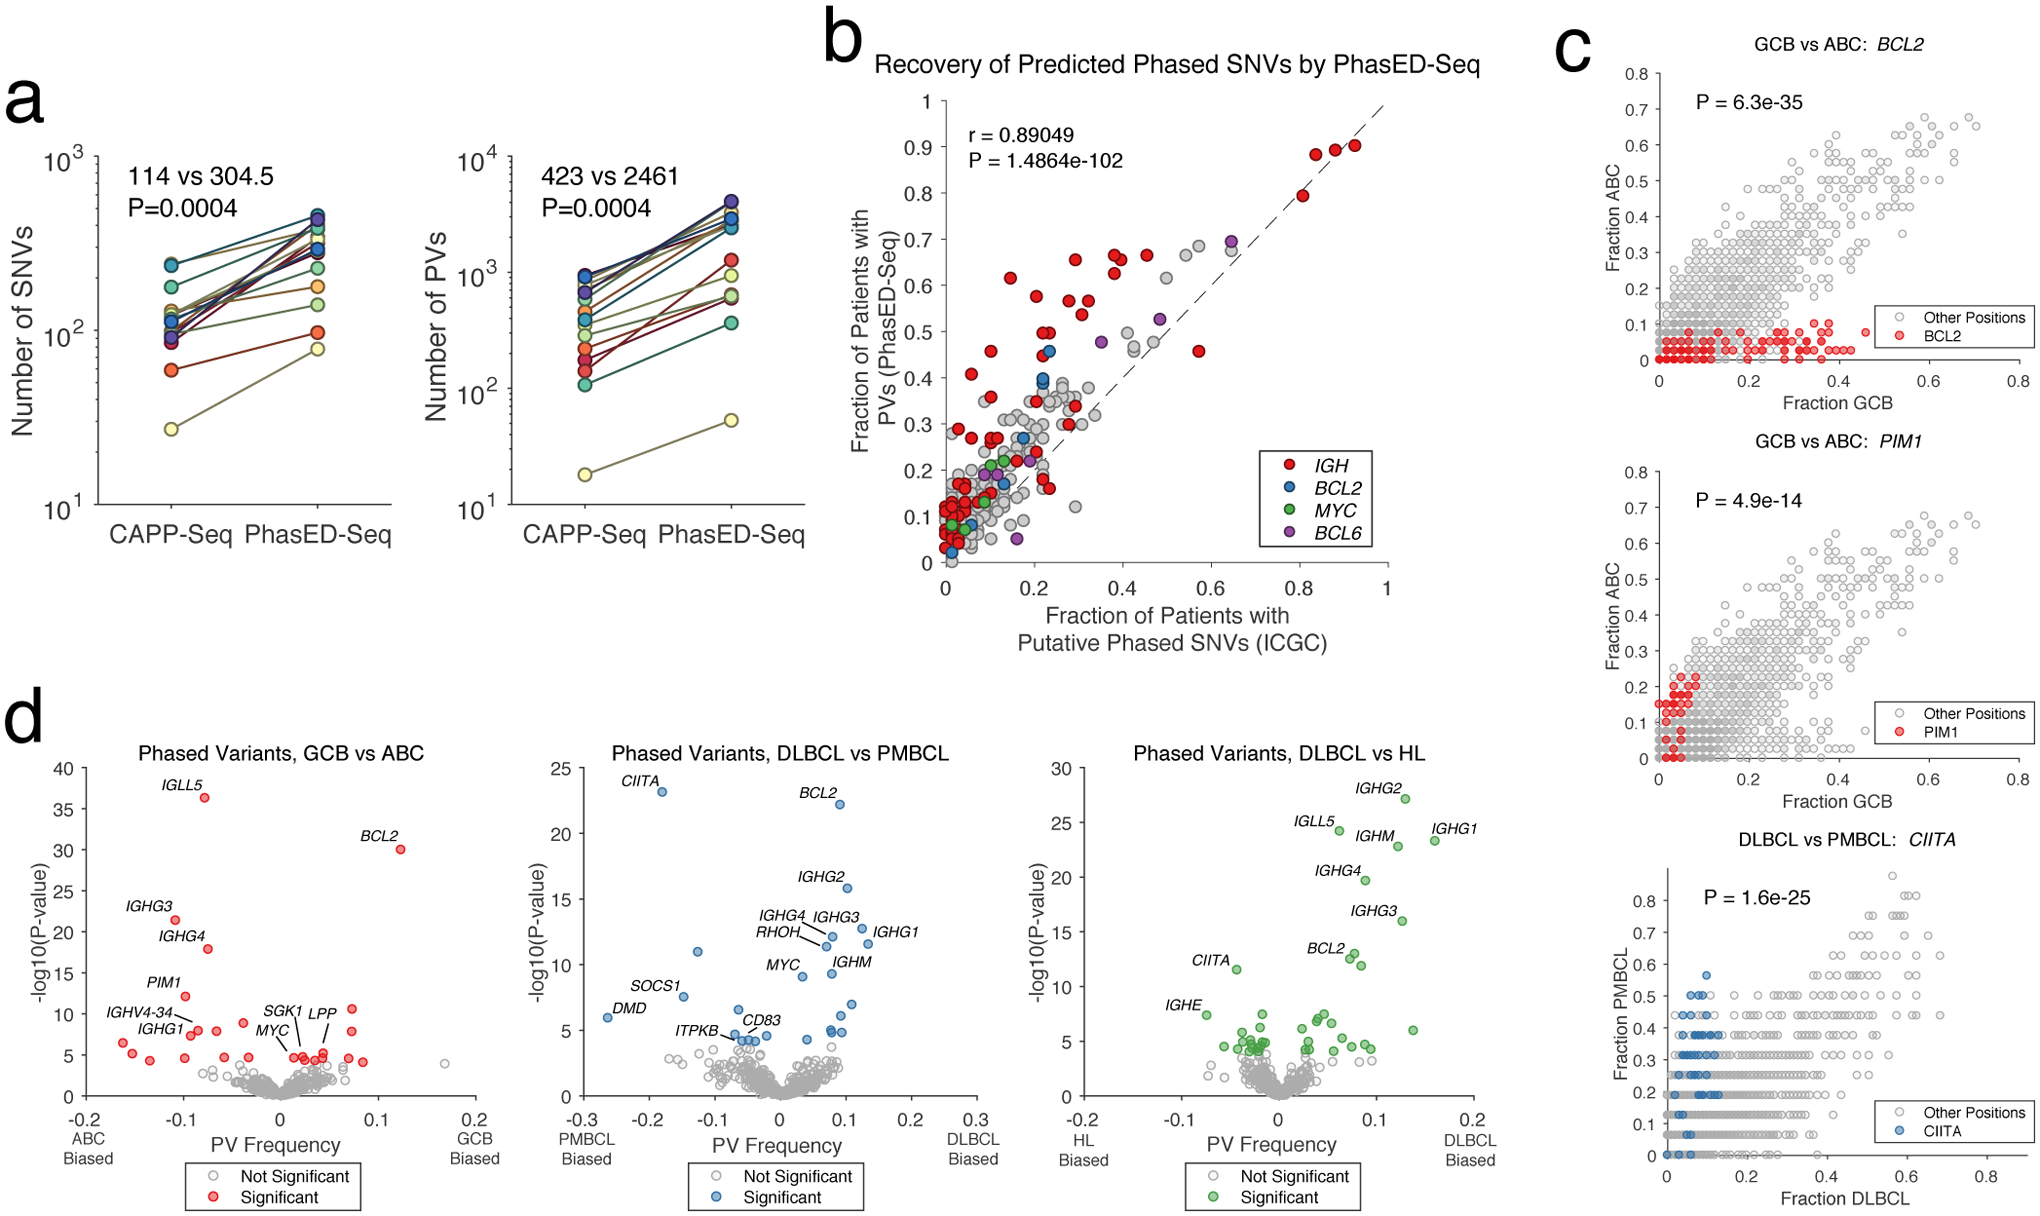
a) Two panels comparing the yield of SNVs (left) and PVs (right) for sequencing tumor and/or cell-free DNA and matched germline by a previously established lymphoma CAPP-Seq panel or PhasED-Seq (2-sided Wilcoxon signed-rank test). PVs include doublet, triplet, and quadruplet phased events.
b) Scatterplot showing the frequency and Pearson correlation of PVs in 1000bp bins for patients with DLBCL, identified either by WGS or PhasED-Seq.
c) Scatterplots comparing the frequency of PVs by location (in 50bp bins) for subtypes of lymphoma. The colored circles show the frequency of PVs in 50bp bins from a gene of interest; the other (grey) circles show the frequency of PVs in 50bp bins from the remainder of the PhasED-Seq sequencing panel. Statistical testing performed by two-sided Wilcoxon rank sum of all 50bp bins in a given gene against all other bins (Methods). See https://phasedseq.stanford.edu for additional details.
d) Volcano plots summarizing the difference in relative frequency of PVs in specific loci between types of lymphoma, including ABC-DLBCL vs. GCB-DLBCL (red, left); PMBCL vs DLBCL (blue, middle); and HL vs. DLBCL (green, right). (Methods).
Differences in Phased Variants between Lymphoma Subtypes
Having validated the PhasED-Seq panel, we sought to assess the biological differences in PVs between various B-cell malignancies, including DLBCL (n=101), primary mediastinal B-cell lymphoma (PMBCL) (n=16), follicular lymphoma (n=13), classical Hodgkin lymphoma (cHL) (n=23), and mantle cell lymphoma (MCL) (n=13) (Table S4). We evaluated the quantity of SNVs and PVs in each of these lymphomas, as well as the number of ‘independent tumor reporters’ for possible disease monitoring from cfDNA, defined as PVs separated into 150bp islands across our panel (Extended Data Fig 5f–j, Methods). The number of SNVs identified per case was not significantly different between lymphoma subtypes, with the exception of fewer SNVs in MCL. However, DLBCL, PMBCL, and FL had a higher burden of PVs than cHL or MCL, consistent with MCL having a lower activity of AICDA. We also observed differences in the genomic locations of PVs between lymphoma subtypes (Fig 3c–d, Supplementary Fig 2), including frequent PVs in BCL2 in GCB-DLBCL, PIM1 PVs in ABC-DLBCL, and CIITA PVs in PMBCL28,37,38. Additional loci enriched in specific lymphoma types are provided in Table S5.
Recovery of Phased Variants through PhasED-Seq
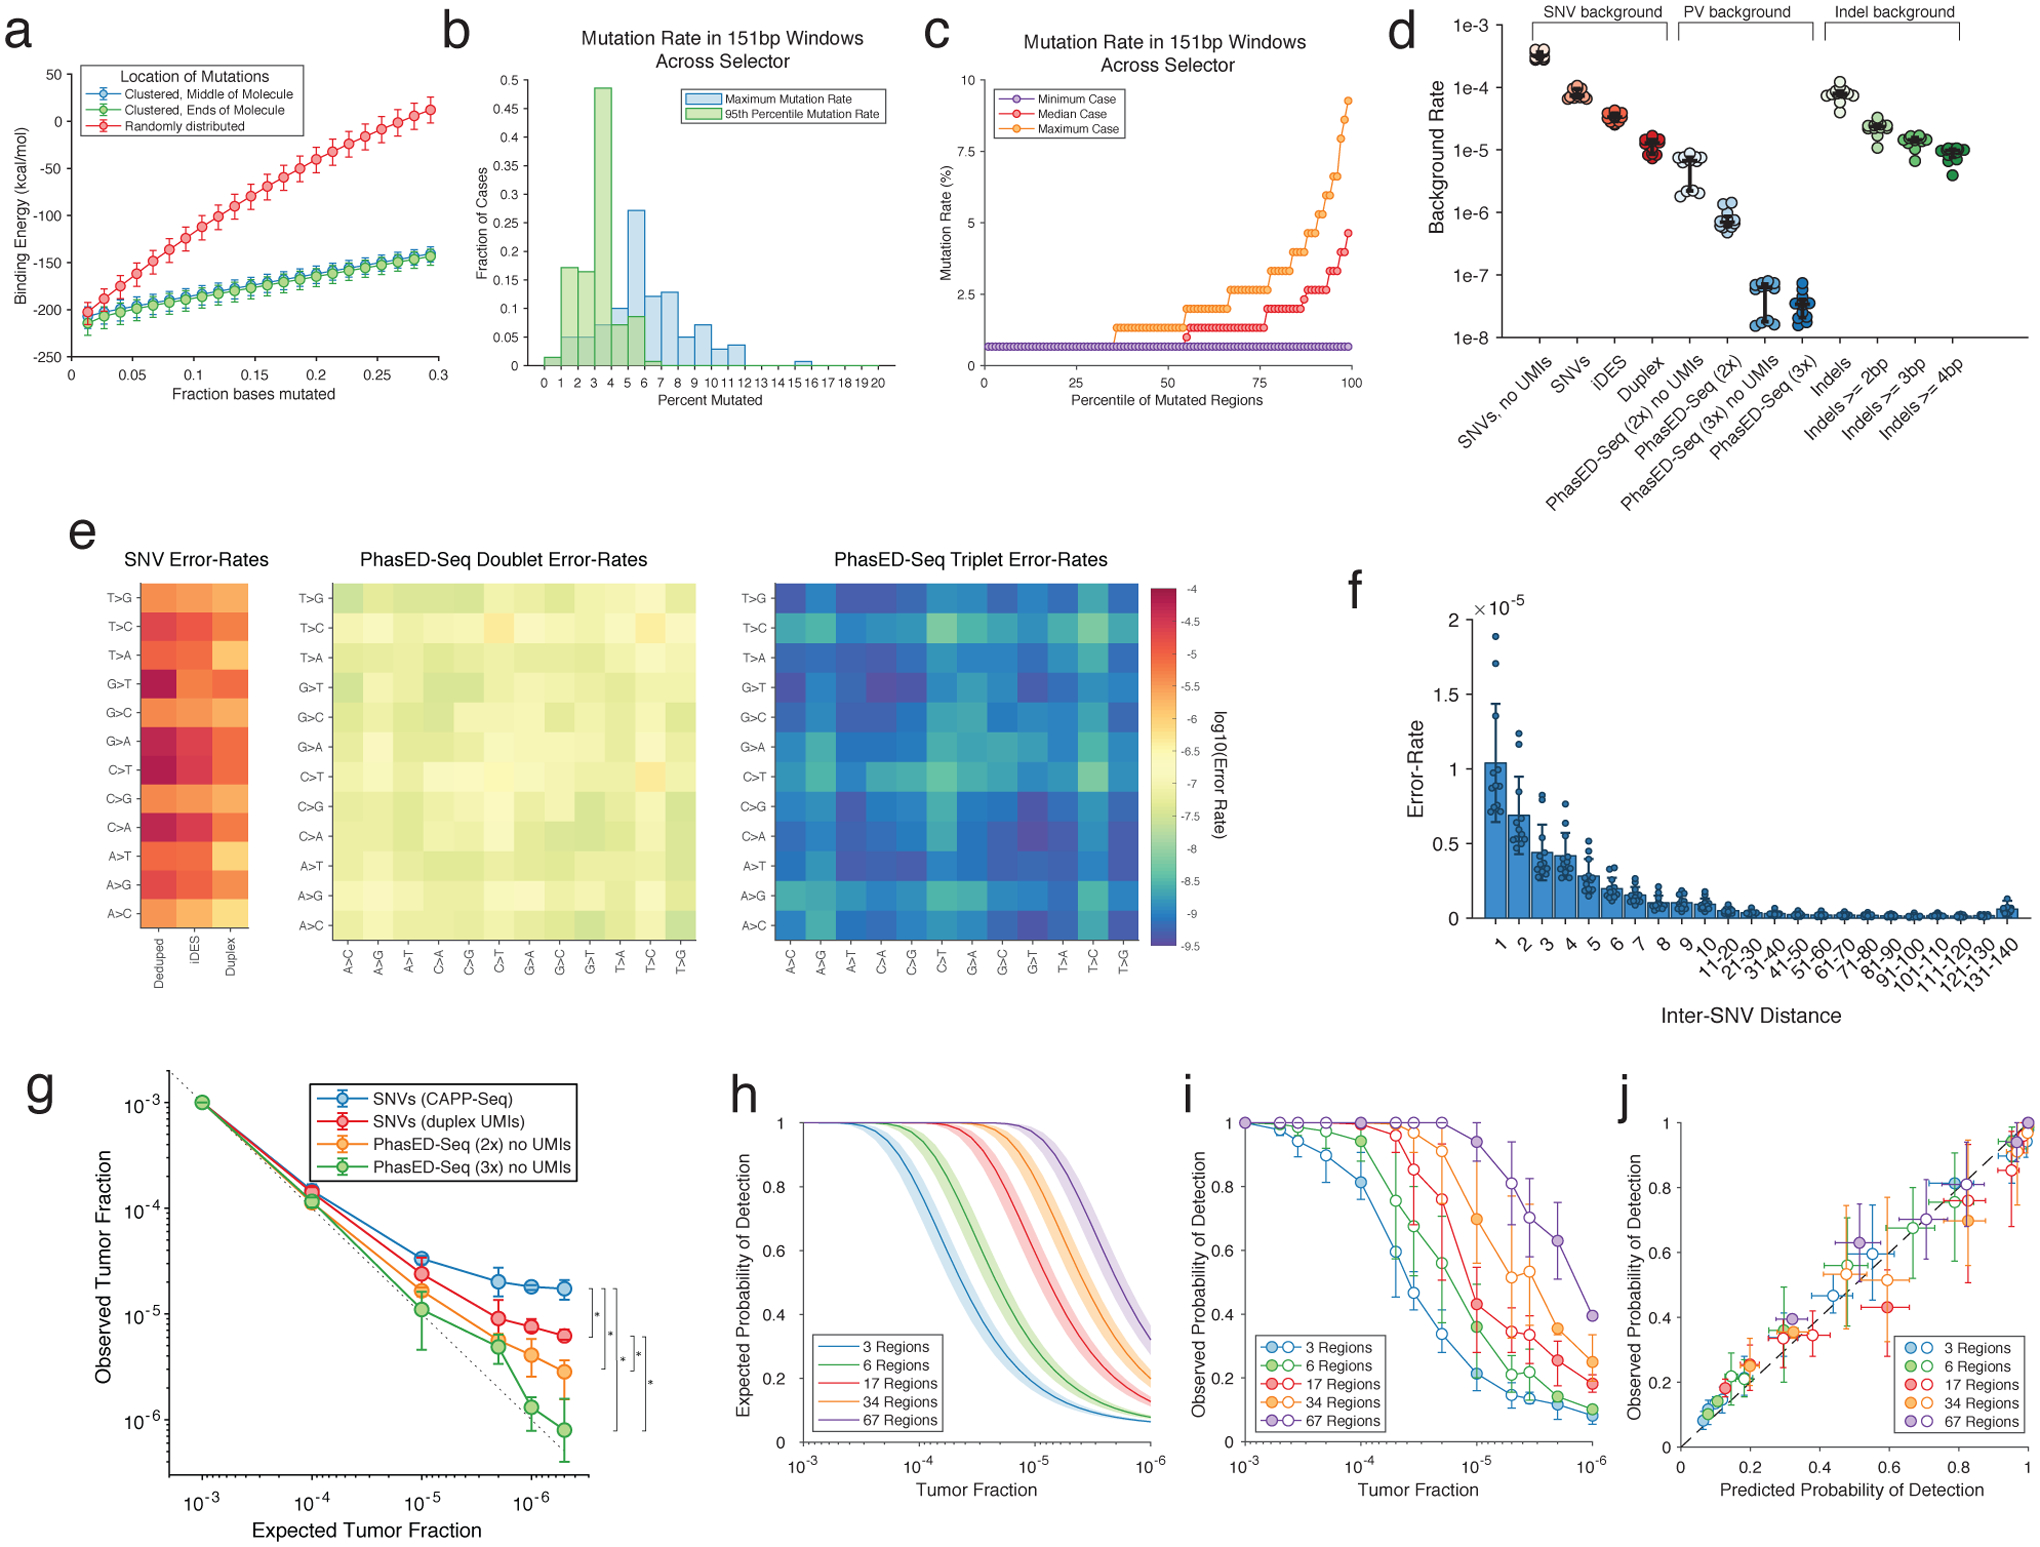
To facilitate detection of ctDNA using PVs, efficient recovery of DNA molecules is required. Hybrid-capture sequencing is potentially sensitive to DNA mismatches, and AID hotspots can contain a 5–10% or higher local mutation rate39. Using in silico simulation of 150-mers, we observed the expected decrease in predicted binding energy with an increasing number of mutations (Extended Data Fig 5a). We assessed the effect on hybrid-capture sequencing efficiency using synthetic 150bp DNA oligonucleotides with 0 to 10% difference from the reference sequence in MYC and BCL6, known targets of aSHM (Table S6, Methods). When subjecting an equimolar mixture of these oligonucleotides to capture and sequencing, molecules with as high as 5% mutation rate were captured with nearly the same efficiency as wildtype counterparts (85% vs 100%), while molecules with 10% mutations were captured with only 27% relative efficiency (Fig 4a). Notably, only 7% of cases had any region exceeding 10% mutation frequency across the panel (Methods, Extended Data Fig 5b–c), and in all cases the 90th percentile mutation rate was <5%, suggesting the majority of phased mutations are recoverable by hybrid capture.
Figure 4. Technical performance of PhasED-Seq.
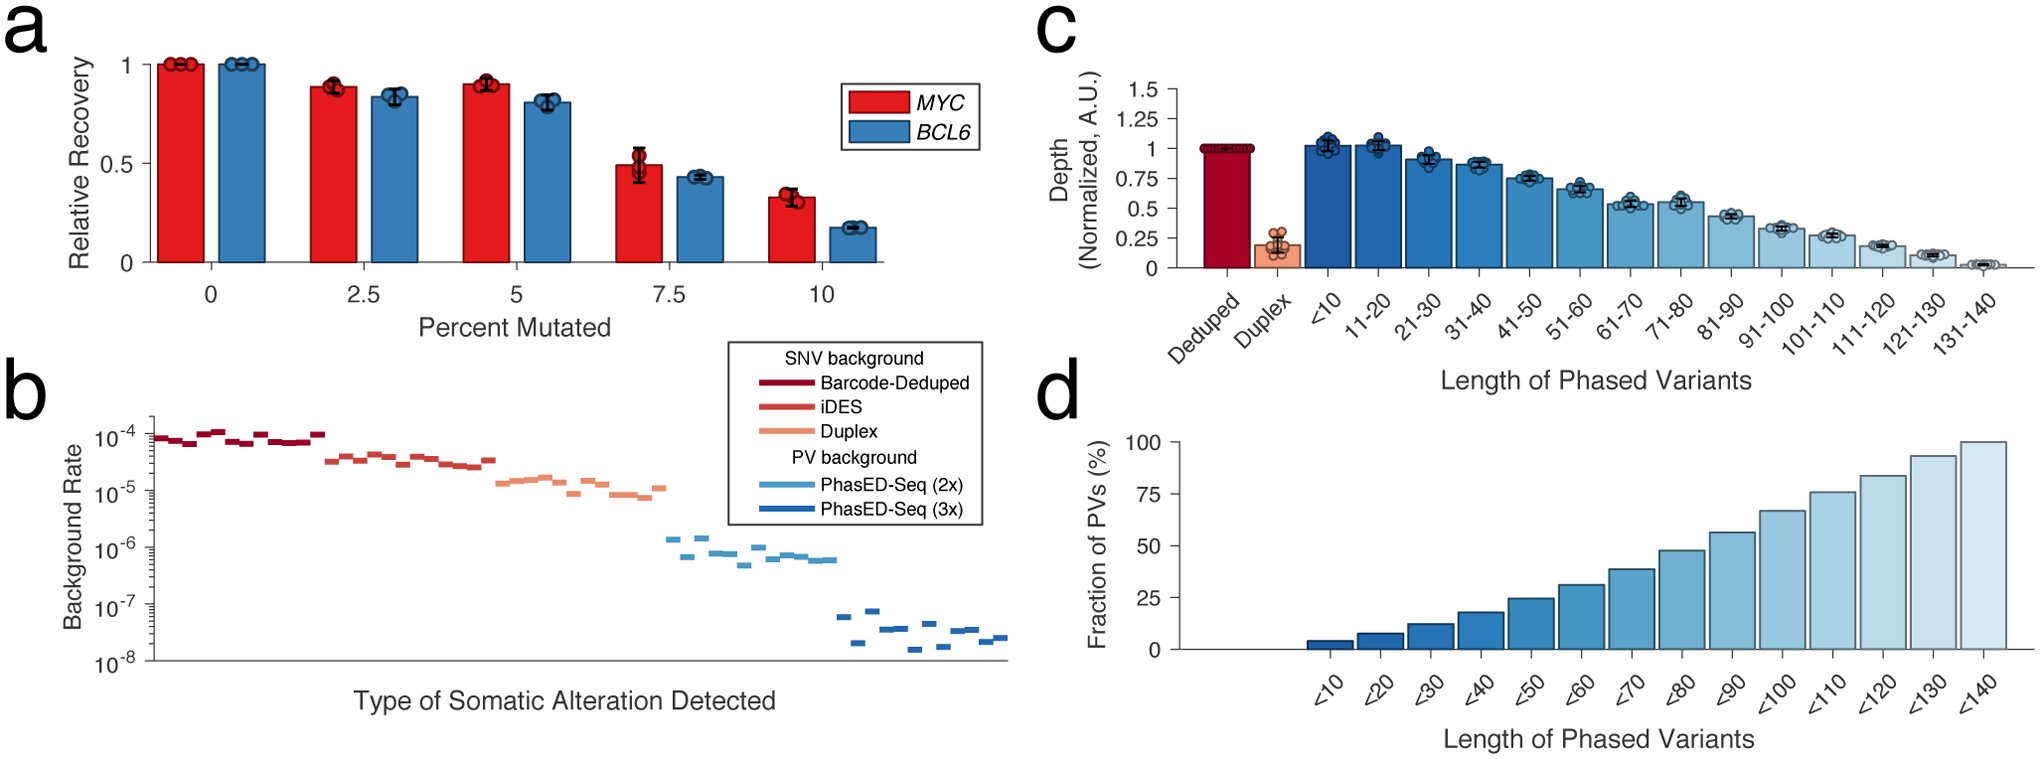
a) Bar plot showing the performance of hybrid capture sequencing across n=3 replicates for recovery of synthetic 150bp oligonucleotides from two loci (MYC and BCL6, Table S6) with increasing degree of mutation. Data are presented as mean +/- 95% C.I. normalized to the unmutated condition.
b) Plot demonstrating the background rate (see Methods) for different sequencing methods from 12 control cfDNA samples.
c) Bar plot showing the unique molecular depth of sequencing from n=12 independent cfDNA samples for single-stranded and duplex deduplication, and recovery of PVs of increasing distance between SNVs in-phase. Data are presented as mean +/- S.D.
d) Bar plot showing the cumulative fraction of PVs that have a maximal distance between SNVs less than a given number of base pairs.
Background Profile and Limit of Detection of PhasED-Seq
Previous methods for error-suppressed sequencing of cfDNA have utilized either a combination of molecular and in silico methods for error suppression (e.g., integrated digital error suppression, iDES2) or duplex sequencing to reduce background signal17. However, each of these has limitations, either for detecting ultra-low tumor fractions or for efficient recovery of original DNA molecules. We compared the background profile and recovery of input genomes from plasma cfDNA samples from 12 healthy adults by PhasED-Seq with both iDES-CAPP-Seq and duplex sequencing. As expected, while iDES-enhanced CAPP-Seq had a lower background profile than barcode-deduplication alone, duplex sequencing offered even lower background signal for non-reference single nucleotide substitutions (Fig 4b, 3.3 × 10⁻⁵ vs. 1.2 × 10⁻⁵, P<0.0001). However, the rate of phased errors – i.e., multiple non-reference bases occurring on the same sequencing fragment – was significantly lower than the rate of single errors in either iDES-enhanced CAPP-Seq or duplex sequencing data. This was true for the incidence of both two (2x or ‘doublet’ PVs) or three (3x or ‘triplet’ PVs) substitutions on the same DNA molecule (Fig 4b, 8.0 × 10⁻⁷ and 3.4 × 10⁻⁸ respectively, P<0.0001), even without the use of barcode-mediated error suppression (Extended Data Fig 5d). The background-rate of phased variants was also lower than that of small insertions and deletions (Extended Data Fig 5d). Phased errors containing C-to-T or T-to-C transitions were more common than other types of PVs (Extended Data Fig 5e). The rate of background PVs also decreased with increasing distance between positions (Extended Data Fig 5f). When considering unique molecular depth, duplex sequencing recovered only 19% of all unique cfDNA fragments (Fig 4c). In contrast, the unique depth of reads covering PVs within a genomic distance of <20bp was nearly identical to the overall sample depth. Similarly, PVs up to 80bps in size had depth greater than 50% of the median unique depth for a sample. Importantly, almost half (48%) of all PVs were less than 80bp in length (Fig 4d).
To compare PhasED-Seq to alternative methods for ctDNA detection, we generated limiting dilutions of ctDNA from 3 lymphoma patients into healthy control cfDNA, resulting in expected tumor fractions between 0.1% and 0.00005% (1:2,000,000; Methods, Table S7). We compared the expected and observed tumor fractions in each of these dilutions using PhasED-Seq as well as SNV-based methods (i.e., CAPP-Seq or duplex sequencing; Fig 5a). All methods performed equally well down to tumor fractions of 0.01% (1 part in 10,000). However, below this level (e.g., 0.001%, 0.0002%, 0.0001%, and 0.00005%), both PhasED-Seq and duplex sequencing significantly outperformed single-strand UMI based SNV detection (P<0.0001 for duplex, ‘2x’ PhasED-Seq, and ‘3x’ PhasED-Seq; Fig 5a). In addition, when compared to detection of SNVs from duplex molecules, tracking either 2 or 3 variants in-phase (i.e., 2x and 3x PhasED-Seq) more accurately identified expected tumor content, with superior linearity down to 1 part in 2,000,000 (P = 0.005 for duplex vs 2x PhasED-Seq, P=0.002 for 3x PhasED-Seq) (Methods). This was also true even without use of molecular barcodes (Extended Data Fig 5g). We also assessed specificity of PVs by looking for evidence of tumor-derived SNVs or PVs in cfDNA samples from 12 unrelated healthy control subjects and the healthy control used for our limiting dilution. Here, PhasED-Seq showed the lowest background signal across methods (Fig 5b). This lower error rate and background from PVs improves the detection limit for ctDNA disease detection. The detection limit could be accurately modeled as a binomial sampling process down to the parts-per-million range, with increased detection from increasing number of independent reporters (Extended Data Fig 5h–j, Methods).
Figure 5. Dilution series to determine detection limits.
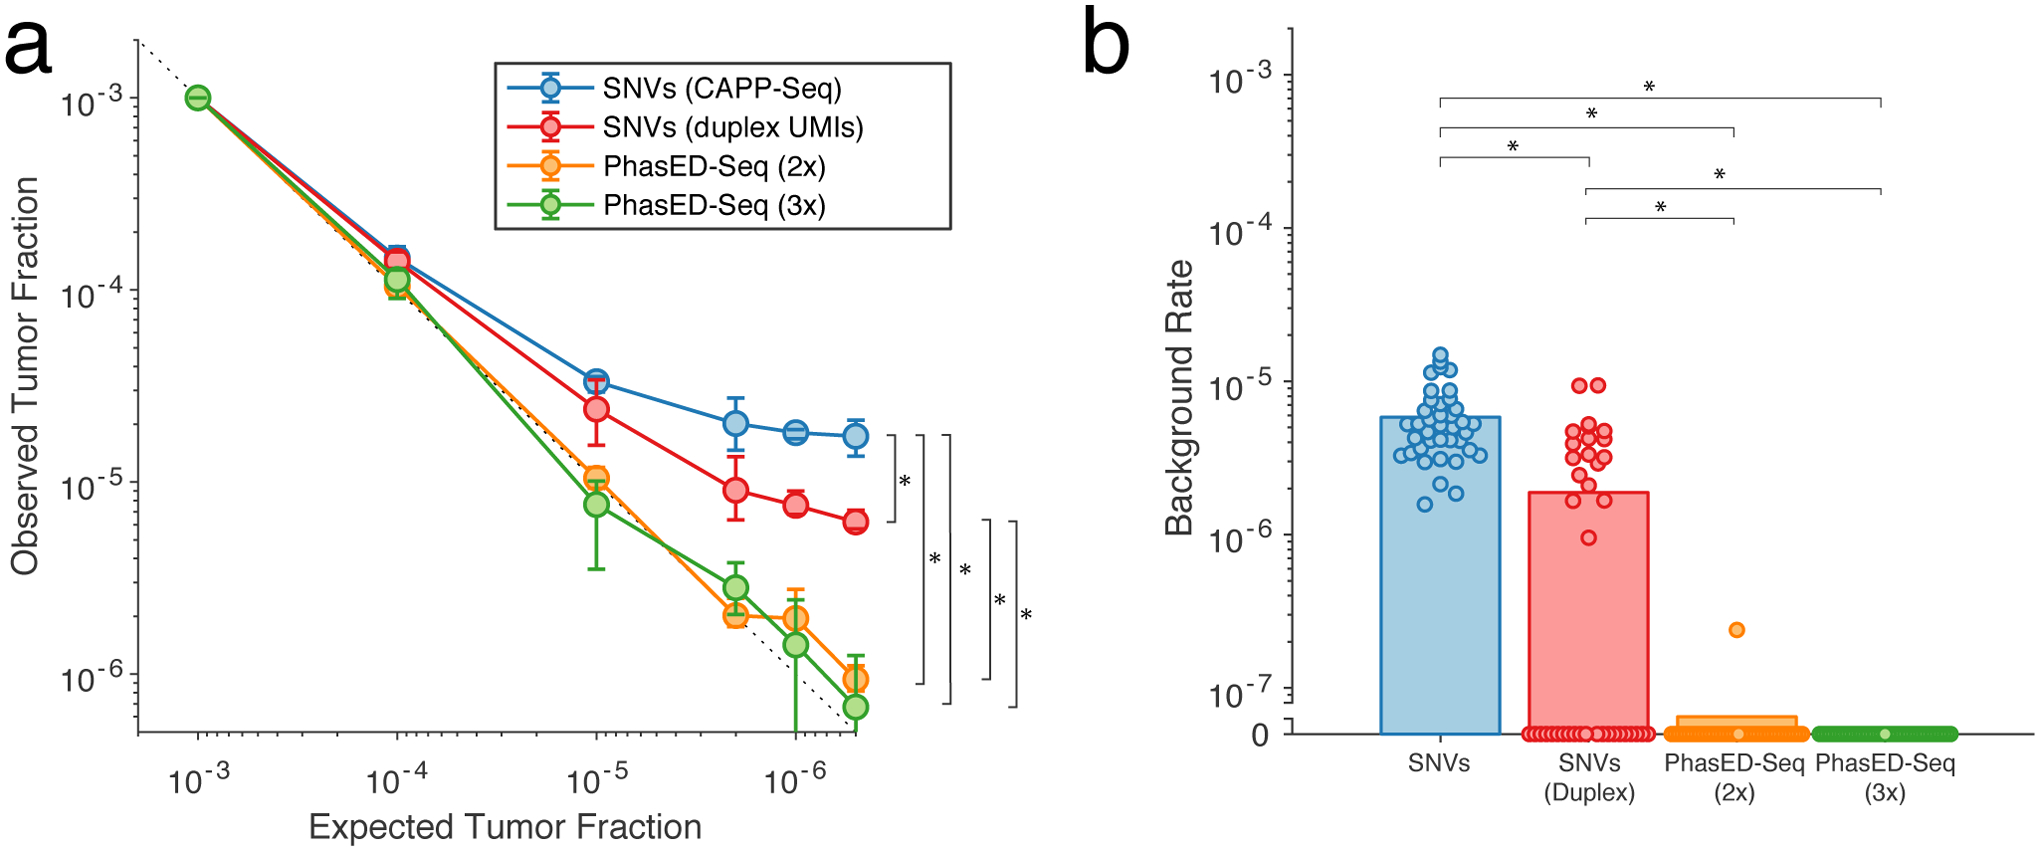
a) A limiting dilution series simulating cfDNA containing patient-specific tumor fractions of 1×10⁻³ to 0.5×10⁻⁶; cfDNA from n=3 independent patient samples were used in each dilution. We analyzed the same sequencing data using multiple methods, including iDES-enhanced CAPP-Seq, duplex sequencing, and PhasED-Seq (both for recovery of doublet and triplet molecules). Data presented are the mean and range across the three independent patient samples. The difference between observed and expected tumor fractions for sample < 1:10,000 were compared via paired t-test. *, P<0.05; CAPP-Seq vs duplex, P=3.2e-5; CAPP-Seq vs PhasED-Seq (2x), P=1.1e-4; CAPP-Seq vs PhasED-Seq (3x), P=1.9e-5; duplex vs PhasED-Seq (2x), 0.0047; duplex vs PhasED-Seq (3x), 0.0016.
b) Plot demonstrating the background signal of tumor-specific alleles in 12 unrelated control cfDNA samples, and the control cfDNA sample used for limiting dilution series (n=13 total samples). In each sample, we assessed for tumor-specific SNVs or PVs from the 3 patient samples utilized in the limiting dilution experiment, for a total of 39 assessments. Bars represent the mean across all 39 assessments; statistical comparison performed by Wilcoxon rank-sum test. *, P<0.05; CAPP-Seq vs duplex, P=3.7e-8; CAPP-Seq vs PhasED-Seq (2x), P=4.4e-16; CAPP-Seq vs PhasED-Seq (3x), P=2.9e-16; duplex vs PhasED-Seq (2x), 9.0e-6; duplex vs PhasED-Seq (3x), 3.1e-6.
Improvements in Detection of Low-Burden MRD
To test the utility of the lower detection limits from PhasED-Seq, we sequenced serial cfDNA from a patient undergoing front-line therapy for DLBCL (Fig 6a). Using SNV-based methods (i.e., CAPP-Seq), ctDNA was undetectable after only one cycle of therapy. Subsequently, detectable ctDNA re-emerged >250 days later, with eventual clinical and radiographic progression 5 months later, indicating falsely negative measurements with SNVs. Strikingly, all four of the plasma samples that were undetectable using SNVs during and after treatment had detectable ctDNA levels by PhasED-Seq, with mean allelic fractions as low as 4 in 1,000,000. This increased sensitivity improved the lead-time of disease detection by ctDNA compared to radiographic surveillance from 5 to 10 months with PhasED-Seq.
Figure 6. Clinical application of PhasED-Seq for ultra-sensitive disease detection and response monitoring in DLBCL.
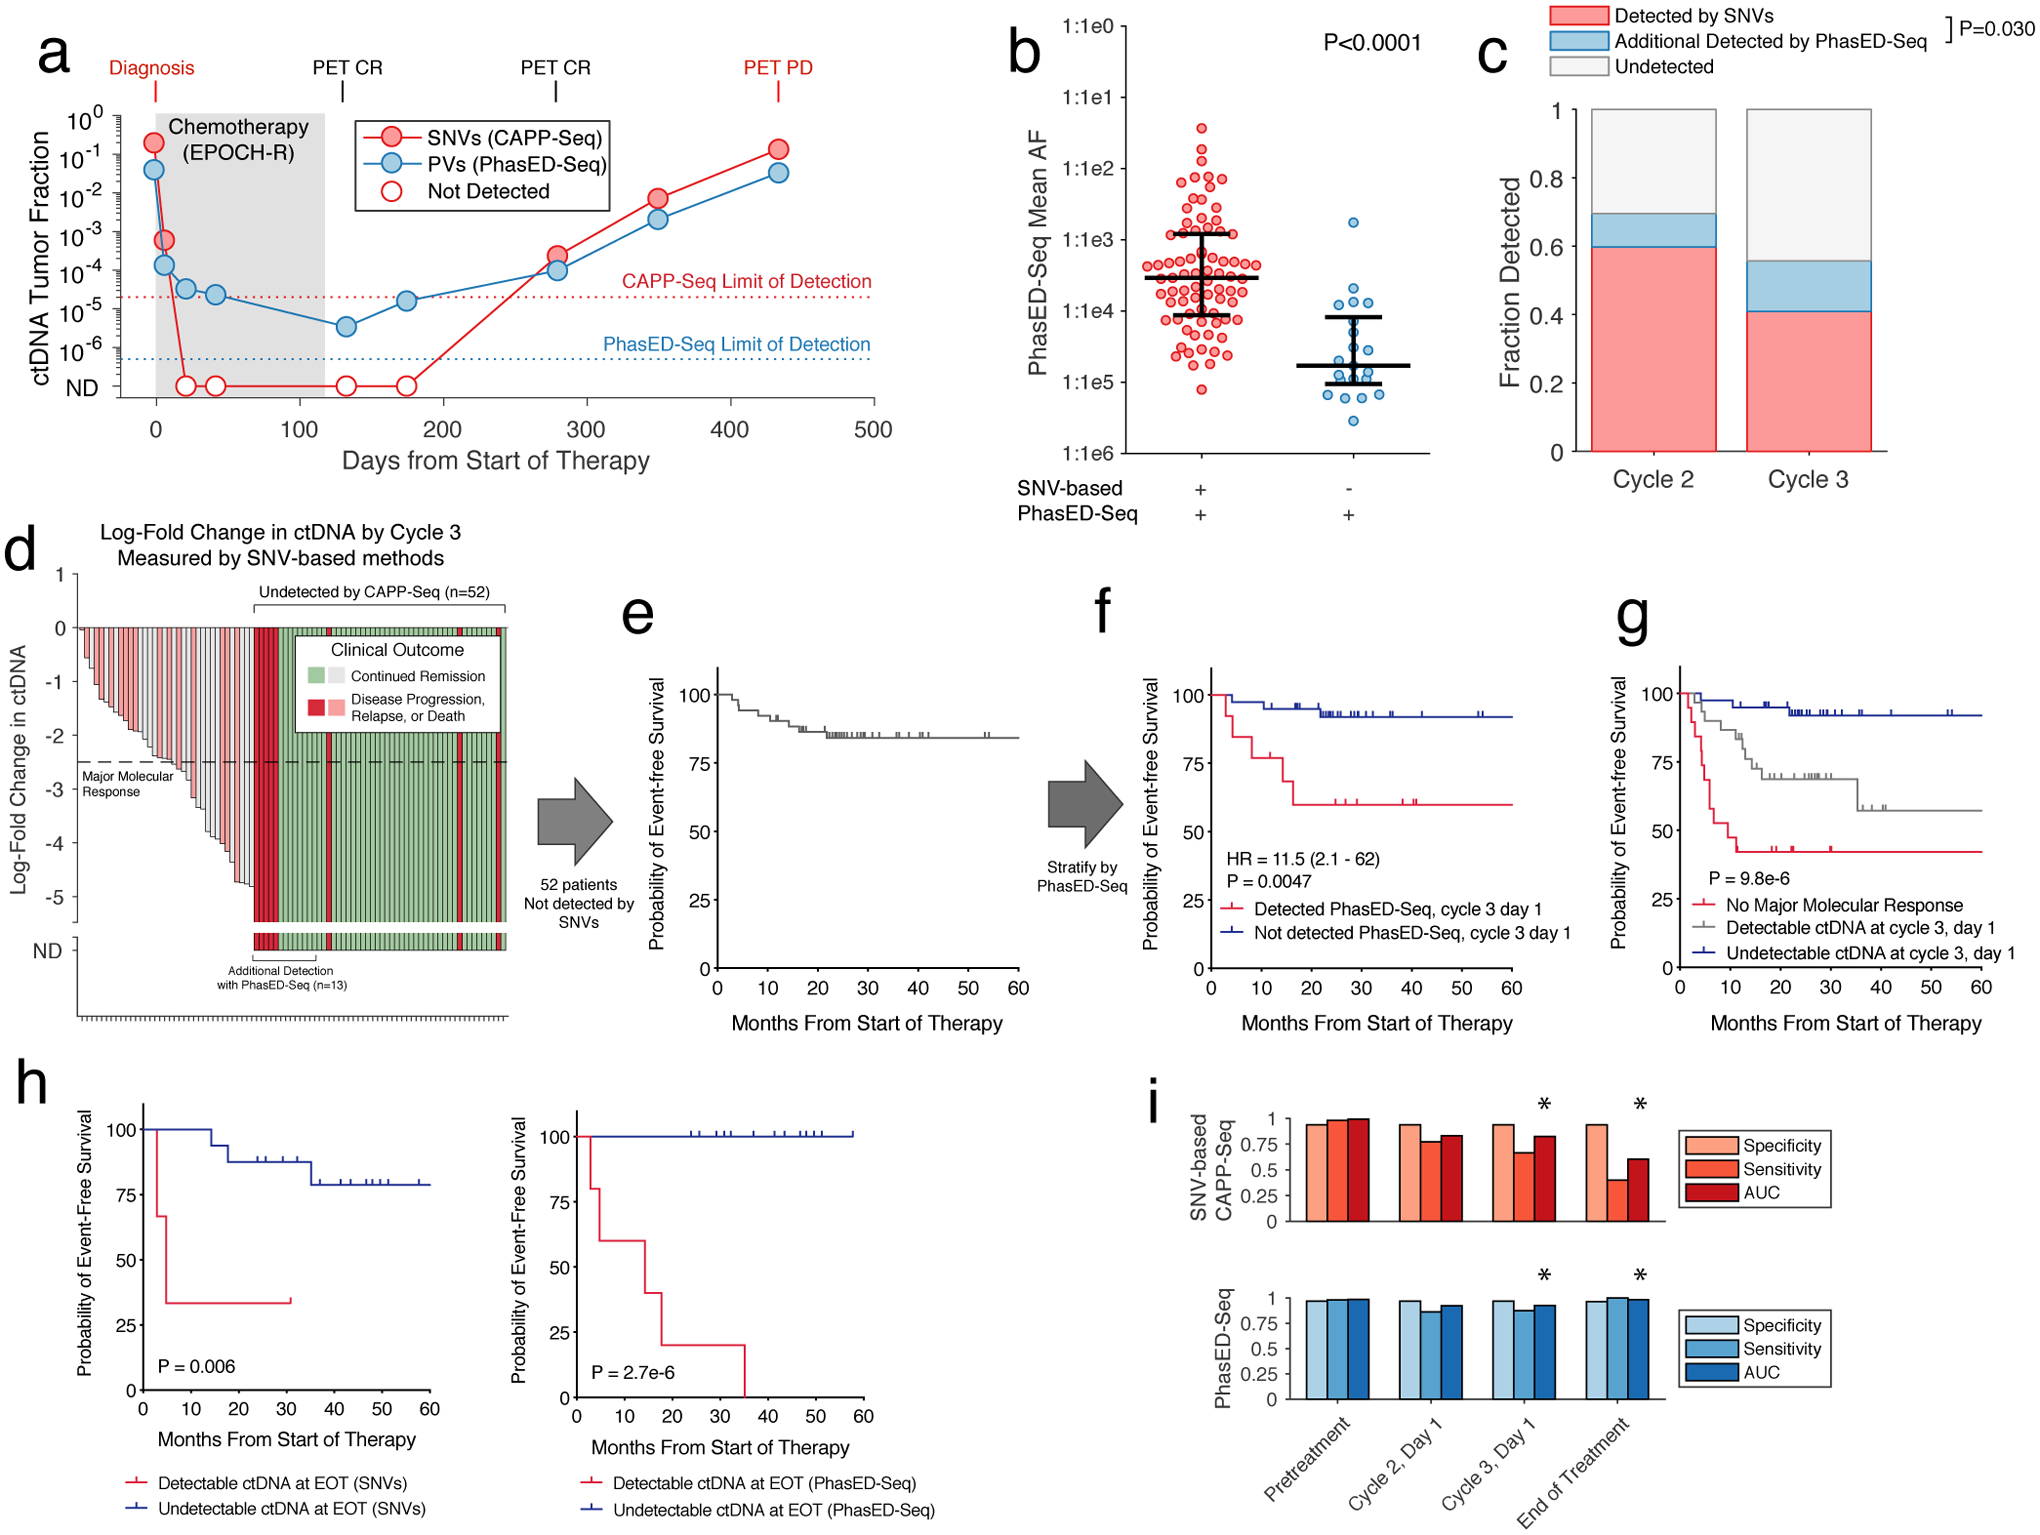
a) Plot showing ctDNA levels for a patient with DLBCL undergoing first-line therapy measured by both CAPP-Seq and PhasED-Seq. Open circles represent undetectable levels by CAPP-Seq. ND, not detected.
b) Univariate scatter plot showing the mean tumor allele fraction of n=98 independent clinical samples measured by PhasED-Seq after 1 or 2 cycles of therapy for DLBCL. The plot is divided by detection with CAPP-Seq; P-value from Wilcoxon rank-sum test. Bars show median and IQR.
c) Bar plot showing the fraction of DLBCL patients who are ctDNA+ by CAPP-Seq after 1/2 treatment cycles (red), and the fraction of additional patients ctDNA+ with addition of PhasED-Seq (blue). P-value from Fisher’s Exact Test across 170 total samples.
d) Waterfall plot showing the change in CAPP-Seq ctDNA after 2 cycles in DLBCL patients. ND, not detected by CAPP-Seq.
e) Kaplan-Meier plot showing the event-free survival (EFS) for 52 DLBCL patients who are ctDNA-negative by CAPP-Seq after 2 cycles.
f) Kaplan-Meier plot and two-sided log-rank test showing the EFS of the 52 patients shown in e) stratified by ctDNA detection with PhasED-Seq.
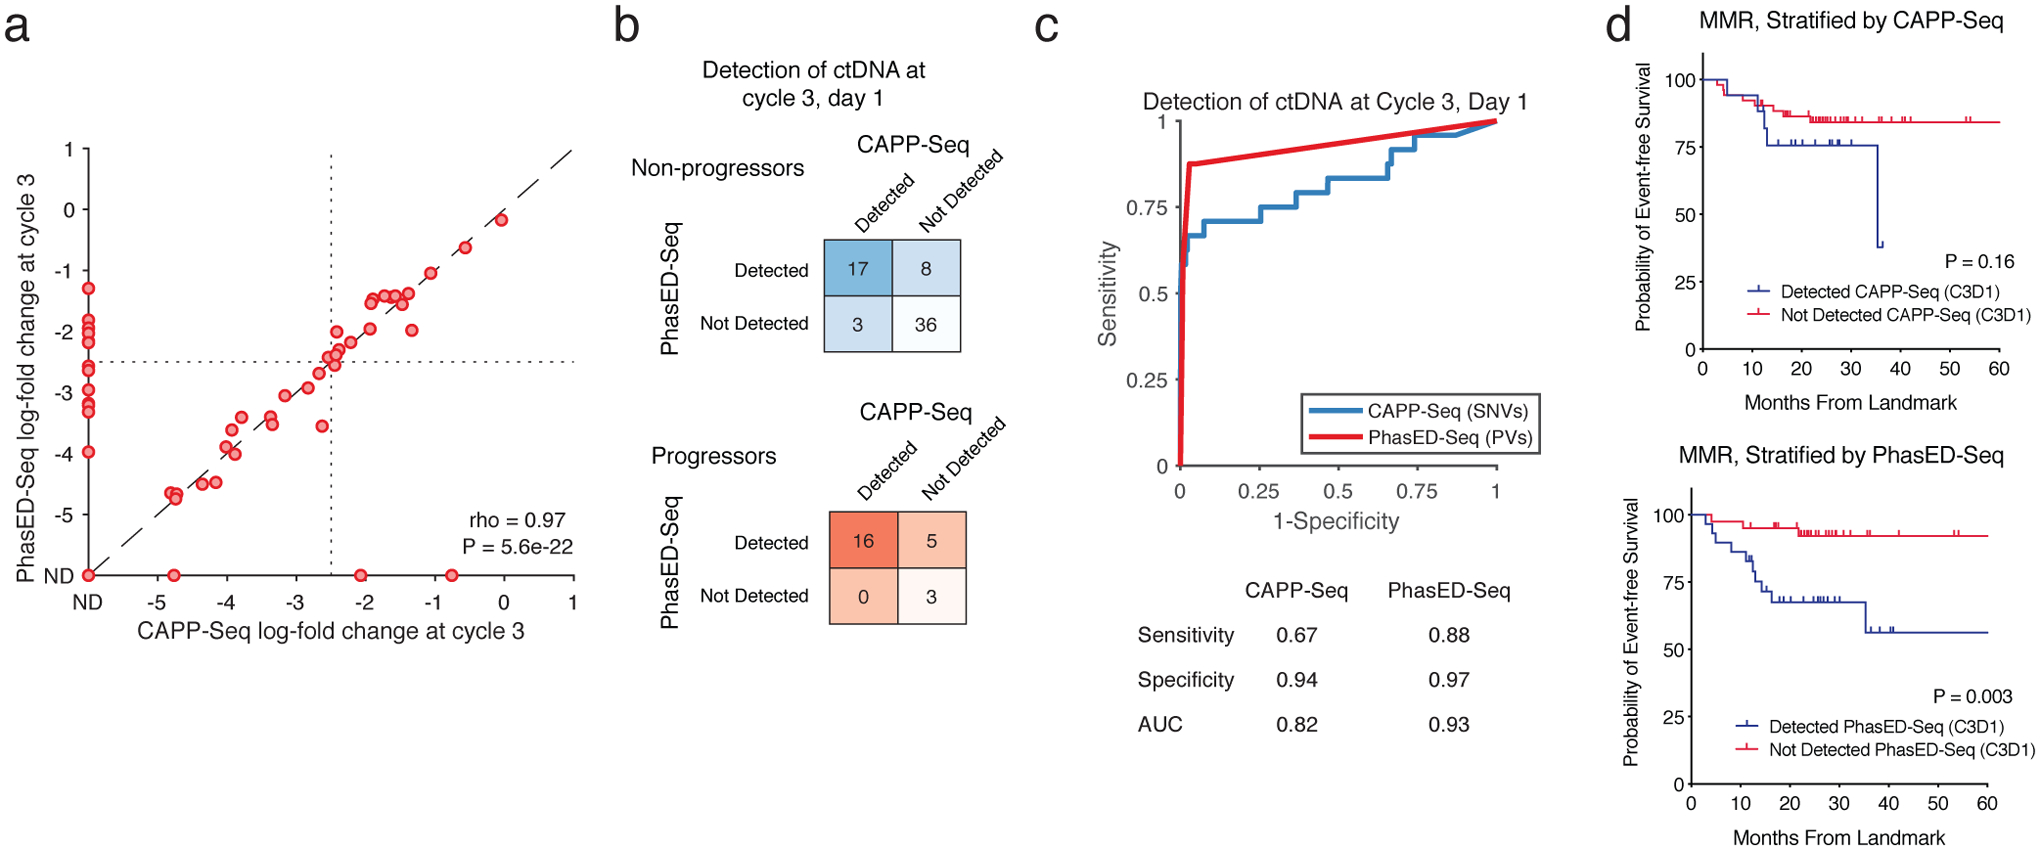
g) Kaplan-Meier plot and two-sided log-rank test showing the EFS for 88 patients with DLBCL stratified by ctDNA at cycle 3, day 1 separated into 3 strata – patients failing to achieve a MMR (red), patients achieving MMR with detectable ctDNA by PhasED-Seq and/or CAPP-Seq (grey), and patients with undetectable ctDNA by PhasED-Seq and CAPP-Seq.
h) Kaplan-Meier plots and two-sided log-rank test showing EFS for 19 DLBCL patients with >24 months of follow-up stratified by EOT ctDNA detection by CAPP-Seq (left) or PhasED-Seq (right).
i) Bar-plots summarizing the performance of ctDNA by CAPP-Seq (top, red) and PhasED-Seq (bottom, blue) at various time-points. True-positives included patients with a new diagnosis of lymphoma pretreatment (n=107), or patients known to have eventual disease progression for detection at cycle 2, cycle 3, or end of therapy (n=22, 24, and 5 respectively). True-negatives are healthy control cfDNAs compared to patient-specific sets of PVs (4280 total tests). * - P < 0.05 for AUC comparison by two-sided DeLong test; cycle 3 P = 0.043; EOT P = 0.022.
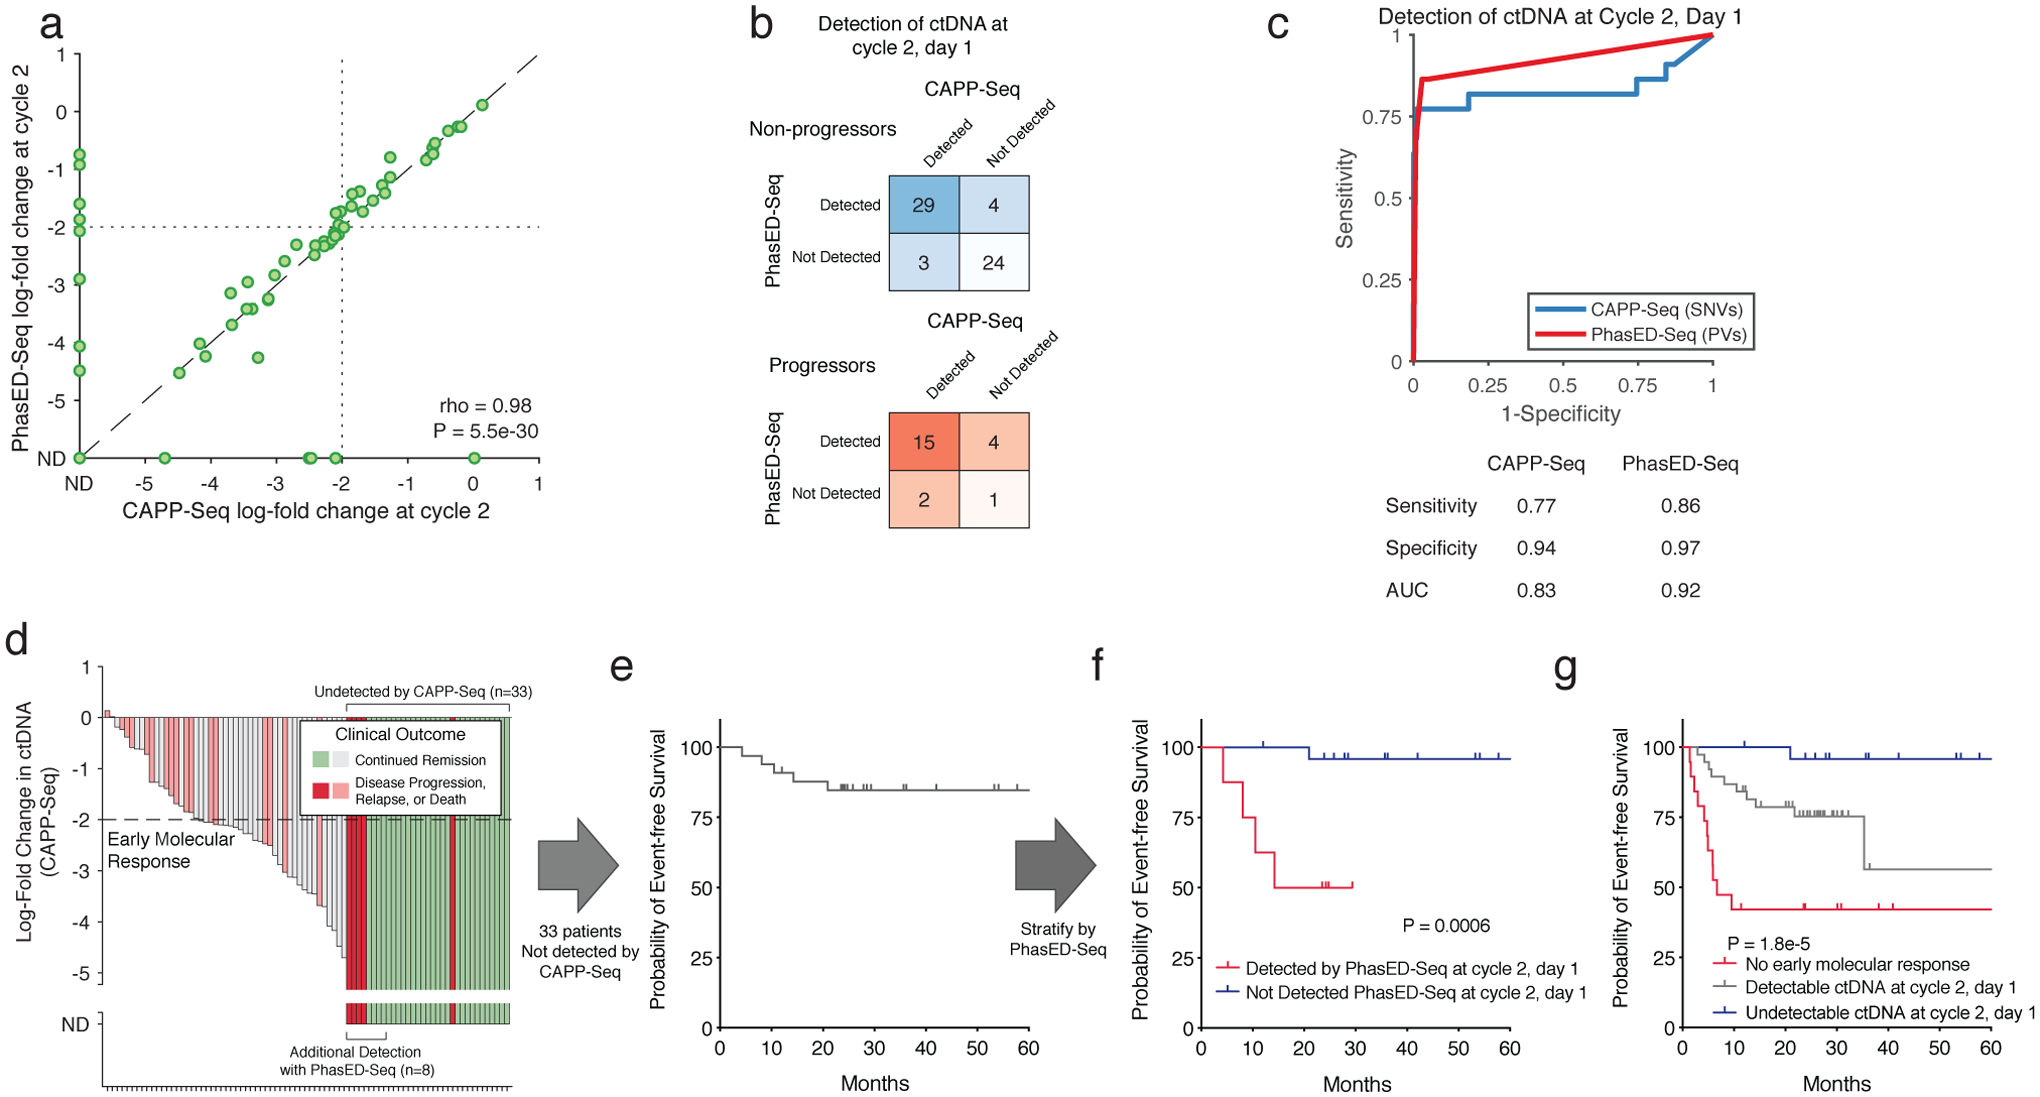
We next assessed the performance of PhasED-Seq in a cohort of 107 patients with large B-cell lymphomas receiving standard immuno-chemotherapy (Table S8). In total, we assessed 442 tumor, germ-line, and cell-free DNA samples, including cfDNA prior to therapy (n=107) and after 1 or 2 cycles of treatment (n=82 and 88). Prior to therapy, patient-specific PVs were detectable by PhasED-Seq in 98% of samples, with 97% specificity (Extended Data Fig 6a). Importantly, ctDNA levels measured by PhasED-Seq were highly correlated with those measured by prior SNV-based methods (Spearman rho=0.93, Extended Data Fig 6b). We next compared ctDNA levels measured by PhasED-Seq and SNV-based methods from samples after initiation of therapy. In total, 79% (77/98) of samples with detectable ctDNA by PhasED-Seq after 1 or 2 cycles were also detected by SNV-based methods (Fig 6b). Among 98 samples detected by PhasED-Seq, disease burden was significantly lower for those with undetectable (21%) vs. detectable (79%) ctDNA levels using SNVs, with a >10x difference in median ctDNA levels (tumor fraction 2.9×10⁻⁴ vs 1.5×10⁻⁵, P<0.0001, Fig 6b). In total, an additional 10% (8/82) of samples after 1 cycle of therapy and 15% (13/88) of samples after 2 cycles of therapy had detectable ctDNA when comparing PhasED-Seq with SNV-based CAPP-Seq (Fig 6c).
We previously described ctDNA molecular response criteria for DLBCL patients using SNV-based CAPP-Seq, including Major Molecular Response (MMR), defined as a 2.5-log reduction in ctDNA after 2 cycles of therapy14. However, many patients have undetectable ctDNA when measured by SNVs at this landmark (Fig 6d–e). Indeed, in the 88 patients with a sample available from this time-point, 59% (52/88) had undetectable ctDNA by SNV-based CAPP-Seq at their interim MMR assessment, after completing 2 of 6 planned cycles of therapy. Using PhasED-Seq, 25% (13/52) of samples not detected by SNVs had evidence of ctDNA as evidenced by PVs, with levels as low as ~3:1,000,000 (Extended Data Fig 7) – these 13 cases additionally detected by PhasED-Seq represent potential false negative tests by prior SNV-based methods. Similar results were seen at the Early Molecular Response (EMR) time-point (i.e., after 1 cycle of therapy, Extended Data Fig 8).
While detection of ctDNA in DLBCL after 1 or 2 cycles of therapy is a known adverse prognostic marker14,15, outcomes for patients with undetectable ctDNA at these time-points are heterogeneous (Fig 6e, Extended Data Fig 8e). Importantly, even in patients with undetectable ctDNA by SNVs after 1 or 2 cycles of therapy, detection of ultra-low ctDNA levels by PhasED-Seq was strongly prognostic for outcomes including event-free survival (Fig 6f, Extended Data Fig 8f). When combining detection by PhasED-Seq with our previously described MMR threshold, patients could be stratified into three groups – patients not achieving MMR, patients achieving MMR but with persistent ctDNA, and patients with undetectable ctDNA (Fig 6g). Interestingly, while patients not achieving MMR were at especially high risk for early events despite additional planned first line therapy (i.e., within the first year of treatment), patients with persistent low levels of ctDNA appeared to have a higher risk of later relapse or progression events. In contrast, patients with undetectable ctDNA after 2 cycles of therapy by PhasED-Seq had overwhelmingly favorable outcomes. Similar results were seen at the EMR time-point after 1 cycle of therapy (Extended Data Fig 8g).
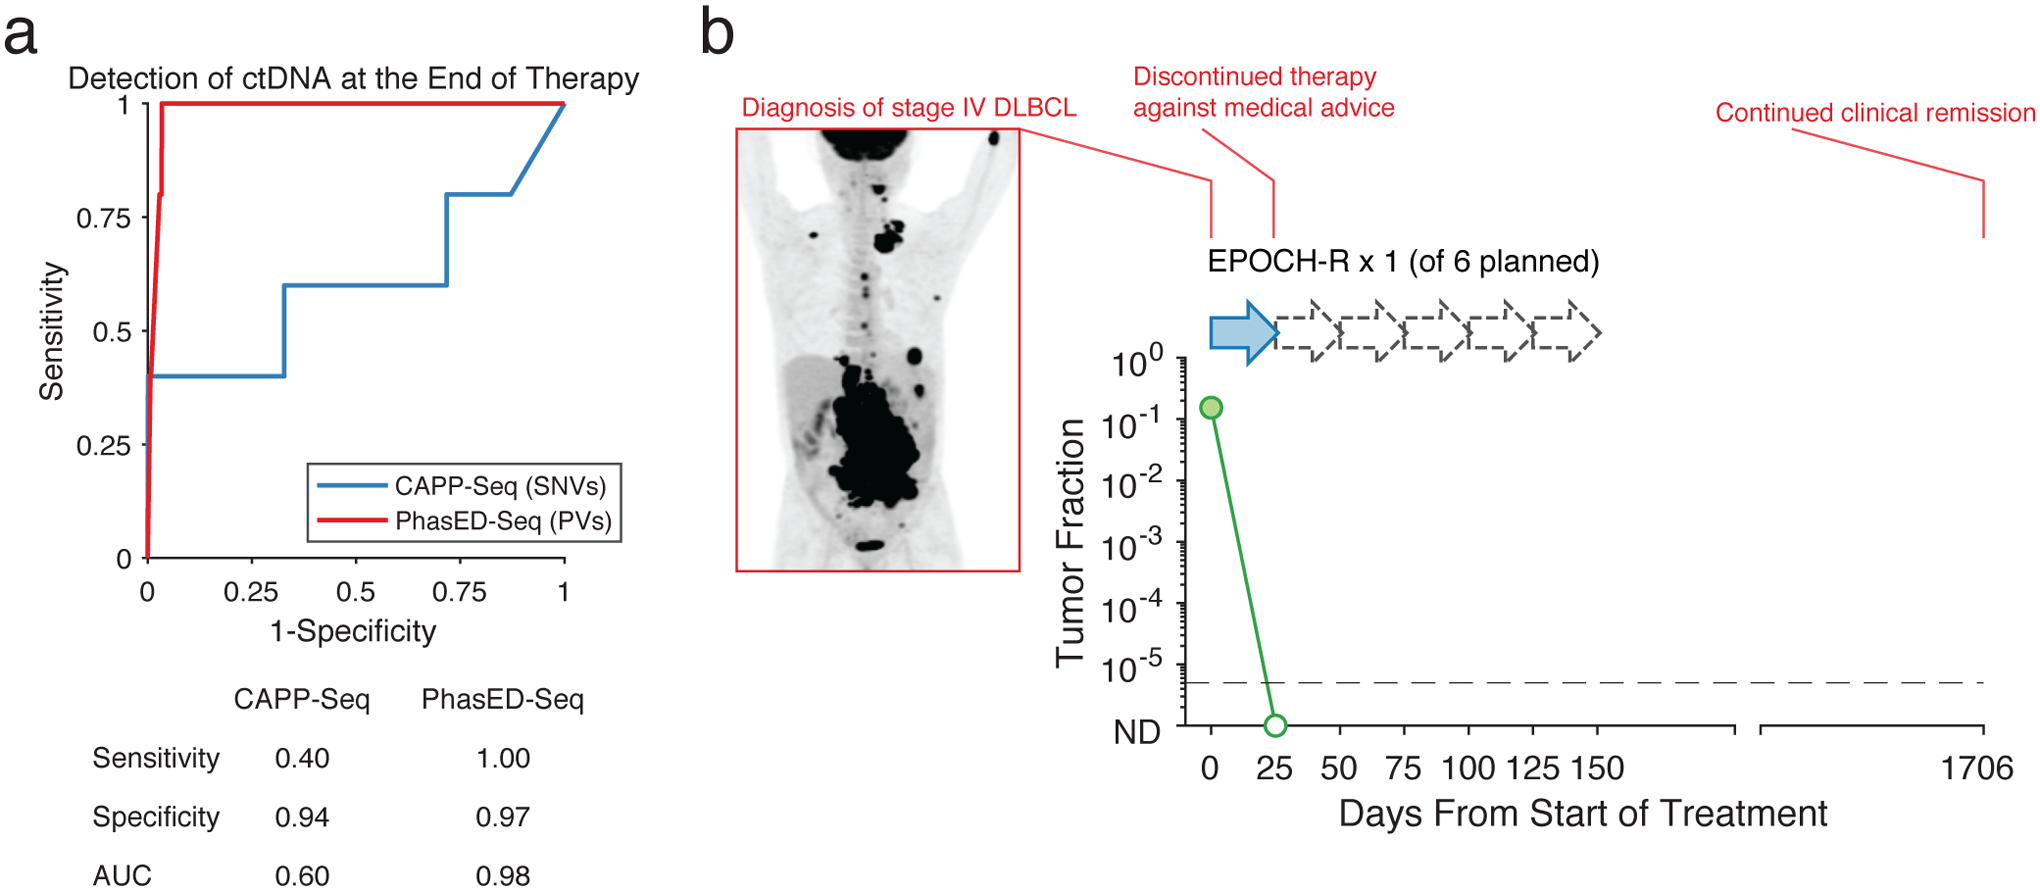
Given its enhanced sensitivity for detection of residual disease during therapy, we sought to explore disease detection via PhasED-Seq at the timepoint of lowest disease-burden (i.e., at end of therapy, EOT). We assessed SNV-based CAPP-Seq and PhasED-Seq ctDNA detection in a cohort of 19 patients after therapy, of whom 5 had eventual disease progression. While only 2/5 cases who had eventual progression at this landmark had detectable disease using SNVs, PhasED-Seq detected all 5/5 cases, resulting in improved stratification of outcomes (Fig 6h). PhasED-Seq also correctly identified all patients without clinical relapse as having no residual disease, including one patient with abbreviated therapy after only one cycle of treatment (Extended Data Fig 9). Taken together, this suggests the performance of PV-based PhasED-Seq outperformed SNV-based detection for residual disease, particularly during and after therapy (Fig 6i).
Extension of PhasED-Seq to solid tumors
While PVs are concentrated in stereotyped genomic loci B-cell malignancies, this is not the case in most other cancer types (Extended Data Fig 3). Despite this, most cancer-types considered in the PCAWG set have a sufficient number of PVs in their genome to improve on the limit of detection for ctDNA from SNV-based or alternative approaches using a typical sequencing depth (Fig 7a, Extended Data Fig 10a–c, Methods). However, these PVs must first be identified and targeted on an individualized basis. To extend PhasED-Seq beyond B-cell cancers, a ‘personalized’ approach is therefore needed, including i) up-front WGS from paired tumor/normal to identify candidate PVs, ii) design of a personalized panel to select loci containing PVs, and iii) targeted sequencing of cfDNA in these regions to monitor the previously defined PVs (Fig 7b). To explore the potential utility of this approach, we performed personalized PhasED-Seq for 6 patients with solid tumors (lung cancer, n=5; breast cancer, n=1). In all 6 cases, multiple PVs were identified from tumor/normal WGS and subsequently validated through targeted resequencing (median 118 validated PVs, range 14–622). Similar to our lymphoma PhasED-Seq panel, the background rate of PVs was lower than the background rate for SNVs across all 6 personalized panels, even compared to duplex molecules (Fig 7c).
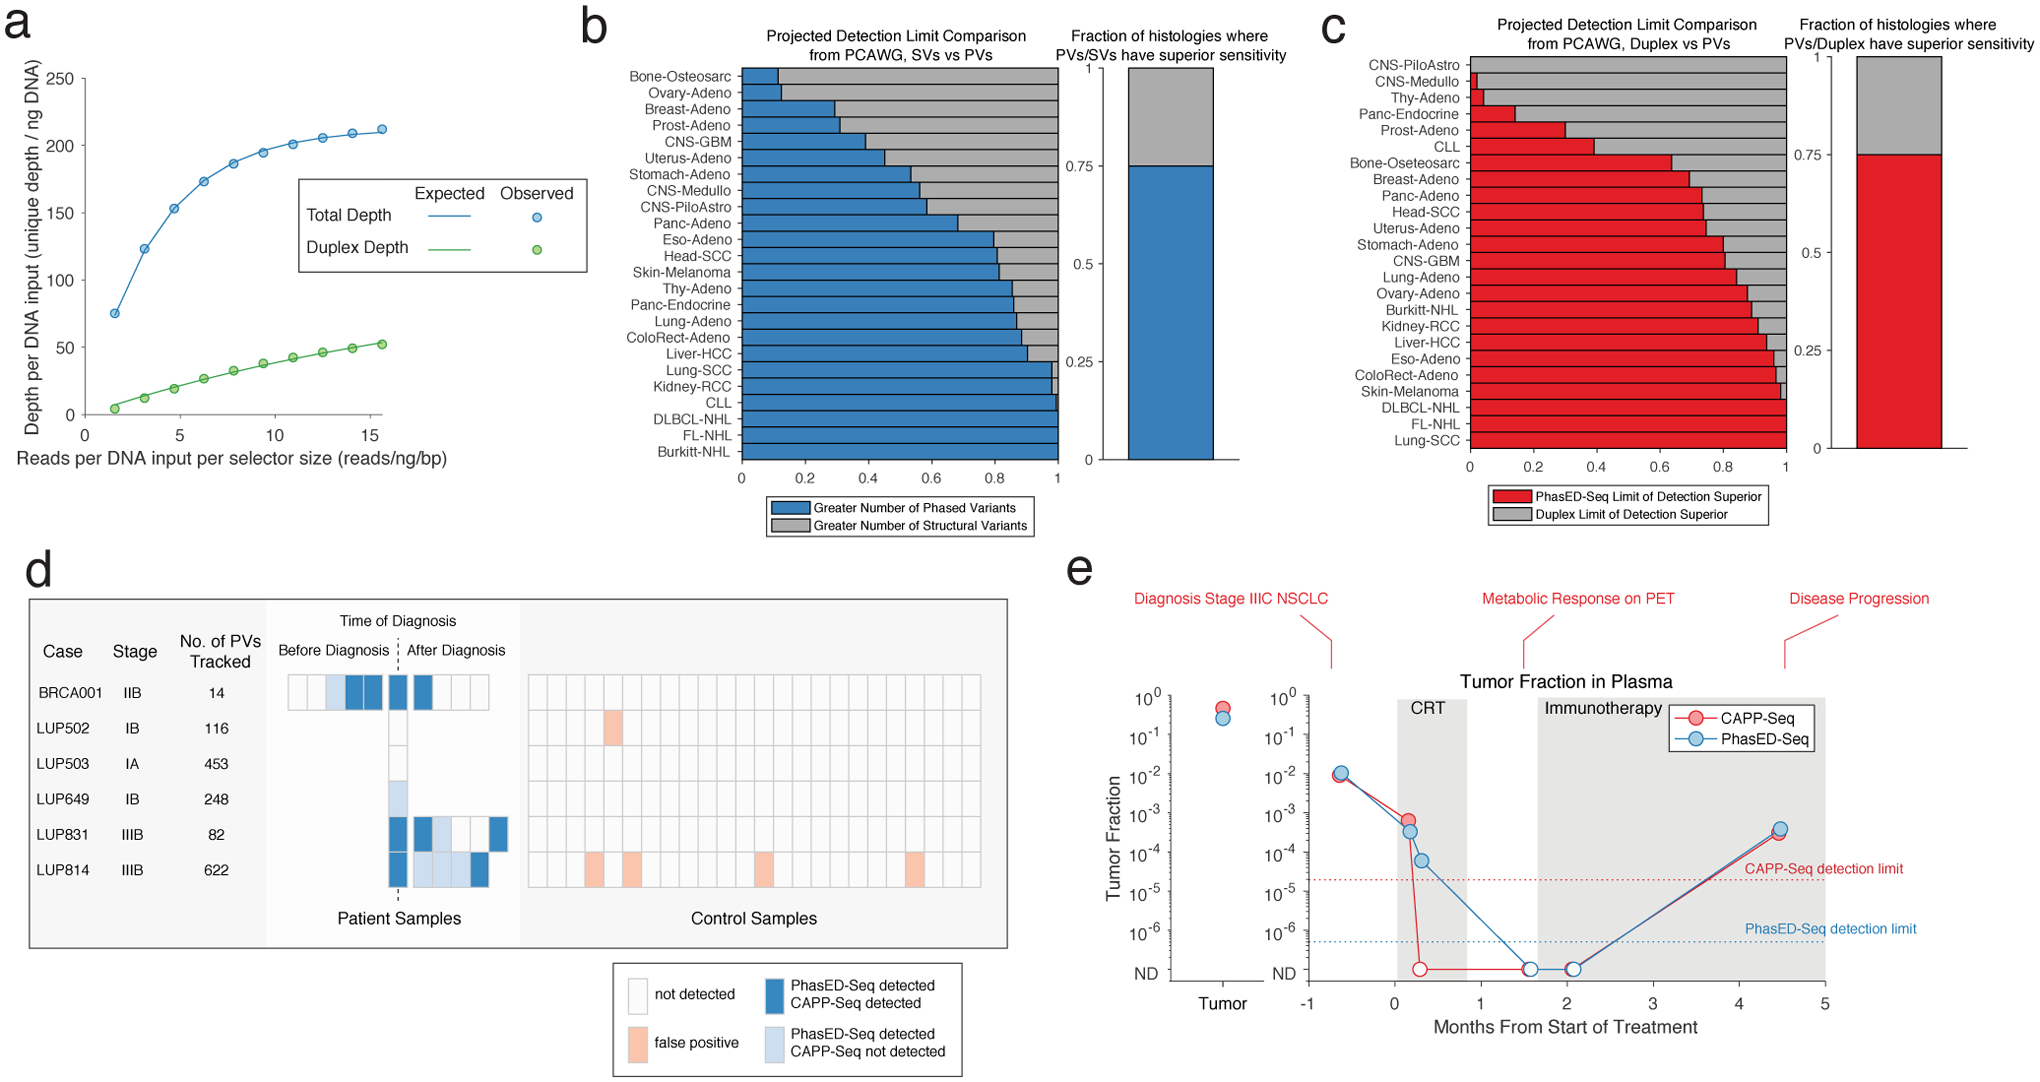
Figure 7. Extension of PhasED-Seq for disease monitoring to patients with solid tumors.
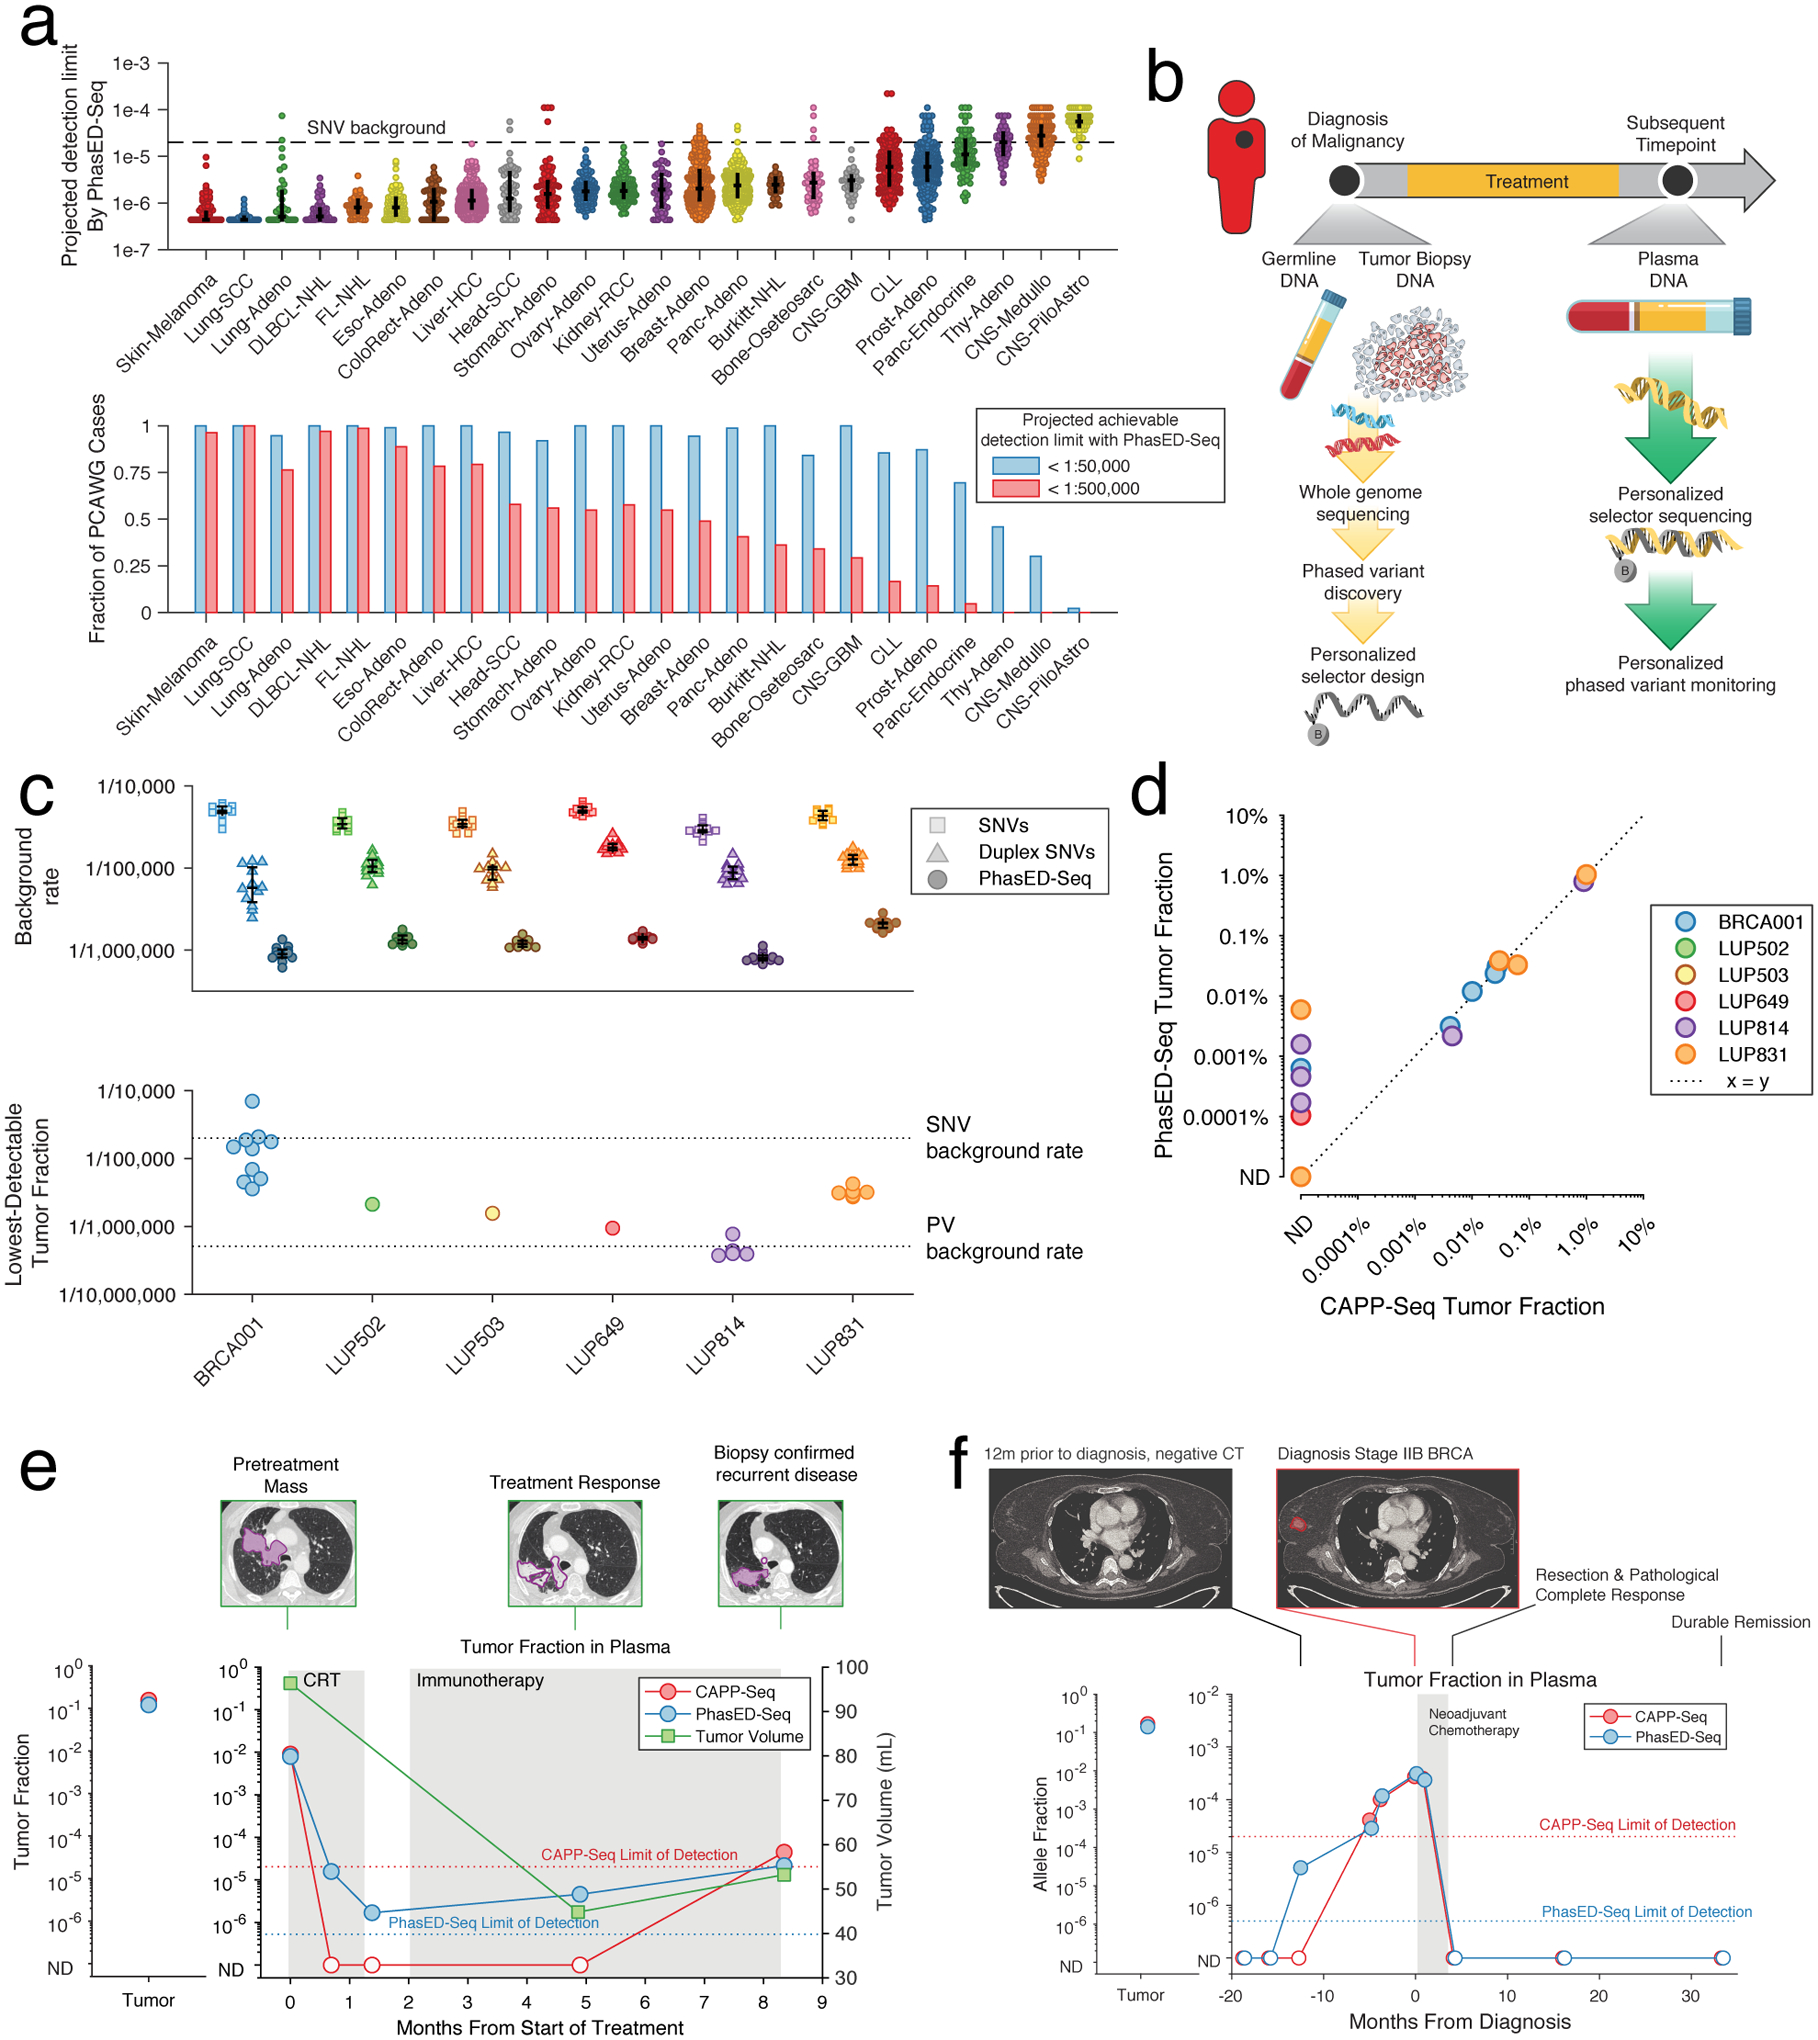
a) Plot showing the projected detection limit using PVs for ctDNA in cases from PCAWG. This represents the lowest tumor fraction predicted to be detectable with 95% sensitivity, determined by assuming a personalized PhasED-Seq panel and inferring the number of DNA fragments evaluable for tumor content assuming 64ng of input and 20 million sequencing reads (see Methods). The maximum analytical sensitivity is assumed to be 1:2,000,000. Top: case-level data; bars represent median and IQR. Bottom: the fraction of cases with at least 1:50,000 and 1:500,000 sensitivity. The background rate for SNVs is shown at 2e-5 (1 in 50,000).
b) A schematic for personalized PhasED-Seq. At the time of diagnosis, tumor and germline WGS are performed to identify a personalized set of PVs. A personalized panel targeting these PVs is then designed. Future cfDNA samples can then be captured and sequenced using this personalized panel.
c) The performance of personalized PhasED-Seq across six patients. The top panel shows the background rate of SNVs (squares), duplex SNVs (triangles), or PVs (circles); bars represent median and IQR. The bottom panel shows the lowest detectable tumor fraction for each sample. The background rate for SNVs is shown at 2e-5 and for PVs at 5e-7.
d) Comparison between the recovered tumor fraction by CAPP-Seq (x-axis) and PhasED-Seq (y-axis) for all samples from the 6 patients with solid tumors.
e) The ctDNA profile of a patient with stage III lung adenocarcinoma (LUP814). The left panel shows the measured tumor fraction in the tumor biopsy, the right panel shows the tumor fraction from cfDNA. While CAPP-Seq fails to detect multiple samples with low-burden MRD, PhasED-Seq successfully measures disease in all samples. The measured tumor volume and representative CT scan images are also shown.
f) The ctDNA profile of a patient with stage II breast adenocarcinoma (BRCA001). Samples were banked prior to the diagnosis of breast cancer as part of a biomarker study, including at the time of a CT scan for unrelated disease 12 months prior to diagnosis. At this timepoint, ctDNA is not detected using CAPP-Seq (red), but is detected using PhasED-Seq.
We next assessed the performance of this approach for MRD detection in 24 plasma samples from these 6 patients. In nearly all samples, we recovered a sufficient number of cfDNA fragments evaluable for tumor content40 to detect tumor fractions at or below the limit of detection for SNV based methods (Fig 7c). Using SNV-based methods, ctDNA was detected in 9/24 of the plasma samples. As expected, PhasED-Seq also detected ctDNA in these samples (Fig 7d). Importantly, PhasED-Seq also detected ctDNA in 6 additional samples that were negative when assessed by SNVs (Fig 7d, Extended Data Fig 10d). These additional samples had very low tumor fractions (median 0.0005%), below the background error-rate of SNV-based methods. The lowest measurable tumor fraction was 0.000094%, or less than 1:1,000,000, from a pretreatment sample from a patient with stage 1 NSCLC (LUP649).
We analyzed serial samples from a patient with stage III lung adenocarcinoma treated with chemoradiotherapy (LUP814, Fig 7e). CAPP-Seq and PhasED-Seq detected similar ctDNA levels prior to therapy; however, 3 samples after treatment initiation had undetectable ctDNA by CAPP-Seq before ctDNA re-emerged at the time of biopsy-confirmed recurrent disease. Using PhasED-Seq, we observed molecular residual disease in 3/3 (100%) of samples that were undetected by SNVs, with tumor fraction as low as 0.00016%. Furthermore, the trend in ctDNA quantitation mirrored the patient’s disease, with an initial response to chemoradiotherapy but disease progression during immunotherapy. Importantly, this patient’s ctDNA remained detectable at all timepoints, including after completion of chemoradiotherapy 8 months prior to disease progression. Similar improvements for detection of low-burden disease after treatment were seen in LUP831 (Extended Data Fig 10e), as well as BRCA001 for disease detection in anticipation of clinical diagnosis (Fig 7f).
Discussion
The emergence of cfDNA in oncology has signaled a revolution in precision medicine. While ctDNA-based mutational genotyping and MRD detection are gaining adoption in the clinic, current approaches for disease surveillance have sub-optimal sensitivity. We present a method to leverage phased variants to improve on these limitations. Using WGS data, we identified putative PVs amenable to capture on a single cfDNA fragment (<170bp) in multiple cancer subtypes. These PVs were associated with established mutational signatures associated with clustered mutations driven by mechanisms of hypermutation such as AID/AICDA and APOBEC3B.
We observed that cancers derived from B-lymphocytes contain PVs in stereotyped genomic regions, while other tumor types contain such events throughout their genome. We therefore designed PhasED-Seq, a hybrid capture approach for disease characterization and MRD detection, and applied it to both lymphomas and solid tumors. We demonstrated in technical and biological experiments the superior error-profile of PhasED-Seq, establishing an improved sensitivity for PhasED-Seq over alternative approaches for ctDNA detection, including error-suppressed SNV-based methods and duplex sequencing. This resulted in detection down to below 1 part per 1,000,000 in a limiting dilution series and clinical samples.
The lower background rate of PVs compared with SNVs for tracking known genotypes was expected, as PVs require multiple non-reference bases. We initially expected the background rate of SNVs from duplex sequencing and the rate of PVs to be similar, as both require two independent observations (in trans or cis, respectively). However, we found that the background rate of SNVs in duplex data was higher than that of PVs, even when considering all molecules (i.e., single and double-stranded recovery) or without using molecular barcodes. We hypothesize that this is most likely due to a biological source of background SNVs. While ‘technical’ background from PCR-error requires two events to create signal for both PhasED-Seq and duplex sequencing, SNV ‘biological’ background – that is, true somatic mutations that occur in non-tumor cells – can be created from a single in vivo mutational event and would not be suppressed by duplex barcoding. In contrast, a phased variant of biological origin still requires two separate mutational events in the same cell, within <170bp, to result in PV background signal. Consistent with this, while theoretical estimates of the error-rate in duplex sequencing were < 1 in 1e9, the observed rate of background signal from biological samples are ~1:1e5–1e6,17 with reported background SNV-rates from duplex sequencing of cfDNA also in this range2. Indeed, multiple recent reports of error-suppressed sequencing from cfDNA have demonstrated frequent low-level mutations that can be found in paired leukocyte samples, likely representing low-burden clonal hematopoiesis41,42, creating background for duplex sequencing.
To demonstrate the utility of the lower background from PhasED-Seq, we studied samples from patients with DLBCL with undetectable ctDNA assessed by prior methods. We demonstrated improved disease detection by PhasED-Seq, where patients with occult disease only detectable by PhasED-Seq had significantly inferior outcomes to patients without detectable disease. PhasED-Seq also improved on disease detection in DLBCL patients at the end of therapy landmark. Finally, we extended PhasED-Seq beyond B-cell lymphomas. To apply PhasED-Seq to solid cancers that do not have stereotyped locations for PVs, a two-step approach is required, involving up-front tumor WGS to identify PVs, followed by development of a personalized panel to capture PVs. Notably, this type of personalized approach has been successfully applied to ctDNA for SNV-based detection in prior studies12,43,44. Applying this to patients with lung or breast cancer, we demonstrate improved disease detection as compared with SNV based approaches (e.g., CAPP-Seq), including tumor fractions as low as ~1 in 1,000,000.
We note that this personalized approach could be used for any type of somatic alteration with intrinsically low background error-rates, such as fusions or indels, similar to the implementation here for PVs. Prior approaches using fusions for ctDNA45,46 have had limited sensitivity due to use of only a few fusions per patient. However, recent improvements in genome-wide identification of structural variants47 makes these a potentially attractive alternative for PV-poor cancers. However, most cancer types have a sufficient number of PVs to enable PhasED-Seq.
This technical improvement in the performance of ctDNA detection at the time-point of lowest disease burden potentially unlocks several new precision medicine approaches. For example, patients achieving molecular remissions without detectable ctDNA by PhasED-Seq after receiving chemotherapy might benefit from ‘dose de-escalation’ or an abbreviated course of therapy to mitigate toxicity and reduce healthcare costs. Similarly, a lower false negative rate for ctDNA detection after the completion of a planned course of therapy in patients destined for disease relapse could allow for additional consolidative or adjuvant treatment approaches, including novel immunotherapy options48.
While better prognostication of outcomes for individual patients is useful by itself, for improved ctDNA methodologies such as PhasED-Seq to make a significant impact on patient outcomes, changes in treatment paradigms are required. Prospective clinical trials implementing PhasED-Seq to select patients for personalized therapies will therefore be necessary to establish its utility prior to wide clinical adoption.
Methods
Patient enrollment and clinical sample collection
All samples analyzed in this study were collected with informed consent from subjects enrolled on Institutional Review Board approved protocols that were in accordance with the Declaration of Helsinki and complied with all relevant ethical regulations at their respective centers – Stanford University, MD Anderson Cancer Center, the National Cancer Institute, University of Eastern Piedmont, Essen University Hospital, and CHU Dijon. Participants were not compensated for their contribution in this study.
Patients with B-cell lymphomas undergoing front-line therapy were enrolled on this study from six centers across North America and Europe, including Stanford University, MD Anderson Cancer Center, the National Cancer Institute, University of Eastern Piedmont (Italy), Essen University Hospital (Germany), and CHU Dijon (France). An additional 6 patients with diagnosis of solid tumors (lung cancer, n=5, breast cancer, n=1) were enrolled at Stanford University. In total, 386 cell-free DNA, 109 tumor, and 219 germ-line samples from 219 patients and 76 cell-free DNA samples from control subjects were included in this study. Cell-free, tumor, and germ-line DNA were isolated as previously described2,3,13,14,49. All radiographic imaging was performed as part of standard clinical care.
Whole-genome sequencing analysis
Putative phased variant identification from WGS
Whole-genome sequencing data were obtained from two sources. Data for lymphoid malignancies (diffuse large B-cell lymphoma, DLBCL; follicular lymphoma, FL; Burkitt lymphoma, BL; chronic lymphocytic leukemia, CLL) were downloaded from the International Cancer Genome Consortium (ICGC) data portal on May 7th, 2018. Data from all other histologies were part of the pan-Cancer analysis of whole genomes (PCAWG) and downloaded on November 11th, 201950. Only cancer histologies with at least 35 available cases were considered; details of the dataset considered are provided in Table S1. All samples had somatic mutations called from WGS using matched tumor and normal genotyping. Queries were limited to base substitutions obtained from WGS (single, double, triple, and oligo nucleotide variants; SNVs, DNVs, TNVs, and ONVs). Having thus identified the cases and variants of interest, we next identified the number of putative phased variants (PVs) in each tumor. To function as a PV on a single cell-free DNA (cfDNA) molecule, two single nucleotide variants (SNVs) must occur within a genomic distance less than the length of a typical cfDNA molecule (~170bp). We therefore defined putative PVs as two variants occurring on the same chromosome within a genomic distance of < 170bp. DNVs, TNVs, and ONVs were considered as the set of their respective component SNVs. The number of SNVs as well as the identity of putative PVs for each case are detailed in Table S1. The raw number of SNVs and putative PVs, as well as the number of putative PVs controlling for the number of SNVs, is shown in Extended Data Fig 2.
Mutational signatures of phased variants from WGS
To assess the mutational processes associated with phased and non-phased mutations across different cancer types/subtypes, we enumerated the mutational signatures of single base substitutions (SBS) for each WGS case described above using the R package ‘deconstructSigs’51. We began by first dividing the list of SNVs for each patient into two groups: 1) SNVs contained within a possible PV; that is, with an adjacent or ‘nearest neighbor’ SNV <170bp away, and 2) isolated SNVs (i.e., non-phased), defined as those occurring ≥170bp in distance from the closest adjacent SNV. We then applied ‘deconstructSigs’ using the 49 SBS signatures described in COSMIC24 (excluding signatures linked to possible sequencing artefacts) to assess the contribution of each SBS signature to both candidate phased SNVs and un-phased SNVs for each patient. To compare the contribution of each SBS signature to phased and isolated SNVs, we performed a Wilcoxon signed rank test to compare the relative contribution of each SBS signature between these two categories for each cancer type. To account for multiple hypotheses, we applied Bonferroni’s correction, by considering any SBS signature that differed in contribution to phased vs. un-phased SNVs to be significant if the Wilcoxon signed rank test resulted in a P-value of <0.05 / 49 or 0.001. The distributions of these comparisons for each of the 49 SBS signatures, along with significance testing, are depicted in figures available at https://phasedseq.stanford.edu. A summary of this analysis is also shown in Fig 1C using a heat-map display, where the ‘heat’ represents the difference between the mean contribution of the SBS signature to phased variants to the mean contribution to isolated/un-phased variants.
Genomic distribution of phased variants from WGS
We assessed the recurrence frequency for PVs in each cancer type across the genome within each tumor type. Specifically, we first divided the human genome (build GRCh37 / hg19) into 1-kb bins (3,095,689 total bins); then, for each sample, we counted the number of PVs (as defined above) contained in each 1-kb bin. For this analysis, we included any PV with at least one of its constituent SNVs falling within the 1-kb bin of interest. We then calculated the fraction of patients whose tumors harbored a PV for each cancer type within each genomic bin. To identify 1-kb bins recurrently harboring PVs across patients, we plotted the fraction of patients containing PVs in each 1-kb bin vs. genomic coordinates (Fig 1d, Extended Data Fig 3); for this analysis, we only plotted bins where at least 2% of samples contained a PV in at least one cancer subtype.
Identification of recurrent 1-kb bins with phased variants
To identify 1-kb bins that recurrently contain PVs in B-lymphoid malignancies, we utilized WGS data from the following diseases: DLBCL, FL, BL, and CLL. Any 1-kb bin in which >1 sample from these tumor types contained a PV was considered to recurrently contain PVs from B-lymphoid malignancies. The genomic coordinates of 1-kb bins containing recurrent PVs in lymphoid malignancies are enumerated in Table S2.
Design of PhasED-Seq panel for B-lymphoid malignancies
Identification of recurrent PVs from WGS at high resolution
Given the prevalence of recurrent putative PVs from WGS data in B-cell malignancies, we designed a targeted sequencing approach for their hybridization-mediated capture – Phased variant Enrichment Sequencing (PhasED-Seq) – to enrich these specific PV events from tumor or cell-free DNA. In addition to the ICGC data described above, we also utilized WGS data from other sources in this design, including both B-cell NHLs as well as CLL33–36. We also considered our previous experience with targeted sequencing from cfDNA in NHLs3. We began by identifying pairs of SNVs occurring at a distance of <170bp apart in each B-cell tumor sample. We then identified genomic “windows” that contained PVs as follows: for each chromosome, we sorted the PVs by genomic coordinates relative to reference genome. We then identified the left-most position for any PV in any patient; this defined the left-hand (5’) coordinate seeding a desired window of interest, to be captured from the genome. We then extended this window by growing its 3’ end to capture successive PVs until a gap of ≥340bp was reached, with 340-bp chosen as capturing two successive chromatosomal sized fragments of ~170-bp. When such a gap was reached, a new window was started, and this iterative process of adding neighboring PVs was repeated again until the next gap of ≥340bp was reached. This resulted in a BED file of genomic windows containing all possible PVs from all samples considered. Finally, each window was additionally padded by 50bp on each side, to enable efficient capture from flanking sequences in rare scenarios when repetitive or poorly mapping intervening sequences might preclude their direct targeting for enrichment.
Having identified the regions of interest containing putative PVs, we then divided each window into 170bp segments (i.e., the approximate size of a chromatosomal cfDNA molecule). We then enumerated the number of cases containing a PV in each case. For each 170bp region, we included the region in our final sequencing panel design if one or more of the following criteria was met: 1) at least one patient contained a PV in the 170bp region in 3 of our 5 independent data-sets, 2) at least one patient contained a PV in the region in 2 of 5 independent data-sets if one dataset was our prior CAPP-Seq experience3, or 3) at least one patient contained a PV in the region in 2 of 5 independent data-sets, with a total of at least 3 patients containing a PV in the region. This resulted in 691 ‘tiles’, with each tile representing a 170bp genomic region. These tiles, along with an additional ~200kb of genomic space targeting driver genes recurrently mutated in B-NHL, were combined into a unified targeted sequencing panel as previously described for both tumor and cfDNA genotyping2,13 using NimbleDesign (Roche NimbleGen).
Comparison of PV yield from PhasED-Seq and CAPP-Seq
To evaluate the performance of PhasED-Seq for capturing both SNVs and PVs compared to our previously reported CAPP-Seq selector for B-cell lymphomas, we quantified the predicted number of both SNVs and PVs that would be recovered with each panel by limiting WGS in silico to the capture targets of each approach (Extended Data Fig 4a–c). The predicted number of variants was then compared using the Wilcoxon signed rank test. We also performed both CAPP-Seq and PhasED-Seq on 16 samples from patients with DLBCL. In these samples, tumor or plasma DNA, along with matched germ-line DNA, was sequenced. The resulting number of variants were again compared by the Wilcoxon signed rank text (Fig 3a, Extended Data Fig 4d–e). The sequencing depth for the samples included in this analysis are provided in Table S3.
Identification of phased variants from targeted sequencing
Library preparation and sequencing
To generate sequencing libraries and targeted sequencing data, we applied CAPP-Seq as previously described2,13. Briefly, cell-free, tumor, and germ-line DNA were used to construct sequencing libraries through end repair, A-tailing, and adapter ligation following the KAPA Hyper Prep Kit manufacturer’s instructions with ligation performed overnight at 4°C. CAPP-Seq adapters with unique molecular identifiers (UMIDs) were used for barcoding of unique DNA duplexes and subsequent deduplication of sequencing read pairs. Hybrid captures were then performed for lymphoma samples using (SeqCap EZ Choice; NimbleGen) at 47°C for 48 hours and (xGen Lockdown Probe Pools; IDT) for solid tumors at 65°C for 16 hours. Lymphoma samples utilized an off-the-shelf panel, while solid tumor samples utilized a customized panel as described in the main text. Affinity capture was performed according to the manufacturer’s protocol, with the respective hybridization conditions conducted on an Eppendorf thermal cycler. Following enrichment, libraries were sequenced using an Illumina HiSeq4000 instrument with 2×150bp paired-end (PE) reads.
Pre-processing and alignment
FASTQ files were de-multiplexed and UMIDs were extracted using a custom pipeline as previously described2,13. FASTQ files were then processed using fastp52 without global trimming, unqualified percent limit of 50% and length required of 35. All other parameters were kept as default. For more efficient parallelization and to minimize barcode collisions, sample FASTQ files were then split into multiple files based on fragment UMIs. Each FASTQ file was then aligned to the human genome (build GRCh37 / hg19) using BWA ALN53 without fragment size estimation, and deduplicated using both samtools markdup and our previously described in-house algorithm2. UMI specific files were then merged to generate final sample alignment files. Molecular barcode-mediated error suppression and background polishing (i.e., integrated digital error suppression; iDES) were then performed as previously described2.
Identification of phased variants
For detailed methods of identification of phased variants and MRD detection, see Supplementary Methods.
Assessment of hybridization bias
To assess the effect of mutations on hybridization efficiency, we first estimated the affinity of mutated molecules to wildtype capture baits in silico by considering DNA fragments harboring 0–30% mutations across the entire fragment. For each mutation condition across this range, we first randomly sampled 10,000 regions, each 150bp in length, from across the whole genome. We then mutated these 150-mers in silico to simulate the desired mutation rate in 3 different ways: 1) mutating ‘clustered’ or contiguous bases starting from the ends of a sequence, 2) mutating clustered bases started from the middle of the sequence, or 3) mutating bases selected at random positions throughout the sequence. We then used the energy.c package to calculate the theoretical binding energy (kcal/mol) between the mutated and wild-type sequences, in relying on a nearest-neighbor model employing established thermodynamic parameters54–56.
We then replicated this in silico experiment by testing the effects of same mutation rates in vitro. Specifically, we synthesized and annealed oligonucleotides (IDT) to form DNA duplexes harboring 0–10% mutations at defined positions relative to the human reference genome sequence. We then captured these synthetic DNA molecules together at equimolar concentrations and quantified the relative capture efficiency of mutated duplexes compared to the wild-type, unmutated species (Fig 4a). Two sets of oligonucleotide sequences were selected from coding regions of BCL657 and MYC58 to capture AID-mediated aberrant somatic hypermutations associated with each gene59; we ensured the preserved mappability of the mutated species by BWA ALN (Table S6). These synthetic oligonucleotide duplexes were then subjected to library preparation, then captured and sequenced using PhasED-Seq, performed in triplicate using distinct samples. This allowed assessment of the relative efficiency of hybrid capture and molecular recovery as directly compared to wildtype molecules identical to the reference genome.
Assessment of limit of detection with dilution series
To empirically define the analytical sensitivity of PhasED-Seq, we utilized a limited dilution series of cell-free DNA from 3 patients that were spiked into healthy control cell-free DNA at defined concentrations. Our dilution series contained samples with an expected mean tumor fraction of 0.1%, 0.01%, 0.001%, 0.0002%, 0.0001%, and 0.00005% or ranging from 1 part in 1,000 to 1 part in 2,000,000. The sequencing characteristics and ctDNA quantification via CAPP-Seq, duplex sequencing, and PhasED-Seq are provided in Table S7. Tumor fractions were normalized to the measured concentration of the highest sample (i.e., the 1:1,000 sample). To compare the performance of each method, we calculated the difference, δ, between the observed and expected tumor fraction for each patient i at each dilution concentration j:
| (1) |
This value was calculated for patients i = {1,2,3} and concentrations j = {0.001%, 0.0002%, 0.0001%, 0.00005%} for each ctDNA detection method (CAPP-Seq, duplex, doublet PhasED-Seq, and triplet PhasED-Seq). The performance of each method was then compared to each other by paired t-test across this set of patients and concentrations. Results are shown in Fig 5a, as well as in Extended Data Fig 5g without the use of barcode deduplication (i.e., samtools markdup without UMID-mediated error suppression).
Extension of PhasED-Seq to solid tumors
Whole genome sequencing to identify phased variants
To demonstrate the utility of PhasED-Seq for solid tumors, we first performed WGS on tumor and matched normal DNA from 6 cases (5 lung cancer, 1 breast cancer) to ~30x depth. These cases are shown in Table S9. Sequencing reads were aligned to hg19 and deduplicated with samtools markdup, as described above. Per GATK best-practices60, tumor and normal deduplicated BAM files were processed with GATK IndelRealigner and BaseRecalibrator prior to variant calling, using default parameters (GATK v3.8–1-0-gf15c1c3ef)60. Variant calling was performed using three methods – VarScan2 (v2.3.9)61, Mutect (v1.1.7)62, and Strelka2 (v2.9.1)63. Mutect and VarScan2 VCF files were annotated by annovar (version 2018Apr16), and Strelka VCF files were annotated by Oncotator (v1.9.8.0). Variants called by each method were combined and filtered according to the following criteria: (1) pass caller-intrinsic quality filters (e.g., base quality, orientation bias, germline risk, etc.) (2) depth ≥ 30x, (3) AF ≥ 5%, (4) variant identified by ≥ 2 variant callers. SNVs passing all filters were then assessed for possible phased relationships – any pair of SNVs ≤170bp from its nearest neighbor was considered a possible PV. We also genotyped PVs directly from WGS reads, considering any candidate PVs with at least 2 supporting reads, 10x depth, and 5% tumor fraction. Candidate PVs were then assessed and prioritized for tumor specificity, considering 1) presence in individual tumor reads as phased relationships, 2) absence of read support in matched normal, 3) presence of other non-reference bases on the supporting reads, 4) base quality, 5) mapping quality, and 6) uniqueness of genomic positions. Candidate phased variants were then selected for targeted resequencing below.
Targeted resequencing to validated phased variants
After identifying candidate PVs from each of these 6 tumors, we designed 120bp biotinylated hybrid capture oligonucleotides targeting the regions of interest (Integrated DNA Technologies). We then performed hybrid capture re-sequencing of the tumor-normal pairs to high unique molecular depth to create a validated list of PVs for tumor monitoring. A PV was considered to have validated if it was present in the tumor at higher than 5% AF and had no read support in the matched germline DNA.
Measurement of ctDNA in solid tumor patients
We applied the above personalized hybrid capture panels targeting PVs to plasma samples from each of these 6 patients, sequencing to high unique molecular depth. We also sequenced 24 control healthy cfDNA samples with each panel to assess specificity. Tumor fraction was defined as the number of reads containing an a priori defined PV over the total number of reads covering a PV position (i.e., phased variant tumor fraction, defined in Determination of tumor fraction in a sample from phased variants in the Supplementary Methods). Most samples had been assessed for ctDNA content using SNV-based CAPP-Seq approaches previously41,64, providing comparison to PhasED-Seq. The results of these experiments are shown in Fig 7c–f and Extended Data Fig 10d–e.
Statistical Analyses
All P-values reported in this manuscript are 2-sided unless otherwise noted. Comparisons of matched samples and populations were performed using the Wilcoxon signed rank test; comparisons of samples drawn from unrelated populations were performed using the Wilcoxon rank-sum test. Comparisons of paired samples were performed by paired t-test. Survival probabilities were estimated using the Kaplan-Meier method; survival of groups of patients based on ctDNA levels were compared using the log-rank test. Other statistical tests are noted in the manuscript text where utilized. All analyses were performed with the use of MATLAB, version 2018b, R Statistical Software version 3.4.1, Perl v5.10.1, and GraphPad Prism, version 8.0.2. The contribution of known mutational processes to phased and isolated SNVs from WGS was assessed with the deconstructSigs R package using the COSMIC signature set (v2) as described. Calculation of AUC accounting for survival and censorship was performed using the R ‘survivalROC’ package version 1.0.3 with default settings. The PhasED-Seq software (v.1.0) was developed using C++17.
Code Availability
PhasED-Seq v.1.0 was used to generate the results in this work and is freely available for academic research use at http://phasedseq.stanford.edu.
Extended Data
Extended Data Figure 1. Comparison of duplex sequencing to phased variant sequencing.
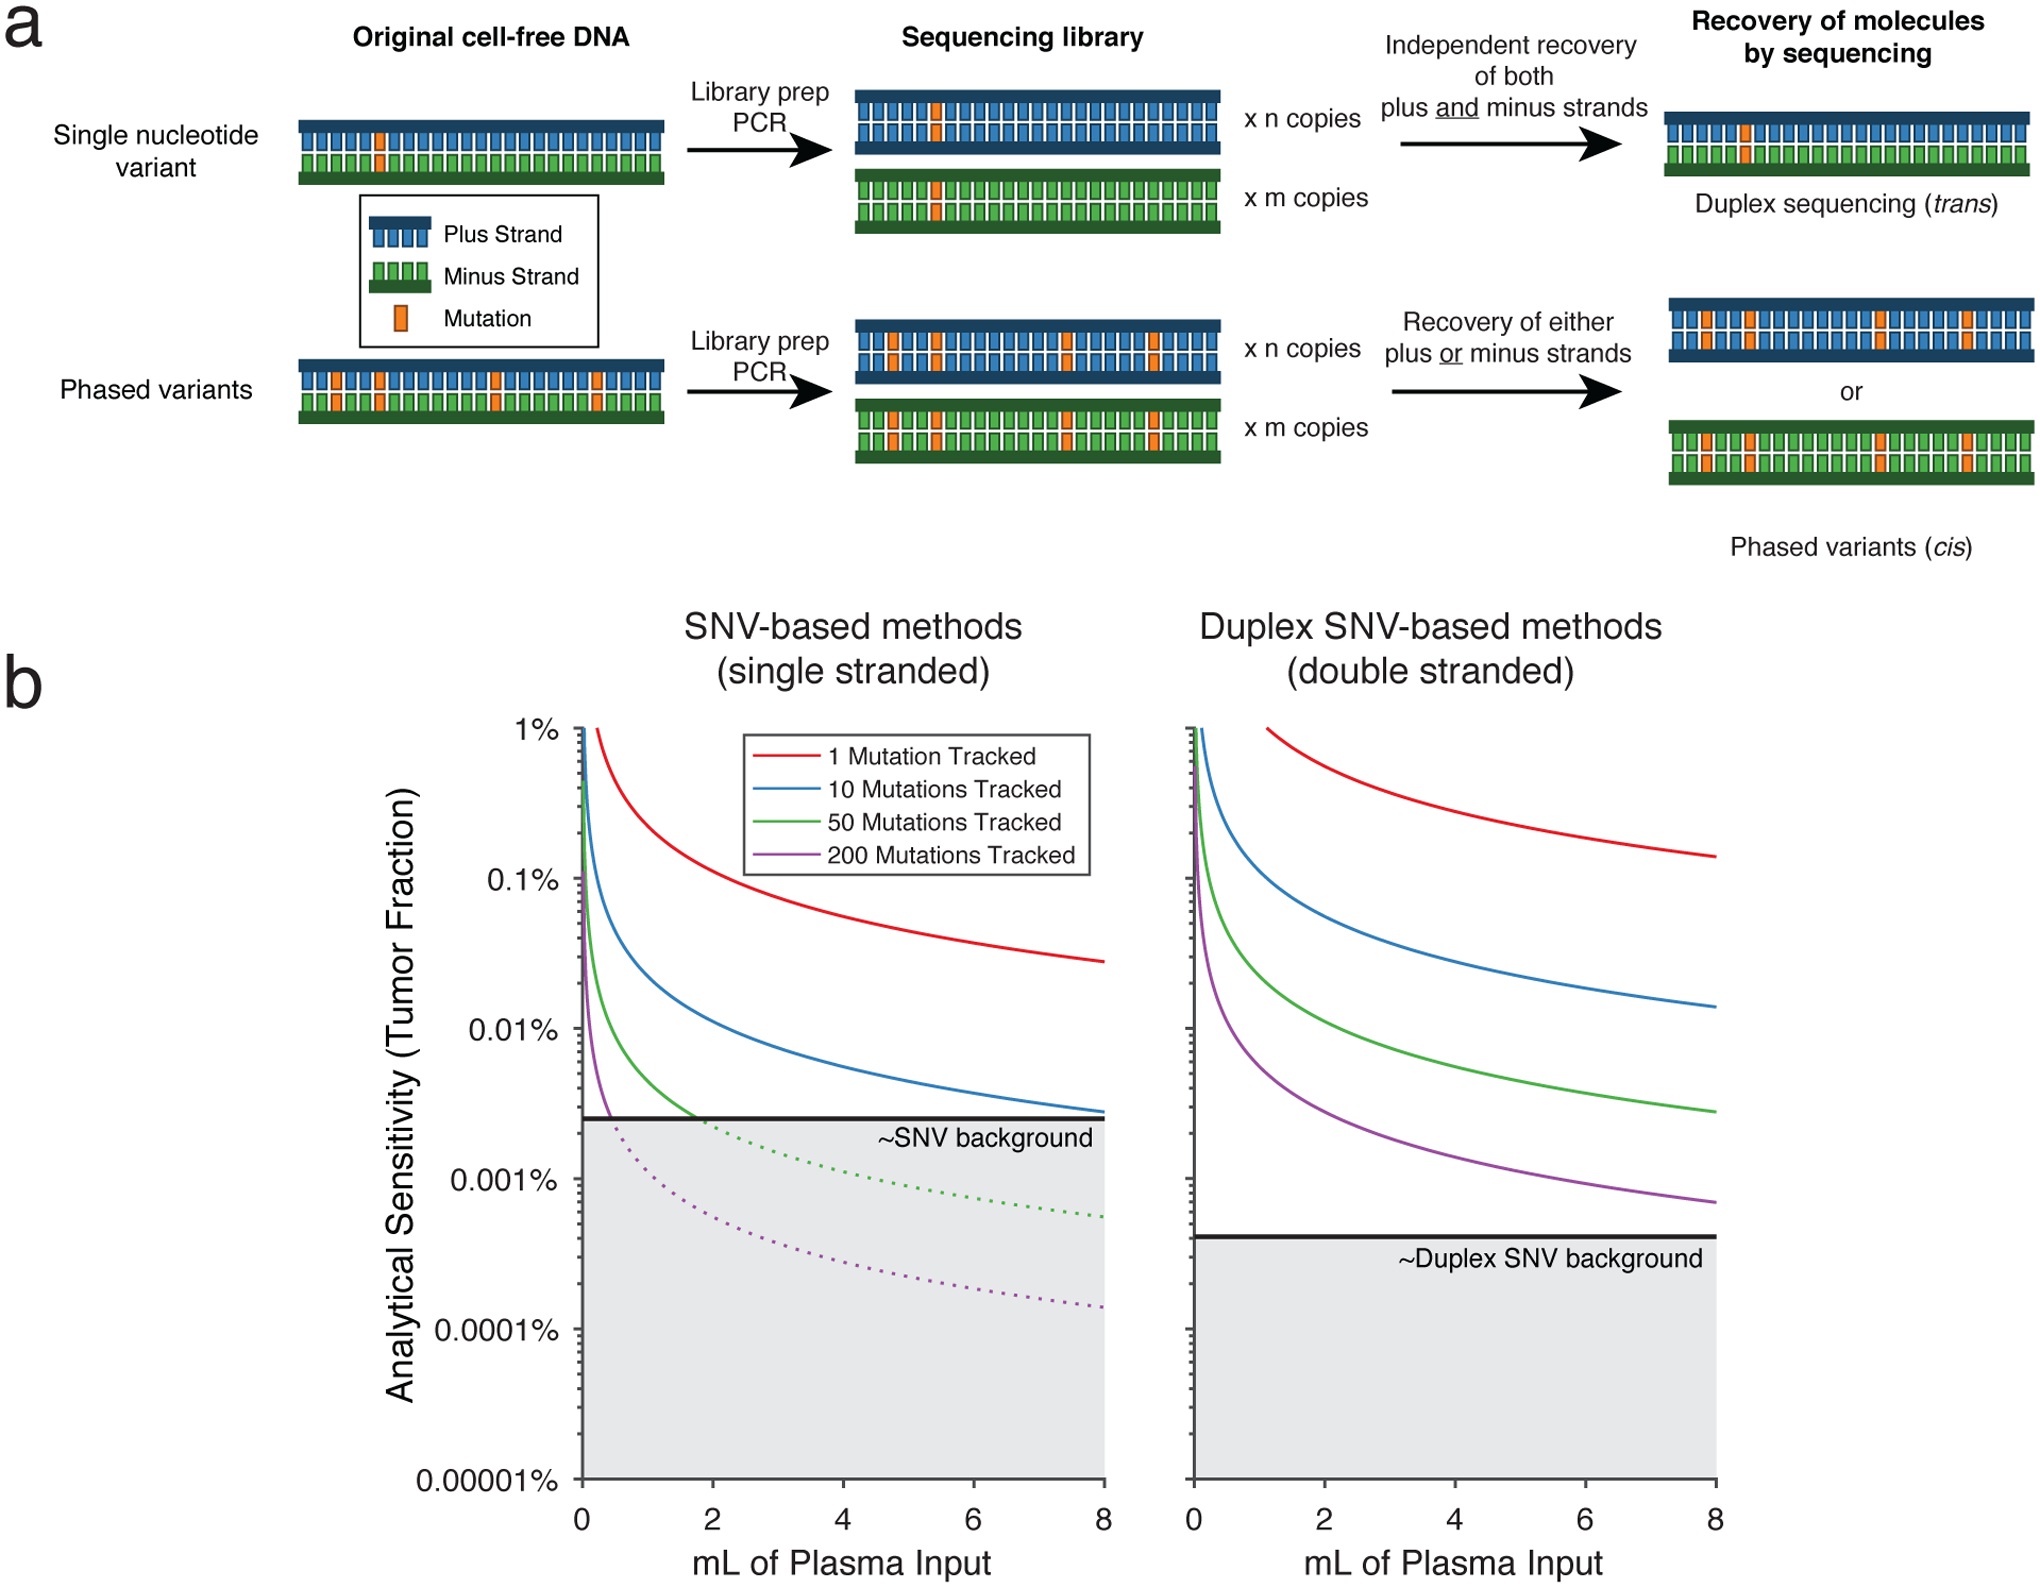
a) A schema comparing error-suppressed sequencing by duplex sequencing vs. recovery of phased variants. In duplex sequencing, recovery of a single SNV observed on both strands of an original DNA double-helix (i.e., in trans) is required. This requires independent recovery of two molecules by sequencing as the plus and minus strands of the original DNA molecule go through library preparation and PCR independently. In contrast, recovery of PVs requires multiple SNVs observed on the same single strand of DNA (i.e., in cis). Thus, recovery of only the plus or the minus strand (rather than both) is sufficient for identification of PVs.
b) A model showing the two possible reasons for limited sensitivity for ctDNA MRD assays. An assay can be limited by either having i) an insufficient number of cfDNA fragments evaluable for tumor content, or ii) an inadequate error-profile. This plot demonstrates the analytical sensitivity as the number of evaluable cfDNA fragments increase with either the amount of plasma input or the number of mutations tracked, until eventually becoming limited by the background signal (grey). Separate plots shown for single-stranded and double-stranded SNV based methods, assuming 8.92ng cfDNA/mL plasma; 50% efficiency of library preparation, and 20% efficiency of duplex sequencing.
Extended Data Figure 2. Enumeration of SNVs and PVs in diverse cancers from WGS.
a-d) Univariate scatter plots showing the number of a) SNVs, b) 2x-PVs (2 SNVs in phase), c) 3x-PVs, and d) total 2x-PVs, controlling for total number of SNVs, from WGS data for 24 different histologies of cancer. Data are presented as median and interquartile range. (FL-NHL, follicular lymphoma; DLBCL-NHL, diffuse large B cell lymphoma; Burkitt-NHL, Burkitt lymphoma; Lung-SCC, squamous cell lung cancer; Lung-Adeno, lung adenocarcinoma; Kidney-RCC, renal cell carcinoma; Bone-Osteosarc, osteosarcoma; Liver-HCC, hepatocellular carcinoma; Breast-Adeno, breast adenocarcinoma; Panc-Adeno, pancreatic adenocarcinoma; Head-SCC, head and neck squamous cell carcinoma; Ovary-Adeno, ovarian adenocarcinoma; Eso-Adeno, esophageal adenocarcinoma; Uterus-Adeno, uterine adenocarcinoma; Stomach-Adeno, stomach adenocarcinoma; CLL, chronic lymphocytic leukemia; ColoRect-Adeno, colorectal adenocarcinoma; Prost-Adeno, prostate adenocarcinoma; CNS-GBM, glioblastoma multiforme; Panc-Endorcine, pancreatic neuroendocrine tumor; Thy-Adeno, thyroid adenocarcinoma; CNS-PiloAstro, piloastrocytoma; CNS-Medullo, medulloblastoma.)
Extended Data Figure 3. Distribution of PVs in stereotyped regions across the genome.
Distribution of PVs occurring in stereotyped regions across the genome of multiple cancer types. In this plot, the genome was divided into 1000bp bins, and the fraction of samples of a given histology with a PV in each 1000bp bin was calculated. Only bins that have at least a 2 percent recurrence frequency in any cancer subtype are shown.
Extended Data Figure 4. Performance of PhasED-Seq for recovery of PVs across lymphomas.
a) Univariate scatter plot comparing the fraction of all PVs across the genome identified by WGS (n=79) that were recovered by our previously reported lymphoma CAPP-Seq panel3 (left) compared to PhasED-Seq (right).
b) Univariate scatter plot comparing the expected yield of SNVs per case identified from WGS using a previously established lymphoma CAPP-Seq panel or the PhasED-Seq panel.
c) Univariate scatter comparing the expected yield of PVs per case identified from WGS using a previously established lymphoma CAPP-Seq panel or the PhasED-Seq panel. Data from three independent publicly available cohorts are shown in a-c).
d-e) Plots showing the improvement in recovery of PVs by PhasED-Seq compared to CAPP-Seq in 16 patients sequenced by both assays. This includes improvement in d) two SNVs in phase (i.e., 2x or ‘doublet PVs’) and e) three SNVs in phase (3x or ‘triplet PVs’). Statistical testing in panels a-e) performed by 2-sided Wilcoxon signed-rank test.
f) A cartoon describing the terminology for phased variants in this manuscript. The figure shows one region of an individual’s cancer genome (300bp). Phased variants on a single strand of DNA of DNA can occur with different numbers of SNVs, including 2 variants in phase (doublets) and 3 in phase (triplets). For the purpose of detecting ctDNA, ‘independent reporters’ are defined as PVs that will typically co-segregate on separate cfDNA molecules, resulting in independent evaluable fragments. Given the size of cfDNA molecules, these are separated in 150bp regions.
g-j) These panels show the number of SNVs and PVs identified for patients with different types of lymphomas. These panels show the number of g) SNVs, h) doublet PVs, i) triplet PVs, and j) independent PV reporters; bars represent median and interquartile range. *, P<0.05 by two-sided Wilcoxon rank sum test; comparisons only shown for all histologies vs DLBCL. (DLBCL, diffuse large B-cell lymphoma; GCB, germinal center B-cell like DLBCL; ABC, activated B-cell like DLBCL; PMBCL, primary mediastinal B-cell lymphoma; FL, follicular lymphoma; HL, Hodgkin lymphoma; MCL, mantle cell lymphoma).
Extended Data Figure 5. Technical aspects of PhasED-Seq by hybrid-capture sequencing.
a) Theoretical binding energy for 150-mers across the genome. Mutations were either clustered to one end (green), clustered in the middle (blue), or randomly throughout the sequence (red). Data represent the median and IQR from 10,000 in silico simulations.
b) Histograms of summary metrics of the mutation rate of 151-bp windows from all patients in this study.
c) The percentile of mutation rate across all mutated 151-bp windows across all patients in this study.
d) Rate of background-signal in the PhasED-Seq panel for multiple variants, including SNVs (red), PVs (blue), and indels (green). Different methods of error-suppression for each variant type are shown. Bars represent median and IQR. UMIs, unique molecular identifiers; PhasED-Seq 2x, doublet PVs; PhasED-Seq 3x, triplet PVs.
e) Error-rate for SNVs (left), doublet PVs (middle), and triplet PVs (right) by type of mutation. For triplet PVs, the x and y-axis represent the first and second type of base alteration in the PV.
f) Error rate for doublet PVs across n=12 healthy cfDNA samples as a function of inter-SNV distance. Data show mean and standard deviation.
g) Limiting dilution series simulating cfDNA similar to Fig 5a; cfDNA from 3 independent patient samples were used in each dilution. In this plot, PhasED-Seq is assessed without the use of UMIs. Data are presented as mean and range. *, P<0.05; CAPP-Seq vs duplex, P=3.2e-5; CAPP-Seq vs PhasED-Seq (2x), P=1.6e-4; CAPP-Seq vs PhasED-Seq (3x), P=1.9e-5; duplex vs PhasED-Seq (2x), 0.017; duplex vs PhasED-Seq (3x), 0.0046.
h) Theoretical rate of detection for a sample with a given number of PV-containing regions, according to binomial sampling, assuming unique sequencing depth of 4000–6000x (shaded area; 5000x shown as line).
i) Observed rate of detection given a true tumor fraction, with varying numbers of PV-containing regions. Filled-in points represent ‘wet’ experiments; open points represent in silico dilution experiments. Data represent mean and range.
j) Predicted vs observed rate of detection for samples from the dilution series shown in panels h) and i). Error-bars are as described in h) and i) above (see Supplementary Methods).
Extended Data Figure 6. Comparison of ctDNA quantitation by PhasED-Seq to CAPP-Seq and clinical applications.
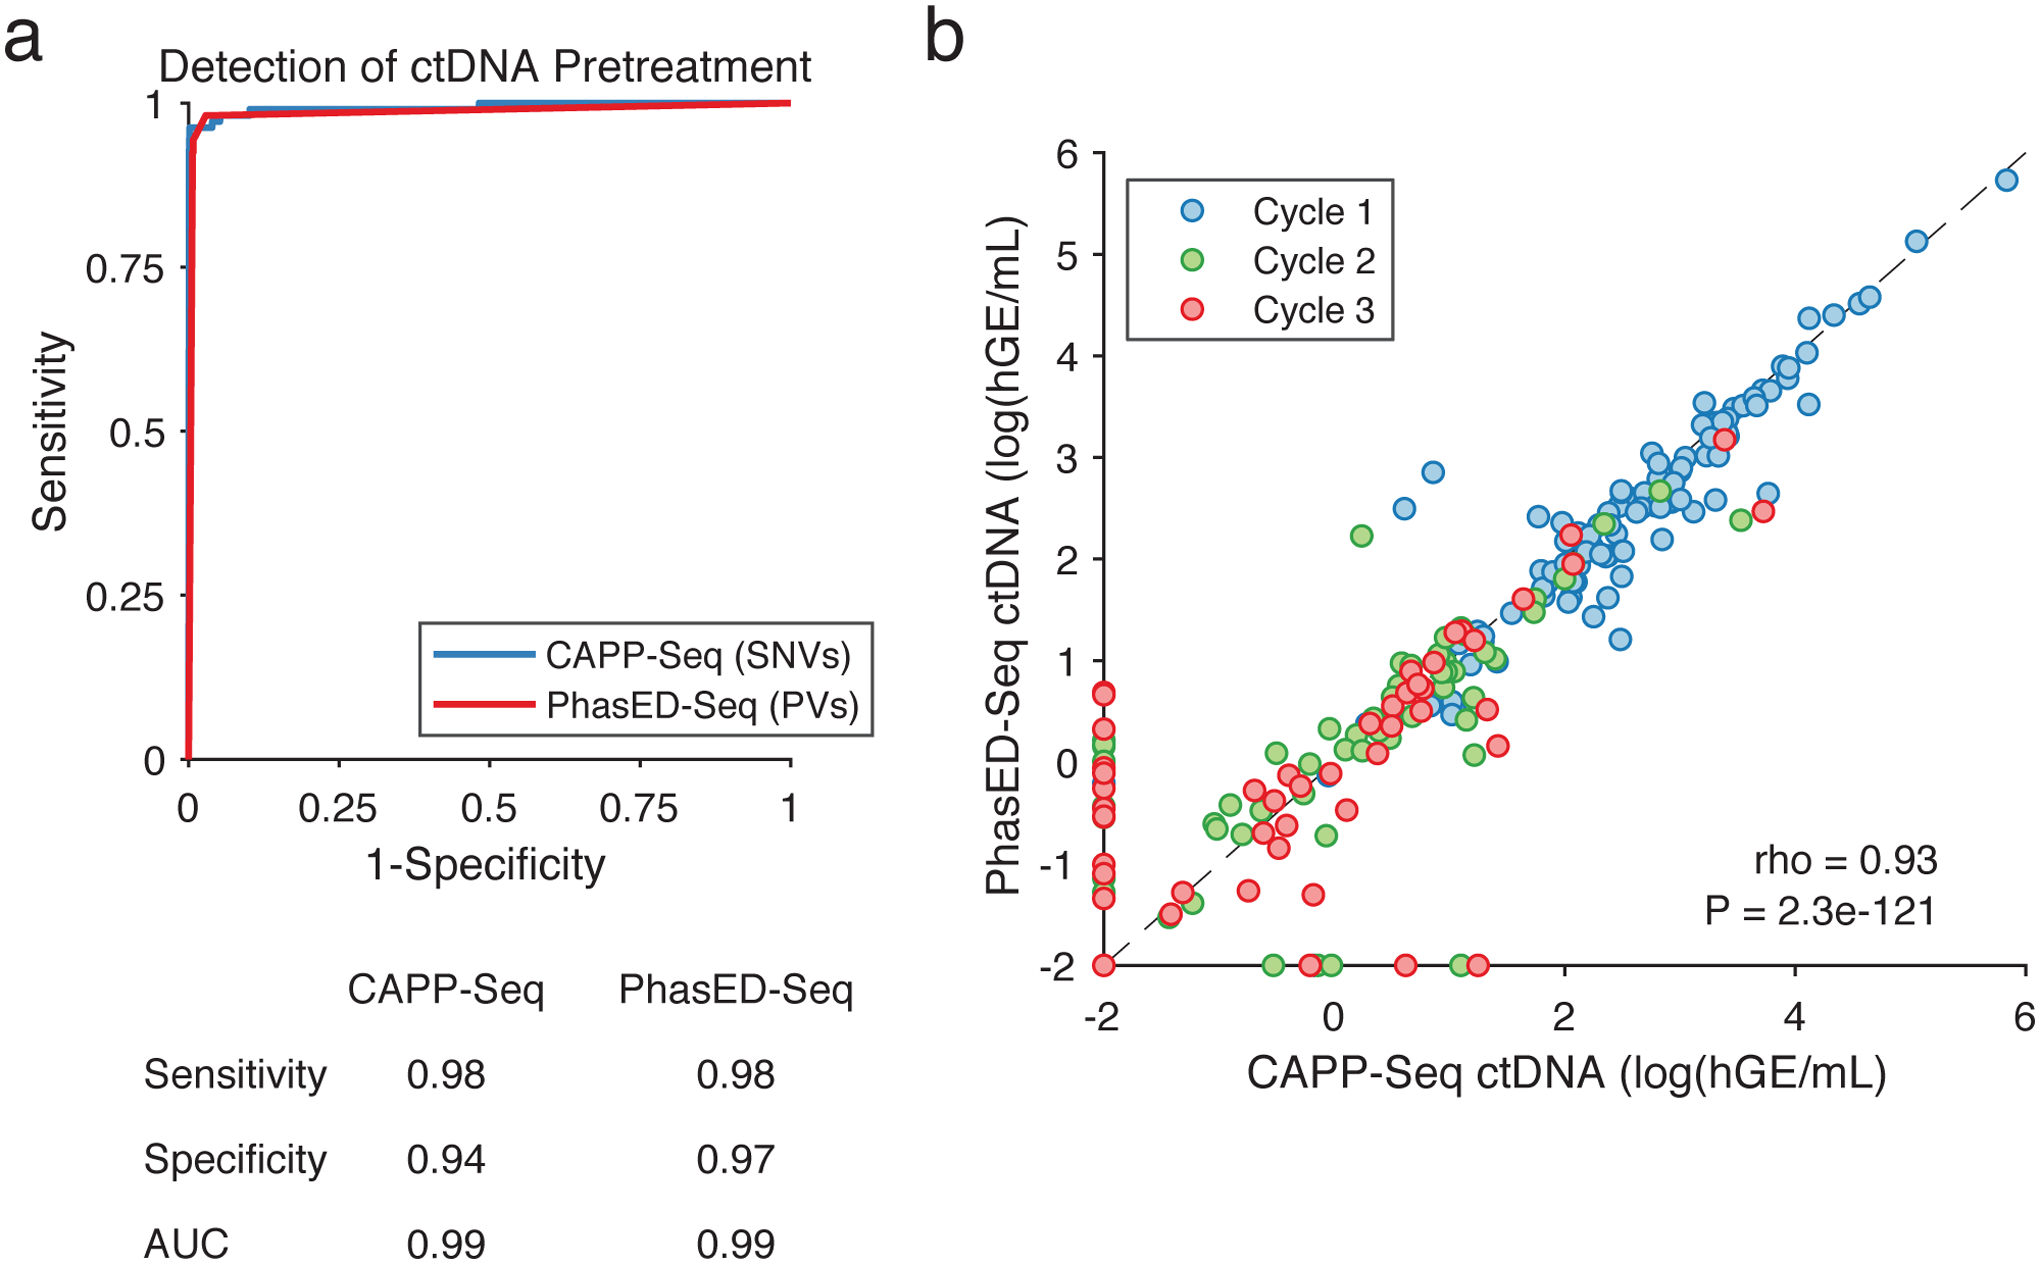
a) ROC curve of the performance for detection of ctDNA from SNVs (i.e., CAPP-Seq) and PVs using PhasED-Seq. Positive samples are 107 pretreatment plasmas, negative samples are 40 control plasmas assessed for evidence of ctDNA using 107 personalized mutation lists for 4,280 total samples. Sensitivity and specificity at optimum point and AUC are shown.
b) Quantity of ctDNA (measured as log10(haploid genome equivalents/mL)) as measured by CAPP-Seq vs. PhasED-Seq in individual samples. Samples taken prior to cycle 1 of RCHOP therapy (i.e., pretreatment), prior to cycle 2, and prior to cycle 3, are shown in independent colors (blue, green, and red respectively; 277 total samples). Undetectable levels fall on the axes. Spearman correlation and P-value are shown.
Extended Data Figure 7. Detection of ctDNA after two cycles of systemic therapy.
a) Scatterplot shows the log-fold change in ctDNA after 2 cycles of therapy measured by CAPP-Seq or PhasED-Seq for patients receiving RCHOP therapy. Dotted lines show the previously established threshold of a 2.5-log reduction in ctDNA for molecular response. Undetectable samples fall on the axes; the correlation coefficient represents a Spearman rho for the samples detected by both CAPP-Seq and PhasED-Seq.
b) Detection rate of ctDNA samples after 2 cycles of therapy by PhasED-Seq vs CAPP-Seq. Patients with eventual disease progression are shown in red, while patients without eventual disease progression are shown in blue.
c) ROC curve for detection of ctDNA after 2 cycles of treatment. Positive samples include 24 samples from patients with eventual disease progression, and therefore are known to have residual disease. Negative samples are from 4,280 tests on healthy controls as described in Extended Data Fig 6a.
d) Kaplan-Meier plots and two-sided log-rank test showing the event-free survival of 69 patients achieving an MMR stratified by ctDNA detection with CAPP-Seq (top) or PhasED-Seq (bottom).
Extended Data Figure 8. Detection of ctDNA after one cycle of systemic therapy.
a) Scatterplot showing the log-fold change in ctDNA after 1 cycle of therapy measured by CAPP-Seq or PhasED-Seq for patients receiving RCHOP therapy. Dotted lines show the previously established threshold of a 2-log reduction in ctDNA for molecular response. Undetectable samples fall on the axes; the correlation coefficient represents a Spearman rho for the samples detected by both CAPP-Seq and PhasED-Seq.
b) Detection rate of ctDNA samples after 1 cycle of therapy by PhasED-Seq vs CAPP-Seq. Patients with eventual disease progression are shown in red, while patients without eventual disease progression are shown in blue.
c) ROC curve for detection of ctDNA after 2 cycles of treatment. Positive samples include 22 samples from patients with eventual disease progression, and therefore are known to have residual disease. Negative samples are from 4,280 tests on healthy controls as described in Extended Data Fig 6a.
d) Waterfall plot showing the change in ctDNA levels measured by CAPP-Seq after 1 cycle of first-line therapy in patients with DLBCL. Patients with undetectable ctDNA by CAPP-Seq are shown as “ND” (“not detected”), in darker colors. The colors of the bars also indicate the eventual clinical outcomes for these patients.
e) A Kaplan-Meier plot showing the event-free survival for 33 DLBCL patients with undetectable ctDNA measured by CAPP-Seq after 1 cycle of therapy.
f) A Kaplan-Meier plot and two-sided log-rank test showing the event-free survival of 33 patients shown in f) (undetectable ctDNA by CAPP-Seq) stratified by ctDNA detection via PhasED-Seq at this same time-point (cycle 2, day 1).
g) A Kaplan-Meier plot and two-sided log-rank test showing the event-free survival for 82 patients with DLBCL stratified by ctDNA at cycle 2, day 1 separated into 3 strata – patients failing to achieve an early molecular response (red), patients with an early molecular response who still have detectable ctDNA by PhasED-Seq and/or CAPP-Seq (grey), and patients who have a stringent molecular remission (undetectable ctDNA by PhasED-Seq and CAPP-Seq; blue).
Extended Data Figure 9. Performance of ctDNA detection at the end of systemic therapy.
a) ROC curve for detection of ctDNA after the completion of planned systemic therapy. Positive samples include 5 samples from patients with eventual disease progression, and therefore are known to have residual disease. Negative samples are from 4,280 tests on healthy controls as described in Extended Data Fig 6a.
b) The ctDNA profile of a patient with stage 4 DLBCL undergoing systemic chemotherapy, with pretreatment PET scan shown on the left. This patient only received one cycle of EPOCH-R chemotherapy from 6 planned treatments (dashed arrows – planned therapy that was not given). Following this, the patient self-discontinued treatment. This patient was found to have cleared their ctDNA by PhasED-Seq and continues in clinical remission after > 4 years.
Extended Data Figure 10. Extension of PhasED-Seq to solid tumors.
a) A mathematical model showing the expected total unique molecular depth (blue) and duplex molecular depth (green) from an optimized hybrid-capture workflow (Chabon et al41; Methods).
b) A comparison in projected sensitivity for ctDNA detection using PVs versus structural variants (SVs) for various histologies from the PCAWG dataset. Comparison assumes a personalized sequencing panel targeting only patient-specific variants, 64ng of DNA input and 20 million sequencing reads, using the model of molecular recovery from a).
c) A comparison in expected sensitivity for ctDNA detection using PVs versus duplex sequencing and SNVs for various histologies from the PCAWG dataset. Comparison assumes a personalized sequencing panel targeting only patient-specific variants, 64ng of DNA input and 20 million sequencing reads, using the model of molecular recovery from a).
d) Detection of ctDNA for the 6 cases of patients with solid tumors, including lung cancer (n=5) and breast cancer (n=1) using SNV-based detection (i.e., CAPP-Seq) or PhasED-Seq with a personalized panel. Detection of ctDNA in patient plasma samples are shown in blue; samples detectable with PhasED-Seq but not SNV based approaches are in light blue. Specificity of the assay was assessed using 24 healthy control samples; detection of evidence of ctDNA by PhasED-Seq in these are shown on the right in pink across all 6 personalized panels, indicating 97% (139/144) specificity; CAPP-Seq on the same samples showed 95% (137/144) specificity.
e) The ctDNA profile of a patient with stage 3 lung adenocarcinoma (LUP831) undergoing combined chemo-radiotherapy (CRT) and immunotherapy, measured by both CAPP-Seq and PhasED-Seq. The left panel shows the measured tumor fraction in the tumor biopsy sample using both methods. The right panel shows the tumor fraction from plasma DNA, including a sample detected by PhasED-Seq that is undetected by CAPP-Seq. ND: not detected.
Supplementary Material
Acknowledgements
This work was supported by the National Cancer Institute (R01CA233975 and R01CA188298 to A.A.A. and M.D., K08CA241076 to D.M.K.), the Virginia and D.K. Ludwig Fund for Cancer Research (A.A.A. and M.D.), the Bakewell Foundation (A.A.A. and M.D.), the Damon Runyon Cancer Research Foundation (PST#09-16 to D.M.K. and DR-CI#71-14 to A.A.A), the American Society of Hematology Scholar Award (A.A.A), V Foundation for Cancer Research Abeloff Scholar Award (A.A.A), Conquer Cancer Foundation of the American Society of Clinical Oncology (D.M.K.), the Emerson Collective Cancer Research Fund (A.A.A.), the Stinehart/Reed Award (A.A.A.), the CRK Faculty Scholar Fund (M.D.), and the SDW/DT and Shanahan Family Foundations (A.A.A.). A.A.A. is a Scholar of The Leukemia & Lymphoma Society.
Competing Interests Statement
D.M.K. reports paid consultancy from Roche and Genentech. A.A.A. reports research funding from Celgene, Pfizer, ownership interests in FortySeven and CiberMed, and paid consultancy from Roche, Genentech, Janssen, Pharmacyclics, Gilead, Celgene, and Chugai. M.D. reports research funding from Varian Medical Systems, AstraZeneca, and Illumina, ownership interest in CiberMed, and paid consultancy from Roche, AstraZeneca, Novartis, Genentech, Illumina, RefleXion, Gritstone Oncology, Boehringer Ingelheim, and BioNTech. M.D., A.A.A., D.M.K., J.C., and M.S.E. report patent filings related to cancer biomarkers. M.D., A.A.A., D.M.K., and J.C. report ownership interest in Foresight Diagnostics. R.O.C. is a member of the Roche advisory board and received research support from Roche. D.R. received research support from Gilead, Janssen, Roche, and AbbVie, outside the submitted work. E.J.M. has served as a paid consultant for DeciBio. The remaining authors declare no competing interests.
Data Availability
Whole genome sequencing data was obtained from the Pan-Cancer Analysis of Whole Genomes (PCAWG) from https://dcc.icgc.org/pcawg. Additional lymphoma WGS was obtained from the International Cancer Genome Consortium website (malignant lymphoma project, MALY-DE), as well as from DOI: 10.1182/blood-2013-02-48372733 and 10.1016/j.cell.2014.11.01334. Raw data for samples used in the dilution series is available at http://phasedseq.stanford.edu. This website provides users with software for phased-variant monitoring (PhasED-Seq v.1.0). Included here are the list of SNVs and PVs used to detected tumor DNA from each of the three samples used in this dilution series, as well as the sequencing files for each concentration condition. Owing to restrictions related to dissemination of germline sequence information included in the informed consent forms used to enroll study subjects, we are unable to provide access to other raw sequencing data. Reasonable requests for additional data will be reviewed by the senior authors to determine whether they can be fulfilled in accordance with these privacy restrictions. Requests for additional materials related to this work should be directed to A.A.A.
References
- 1.Diehl F et al. Circulating mutant DNA to assess tumor dynamics. Nature medicine 14, 985–990, doi: 10.1038/nm.1789 (2008). [DOI] [PMC free article] [PubMed] [Google Scholar]
- 2.Newman AM et al. Integrated digital error suppression for improved detection of circulating tumor DNA. Nature biotechnology 34, 547–555, doi: 10.1038/nbt.3520 (2016). [DOI] [PMC free article] [PubMed] [Google Scholar]
- 3.Scherer F et al. Distinct biological subtypes and patterns of genome evolution in lymphoma revealed by circulating tumor DNA. Science translational medicine 8, 364ra155, doi: 10.1126/scitranslmed.aai8545 (2016). [DOI] [PMC free article] [PubMed] [Google Scholar]
- 4.Chabon JJ et al. Circulating tumour DNA profiling reveals heterogeneity of EGFR inhibitor resistance mechanisms in lung cancer patients. Nature communications 7, 11815, doi: 10.1038/ncomms11815 (2016). [DOI] [PMC free article] [PubMed] [Google Scholar]
- 5.Bettegowda C et al. Detection of circulating tumor DNA in early- and late-stage human malignancies. Science translational medicine 6, 224ra224, doi: 10.1126/scitranslmed.3007094 (2014). [DOI] [PMC free article] [PubMed] [Google Scholar]
- 6.Sozzi G et al. Analysis of circulating tumor DNA in plasma at diagnosis and during follow-up of lung cancer patients. Cancer research 61, 4675–4678 (2001). [PubMed] [Google Scholar]
- 7.Thierry AR et al. Clinical validation of the detection of KRAS and BRAF mutations from circulating tumor DNA. Nature medicine 20, 430–435, doi: 10.1038/nm.3511 (2014). [DOI] [PubMed] [Google Scholar]
- 8.Tie J et al. Circulating tumor DNA analysis detects minimal residual disease and predicts recurrence in patients with stage II colon cancer. Science translational medicine 8, 346ra392, doi: 10.1126/scitranslmed.aaf6219 (2016). [DOI] [PMC free article] [PubMed] [Google Scholar]
- 9.Kalinich M & Haber DA Cancer detection: Seeking signals in blood. Science (New York, N.Y.) 359, 866–867, doi: 10.1126/science.aas9102 (2018). [DOI] [PMC free article] [PubMed] [Google Scholar]
- 10.Phallen J et al. Direct detection of early-stage cancers using circulating tumor DNA. Science translational medicine 9, doi: 10.1126/scitranslmed.aan2415 (2017). [DOI] [PMC free article] [PubMed] [Google Scholar]
- 11.Abbosh C, Birkbak NJ & Swanton C Early stage NSCLC - challenges to implementing ctDNA-based screening and MRD detection. Nat Rev Clin Oncol 15, 577–586, doi: 10.1038/s41571-018-0058-3 (2018). [DOI] [PubMed] [Google Scholar]
- 12.Abbosh C et al. Phylogenetic ctDNA analysis depicts early-stage lung cancer evolution. Nature 545, 446–451, doi: 10.1038/nature22364 (2017). [DOI] [PMC free article] [PubMed] [Google Scholar]
- 13.Newman AM et al. An ultrasensitive method for quantitating circulating tumor DNA with broad patient coverage. Nature medicine 20, 548–554, doi: 10.1038/nm.3519 (2014). [DOI] [PMC free article] [PubMed] [Google Scholar]
- 14.Kurtz DM et al. Circulating Tumor DNA Measurements As Early Outcome Predictors in Diffuse Large B-Cell Lymphoma. Journal of clinical oncology : official journal of the American Society of Clinical Oncology 36, 2845–2853, doi: 10.1200/JCO.2018.78.5246 (2018). [DOI] [PMC free article] [PubMed] [Google Scholar]
- 15.Roschewski M et al. Circulating tumour DNA and CT monitoring in patients with untreated diffuse large B-cell lymphoma: a correlative biomarker study. The Lancet. Oncology 16, 541–549, doi: 10.1016/S1470-2045(15)70106-3 (2015). [DOI] [PMC free article] [PubMed] [Google Scholar]
- 16.Garcia-Murillas I et al. Mutation tracking in circulating tumor DNA predicts relapse in early breast cancer. Science translational medicine 7, 302ra133, doi: 10.1126/scitranslmed.aab0021 (2015). [DOI] [PubMed] [Google Scholar]
- 17.Schmitt MW et al. Detection of ultra-rare mutations by next-generation sequencing. Proceedings of the National Academy of Sciences of the United States of America 109, 14508–14513, doi: 10.1073/pnas.1208715109 (2012). [DOI] [PMC free article] [PubMed] [Google Scholar]
- 18.Kennedy SR et al. Detecting ultralow-frequency mutations by Duplex Sequencing. Nat Protoc 9, 2586–2606, doi: 10.1038/nprot.2014.170 (2014). [DOI] [PMC free article] [PubMed] [Google Scholar]
- 19.Medina Diaz I et al. Performance of Streck cfDNA Blood Collection Tubes for Liquid Biopsy Testing. PloS one 11, e0166354, doi: 10.1371/journal.pone.0166354 (2016). [DOI] [PMC free article] [PubMed] [Google Scholar]
- 20.de Yebenes VG & Ramiro AR Activation-induced deaminase: light and dark sides. Trends in molecular medicine 12, 432–439, doi: 10.1016/j.molmed.2006.07.001 (2006). [DOI] [PubMed] [Google Scholar]
- 21.Pasqualucci L et al. Hypermutation of multiple proto-oncogenes in B-cell diffuse large-cell lymphomas. Nature 412, 341–346, doi: 10.1038/35085588 (2001). [DOI] [PubMed] [Google Scholar]
- 22.Jiang P et al. Lengthening and shortening of plasma DNA in hepatocellular carcinoma patients. Proceedings of the National Academy of Sciences of the United States of America 112, E1317–1325, doi: 10.1073/pnas.1500076112 (2015). [DOI] [PMC free article] [PubMed] [Google Scholar]
- 23.Alexandrov LB et al. Signatures of mutational processes in human cancer. Nature 500, 415–421, doi: 10.1038/nature12477 (2013). [DOI] [PMC free article] [PubMed] [Google Scholar]
- 24.Alexandrov LB et al. The repertoire of mutational signatures in human cancer. Nature 578, 94–101, doi: 10.1038/s41586-020-1943-3 (2020). [DOI] [PMC free article] [PubMed] [Google Scholar]
- 25.Burns MB, Temiz NA & Harris RS Evidence for APOBEC3B mutagenesis in multiple human cancers. Nature genetics 45, 977–983, doi: 10.1038/ng.2701 (2013). [DOI] [PMC free article] [PubMed] [Google Scholar]
- 26.Alexandrov LB et al. Clock-like mutational processes in human somatic cells. Nature genetics 47, 1402–1407, doi: 10.1038/ng.3441 (2015). [DOI] [PMC free article] [PubMed] [Google Scholar]
- 27.Khodabakhshi AH et al. Recurrent targets of aberrant somatic hypermutation in lymphoma. Oncotarget 3, 1308–1319, doi: 10.18632/oncotarget.653 (2012). [DOI] [PMC free article] [PubMed] [Google Scholar]
- 28.Schmitz R et al. Genetics and Pathogenesis of Diffuse Large B-Cell Lymphoma. The New England journal of medicine 378, 1396–1407, doi: 10.1056/NEJMoa1801445 (2018). [DOI] [PMC free article] [PubMed] [Google Scholar]
- 29.Rowley JD Chromosome studies in the non-Hodgkin’s lymphomas: the role of the 14;18 translocation. Journal of clinical oncology : official journal of the American Society of Clinical Oncology 6, 919–925, doi: 10.1200/JCO.1988.6.5.919 (1988). [DOI] [PubMed] [Google Scholar]
- 30.Schmitz R et al. Burkitt lymphoma pathogenesis and therapeutic targets from structural and functional genomics. Nature 490, 116–120, doi: 10.1038/nature11378 (2012). [DOI] [PMC free article] [PubMed] [Google Scholar]
- 31.Alizadeh AA et al. Distinct types of diffuse large B-cell lymphoma identified by gene expression profiling. Nature 403, 503–511, doi: 10.1038/35000501 (2000). [DOI] [PubMed] [Google Scholar]
- 32.Lenz G et al. Aberrant immunoglobulin class switch recombination and switch translocations in activated B cell-like diffuse large B cell lymphoma. J Exp Med 204, 633–643, doi: 10.1084/jem.20062041 (2007). [DOI] [PMC free article] [PubMed] [Google Scholar]
- 33.Morin RD et al. Mutational and structural analysis of diffuse large B-cell lymphoma using whole-genome sequencing. Blood 122, 1256–1265, doi: 10.1182/blood-2013-02-483727 (2013). [DOI] [PMC free article] [PubMed] [Google Scholar]
- 34.Qian J et al. B cell super-enhancers and regulatory clusters recruit AID tumorigenic activity. Cell 159, 1524–1537, doi: 10.1016/j.cell.2014.11.013 (2014). [DOI] [PMC free article] [PubMed] [Google Scholar]
- 35.Richter J et al. Recurrent mutation of the ID3 gene in Burkitt lymphoma identified by integrated genome, exome and transcriptome sequencing. Nature genetics 44, 1316–1320, doi: 10.1038/ng.2469 (2012). [DOI] [PubMed] [Google Scholar]
- 36.Puente XS et al. Non-coding recurrent mutations in chronic lymphocytic leukaemia. Nature 526, 519–524, doi: 10.1038/nature14666 (2015). [DOI] [PubMed] [Google Scholar]
- 37.Pasqualucci L et al. Analysis of the coding genome of diffuse large B-cell lymphoma. Nature genetics 43, 830–837, doi: 10.1038/ng.892 (2011). [DOI] [PMC free article] [PubMed] [Google Scholar]
- 38.Steidl C et al. MHC class II transactivator CIITA is a recurrent gene fusion partner in lymphoid cancers. Nature 471, 377–381, doi: 10.1038/nature09754 (2011). [DOI] [PMC free article] [PubMed] [Google Scholar]
- 39.Nakamura N et al. Analysis of the immunoglobulin heavy chain gene variable region of CD5-positive and -negative diffuse large B cell lymphoma. Leukemia 15, 452, doi: 10.1038/sj.leu.2402031 (2001). [DOI] [PubMed] [Google Scholar]
- 40.Wan JCM et al. ctDNA monitoring using patient-specific sequencing and integration of variant reads. Science translational medicine 12, doi: 10.1126/scitranslmed.aaz8084 (2020). [DOI] [PubMed] [Google Scholar]
- 41.Chabon JJ et al. Integrating genomic features for non-invasive early lung cancer detection. Nature 580, 245–251, doi: 10.1038/s41586-020-2140-0 (2020). [DOI] [PMC free article] [PubMed] [Google Scholar]
- 42.Razavi P et al. High-intensity sequencing reveals the sources of plasma circulating cell-free DNA variants. Nature medicine 25, 1928–1937, doi: 10.1038/s41591-019-0652-7 (2019). [DOI] [PMC free article] [PubMed] [Google Scholar]
- 43.Bratman SV et al. Personalized circulating tumor DNA analysis as a predictive biomarker in solid tumor patients treated with pembrolizumab. Nature Cancer 1, 873–881, doi: 10.1038/s43018-020-0096-5 (2020). [DOI] [PubMed] [Google Scholar]
- 44.Reinert T et al. Analysis of Plasma Cell-Free DNA by Ultradeep Sequencing in Patients With Stages I to III Colorectal Cancer. JAMA Oncol, doi: 10.1001/jamaoncol.2019.0528 (2019). [DOI] [PMC free article] [PubMed] [Google Scholar]
- 45.Leary RJ et al. Development of personalized tumor biomarkers using massively parallel sequencing. Science translational medicine 2, 20ra14, doi: 10.1126/scitranslmed.3000702 (2010). [DOI] [PMC free article] [PubMed] [Google Scholar]
- 46.Leary RJ et al. Detection of chromosomal alterations in the circulation of cancer patients with whole-genome sequencing. Science translational medicine 4, 162ra154, doi: 10.1126/scitranslmed.3004742 (2012). [DOI] [PMC free article] [PubMed] [Google Scholar]
- 47.Li Y et al. Patterns of somatic structural variation in human cancer genomes. Nature 578, 112–121, doi: 10.1038/s41586-019-1913-9 (2020). [DOI] [PMC free article] [PubMed] [Google Scholar]
- 48.Neelapu SS et al. Axicabtagene Ciloleucel CAR T-Cell Therapy in Refractory Large B-Cell Lymphoma. The New England journal of medicine 377, 2531–2544, doi: 10.1056/NEJMoa1707447 (2017). [DOI] [PMC free article] [PubMed] [Google Scholar]
- 49.Kurtz DM et al. Reply to J. Wang et al. Journal of clinical oncology : official journal of the American Society of Clinical Oncology 37, 755–757, doi: 10.1200/JCO.18.01907 (2019). [DOI] [PubMed] [Google Scholar]
- 50.Consortium, I. T. P.-C. A. o. W. G. Pan-cancer analysis of whole genomes. Nature 578, 82–93, doi: 10.1038/s41586-020-1969-6 (2020). [DOI] [PMC free article] [PubMed] [Google Scholar]
- 51.Rosenthal R, McGranahan N, Herrero J, Taylor BS & Swanton C DeconstructSigs: delineating mutational processes in single tumors distinguishes DNA repair deficiencies and patterns of carcinoma evolution. Genome Biol 17, 31, doi: 10.1186/s13059-016-0893-4 (2016). [DOI] [PMC free article] [PubMed] [Google Scholar]
- 52.Chen S, Zhou Y, Chen Y & Gu J fastp: an ultra-fast all-in-one FASTQ preprocessor. Bioinformatics (Oxford, England) 34, i884–i890, doi: 10.1093/bioinformatics/bty560 (2018). [DOI] [PMC free article] [PubMed] [Google Scholar]
- 53.Li H & Durbin R Fast and accurate short read alignment with Burrows-Wheeler transform. Bioinformatics (Oxford, England) 25, 1754–1760, doi: 10.1093/bioinformatics/btp324 (2009). [DOI] [PMC free article] [PubMed] [Google Scholar]
- 54.Bozdech Z et al. Expression profiling of the schizont and trophozoite stages of Plasmodium falciparum with a long-oligonucleotide microarray. Genome Biol 4, R9, doi: 10.1186/gb-2003-4-2-r9 (2003). [DOI] [PMC free article] [PubMed] [Google Scholar]
- 55.Jaeger JA, Turner DH & Zuker M Improved predictions of secondary structures for RNA. Proceedings of the National Academy of Sciences of the United States of America 86, 7706–7710, doi: 10.1073/pnas.86.20.7706 (1989). [DOI] [PMC free article] [PubMed] [Google Scholar]
- 56.Sugimoto N, Nakano S, Yoneyama M & Honda K Improved thermodynamic parameters and helix initiation factor to predict stability of DNA duplexes. Nucleic Acids Res 24, 4501–4505, doi: 10.1093/nar/24.22.4501 (1996). [DOI] [PMC free article] [PubMed] [Google Scholar]
- 57.Lu Z et al. BCL6 breaks occur at different AID sequence motifs in Ig-BCL6 and non-Ig-BCL6 rearrangements. Blood 121, 4551–4554, doi: 10.1182/blood-2012-10-464958 (2013). [DOI] [PMC free article] [PubMed] [Google Scholar]
- 58.Robbiani DF et al. AID is required for the chromosomal breaks in c-myc that lead to c-myc/IgH translocations. Cell 135, 1028–1038, doi: 10.1016/j.cell.2008.09.062 (2008). [DOI] [PMC free article] [PubMed] [Google Scholar]
- 59.Lieber MR Mechanisms of human lymphoid chromosomal translocations. Nat Rev Cancer 16, 387–398, doi: 10.1038/nrc.2016.40 (2016). [DOI] [PMC free article] [PubMed] [Google Scholar]
- 60.Van der Auwera GA et al. From FastQ data to high confidence variant calls: the Genome Analysis Toolkit best practices pipeline. Curr Protoc Bioinformatics 43, 11 10 11–11 10 33, doi: 10.1002/0471250953.bi1110s43 (2013). [DOI] [PMC free article] [PubMed] [Google Scholar]
- 61.Koboldt DC et al. VarScan 2: somatic mutation and copy number alteration discovery in cancer by exome sequencing. Genome Res 22, 568–576, doi: 10.1101/gr.129684.111 (2012). [DOI] [PMC free article] [PubMed] [Google Scholar]
- 62.Cibulskis K et al. Sensitive detection of somatic point mutations in impure and heterogeneous cancer samples. Nature biotechnology 31, 213–219, doi: 10.1038/nbt.2514 (2013). [DOI] [PMC free article] [PubMed] [Google Scholar]
- 63.Kim S et al. Strelka2: fast and accurate calling of germline and somatic variants. Nature methods 15, 591–594, doi: 10.1038/s41592-018-0051-x (2018). [DOI] [PubMed] [Google Scholar]
- 64.Moding EJ et al. Circulating tumor DNA dynamics predict benefit from consolidation immunotherapy in locally advanced non-small-cell lung cancer. Nature Cancer 1, 176–183, doi: 10.1038/s43018-019-0011-0 (2020). [DOI] [PMC free article] [PubMed] [Google Scholar]
Associated Data
This section collects any data citations, data availability statements, or supplementary materials included in this article.
Supplementary Materials
Data Availability Statement
Whole genome sequencing data was obtained from the Pan-Cancer Analysis of Whole Genomes (PCAWG) from https://dcc.icgc.org/pcawg. Additional lymphoma WGS was obtained from the International Cancer Genome Consortium website (malignant lymphoma project, MALY-DE), as well as from DOI: 10.1182/blood-2013-02-48372733 and 10.1016/j.cell.2014.11.01334. Raw data for samples used in the dilution series is available at http://phasedseq.stanford.edu. This website provides users with software for phased-variant monitoring (PhasED-Seq v.1.0). Included here are the list of SNVs and PVs used to detected tumor DNA from each of the three samples used in this dilution series, as well as the sequencing files for each concentration condition. Owing to restrictions related to dissemination of germline sequence information included in the informed consent forms used to enroll study subjects, we are unable to provide access to other raw sequencing data. Reasonable requests for additional data will be reviewed by the senior authors to determine whether they can be fulfilled in accordance with these privacy restrictions. Requests for additional materials related to this work should be directed to A.A.A.