

Abstract
Background:
Different anesthetic drugs and patient factors yield unique electroencephalogram (EEG) patterns. Yet, it is unclear how best to teach trainees to interpret EEG time series data and corresponding spectral information for intraoperative anesthetic titration, or what effect this might have on outcomes.
Methods:
We developed an electronic-learning curriculum (ELC) that covered EEG spectrogram interpretation and its use in anesthetic titration. Anesthesiology residents at a single academic center were randomized to receive this ELC and given spectrogram monitors for intraoperative use, versus standard residency curriculum alone without intraoperative spectrogram monitors. We hypothesized that this intervention would result in lower inhaled anesthetic administration (measured by age-adjusted total MAC fraction, aaMAC) to patients ≥ 60 years of age during the post-intervention period (the primary study outcome). To study this effect, and to determine whether the two groups were administering similar anesthetic doses pre- vs post-intervention, we compared aaMAC between control vs intervention group residents both before and after the intervention. To measure efficacy, in the post-intervention period we included only those cases in the intervention group when the monitor was actually used. Multivariable linear mixed effects modeling was performed for aaMAC fraction and hospital length of stay (LOS, a non pre-specified secondary outcome), with a random effect for individual resident. A multivariable linear mixed effects model was also used in a sensitivity analysis to determine if there was a group (intervention vs control group) by time period (post vs pre-intervention) interaction for aaMAC. Resident EEG knowledge difference (a pre-specified secondary outcome) was compared with a 2-sided 2-group paired t-test.
Results:
Post-intervention, there was no significant aaMAC difference in patients cared for by the ELC group (n=159 patients) versus control group (N=325 patients; aaMAC difference = −0.03; 95% CI: −0.09, 0.03; p=0.32). In a multivariable mixed model, the interaction of time period (post- vs pre-intervention) and group (intervention vs control) led to a non-significant reduction of −0.05 aaMAC (95% CI: −0.11, 0.01; p=0.102). ELC group residents (N=19) showed a greater increase in EEG knowledge test scores than control residents (N=20) from before to after the ELC intervention (6-point increase; 95% CI: 3.50, 8.88; p<0.001). Patients cared for by the ELC group versus control group had a reduced hospital LOS (median 2.48 days versus 3.86 days, respectively; p=0.024).
Conclusions:
Although there was no effect on mean aaMAC, these results demonstrate that this EEG-ELC intervention increased resident knowledge and raise the possibility that it may reduce hospital LOS.
Keywords: EEG spectrogram, electroencephalogram, electronic curriculum, isoflurane, MAC, resident education, volatile anesthetic
Introduction:
Specific anesthetics induce dose-dependent characteristic changes in brain physiology visible on electroencephalogram (EEG) spectrograms,1,2 which could allow for EEG spectrogram-based anesthetic titration. Some studies demonstrated that EEG-guided anesthetic titration results in less inhaled anesthetic administration than hemodynamic-based titration3,4 and may lead to reduced dose-dependent side effects and improved patient outcomes. Higher anesthetic dosage has been associated with postoperative nausea/vomiting,5,6 hypotension and myocardial depression,7,8 and postoperative cognitive dysfunction and delirium.3 Although the relative contribution of excessive anesthetic dosage to postoperative complications has been questioned,9 this is an important topic to study in older adults because they are more sensitive to anesthetic drugs, and anesthetic dosage is easily titratable.
Studies have shown that Bispectral index (BIS)-titrated anesthetic delivery results in reduced anesthetic dosage (versus traditional hemodynamic-based titration),3,4 yet this effect has not been uniformly observed.10 This variability may be due in part to the non-monotonic relationship between BIS values and volatile anesthetic dosage.11,12 BIS values are paradoxically higher in response to the same age-adjusted minimum alveolar concentration (aaMAC) values in older vs middle age or young adults, which could lead anesthesiologists to further increase volatile anesthetic dosage in older patients.11 Thus, here we focused on spectrogram-guided anesthetic titration, because specific anesthetics show dose-dependent patterns that could be used for dose titration.1,13,14
The extent to which EEG spectrogram-guided anesthetic delivery could reduce intraoperative anesthetic dosage and improve clinical outcomes in older adults is unknown, and the best way to teach trainees to interpret EEG spectrograms for anesthetic titration is unclear. Training clinicians on anesthetic-associated EEG interpretation improved their ability to assess EEG waveforms,15,16 and many believe that intraoperative EEG monitoring should be more widely used.17,18 Yet, American anesthesiology resident core competency milestones do not include learning how to read raw EEG waveforms or spectrograms.19 Thus, we designed an electronic learning curriculum (ELC) covering this topic, to test the hypothesis that EEG spectrogram-guided anesthetic titration, as compared to standard care at our institution (i.e. hemodynamic- and/or BIS-based anesthetic titration11), would lead to reduced anesthetic dosage in older adults. We performed a randomized trial to measure the effects of this ELC on intraoperative anesthetic dosage, resident knowledge, and LOS. To determine the effect of this intervention and to detect whether these outcomes were similar between the intervention vs control groups prior to the intervention, we compared these endpoints between groups both before and after the intervention.
Methods:
This study was approved by the Duke Institutional Review Board and written informed consent was obtained from Duke anesthesiology residents prior to study participation. The trial was registerd prior to subject enrolment at ClinicalTrials.gov (NCT03008863, PI: Miles Berger, MD, PhD, Registration Date: January 4, 2017). Since residents are a potentially vulnerable population, the informed consent form clearly stated that there would be no penalty or adverse consequences for residents who chose not to participate; informed consent was obtained by a research coordinator rather than the investigators (both of whom were attending anesthesiologists). This manuscript adheres to CONSORT guidelines.
Trial Design:
This was a single center, prospective, randomized controlled trial. All 41 Duke anesthesiology residents were eligible to participate, and all 41 signed informed consent to participate. The randomization schedule was generated using stratified permuted block randomization with a mixed block size, stratified by year of training (CA-1, CA-2, CA-3). Residents were assigned alphabetically by last name to sequential randomization IDs according to the schedule, and were informed of their randomization assignment by the study team. A random allocation sequence was generated using NQuery. Patients were blinded to the resident provider’s group assignment, but the resident participants, principal investigators and other research staff were not blinded.
Residents randomized to the control group (N=21) received the standard curriculum alone, which included the reading assignments ‘Monitoring Brain State During General anesthesia and Sedation (Chapter 50)’ and ‘Geriatric anesthesia (Chapter 80)’ in Miller’s Anesthesia 8th Edition.20 There were no restrictions on anesthetic titration practice or methods in the control group residents, except that they did not have access to intraoperative EEG spectrogram monitors. The control group residents had access to BIS processed EEG monitors, which are typically used in approximately one-third of adult general anesthetic cases at our institution.11
Residents randomized to the intervention group (N=20; see Figure 1A–B) underwent the ELC in addition to the standard resident education curriculum, and were given an anesthetic titration algorithm and spectrogram monitors to use in the OR. Intervention group residents signed a statement agreeing not to share ELC materials with control residents to avoid knowledge crossover. The ELC included four interactive e-learning modules (Supplemental Materials), interactive quizzes and a pre and post-test of 25 total questions (Supplemental Figure 1). ELC group residents were provided EEG spectrogram monitors (i.e. Sedline; Masimo Corp. Irvine, CA) when caring for patients ≥ 60 years old. The Sedline processed EEG patient-state index (PSI) number was hidden so intervention group residents could only see the spectrogram. Intervention group residents were also given a pocket-sized visual memory aide with a spectrogram-based titration algorithm from the ELC for intraoperative management (Figure 2). ELC group residents were instructed not to use processed EEG BIS monitoring, to avoid potential interference with spectrogram-guided anesthetic titration in the ELC study group. Attending anesthesiologists were not given the EEG-ELC and were encouraged to allow intervention residents to follow the anesthetic titration algorithm.
Fig 1a:

Consort diagram of resident curriculum assignment for the study.
Fig 1b:
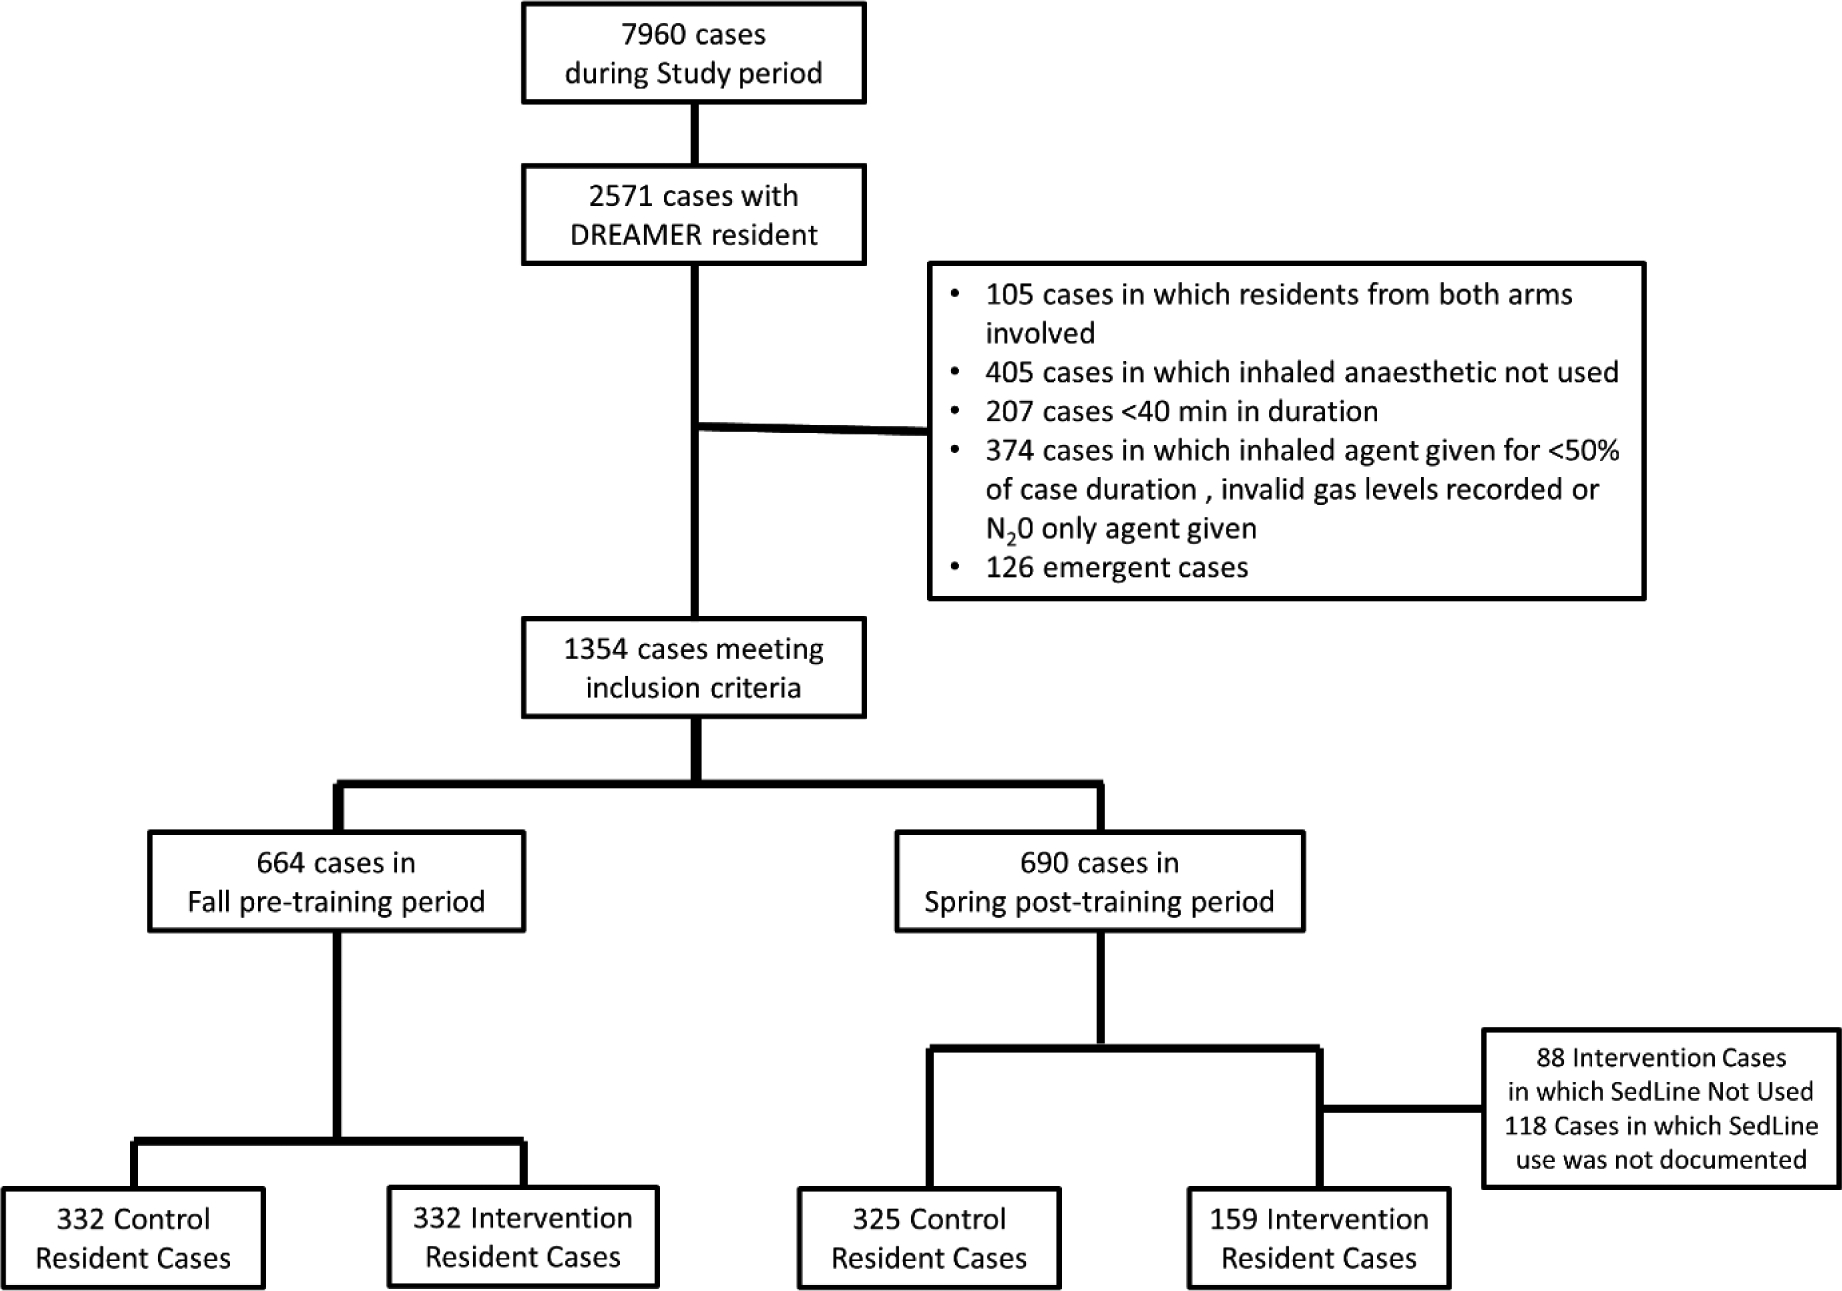
Surgical cases consort diagram for the study. aaMAC, age adjusted minimal alveolar concentration; N20, nitrous oxide.
Fig 2:

Pocketcard Algorithm for intraoperative anesthestic management provided to the intervention group residents.
The anesthetic titration algorithm given to the intervention group residents (Figure 2) was designed in mid-2016 and was based on two main points. First, most patients show significant EEG alpha band power in response to propofol or potent volatile anesthetics1, and alpha band power decreases in an anesthetic-dose dependent fashion before the appearance of burst suppression.13,14,21 We inferred that titrating anesthetic dosage to maintain robust alpha power would help avoid unnecessarily high anesthetic administration, i.e. beyond that necessary to produce amnesia and/or unconsciousness. Second, most patients receiving propofol or volatile agent-based anesthetic with opioids do not show significant EEG power above 14 Hz,22,23 while awake patients do have significant beta and gamma frequency EEG power.1 Thus, we reasoned that significant high frequency power (i.e. >14 Hz) in the absence of drugs that induce high frequency power (such as ketamine or dexmedetomidine) would likely indicate insufficient anesthetic dosage. We designed the EEG spectrogram-guided anesthetic titration algorithm in Fig 2 based on this rationale.
Since this intervention included three parts (the ELC, the titration algorithm, and spectrogram monitor use in the OR), study outcomes reflect their combined effects; this study was not designed to differentiate among their individual effects.
Patient Data:
We analysed EPIC electronic medical record intra- and post-operative data from surgical patients age ≥ 60 years who underwent general anesthesia for elective surgery under the care of ELC versus control group residents at Duke University Medical Center. We divided these anesthetic cases for analysis into those performed during the three months before versus the three months after the EEG ELC intervention period. Analyzing differences between patient groups prior to the intervention thus provides a measure of how similar the patients were who were cared for residents in each group (intervention vs control) prior to the intervention itself, a measure of whether randomization succeeded in selecting resident groups caring for similar patients.
Data Collection:
Intraoperative data from cases performed by enrolled residents during the pre-intervention period were analysed if four criteria were met. (1) Inhaled anesthetic was used for ≥ 50% of the case, (2) the case was ≥40 minutes duration, (3) the patient was not undergoing emergency surgery, and (4) the case did not involve multiple residents from different study arms.
For the post-intervention period, data from patients cared for by enrolled residents were included only if these four criteria were met. This was the first randomized controlled trial to examine the effect of an ELC and intraoperative spectrogram-guided anesthetic care (vs usual care). Our goal was thus to determine the potential efficacy of this intervention when it was used as intended in the OR, not its effectiveness in real-world intraoperative situations when a monitor might not be used (either in part or in full) for various reasons in the dynamic OR environment. Thus, in the ELC group, data were excluded if a spectrogram monitor was not recorded as used in the case. The reason(s) why the monitor was not used was recorded. This effectively provides an “as treated” (or “as received”) analysis rather than “intention to treat” (or “as assigned”) analysis.
Residents in both groups completed tests to assess EEG-related anesthesia knowledge both before and after the ELC intervention (or control curriculum) were provided to the residents. This was a pre-specified secondary outcome.
Statistical Analysis:
aaMAC Calculations and Comparisons:
The case average intraoperative age adjusted end-tidal MAC fraction (aaMAC) was calculated as described previously.11 End-tidal anesthetic concentrations (ETAC) were recorded starting 5 min after incision and ending 5 min before the end of surgery, which was defined as the EMR time stamp for the “end of surgery” note, to focus on the anesthetic ‘plateau phase’ per our recently published method.11 The age-adjusted end-tidal MAC (aaMAC) fraction was calculated relative to the agent-specific reference MAC value for patient age 40 (MAC40) with the equation derived from our recent meta-regression analysis24 using the mean of the medians of each 5-min epoch to avoid data artifacts as described.11,25
| (1) |
The total aaMAC for each patient was equal to the value of equation (1) for isoflurane, sevoflurane, or desflurane, plus the value of equation (1) for nitrous oxide.
The primary analysis compared total aaMAC between patients cared for by intervention and control residents in the post-intervention study period via univariable and multivariable linear mixed effects modelling. Additionally, we compared aaMAC during the pre-intervention period between patients cared for by residents later randomized to the intervention vs control groups, to examine whether these groups of residents were administering similar aaMAC fractions prior to randomization. These models included a random intercept for resident to account for increased correlation in treatment and outcome patterns among patients treated by the same resident. The adjustment terms for the multivariable model were specified a priori based on prior work identifying factors associated with delivered aaMAC,11 and demographic, surgical, and intraoperative factors that differed between groups (see Supplemental Table 1, multivariable linear mixed effects model for delivered aaMAC during post-intervention period).
We also conducted sensitivity analyses to investigate the consistency of our conclusions under different inclusion and methodology decisions. One analysis was restricted to patients who did not receive ketamine, and a second excluded intervention cases where BIS monitors were used. A multivariable linear mixed effects model regression using both study periods was used to study the interaction of intervention and study period; this sensitivity analysis is similar to a difference in difference study design except here the intervention was randomized.
We conducted a post-hoc exploratory analysis of the difference in rate of “high” aaMAC delivery, defined as aaMAC > 1, by group (control vs intervention) separately during the pre and post-intervention periods, via univariable and multivariable generalized linear mixed effects models. We used adjustment terms significantly associated with numeric aaMAC in our primary analysis to avoid model overfit.
Secondary Outcomes
Resident EEG knowledge base was assessed via tests before and after the educational intervention. Resident knowledge differences from before to after the intervention were compared between groups with a 2-sided 2-group paired t-test.
LOS was compared between patients cared for by ELC residents vs control group residents using multivariable linear mixed effects modelling, accounting for clustering of patients within resident provider. As LOS was right skewed, we used log-transformed LOS as the dependent variable in the model. The adjustment terms were the same as those used in the primary outcome model and aaMAC was included as well. Analyses were performed in SAS v. 9.4 (SAS INC, Cary, NC) or R v. 3.6.1 (R Foundation for Statistical Computing, Vienna, Austria), with α=0.05 level.
Sample Size and Power analysis
Based on typical cases number performed by residents at our institution, we estimated that over a 6 month study period, 21 residents per randomization group would provide general anesthesia to ~715 older adults. This sample size of 715 patients anesthetized per group provides >99% power to detect a 33% or greater difference in the mean aaMAC fraction in the intervention group vs the control group, assuming a control group mean aaMAC of 0.93 and SD of 0.34 (as seen in the control group in26), with α=0.05 in a linear mixed effects model analysis. A 33% difference in aaMAC fraction of inhaled anesthetic would be clinically relevant for two reasons. First, inhaled anesthetics have among the narrowest therapeutic indices (TI, the ratio of the amount of a drug that produces lethality to the amount that produces the desired clinical effect) of any drug used clinically: the TI for isoflurane is ~4 (i.e. 1 MAC of isoflurane will produce desired general anesthesia conditions in half the patients, while a sustained 4 MAC dose will produce cardiac arrest).27 Thus, a 33% decrease in isoflurane MAC fraction implies a significant change in isoflurane-related toxicity. Second, a ~33% decrease in mean aaMAC fraction would be clinically impactful, since a decrease of roughly this magnitude was previously associated with a 42% reduction in delirium rates and a 38% reduction in cognitive dysfunction 3 months after surgery.26
Results:
The recruitment and consent period was January 1, 2017 through January 24, 2017. Twenty out of 21 residents randomized to the control arm and 19 out of 20 residents randomized to the ELC group completed the study (Fig 1A). One resident withdrew from each study group for personal reasons unrelated to this study. In this pre-intervention period, there were 332 cases performed by residents later randomized to the control group and 332 cases performed by residents later randomized to the ELC group (Figure 1B). In the pre-intervention period, the largest differences in patient/case characteristics between groups were in surgical service, peripheral block use, and specific intraoperative medications (Supplemental Table 2). After adjusting for patient and surgical characteristics that differed significantly between groups (Supplemental Table 2), there was no difference in aaMAC values (p=0.13) during the pre-intervention period among patients cared for by residents who were subsequently randomized to the ELC vs control groups. The percentage of patients who received high aaMAC (>1.0) was 25.9% in cases performed by residents later randomized to the control group versus 25.3% in patients performed by residents later randomized to the ELC group (odds ratio [OR]: 1.00; 95% confidence interval [CI]: 0.52, 1.91; p>0.99).
During the three months after the study intervention, there were 325 cases performed by the control group and 159 cases performed by the ELC group (Fig 1B) according to the spectrogram-guided titration algorithm (Fig 2) from March 1, 2017 to June 30, 2017. The reduced number of analysable cases performed by the ELC group was primarily due to 118 cases in which ELC group residents did not record whether a spectrogram monitor was used. There were an additional 88 cases where the monitor was specifically documented as not used, including 25 cases in which other personnel (anesthesiology attending, surgery attending, or perfusionist in cardiac cases) preferred an alternate monitor, 19 cases in which the reason was not provided, 16 cases of mechanical malfunction, 13 cases in which the monitor would have interfered with the surgical site or positioning, and 9 cases with reasons specific to the resident (i.e. the senior resident was focused on training a junior residen, etc). Other less common reasons the monitor was not used included 4 cases where there was a change in the anesthesia plan from a general anesthetic to sedation, and 2 cases when the operating time was too short to allow time to place the monitor. No specific intervention group resident was less likely to use the spectrogram monitors.
In the post-intervention period, the largest differences in baseline patient or case characteristics among patients cared for by the ELC versus control group residents were in surgical service, baseline comorbidities (coronary disease, depression, anxiety), gas type used for the case, and intraoperative medication usage (midazolam, fentanyl, succinylcholine, neostigmine, and naloxone) (Table 1). We expected that intervention group residents might administer higher opioid doses to compensate for administering lower aaMAC values, similar to shifting along the isobole curve for the MAC-sparing effects of opioids to a more opioid heavy/lower volatile agent anesthetic. However, opioid dosage was actually lower in the intervention group (Table 1).
Table 1:
Post Intervention Patient and Case Characteristics
| Control (N=325) | Intervention (N=159) | Std. Diff. | |
|---|---|---|---|
| Age (yrs) | 70.10 (6.94) | 69.72 (6.92) | 0.055 |
| Age Group | 0.045 | ||
| 60–69 | 163 (50.2%) | 83 (52.2%) | |
| 70–79 | 128 (39.4%) | 61 (38.4%) | |
| 80+ | 34 (10.5%) | 15 (9.4%) | |
| Sex (Male) | 175 (53.8%) | 79 (49.7%) | 0.137 |
| BMI | 28.15 (6.32) | 28.58 (6.49) | 0.068 |
| Race | 0.153 | ||
| Black or African American | 59 (18.2%) | 32 (20.1%) | |
| Caucasian/White | 253 (77.8%) | 119 (74.8%) | |
| Other | 7 (2.2%) | 6 (3.8%) | |
| Not Reported/Declined | 6 (1.8%) | 2 (1.3%) | |
| ASA Status | 0.165 | ||
| 1 | 1 (0.3%) | 0 (0.0%) | |
| 2 | 45 (13.8%) | 26 (16.5%) | |
| 3 | 194 (59.7%) | 100 (63.3%) | |
| 4 | 82 (25.2%) | 30 (19.0%) | |
| 5 | 3 (0.9%) | 2 (1.3%) | |
| HX Htn | 190 (58.5%) | 88 (55.3%) | 0.063 |
| Hx CAD | 89 (27.4%) | 30 (18.9%) | 0.203 * |
| Hx Diab | 73 (22.5%) | 32 (20.1%) | 0.057 |
| Hx neuropsych | 2 (0.6%) | 0 (0.0%) | 0.111 |
| Pre Antidepressant drug use | 33 (10.2%) | 4 (2.5%) | 0.318 * |
| Pre Anxiolytic drug use | 87 (26.8%) | 21 (13.2%) | 0.344 * |
| Pre Antipsychotic drug use | 5 (1.5%) | 1 (0.6%) | 0.088 |
| Surgical Service | 0.447 * | ||
| Anes/ Pain Mgmt | 3 (0.9%) | 0 (0.0%) | |
| General Surgery | 100 (30.8%) | 63 (39.6%) | |
| Gynecology | 13 (4.0%) | 2 (1.3%) | |
| Neurosurgery | 17 (5.2%) | 12 (7.5%) | |
| Orthopedics | 23 (7.1%) | 6 (3.8%) | |
| Otolaryngology Head and Neck | 21 (6.5%) | 9 (5.7%) | |
| Plastic Surgery | 5 (1.5%) | 0 (0.0%) | |
| Thoracic | 111 (34.2%) | 41 (25.8%) | |
| Urology | 32 (9.8%) | 26 (16.4%) | |
| aaMAC (total) | 0.90 (0.30) | 0.84 (0.25) | 0.186 |
| gas | 0.368 * | ||
| Des | 75 (23.1%) | 47 (29.6%) | |
| Iso | 152 (46.8%) | 87 (54.7%) | |
| Sevo | 98 (30.2%) | 25 (15.7%) | |
| Procedure Duration | 145 [92, 242] | 129 [86, 214] | 0.126 |
| ETT Used | 319 (98.5%) | 156 (98.7%) | 0.024 |
| Spinal block used | 0 (0.0%) | 2 (1.3%) | 0.160 |
| Epidural used | 17 (5.2%) | 13 (8.2%) | 0.118 |
| Peripheral block used | 7 (2.2%) | 4 (2.5%) | 0.024 |
| Mean BP | 87.27 (23.90) | 89.83 (20.61) | 0.115 |
| Pulse | 68.89 (11.94) | 69.05 (10.38) | 0.014 |
| SpO2 | 98.59 (2.20) | 98.44 (1.84) | 0.074 |
| Midazolam | 113 (34.8%) | 29 (18.2%) | 0.381 * |
| clonidine | 4 (1.2%) | 1 (0.6%) | 0.063 |
| dexmedetomidine | 41 (12.6%) | 15 (9.4%) | 0.102 |
| ketamine | 76 (23.4%) | 42 (26.4%) | 0.070 |
| Ketamine per Kg per case Hr * + | 0.65 (3.41) | 2.89 (17.14) | 0.181 |
| propofol | 320 (98.5%) | 153 (96.2%) | 0.139 |
| etomidate | 4 (1.2%) | 2 (1.3%) | 0.002 |
| fentanyl | 296 (91.1%) | 133 (83.6%) | 0.225 * |
| Fentanyl per Kg per case Hr * + | 0.91 (0.74) | 0.80 (0.71) | 0.146 |
| hydromorphone | 118 (36.3%) | 55 (34.6%) | 0.036 |
| Fentanyl/hydromorphone morphine equivalents (mg) | 13.8 [5, 21.3] | 9.5 [3, 15] | 0.307 |
| sufentanil | 7 (2.2%) | 7 (4.4%) | 0.127 |
| remifentanil | 55 (16.9%) | 24 (15.1%) | 0.050 |
| acetaminophen | 30 (9.2%) | 9 (5.7%) | 0.136 |
| succinylcholine | 87 (26.8%) | 29 (18.2%) | 0.205 * |
|
Non depolarizing
muscle relaxant\ relax |
268 (82.5%) | 141 (88.7%) | 0.178 |
| diphenhydramine | 8 (2.5%) | 1 (0.6%) | 0.149 |
| metoclopramide | 1 (0.3%) | 1 (0.6%) | 0.047 |
| promethazine | 0 (0.0%) | 2 (1.3%) | 0.160 |
| physostigmine | 0 | 0 | -- |
| neostigmine | 176 (54.2%) | 115 (72.3%) | 0.384 * |
| haloperidol | 1 (0.3%) | 0 (0.0%) | 0.079 |
| flumazenil | 0 | 0 | -- |
| naloxone | 8 (2.5%) | 0 (0.0%) | 0.225 * |
| sugammadex | 20 (6.2%) | 14 (8.8%) | 0.101 |
among those who received drug;
standardized difference >0.2 considered measurable and clinically different, those between 0.1 and 0.2 are non-negligible but not deemed clinically meaningful
After adjusting for patient and surgical characteristics in the post-intervention period (see Supplemental Table 1 for multivariable model), there was no difference in delivered aaMAC between groups (Figure 3; mean difference = −0.03; 95% CI: −0.09, 0.03; p=0.32). Additional sensitivity analyses demonstrated that this effect remained non-significant when excluding ketamine administration or cases in which a BIS monitor was used by an intervention group resident (Supplemental Table 3). In a mixed model sensitivity analysis comparing the effect on aaMAC of group (i.e. control vs intervention group) and time (pre vs post-intervention), the interaction term indicated that the intervention group had a non-significanly greater decrease in the delivered mean aaMAC over the study period relative to the control group (−0.05 (95% CI −0.11, 0.01; p=0.102)).
Fig 3:

Mean aaMAC difference in the pre and post-education study periods in the control and intervention groups. P=0.102 for the group by time interaction term in a multivariate model. P>0.05 between groups during each time period.
The percentage of patients who received high aaMAC (>1.0) was 17% in the ELC group versus 30% in control group cases cases (OR: 0.48; 95% CI: 0.23, 0.99; p=0.047) via univariable analysis (Figure 4); however, this difference was non-significant in a multivariable analysis (OR:0.50, 95% CI: 0.23, 1.12; p=0.093; Supplemental Table 4). In the post-intervention period, patients cared for by intervention group residents had a reduced hospital LOS versus patients cared for by control group residents in a multivariable analysis (median 2.48 versus 3.86 days; geometric mean ratio = 0.78, 95% CI: 0.63, 0.97; p=0.024; see Supplemental Table 5), a non-pre-specified secondary outcome.
Fig 4:

Change in the percentage of high aaMAC (MAC > 1.0) in the pre and post-education study periods in the control and intervention groups. * indicates p=0.047 in a univariate comparison between groups.
Pre-tests were completed between January 25, 2017 – February 22, 2017; post-tests were completed between June 14, 2017 – July 20, 2017. The mean change in pre- to post-test EEG knowledge after the instruction period was 6 points (95% CI: 3.50, 8.88; p<0.001, Figure 5) higher for ELC residents than control residents.
Fig 5:

Resident pre-test and post-test scores in the education control and intervention groups. p<0.001 in a t-test for the difference over time between groups
Discussion:
In this prospective randomized trial, the EEG-ELC increased anesthesiology resident EEG knowledge base but did not significantly reduce aaMAC fraction. Yet, patients cared for by intervention versus control group residents had a reduced LOS. Since LOS was a non-pre-specified secondary outcome, this provides hypothesis-generating evidence for evaluation in future studies, not hypothesis-confirming evidence.
There are three reasons why LOS may have changed here without significant aaMAC changes. First, some patients are more sensitive to anesthetics and at higher risk for complications like delirium28,29 that may delay hospital discharge. Thus, changes in aaMAC in these patients within the intervention group could have significant effects on overall mean LOS, even if there was no change in aaMAC between groups overall. Patients with increased anesthetic sensitivity and delirium risk may have older “brain age” than “chronologic age”,30–33 implying that more sophisticated methods will be necessary for calculating the anesthetic dosage based on individual “brain age” beyond the standard age adjustment for MAC.24 Also, end tidal aaMAC is an indirect measure of brain anesthetic concentrations; we do not know whether end-tidal aaMAC correlates with brain anesthetic concentration to the same extent across individuals. Second, the effect of this intervention on LOS may have occured indirectly via changes in culture of care; a similar indirect effect of study interventions via culture of care changes has been described.34 Third, it is possible that the effect on LOS here is a false positive result; future studies will be needed to differentiate these three possibilities.
The increase in EEG knowledge base in the resident intervention group here accords with previous studies demonstrating that anesthesiology personnel can be taught to interpret EEG spectrograms. A brief training session was sufficient to teach anesthesiologists to recognize EEG spectrogram patterns including high frequency (beta) waves, non-slow (non-delta) waves, slow (delta waves), and burst suppression.15 A brief PowerPoint presentation also allowed anesthesia providers to recognize GABA-ergic anesthetic effects on EEG spectrogram patterns.16
Here we hypothesized that this EEG-ELC would result in reduced anesthetic dosage and improved patient outcomes, since anesthetic dosage reductions have been associated with a lower incidence of postoperative complications in some3,5 but not all studies.4 The fact that our EEG-ELC intervention did not reduce anesthetic dosage can be understood through the education model of T1 to T3 translational science, though this study was performed in an operating room, not a simulation lab.35 Translating education into practice occurs in phases with results achieved in a controlled education setting (T1), then improved downstream patient care practices (T2) and improved health outcomes (T3).35 In this study, we effectively achieved a positive T1 result with the EEG-ELC intervention on curriculum-based testing. We did not achieve a clear T2 result, as there was no change in mean aaMAC fraction between groups, though the reduction in LOS is a positive (albeit non-pre-specified) T3 result.
Translating T1 to T2 and T3 results is inherently difficult. For example, challenges in implementing educational interventions in clinical practice could interfere with the effect of this EEG-ELC on intraoperative management. One study limitation is that we did not have sufficient funding and personnel to save intraoperative EEG data, so it is unclear whether the lack of a reduction in anesthetic dosage reflected insufficient implementation of the spectrogram algorithm, versus whether the algorithm was properly followed and simply did not result in reduced anesthetic dosage. Future studies on this topic should save raw EEG and anesthetic dosage data in both groups. This could help distinguish between these possibilities by examining changes in anesthetic dosage made in response to specific spectrogram patterns in the intervention group (and vice versa), versus anesthetic dosage changes (or lack thereof) in response to similar spectrogram patterns in the control group. This would effectively measure the extent to which the ELC algorithm was followed in the intervention group. Further clarity may also come from another study investigating whether titrating anesthetic dosage based on frontal EEG alpha oscillations will reduce postoperative delirium rates.36
A second limitation is that in the post-intervention period, there were 196 cases performed by intervention residents in which spectrogram monitor use was not documented or not used. Here, spectrogram monitors were provided for intervention group residents to use, but due to funding limitations we did not have personnel to go into ORs and ensure that the intervention group residents were actually using the monitors in real time. In future studies, ensuring the monitors are used in intervention group cases may be necessary.
Third, our spectrogram-based anesthetic titration algorithm was based on the idea that excessive (i.e. supra-therapeutic) volatile anesthetic dosage would result in a decrease in alpha band power, and that lowering end tidal MAC fraction in such cases would increase alpha power. This could be questioned based on data published after our study had started,37 demonstrating that in contrast to prior studies13,14 alpha power decreases with increasing volatile anesthetic concentrations in roughly half of patients, while it increases with increasing volatile anesthetic dosage in the other half. Nonetheless, since alpha band peak frequency changes with anesthetic dosage37 it could be used to guide anesthetic titration in future studies.
Fourth, our ELC did not cover EEG effects of neuromuscular blockade, nociceptive stimulation, opioids, or acute hypertension.38,39 Significant work on the EEG effects of these drugs and processes has been published since this study was designed (in 2015–2016);40 that should be incorporated in future studies.
Nonetheless, this study has significant strengths including an EEG-ELC that improved resident knowledge without increased formal lecture time. This curriculum is available online; login information is provided in the methods section. Another strength is that pre-intervention period data showed that residents later randomized to the control versus intervention groups were administering similar amounts of anesthetic prior to randomization (Figures 3,4). Overall, our results highlight the need for future studies to better understand the knowledge to action gap for EEG spectrogram-guided anesthetic titration, barriers to related practice change in the operative setting, and effects of EEG spectrogram-guided anesthetic titration on clinical outcomes such as LOS.
Supplementary Material
Key Points Summary:
Question: Compared to standard resident education, does an educational intervention (consisting of a electronic learning curriculum on EEG-spectrogram interpretation) lead to increased resident EEG knowledge, altered anesthethic delivery, and/or improved clinical outcomes in older adults?
Findings: Trainees randomized to the EEG electronic learning curriculum demonstrated improved EEG knowledge, and patients cared for by intervention vs control group residents received a similar average age-adjusted MAC yet had a decreased hospital length of stay.
Meaning: The EEG electronic learning curriculum improves resident knowledge; but did not lead to altered aaMAC delivery in older adults; further study is indicated to refine the clinical implementation of EEG spectrogram-guided anesthetic delivery, and to study its impact on outcomes among older adults.
Acknowledgments:
Mark Neumann, M.D., Head of the Geriatrics Committee of the American Society of Anesthesiology, Associate Professor in the Department of Anesthesiology and Critical Care, University of Pennsylvania, Philadelphia, PA, USA
We thank Dr. Mark Neumann for helpful discussions.
Frederick Sieber, M.D., President-Elect of the Society for Advancement of Geriatric Anesthesia, Professor in the Department of Anesthesiology and Critical Care Medicine, Johns Hopkins University, Baltimore, MD, USA
We thank Dr. Frederick Sieber for helpful discussions.
Masimo, Inc. provided material support (i.e. spectrogram monitor loan) for this study but did not provide any funds to support this study. Masimo had no control over the data collection or analysis and did not participate in writing this paper.
Funding Statement:
Geriatrics for Specialists Initiative (GSI) small project grant from the American Geriatrics Society (New York, NY) to Miles Berger and Ankeet Udani, Jahnigen Scholar Award from the Foundation for Anesthesia Education and Research (Schaumburg, IL) and the American Geriatrics Society (New York, NY) to Miles Berger. Miles Berger also acknowledges additional support from National Institutes of Health grants R03-AG050918, K76-AG057022-01, P30AG028716, and UH3 AG056925 (Bethesda, MD).
Glossary of Terms:
- aaMAC
age-adjusted minimal alveolar concentration
- BIS
Bispectral Index
- CA-x
clinical anesthesia year of training
- DREAMER
Developing a Real-time Electroencephalogram-guided Anesthesia Management curriculum for Educating Residents
- EEG
electroencephalogram
- ELC
EEG learning curriculum
- ETAC
End-tidal anesthetic concentrations
- LOS
hospital length of stay
- MAC
minimal alveolar concentration
- MAC40
agent-specific MAC reference value at patient age 40
- PSI
patient-state index
Footnotes
Conflicts of Interest:
Miles Berger acknowledges funding from Minnetronix, Inc., for a project unrelated to the subject matter of this paper. Dr Berger also attended a Masimo Peer-to-Peer consulting/education session in 2019, for which his honorarium was donated at his request to the Foundation for Anesthesia Education & Research. Miles Berger and Ankeet Udani have attended Masimo Peer-to-Peer consulting/education sessions in prior years, for which they received honoraria. Miles Berger has also received private consulting fees for two legal cases related to postoperative cognition in older adults. Sarada Eleswarpu, Mary Cooter, Anna Ray, Sarah Wingfield, Mitch Heflin, and Shahrukh Bengali have no conflicts of interest to report. Masimo provided material support (EEG monitor loan) for this study. Per the agreement for this EEG monitor loan, Masimo personnel were permitted to review this manuscript prior to its publication but had no role in conducting this study or writing this manuscript, and have never had access to the raw study data.
Clinical trial number and registry URL
This study was approved by the Duke Medical Center Institutional Review Board and registered with ClinicalTrials.gov on January 4, 2017 (NCT03008863) by PI Miles Berger, prior to enrolment of any subjects.
References:
- 1.Brown EN, Purdon PL, Akeju O, An J. Using EEG markers to make inferences about anaesthetic-induced altered states of arousal. Br J Anaesth. 2018;121(1):325–327. [DOI] [PMC free article] [PubMed] [Google Scholar]
- 2.Akeju O, Song AH, Hamilos AE, et al. Electroencephalogram signatures of ketamine anesthesia-induced unconsciousness. Clin Neurophysiol. 2016;127(6):2414–2422. [DOI] [PMC free article] [PubMed] [Google Scholar]
- 3.Chan MT, Cheng BC, Lee TM, Gin T, Group CT. BIS-guided anesthesia decreases postoperative delirium and cognitive decline. J Neurosurg Anesthesiol. 2013;25(1):33–42. [DOI] [PubMed] [Google Scholar]
- 4.Wildes TS, Mickle AM, Ben Abdallah A, et al. Effect of Electroencephalography-Guided Anesthetic Administration on Postoperative Delirium Among Older Adults Undergoing Major Surgery: The ENGAGES Randomized Clinical Trial. JAMA. 2019;321(5):473–483. [DOI] [PMC free article] [PubMed] [Google Scholar]
- 5.Apfel CC, Kranke P, Katz MH, et al. Volatile anaesthetics may be the main cause of early but not delayed postoperative vomiting: a randomized controlled trial of factorial design. Br J Anaesth. 2002;88(5):659–668. [DOI] [PubMed] [Google Scholar]
- 6.Surgical Lerman J. and Patient Factors Involved in Postoperative Nausea and Vomiting. British Journal of Anaesthesia. 1992;69:24S–32S. [DOI] [PubMed] [Google Scholar]
- 7.Ebert TJ, Muzi M, Lopatka CW. Neurocirculatory responses to sevoflurane in humans. A comparison to desflurane. Anesthesiology. 1995;83(1):88–95. [DOI] [PubMed] [Google Scholar]
- 8.Jor O, Maca J, Koutna J, et al. Hypotension after induction of general anesthesia: occurrence, risk factors, and therapy. A prospective multicentre observational study. J Anesth. 2018;32(5):673–680. [DOI] [PubMed] [Google Scholar]
- 9.Short TG, Campbell D, Frampton C, et al. Anaesthetic depth and complications after major surgery: an international, randomised controlled trial. Lancet. 2019;394(10212):1907–1914. [DOI] [PubMed] [Google Scholar]
- 10.Avidan MS, Zhang L, Burnside BA, et al. Anesthesia awareness and the bispectral index. N Engl J Med. 2008;358(11):1097–1108. [DOI] [PubMed] [Google Scholar]
- 11.Ni K, Cooter M, Gupta DK, et al. Paradox of age: older patients receive higher age-adjusted minimum alveolar concentration fractions of volatile anaesthetics yet display higher bispectral index values. Br J Anaesth. 2019;123(3):288–297. [DOI] [PMC free article] [PubMed] [Google Scholar]
- 12.Whitlock EL, Villafranca AJ, Lin N, et al. Relationship between bispectral index values and volatile anesthetic concentrations during the maintenance phase of anesthesia in the B-Unaware trial. Anesthesiology. 2011;115(6):1209–1218. [DOI] [PMC free article] [PubMed] [Google Scholar]
- 13.Katoh T, Suzuki A, Ikeda K. Electroencephalographic derivatives as a tool for predicting the depth of sedation and anesthesia induced by sevoflurane. Anesthesiology. 1998;88(3):642–650. [DOI] [PubMed] [Google Scholar]
- 14.Kuizenga K, Wierda JM, Kalkman CJ. Biphasic EEG changes in relation to loss of consciousness during induction with thiopental, propofol, etomidate, midazolam or sevoflurane. Br J Anaesth. 2001;86(3):354–360. [DOI] [PubMed] [Google Scholar]
- 15.Bombardieri AM, Wildes TS, Stevens T, et al. Practical Training of Anesthesia Clinicians in Electroencephalogram-Based Determination of Hypnotic Depth of General Anesthesia. Anesth Analg. 2019;Publish Ahead of Print. [DOI] [PubMed] [Google Scholar]
- 16.Barnard JP, Bennett C, Voss LJ, Sleigh JW. Can anaesthetists be taught to interpret the effects of general anaesthesia on the electroencephalogram? Comparison of performance with the BIS and spectral entropy. British Journal of Anaesthesia. 2007;99(4):532–537. [DOI] [PubMed] [Google Scholar]
- 17.Berger M, Mark JB, Kreuzer M. Of Parachutes, Speedometers, and EEG: What Evidence Do We Need to Use Devices and Monitors? Anesth Analg. 2020;130(5):1274–1277. [DOI] [PMC free article] [PubMed] [Google Scholar]
- 18.Chan MTV, Hedrick TL, Egan TD, et al. American Society for Enhanced Recovery and Perioperative Quality Initiative Joint Consensus Statement on the Role of Neuromonitoring in Perioperative Outcomes: Electroencephalography. Anesth Analg. 2020;130(5):1278–1291. [DOI] [PubMed] [Google Scholar]
- 19.Culley DCN, Hall S, Kuhn C, Lewis L, Mason L, Nestler S, Patel R, Schartel S, Waldshmidt B, Warner M The Anesthesiology Milestone Project. In. The Accreditation Council for Graduate Medical Education and The American Board of Anesthesiology 2015. [Google Scholar]
- 20.Sieber F, Pauldine R. Geriatric Anesthesia. In: Miller R, ed. Miller’s Anesthesia. Vol 1. 8th ed. Philadelphia, PA: Elsevier; 2015:2407–2422. [Google Scholar]
- 21.Newberg LA, Milde JH, Michenfelder JD. The cerebral metabolic effects of isoflurane at and above concentrations that suppress cortical electrical activity. Anesthesiology. 1983;59(1):23–28. [DOI] [PubMed] [Google Scholar]
- 22.Kang H, Mohamed HMH, Takashina M, Mori T, Fujino Y, Hagihira S. Individual indicators of appropriate hypnotic level during propofol anesthesia: highest alpha power and effect-site concentrations of propofol at loss of response. J Anesth. 2017;31(4):502–509. [DOI] [PubMed] [Google Scholar]
- 23.Schwender D, Daunderer M, Mulzer S, Klasing S, Finsterer U, Peter K. Spectral edge frequency of the electroencephalogram to monitor “depth” of anaesthesia with isoflurane or propofol. Br J Anaesth. 1996;77(2):179–184. [DOI] [PubMed] [Google Scholar]
- 24.Cooter M, Ni K, Thomas J, et al. Age-dependent decrease in minimum alveolar concentration of inhaled anesthetics: a systematic search of published studies and meta-regression analysis. British Journal of Anaesthesia. 2019. [DOI] [PMC free article] [PubMed] [Google Scholar]
- 25.Van Cleve WC, Nair BG, Rooke GA. Associations Between Age and Dosing of Volatile Anesthetics in 2 Academic Hospitals. Anesth Analg. 2015;121(3):645–651. [DOI] [PubMed] [Google Scholar]
- 26.Chan MT, Cheng BC, Lee TM, Gin T. BIS-guided anesthesia decreases postoperative delirium and cognitive decline. J Neurosurg Anesthesiol. 2013;25(1):33–42. [DOI] [PubMed] [Google Scholar]
- 27.Kissin I, Morgan PL, Smith LR. Comparison of isoflurane and halothane safety margins in rats. Anesthesiology. 1983;58(6):556–561. [DOI] [PubMed] [Google Scholar]
- 28.Fritz BA, Maybrier HR, Avidan MS. Intraoperative electroencephalogram suppression at lower volatile anaesthetic concentrations predicts postoperative delirium occurring in the intensive care unit. Br J Anaesth. 2018;121(1):241–248. [DOI] [PMC free article] [PubMed] [Google Scholar]
- 29.Cooter M, Bunning T, Eleswarpu S, et al. A Processed EEG based Brain Anesthetic Resistance Index Predicts Postoperative Delirium in Older Adults: A Dual Center Study. MEDRXIV. 2021; doi: 10.1101/2021.01.07.21249360. [DOI] [PMC free article] [PubMed] [Google Scholar]
- 30.Giattino CM, Gardner JE, Sbahi FM, et al. Intraoperative Frontal Alpha-Band Power Correlates with Preoperative Neurocognitive Function in Older Adults. Front Syst Neurosci. 2017;11:24. [DOI] [PMC free article] [PubMed] [Google Scholar]
- 31.Hesse S, Kreuzer M, Hight D, et al. Association of electroencephalogram trajectories during emergence from anaesthesia with delirium in the postanaesthesia care unit: an early sign of postoperative complications. Br J Anaesth. 2019;122(5):622–634. [DOI] [PMC free article] [PubMed] [Google Scholar]
- 32.Shao YR, Kahali P, Houle TT, et al. Low Frontal Alpha Power Is Associated With the Propensity for Burst Suppression: An Electroencephalogram Phenotype for a “Vulnerable Brain”. Anesth Analg. 2020;131(5):1529–1539. [DOI] [PMC free article] [PubMed] [Google Scholar]
- 33.Kreuzer M, Stern MA, Hight D, et al. Spectral and Entropic Features Are Altered by Age in the Electroencephalogram in Patients under Sevoflurane Anesthesia. Anesthesiology. 2020;132(5):1003–1016. [DOI] [PMC free article] [PubMed] [Google Scholar]
- 34.Gawande A The Checklist Manifesto: How to Get Things Right. NY, NY: Picador (Macmillan Publishing); 2010. [Google Scholar]
- 35.McGaghie WC, Draycott TJ, Dunn WF, Lopez CM, Stefanidis D. Evaluating the impact of simulation on translational patient outcomes. Simul Healthc. 2011;6 Suppl(Suppl):S42–47. [DOI] [PMC free article] [PubMed] [Google Scholar]
- 36.Gaskell A, Pullon R, Hight D, et al. Modulation of frontal EEG alpha oscillations during maintenance and emergence phases of general anaesthesia to improve early neurocognitive recovery in older patients: protocol for a randomised controlled trial. Trials. 2019;20(1):146. [DOI] [PMC free article] [PubMed] [Google Scholar]
- 37.Hight D, Voss LJ, Garcia PS, Sleigh J. Changes in Alpha Frequency and Power of the Electroencephalogram during Volatile-Based General Anesthesia. Front Syst Neurosci. 2017;11:36. [DOI] [PMC free article] [PubMed] [Google Scholar]
- 38.Garcia PS, Kreuzer M, Hight D, Sleigh JW. Effects of noxious stimulation on the electroencephalogram during general anaesthesia: a narrative review and approach to analgesic titration. Br J Anaesth. 2021;126(2):445–457. [DOI] [PubMed] [Google Scholar]
- 39.Manyam SC, Gupta DK, Johnson KB, et al. When is a bispectral index of 60 too low?: Rational processed electroencephalographic targets are dependent on the sedative-opioid ratio. Anesthesiology. 2007;106(3):472–483. [DOI] [PubMed] [Google Scholar]
- 40.Eagleman S, MacIver MB. Molecular Diversity of Anesthetic Actions Is Evident in Electroencephalogram Effects in Humans and Animals. Int J Mol Sci. 2021;22(2). [DOI] [PMC free article] [PubMed] [Google Scholar]
Associated Data
This section collects any data citations, data availability statements, or supplementary materials included in this article.