

Abstract
The use of the mouse as a model organism is common in translational research. This mouse-human similarity holds true for placental development as well. Proper formation of the placenta is vital for development and survival of the maturing embryo. Placentation involves sequential steps with both embryonic and maternal cell lineages playing important roles. The first step in placental development is formation of the blastocyst wall (approximate embryonic days [E] 3.0–3.5). After implantation (~E4.5), extra-embryonic endoderm progressively lines the inner surface of the blastocyst wall (~E4.5–5.0), forming the yolk sac that provides histiotrophic support to the embryo; subsequently, formation of the umbilical cord (~E8.5) supports transition to the chorioallantoic placenta and hematogenous nutrition. The fully mature (“definitive”) placenta is established by ~E12.5. Abnormal placental development often leads to embryonic mortality, with the timing of death depending on when placental insufficiency takes place and which cells are involved. This comprehensive macroscopic and microscopic atlas highlights key features of normal and abnormal mouse placental development from E4.5 to E18.5. This in-depth overview of a transient (and thus seldom-analyzed) developmental tissue should serve as a useful reference to aid researchers in identifying and describing mouse placental changes in engineered, induced, and spontaneous disease models.
Keywords: mouse embryo, placenta, decidua, labyrinth, junctional zone, chorion, metrial gland
Introduction
Mouse models of human disease have become commonplace in the field of translational research and are used increasingly to explore the basis of human biological responses, including birth defects. A key component in understanding the workings of mouse models of human developmental biology revolves around having a strong understanding of the normal anatomic evolution of mouse organs and organ systems throughout each stage of development. The key events needed for appropriate formation of specific organs and organ systems occur at varying timepoints over the entire developmental period. Many resources on mouse development are available, but almost all focus on normal and irregular development of the embryo rather than its support systems (placenta and dam). Furthermore, many of these embryo-centered resources focus on genetic control of development rather than recognition of normal and abnormal embryonic structures per se.1–5 Information concentrating exclusively on the placenta, whether normal or abnormal, is relatively sparse.1,6 Importantly, resources on mouse placentation, while excellent in many respects, have limitations with regard to the availability of high-resolution color images at multiple magnifications as well as the coverage of sufficient time points. Moreover, very few of these resources offer more than a cursory set of macroscopic images outlining the stepwise placental development.
Comparative pathologists should have a fundamental understanding of normal placental anatomy and physiology as well as a reasonable comprehension regarding common findings and mechanisms by which placental insufficiency may develop at various stages of gestation. The purpose of this atlas is to provide easily accessible (online), multi-magnification, high-resolution figures from scanned whole-slide color images of hematoxylin and eosin (H&E)-stained tissue sections with detailed histologic descriptions and image annotations. This new resource is designed to aid pathologists and other biomedical researchers who use mouse models of developmental disease in identifying and characterizing common structural changes that may be encountered when evaluating placenta. In particular, the atlas is formatted to show principal anatomic and cellular features of the placenta and their evolution over time in the conventional H&E-stained sections that are used by bench pathologists who evaluate developmental phenotypes in engineered, induced, and spontaneous mouse models of disease. The schematics and images in this atlas illustrate major gestational events during placental evolution from embryonic day (E) 4.5 to E18.5, where the time of conception was set as the morning of the day after mating (i.e., E0.5) and birth occurs at about E19.0 (Figures 1 and 2). Key anatomic structures and cell types in the placenta are highlighted in multiple well-annotated images of placenta through the mid-axial plane. Examples of immunohistochemically stained sections are also presented to demonstrate several useful cell type-specific biomarkers. For ease of use, normal developmental events in the placenta are arranged in chronological order, after which commonly encountered abnormal placental phenotypes are illustrated.
Figure 1.
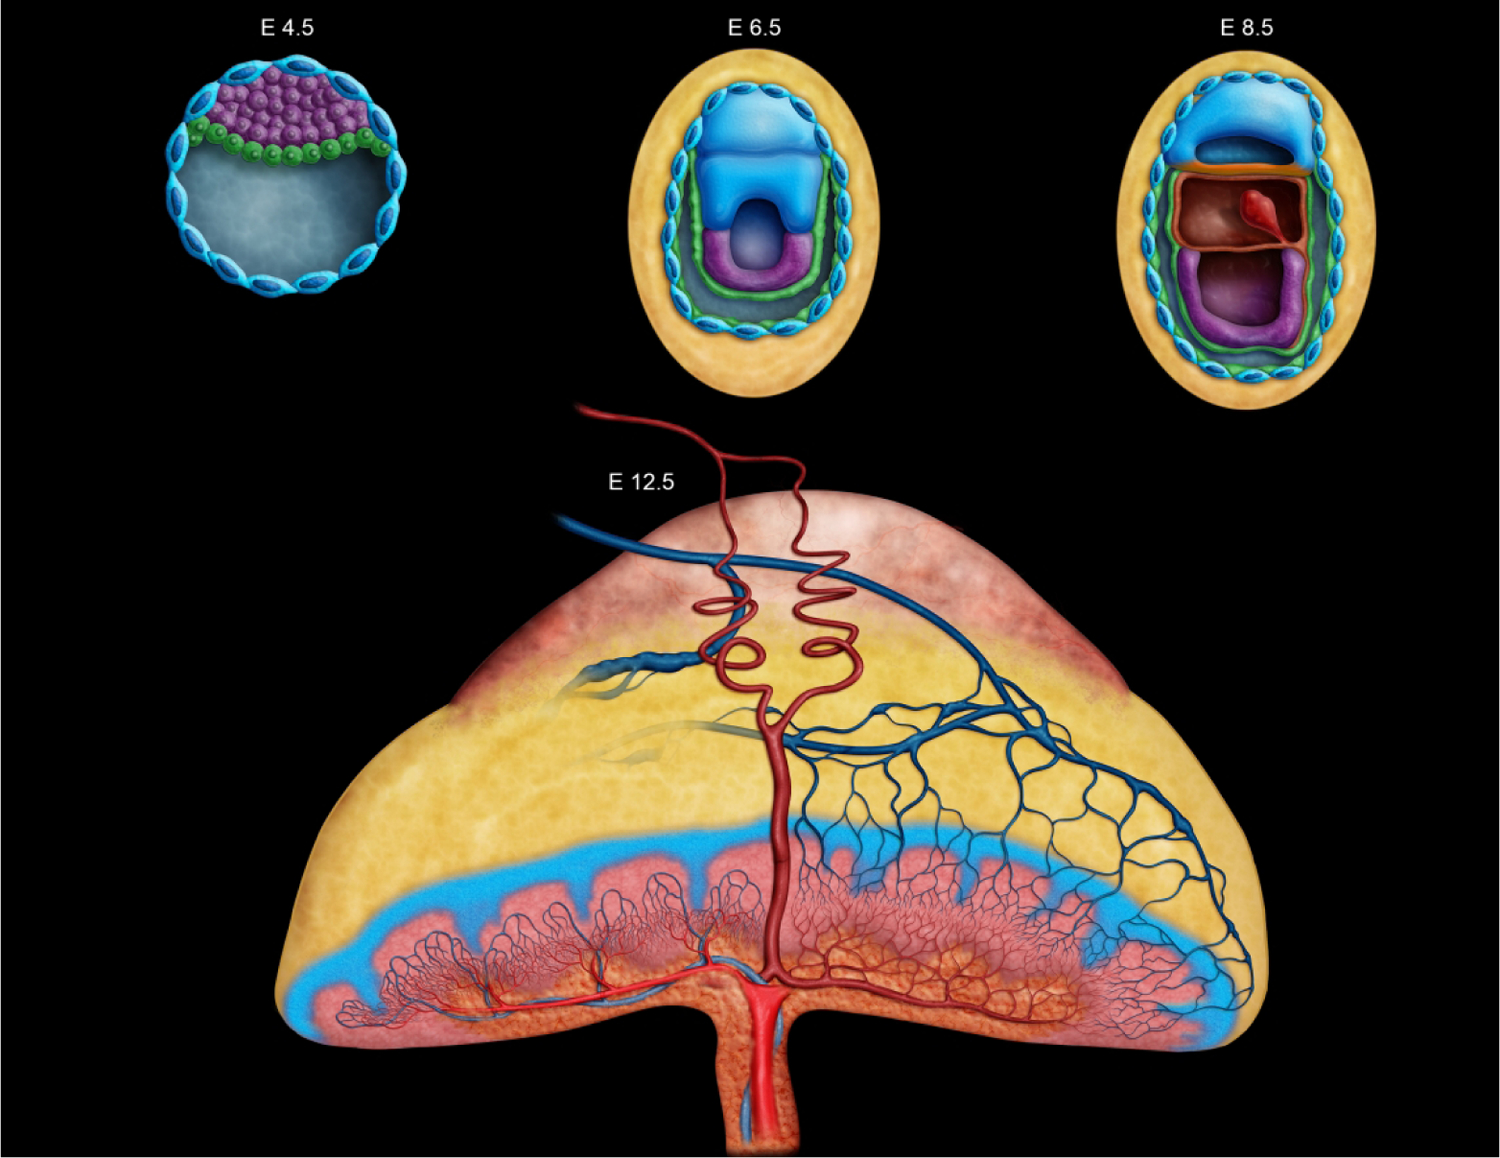
Diagrammatic representation of key developmental timepoints in mouse placentation from implantation at embryonic day (E) 4.5 to later in development at E12.5. Placental development begins at E4.5 with formation of the outer blastocyst wall enclosing the blastocoel cavity. The initial choriovitelline (yolk sac) placenta from E5.0 to E8.5 supports histiotrophic nutrition through embryonic cell phagocytosis of maternal cells and secretions. At E8.5 the umbilical cord forms, connecting the embryo to the chorioallantoic (labyrinthine) placenta and allows for structural transition by which hematogenous nutrition may take place via the maternal transfer of nutrients and oxygen to embryonic blood. Growth of the placental layers continues through E12.5, at which point the “definitive” (fully mature) placenta is fully functional and the maximum placental weight is achieved. Two maternal spiral arteries are shown as red coiled vessels moving from the chorionic plate through the metrial gland, in addition to the blue veins moving from the labyrinth through the junctional zone and decidua. The color coding here indicates different tissues as they form and change throughout development. In E4.5 to E8.5, the embryo proper is dark purple. Green denotes the primitive endoderm that will go on to become the yolk sac and envelop the embryo, while yellow is indicative of the maternal decidua. The blue nucleated cells are trophoblast giant cells that line the blastocyst and aid in decidualization throughout early placentation. In the E12.5 placenta, the pale red-orange cap that sits atop the yellow decidual tissue is the metrial gland. The junctional zone is depicted as the blue branching section that is positioned above the highly vascularized reddish-pink labyrinth layer. The chorionic plate is the orange basal layer housing the umbilical vessels and their attachment site.
Figure 2.
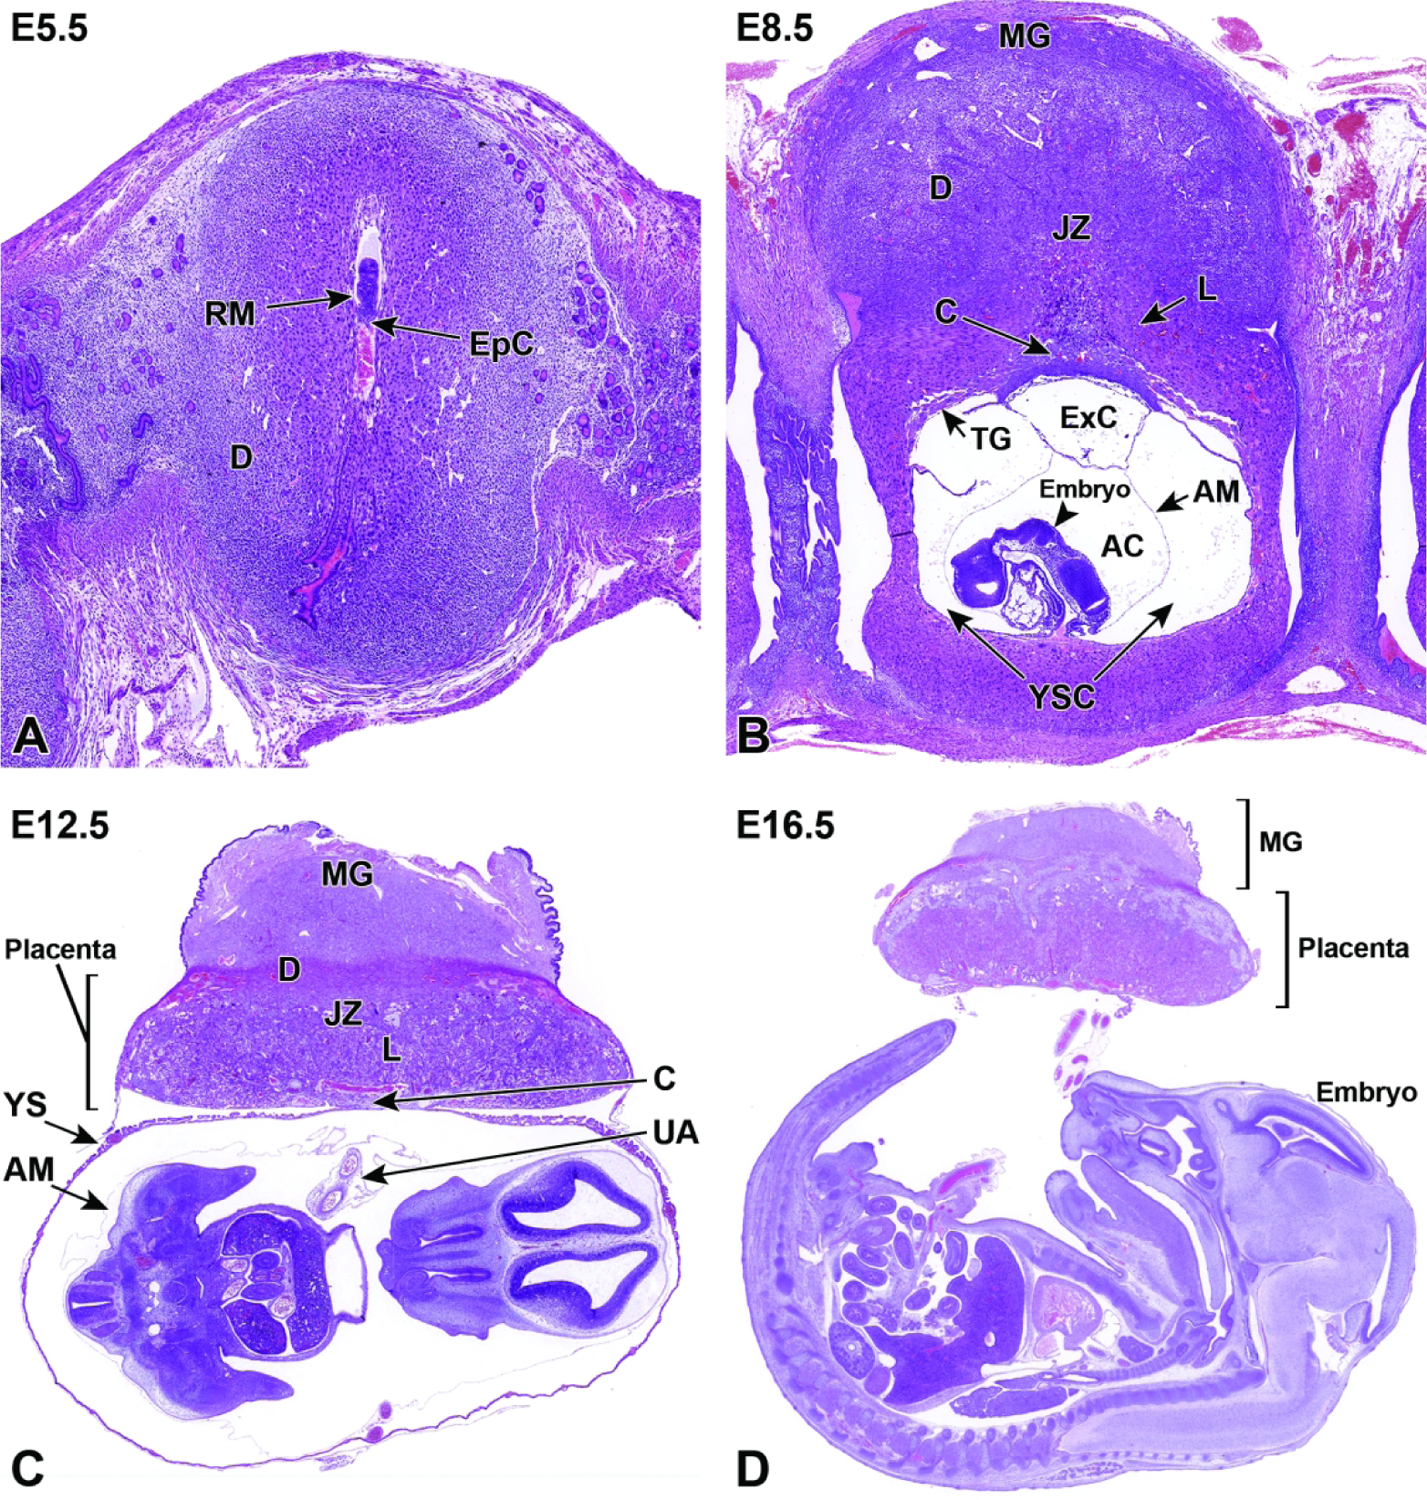
Representative images of mouse placental development at E5.5, E8.5, E12.5, and E16.5 for single implantation sites in the uterine horn. Figure A: At E5.5, the ectoplacental cone (EpC) is beginning to form at the mesometrial pole via the continued elongation of trophoblast giant cells. Figure B: At E8.5, the transition from early histiotrophic nutrition to hematogenous nutrition begins with induction of the labyrinth (L), a vascular tissue field comprised of multiple branching channels enmeshed in trophoblast cells that extends into the junctional zone (JZ). The exocoelomic cavity (ExC), the amniotic cavity (AC) and the yolk sac cavity (YSC) become distinct as they surround the embryo. The trophoblast giant (TG) cells are present at the periphery of the placenta, which has now formed distinct layers. The chorionic plate (C) is present at the base of the placental disc, while the metrial gland (MG) is located at the cap. Figure C: At E12.5, the definitive placenta is fully formed and functional with the yolk sac (YS) surrounding the embryo. The umbilical arteries (UA) extend from the embryo to the chorionic plate (C) of the placenta. The maternal derived metrial gland sits atop the maternal decidua (D), which has become much thinner by this time point. The bracketed placental layers sit below the metrial gland. Figure D: By E16.5, the definitive placenta has decreased in size relative to the embryo (compare to Figure C), and there has been a modest loss of placental mass related to cell regression in preparation for birth. Note large size of the embryo compared to the placenta. In preparation for birth and separation from the uterine wall, the quantity of maternal decidua becomes smaller (compare to Figure C). Other abbreviations: AM = amnion, RM = Reichert’s membrane.
All scanned and supplemental images can be viewed online as high-resolution color files (whole slide scans) at https://ntpimages.proscia.com/imageSets/90. Choose the “Placenta Atlas” case folder to access the bright-field whole slide images segregated by figure number. To view the figure legend once the figure is opened, select the clipboard icon in the lower right-hand corner. A list of abbreviations (Supplemental Table 1) used in image annotation are provided.
Materials and Methods
Animals
Young adult, male and nulliparous female, CD-1® IGS/Crl:CD1(ICR) mice (Charles River Laboratories, Raleigh, NC) were obtained and quarantined for one week, after which they were mated overnight commencing at the start of the 12-hr dark cycle. This stock was used based on availability, large litter size, and the common use of this outbred genetic background for developmental toxicity testing in mice. Differences in placental developmental events do occur among various inbred mouse strains11, but this outbred stock was considered to be appropriate for this project as it follows the normal (i.e., “average”) course of mouse placental development.
Dams were group-housed (2–3/cage) in Green Line IVC Sealsafe PLUS Mouse cages (Tecniplast®; West Chester, PA) on autoclaved Sani-Chip® hardwood bedding (PJ Murphy Forest Products Corp, Montville, NJ) and given reverse osmosis/deionized water and pelleted rodent chow (NIH-31; Envigo Corp, Indianapolis, IN) ad libitum. Environmental conditions were maintained at 22±2°C and 45±10% relative humidity. A constant light cycle (12 hr light, 12 hr dark) was maintained before and after breeding. Mice were provided Enviro-dri® (Eco-bedding, Shepherd Specialty Papers, Morrisville, NC) and nestlets for nesting purposes.
All animal procedures used in this study were approved in advance by the U.S. National Institute of Environmental Health Sciences (NIEHS) Institutional Animal Care and Use Committee. Mice were maintained in an Association for Assessment and Accreditation of Laboratory Animal Care International (AAALAC)-approved animal facility, where colony health surveillance reports and in-house quality assurance data confirmed mice were free of known pathogens.
Time Points Evaluated
The tissue origin of the placenta is the trophoblast that comprises the blastocyst wall, which first forms at approximately E3.0-E3.5. However, without implantation in the uterus, and without contact with the maternal component, this embryonic precursor tissue cannot be properly designated as placenta. For this reason, E5.5 was selected as the earliest time point for systematic evaluation and illustration in this atlas because mouse embryos typically have undergone implantation by this time and the egg cylinder wall that is the primordium of the placenta is well-formed near this stage. Near term (E18.5) was chosen as the latest time point for placental evaluation because birth in mice typically takes place at E19.0-E19.5, and placental morphology is fully mature. All time points indicted in this atlas are approximations as there are normal strain as well as animal to animal variations.
Embryonic Staging
The morning on which the vaginal copulatory plug was found was designated as E0.5 (often described in the literature as 0.5 days post-conception [dpc]). Since considerable variation occurs in the timing of ovulation and conception and in the developmental status of individual embryos, even within the same litter (i.e., calculated “developmental age” ≠ observed “developmental stage”), special care was taken early in gestation (E13.5 and earlier) to match both the external and internal features of each embryo to known developmental landmarks.7 Corresponding Theiler stages (TS), another morphology-based system widely used for staging mouse embryos,8 can also be utilized to ensure that control and experimental (engineered or mutant or treated) animals share the same developmental stage.
Tissue Collection, Handling, and Processing
Embryo collection was carried out on the mornings of the designated days between E5.0 to E18.5. Pregnant mice were euthanized by carbon dioxide inhalation according to the NIEHS standard operating procedure for euthanasia of rodents. Using a dissecting stereomicroscope (Leica MZ16; Leica, Vista, CA), the uterus and (where warranted) individual conceptuses (where the “conceptus” is an embryo and its placenta collected as a single unit) were isolated and immersed in ice-cold 0.1M phosphate-buffered saline (1X PBS, pH 7.4). Gross images were taken of specimens while viewed under a dissecting stereomicroscope (Leica IC90 E camera, Leica Application Suite software version 4.12.0). The conceptus or isolated placentas were then fixed by immersion at room temperature (RT) in a commercially procured solution of methanol-free 4% formaldehyde, pH 7.4 (colloquially termed 4% paraformaldehyde [PFA]; Affymetrix, Santa Clara, CA). Fixation time was 48 hours for placentas alone, and 72 hours for both individual conceptuses and conceptuses fixed in situ. Following fixation, placentas were processed routinely into paraffin. For early time points (E9.5 and earlier), conceptuses or isolated placentas were embedded while intact to avoid traumatizing the fragile placental (and embryonic) tissues. For later time points (≥ E10.5) isolated, fixed placentas were placed on a hard surface and trimmed with a sharp razor blade on the axial plane to produce two asymmetric halves; the larger piece—comprising approximately two-thirds of the placental mass—was embedded with the cut surface oriented “down” in the cassette to permit acquisition of full-thickness cross-sections. Serial 5-μm-thick sections were acquired and placed on AutoFrost® IHC (hydrophilic) clipped corner, Ventana-compatible glass microscope slides (Cancer Diagnostics, Inc., Durham, NC). Every 5th slide was stained routinely with H&E to permit histopathologic evaluation and whole-slide scanning. Selected serial sections were processed by indirect immunohistochemistry (IHC) to detect placental cell type-specific biomarkers. Briefly, sections were deparaffinized in xylene and rehydrated through a graded series of ethanol to 1X PBS. Endogenous peroxidase activity was blocked for 15 min at RT with 3% H2O2. Following a rinse in 1X PBS, epitope retrieval was conducted by high heat and pressure in a Decloaker™ (Biocare Medical, Concord, CA) for 5 min. Slides then were depressurized for 10 min, cooled for 10 min, and rinsed twice in distilled water. After blocking (Biocare Mouse Detective™, Biocare Medical) for 30 min at RT, an appropriate primary antibody (Supplemental Table 2) or a universal negative control (Biocare Medical) was applied for 1 hr at RT. The primary antibody was linked and labeled with a pre-diluted horseradish peroxidase (HRP) polymer for mouse (Biocare Medical). Sections were incubated with the Betazoid Diaminobenzidine Chromogen™ (Biocare Medical) for 6 min at RT to visualize the polymer antibody complex. Sections were counterstained with Harris hematoxylin (Harelco, Gibbstown, NJ) for 45 sec at RT, placed in 1X PBS to blue, dehydrated through a series of graded alcohols, and coverslipped with Permount™ medium (Surgipath, Richmond, IL).
Scanning
Bright-field whole-slide scanning was completed on all stained slides with a ScanScope XT™ instrument (Leica). Regions of interest were digitally captured as screen shots using ImageScope™ software (v12.3.3.5048, Leica). If an image required rotation, the selected region of interest was captured using the extraction feature in ImageScope™. White balance correction and image resizing were completed using Adobe Photoshop® (v2014.0.0 or later; Adobe, San Jose, CA). Image resolution was set at 300 dpi to fit the publisher’s requirements for image resolution.
Morphologic Evaluation
Placental anatomy and background pathology were evaluated macroscopically at necropsy and/or in images acquired using a dissecting stereomicroscope. Subsequently, normal placental structures as well as selected abnormalities were assessed in tissue sections using a bright-field microscope and/or whole-slide scanned images. The atlas was assembled from representative macroscopic and microscopic images and annotated with Adobe Photoshop® CC 2018 to identify salient features of the evolving organization of placental structures.
Basic Principles of Placental Evaluation
Approaches to Phenotypic Analysis of the Developing Mouse Placenta
The analysis of placental phenotypes in developing mice is typically guided by the initial identification of a gross structural defect in the placenta or by in utero lethality for which a structural cause cannot be defined within the embryo. The histopathological appearance of anatomic lesions in the developing placenta may provide clues regarding their cause, timing, and the most appropriate techniques that might be used to further characterize their attributes and impact. Major placental defects commonly arise during organogenesis, the period of development that encompasses the initial development of the yolk sac, the initial linkage of the embryonic vitelline (umbilical) vessels to the chorionic plate, and the ultimate formation of the definitive placenta. Evaluations of early placentation events, such as yolk sac formation and progressive branching of the yolk sac vasculature, are typically done in situ (i.e., by evaluating implantation sites in the uterus) from E5.5 to E9.0, while examination of events such as expansion of the embryonic labyrinth and progressive differentiation of various cell lineages throughout the organ are generally performed later in gestation (E10.5 to term). The embryo-derived placental precursor can be distinguished in free-floating blastocysts within the oviducts starting at about E3.5. However, mouse developmental pathology analysis at this early stage usually emphasizes evaluation of the inner cell mass ([ICM] i.e., the primordial embryo) and not the trophectoderm (i.e., the nascent embryo-derived placenta) that forms the outer blastocyst wall.
Terminology and Embryonic Staging
The “embryo” classification scheme allows for a standardized staging system for human embryos and distinguishing between these stages may occasionally be of critical importance. By this system, an “embryo” is the in utero entity in which all organ primordia are initially forming (in humans, weeks 1–8 following fertilization), while a “fetus” is the in utero organism in which all primordia have formed and now are undergoing extensive expansion and remodeling (in humans, weeks 9–37 following fertilization). Since the mouse has a much shorter gestation period (19–20 days), the designation of “embryo” versus “fetus” is less important in this species, whereas the developmental age post-conception is critically important. For this reason, the term “embryo” often is used to define all prenatal stages of murine development between fertilization and birth, with the stage of development indicated by the gestational age (with conception, designated as E0, occurring at approximately 0.5 days after mating).9 For comparison, using the human staging convention, the first two trimesters of development (“embryo”) extend from E0 to E14.5 in mice, while the last trimester (“fetus”) encompasses E15.0 to approximately postnatal day 10 (PND10) in mice. This comparison illustrates that a substantial portion of the “third trimester” in mice actually occurs after birth.10
Selection of appropriate control specimens (especially for times before E15.0) is defined in one of two fashions. The preferred means is to identify “developmental stage-matched” control mice using key macroscopic features of the developing embryo rather than to choose “age-matched” controls based on the gestational day at which the animal is collected. This strategy is essential because the difference in developmental stage between the oldest and youngest embryos in a mouse litter of a given embryonic age varies from 10 to 24 hours7,11–13; exposure to a toxicant may amplify the apparent difference between developmental stage and embryonic age by causing delays in the rate in which treated embryos reach particular developmental milestones.10 This factor is especially critical if the pathology assessment will include acquisition of quantitative data (e.g., morphometric or stereological measurements). While an obvious best practice, control mice should also share the same genetic background as the experimental animals because the average developmental stage for one mouse strain may vary by as much 0.5 days from that of other mouse strains of the same embryologic age.13 For transgenic experiments, the genotypes of the embryos are typically determined via limb snips (E11.5-E13.5) or tail snips (E14.0-E18.5) and the wild-type littermates are used as controls; yolk sac or amniotic sac (up to E11.5) also may be used as a specimen for genotyping, but these sites should not be sampled if the placenta is the main tissue of interest. Normal developmental variation of embryos and their placentas within a litter should still be considered during histopathological evaluation.
Placental Tissue Collection
The procedure used to collect samples of the placenta depends on the developmental stage during which the assessment is to be conducted. When placenta needs to be isolated early in gestation (≤ E10.5), the conceptuses (the combined embryo/placenta unit) are best collected in situ (left undisturbed within the intact uterine horn). This approach is especially effective due to the small size of the conceptus, which is easily traumatized during removal. With this approach, the definitive placenta will be anchored at the mesometrial side of the uterine wall (i.e., closest to the locations where maternal blood vessels enter the uterine wall), providing orientation during microscopic examination. Later in gestation (E10.5 to term), the placenta can be separated from the embryo using a stereomicroscope. A pair of jeweler’s forceps are useful to separate the tough uterine wall from the more friable placental tissue. Two pairs of forceps can then be used to grasp the yolk sac, separate and remove it, or micro-scissors can be used to cut the yolk sac to expose the amniotic sac, both of which can then be removed to expose the conceptus. The use of small micro-scissors rather than forceps permits more rapid specimen collection during mid to late gestation. The scissors may be used to open the uterus, detach the conceptus, and separate the placental membranes from the embryo. Collection and preservation of the uterine wall at the attachment site (mesometrial side) of the placenta is recommended in order to collect the entire placental disc without cut or tear artifact.
Fixation Protocols
The choice of fixation protocol will need to strike a balance between the degree of architectural preservation desired and several practical considerations, such as the technical skill required for a rapid and reliable dissection. In general, soft placental tissue is well preserved by immersion fixation. Common fixatives are aldehydes, such as neutral buffered 10% formalin (NBF, which in commercial solutions typically contains methanol as a stabilizer to inhibit the oxidation of formaldehyde to formic acid); 4% PFA; and, if electron microscopy is of interest, modified Karnovsky’s fixative (2.5% glutaraldehyde [Glut] with 2% PFA) or similar mixtures of fast-penetrating (NBF, PFA) and slow-penetrating (Glut) aldehydes that provide better stabilization of lipid-rich membranes and fine cell structures. Bouin’s solution or modified Davidson’s solution, which include components (acids and alcohols) that penetrate deeply and rapidly through dense skin of older (approximately E13.5 to term) embryos,14 may be used to fix placentas where the embryo and placenta are to be fixed in a single vessel. An added advantage of Bouin’s and modified Davidson’s solutions, when used for embryos of any age, is that these agents substantially harden soft tissues and decalcify bone, which permits manipulation and tissue trimming of delicate embryos with less chance of producing handling-related artifacts in the final tissue sections. However, a disadvantage of Bouin’s solution as a placental fixative is that hematopoietic cells inside blood vessels often rupture, which can prevent an effective evaluation of blood cell numbers and structure within placental vessels.
Phenotypic Evaluation of the Placenta and Metrial Gland
A complete assessment of the placenta should include both macroscopic and microscopic examinations.15–17 The placenta consists of readily discernible embryonic and maternal areas. Key embryonic derivatives include a layered placental disc (comprised from deep to superficial of the chorionic plate, labyrinth, and junctional zone) and membranes that envelop the embryo (amnion and yolk sac). The maternal region is the cap of decidua (including the metrial gland) that rests on top of the embryo-derived placental disc. The metrial gland is a transient maternal-derived placental support structure comprised of specific cell types clustered around a dense bed of winding blood vessels. This area is known variously as the metrial gland (the term used hereafter in the atlas), mesometrial triangle, or mesometrial lymphoid aggregate of pregnancy (MLAp).18–21 Though used interchangeably in some instances, the mesometrial triangle more accurately refers to a broader area of the uterine implantation site that also houses the metrial gland once it has formed.22,23 The metrial gland is a pregnancy-specific modification of the mesometrial uterus that is intimately connected to the developing chorioallantoic placenta of the rodent. It is formed during the process of decidualization after the umbilical cord is established during chorioallantoic attachment. From that point, trophoblast cell invasion into the uterine wall results in uterine tissue remodeling to form the metrial gland prior to the formation of the definitive placenta. The mature metrial gland consists of decidualized cells, numerous loops of spiral arteries, macrophages and immune cells. This area is considered an expansion of the uterine decidua or a deeper part of the maternal origin placental bed. Functionally, the metrial gland aids in modification of the mouse uterine tissue at the time of pregnancy and in preparation for placental development throughout gestation. The metrial gland is important as it is located in the region of the uterus through which most maternal blood flow will pass upon entry into the placenta and can play a key role in some placental and gestational disorders.19 Placental findings may be identified in one or several of these discrete structures by macroscopic and microscopic evaluation.
Upon removal from the uterus, the surface should be examined for any abnormalities in shape, size, and/or color. In order to ensure the metrial gland is harvested with the placenta, it is good practice to leave the mesometrial uterine wall attached to the placenta. Key macroscopic findings may be photographed. If necessary, placentas may be weighed, but in our experience this endpoint is not a standard component of placental phenotypic screens. For histopathologic evaluation, the usual orientation for metrial gland and placental trimming is to prepare mid-axial cross sections. Initial histopathologic assessment of metrial gland and placental phenotypes often is limited to a qualitative or semi-quantitative (i.e., graded) evaluation of the contours and sizes of major zones and identification of obvious cellular and tissue alterations using conventional H&E-stained sections. On occasion, the distributions and numbers of one or more placental cell lineages may be probed in serial sections using IHC to detect cell type-specific biomarkers. Quantitative methods to examine the sizes and/or numbers of cells (via morphometry and/or stereology) generally are done only to evaluate specific hypotheses,24 and as such these special methods are not addressed in the current atlas.
24-Hour Incremental Gross Placental Development
Understanding the underlying growth and development of specific tissues and the mechanisms that disrupt them is a key aspect in many areas of scientific research. In this regard, scientists often rely on histological and IHC staining techniques to identify and mark areas of importance. However, there is much value in analyzing the gross specimens from which the later histological and IHC images are derived (Figures 3, 4, 5, 6, 7, 8, 9, 10, 11, 12, 13, 14, 15, 16, 17). The gross image is what the naked eye sees before fixation and processing, and alterations in color, shape, and/or size can often be the cue to dive deeper into a research endeavor. Though many pathological abnormalities are not visible to the naked eye, some disruptions (e.g., early resorptions, mid- or late-gestation embryonic death) present with tell-tale macroscopic lesions that can save time and money when deciding how to proceed with experimentation or what direction the research should take. Gross images can also provide a timeline of development that may be easily overlooked at the microscopic level. In the case of mouse pregnancy and placental development, conceptuses in the same uterine horn may have developmentally different ages of up to 24 hours.25 This is due to the differential rates at which implantation may occur, which causes subtle physiological and chronological age variations. Observations of physically smaller embryos or placentas would be a straightforward indication for the presence of physiological and chronological age variations. However, during the later stages of definitive placental development (E12.5-E18.5), estimating these age differences can be more challenging through gross images alone.
Figure 3.
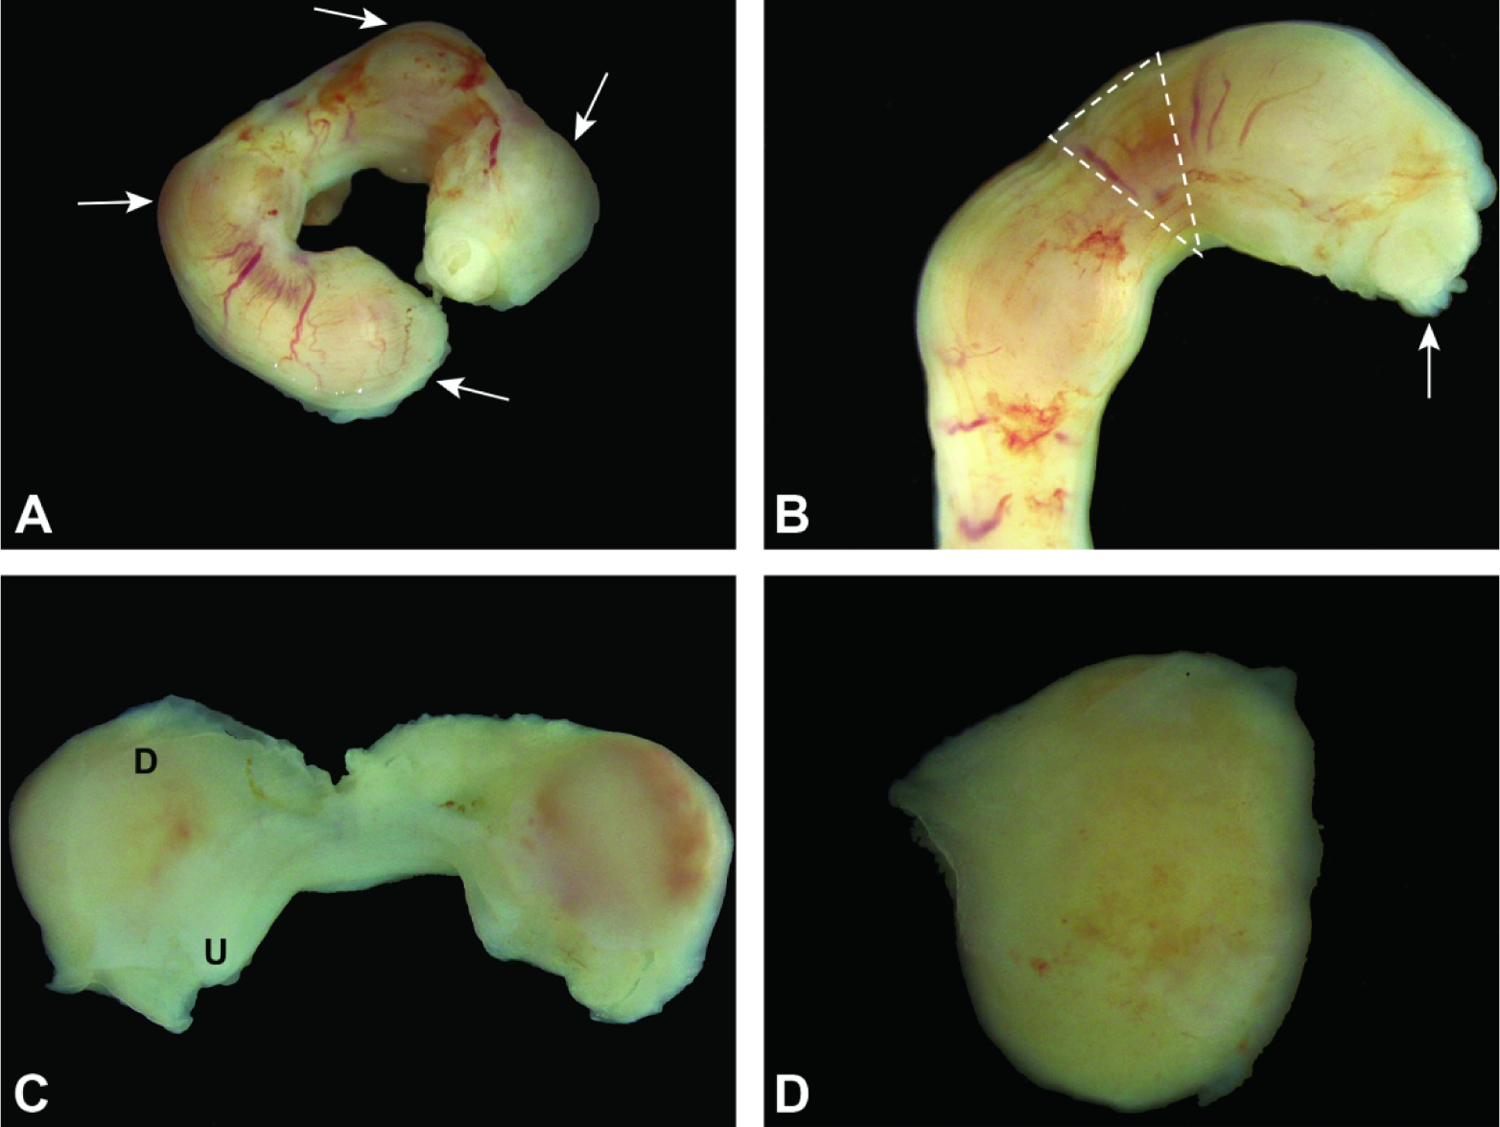
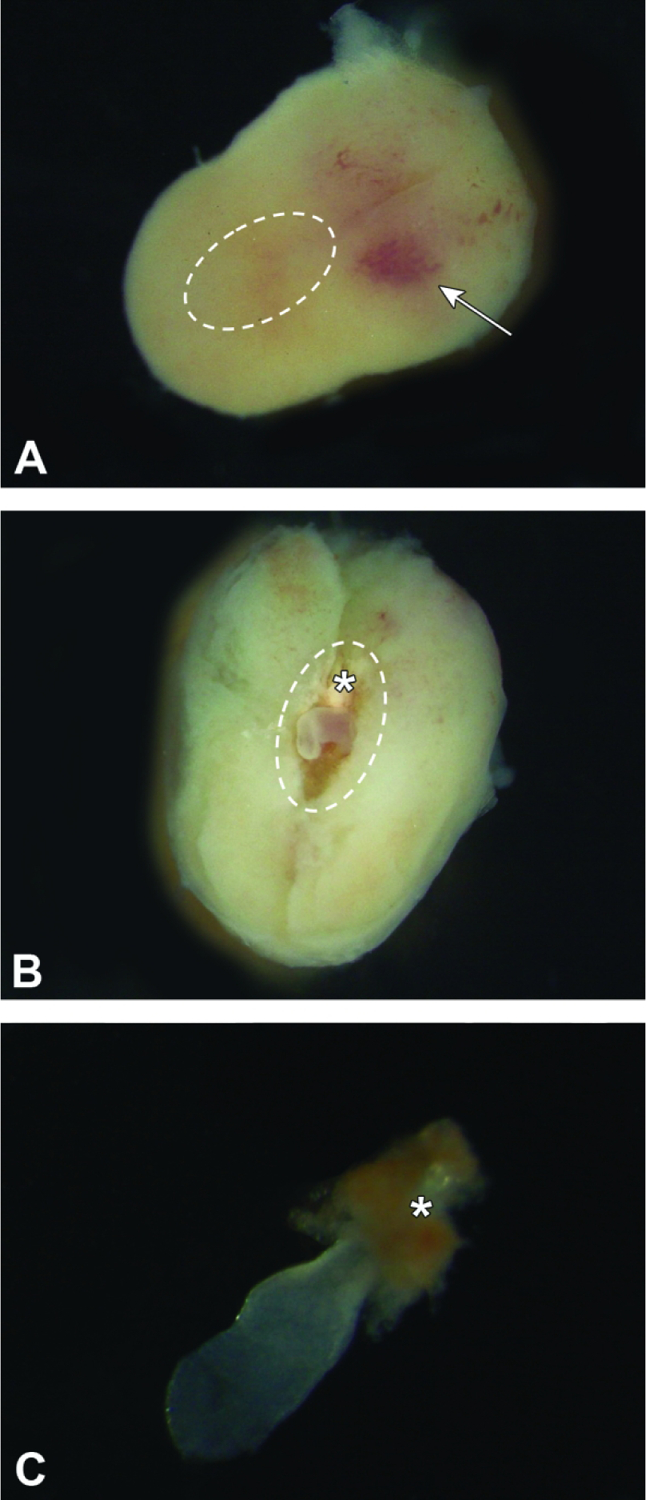
Uterine horn and conceptuses at E5.5. Figure A: Note how the conceptuses (arrows) are identifiable as slight swellings. Figure B: Removal of the uterus often leads to the partial expulsion of a conceptus (arrow) through the cut margins. Dashed lines denote the area between conceptuses where it is safe to grasp and/or cut the uterus without disrupting a conceptus. Figure C: By opening the uterus (U) along the horizontal axis, the uterus retracts and exposes the entire maternal decidua (D). Figure D: The conceptus (encompassed in maternal decidua) can then be easily isolated. 181×136mm (300 × 300 DPI)
Figure 4.
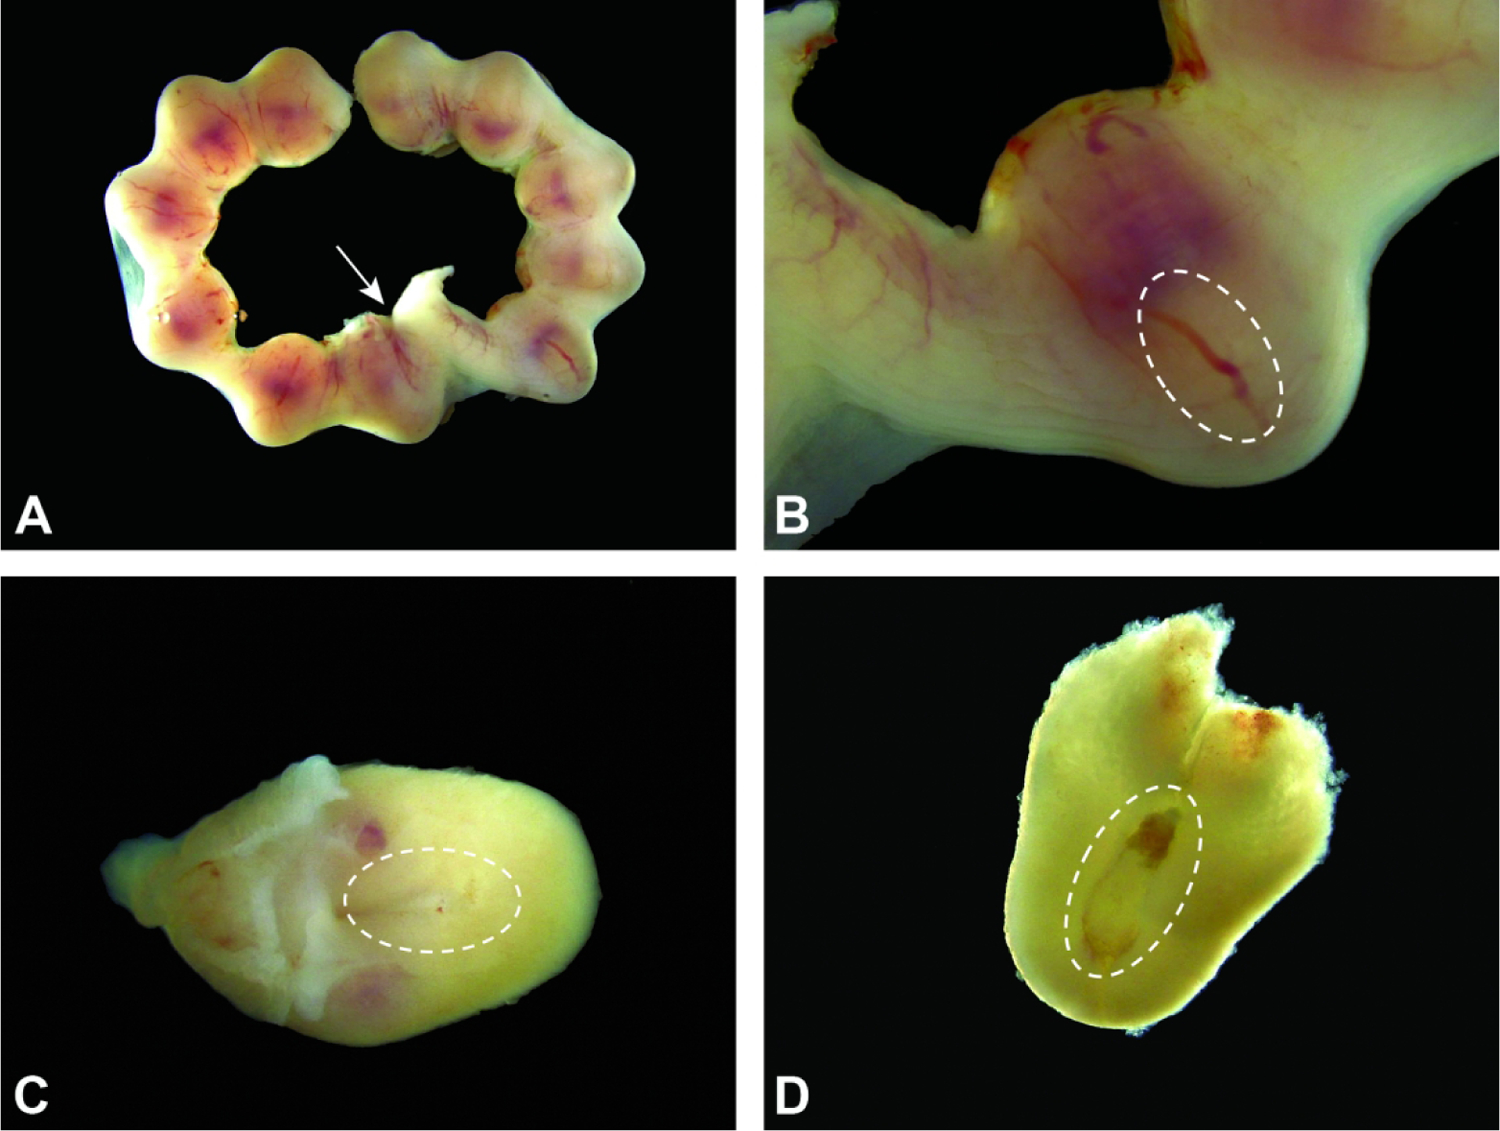
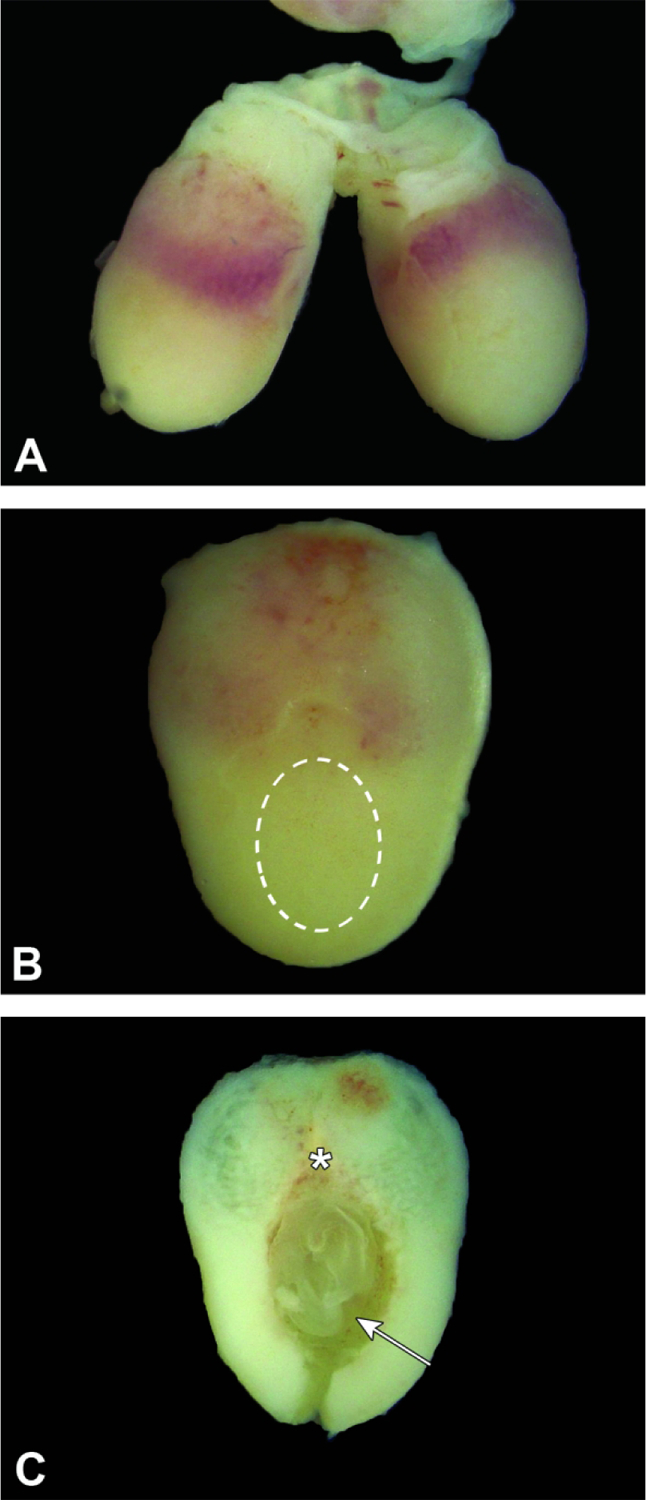
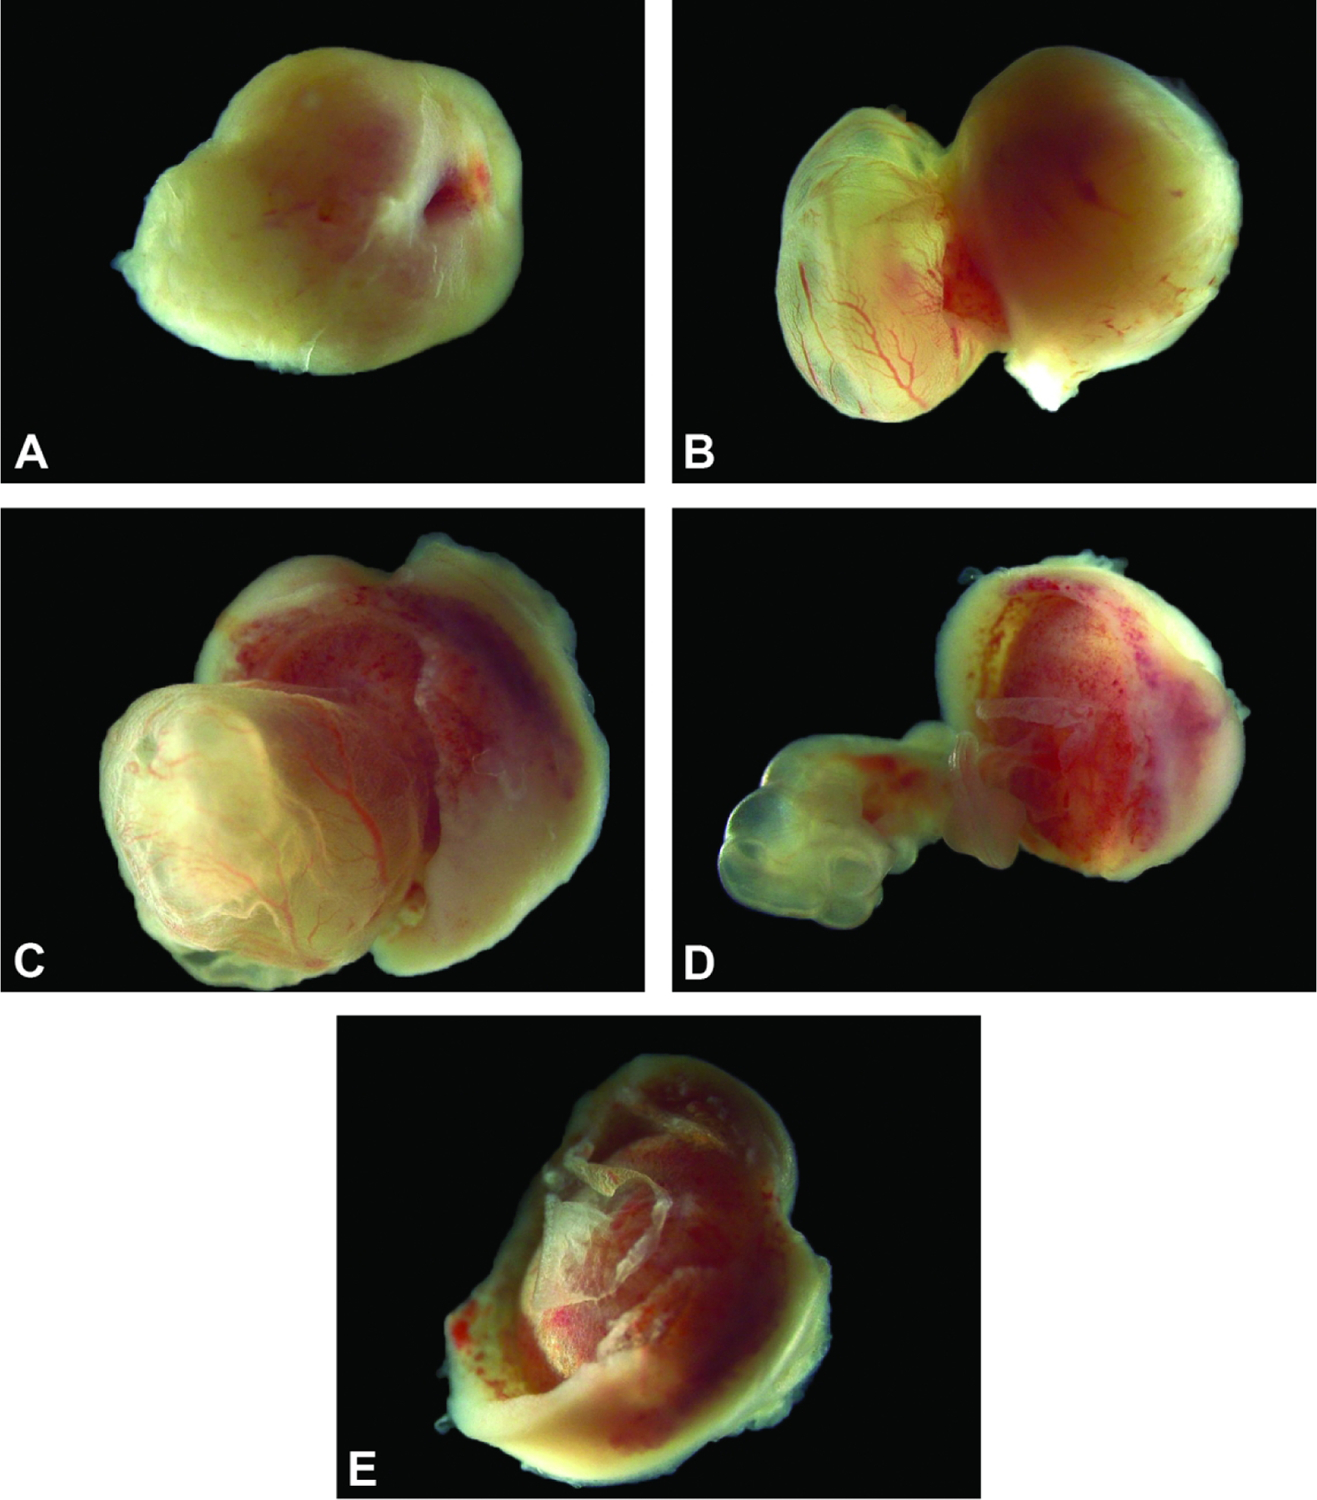
Uterus and conceptuses at E6.5. Figure A: Growth of the conceptuses makes their uterine swellings more distinct over time. The attachment to the cervix (arrow) is at the junction of the two uterine horns. Figure B: The egg cylinder (sited within the dashed oval) is composed of the cells forming the visceral endoderm in the extraembryonic part of the embryo and is located away from the maternal decidua (pale red area located nearest the mesometrial pole). Figure C: Isolated conceptus, with the location of the egg cylinder (dashed oval) shown within the outer maternal decidua. Figure D: Exposed egg cylinder (dashed oval) encased in maternal decidua. The red triangle capping the egg cylinder is the primordium of the embryonic multi-laminar placenta.
Figure 5.
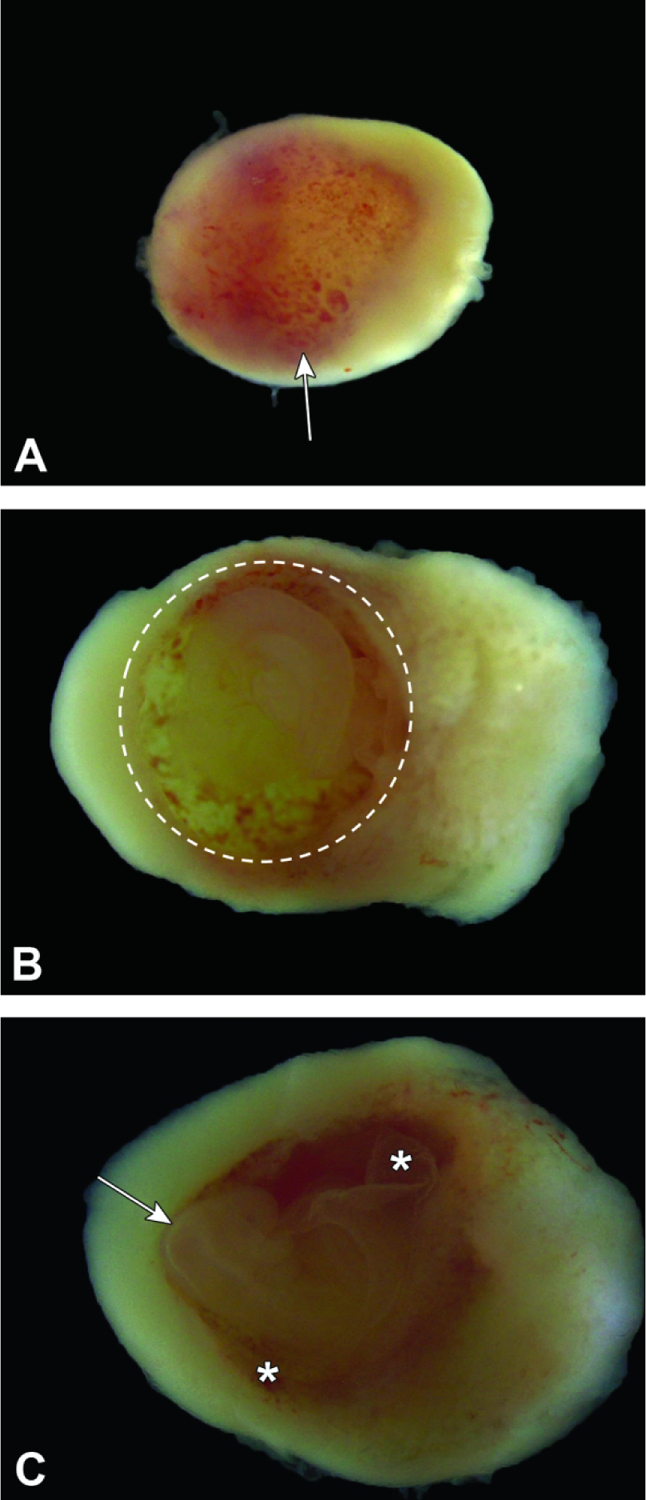
Isolated conceptuses at E7.5. Figure A: The intact conceptus features a slightly wider mesometrial half with central, pale red area (arrow) and a narrower anti-mesometrial half that contains the embryo proper (i.e., egg cylinder [dashed oval]). The outer shell consists entirely of maternal decidua. The egg cylinder is exposed with minimal damage to the placenta by gently teasing the maternal decidua apart, starting at the plane on the mid-longitudinal axis located at the arrow tip. Figure B: The exposed egg cylinder (dashed oval) is aligned with the mid-longitudinal axis, with the initial portion of the embryonic multi-laminar placenta (asterisk) located nearest the mesometrial pole. Figure C: The isolated embryo proper is barely visible through transparent placental membranes (amnion and yolk sac), which envelop it. The nascent embryonic multi-laminar placenta (asterisk) is located at one pole as a red cone.
Figure 6.
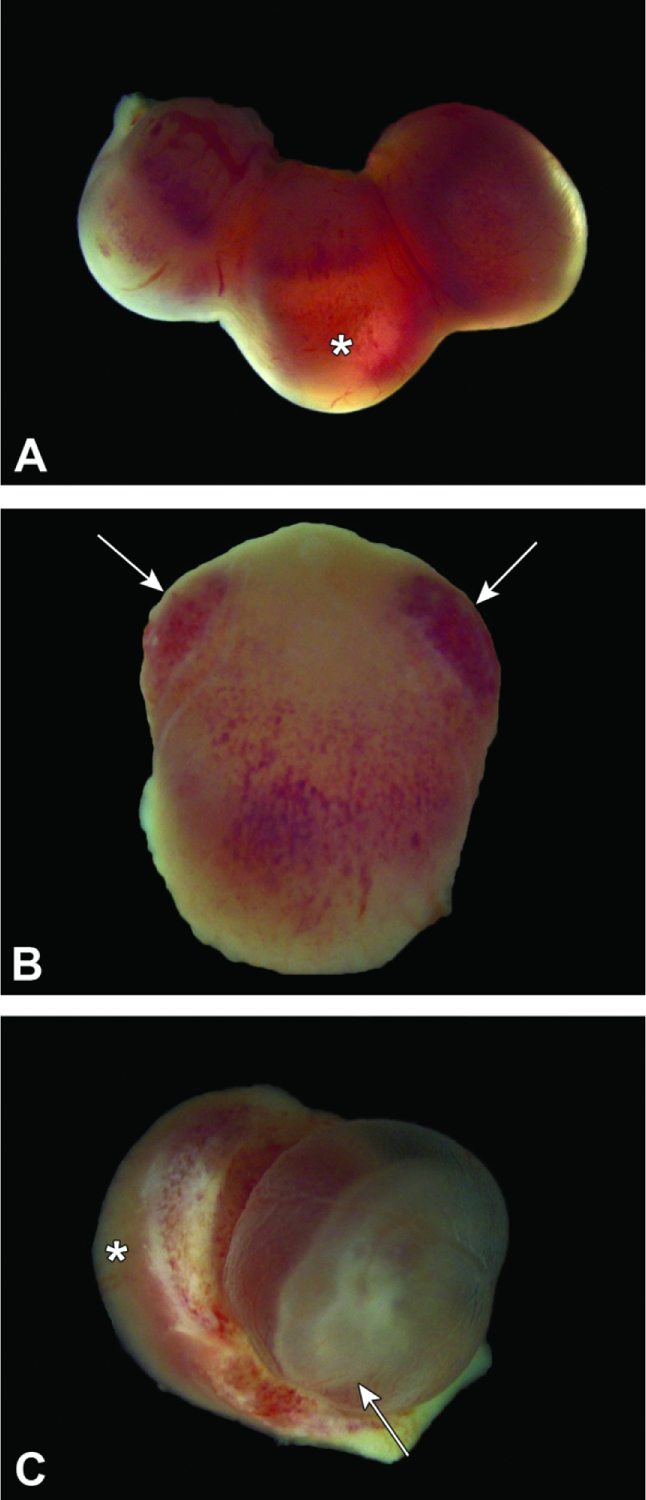
Isolated conceptuses at E8.5. Figure A: The intact conceptuses remain attached to the uterine wall at the mesometrial pole. Figure B: The broad mesometrial half (upper) is pale red due to the amount of blood-rich maternal decidua while the narrow, tan antimesometrial half harbors the embryo (dashed oval). The outer shell consists entirely of maternal decidua. Figure C: The exposed embryo is aligned so that the trilaminar embryonic disc (arrow) sits at the anti-mesometrial pole while the chorionic plate and initial portion of the labyrinthine placenta (asterisk) are located nearest the mesometrial pole.
Figure 7.
Isolated conceptuses at E9.5. Figure A: The maternal decidua at the mesometrial pole has many sinusoids (small, red foci [arrow]) filled with maternal blood. Figure B: The embryo (dashed circle) is nearly spherical due to the fluid turgor within the yolk sac cavity, and the shell of maternal decidua is noticeably thinner at the anti-mesometrial pole. Figure C: The embryo (with the head located at the arrow tip) may be visualized by opening the yolk sac (asterisks).
Figure 8.
Conceptuses at E10.5. Figure A: Three intact conceptuses are shown within the uterine horn. The anti-mesometrial pole (asterisk) may appear variably translucent due to thinning of the maternal decidua and the fluid within the yolk sac. Figure B: The maternal decidua of the intact conceptus contains many blood-filled sinuses, which are concentrated (arrows) near the mesometrial pole. Figure C: The evolving embryonic multi-laminar placenta (asterisk) appears as a hemisphere, while the embryo (with head located at the arrow tip) rests within a fluid-filled yolk sac.
Figure 9.
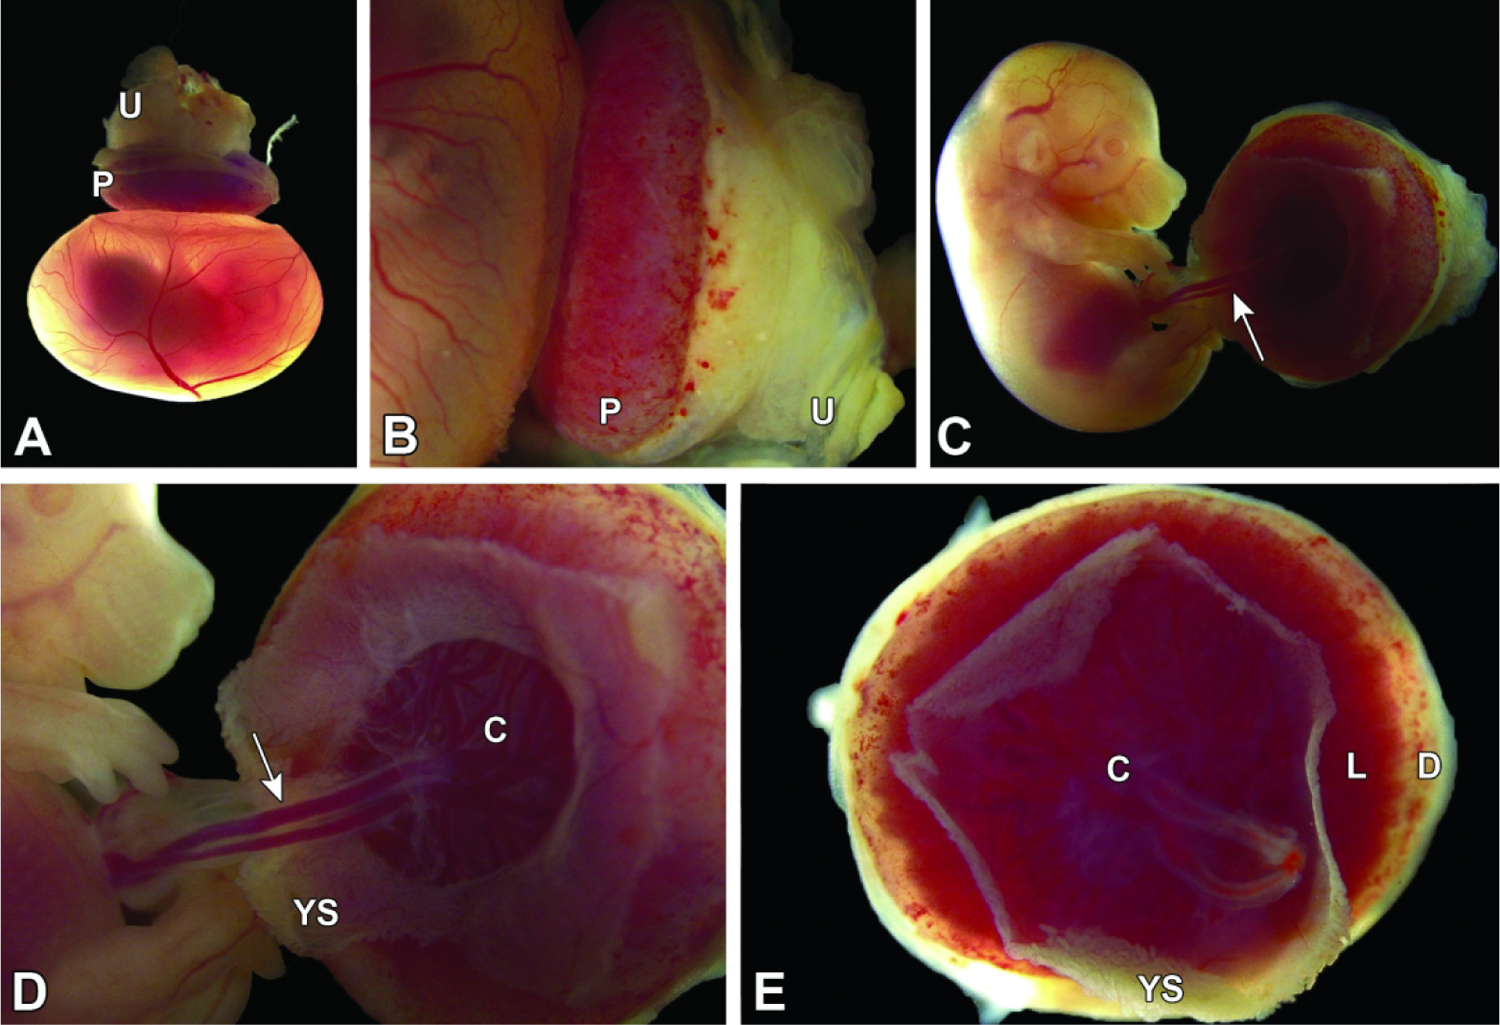
Isolated conceptus at E11.5. The placenta and embryo shown from different perspectives, demonstrating that the growing embryo and nascent definitive placenta are now approximately the same size. Figure A: View of the mesometrial side of the maternal decidua. Figure B: The embryo (inside the yolk sac) on the left, and placenta on the right viewed from the side highlights prominent yolk sac vessels. Figure C: The embryo (inside the yolk sac), and placenta viewed from the antimesometrial side with a view of the chorionic plate. Figure D: The yolk sac has been removed from the embryo exposing the umbilical vessels connecting the embryo and chorionic plate. The vascular nature of the chorionic plate and labyrinth can also be appreciated in this view. Figure E: Separated from the embryo and yolk sac, the isolated placental disc is viewed from the antimesometrial side.
Figure 10.
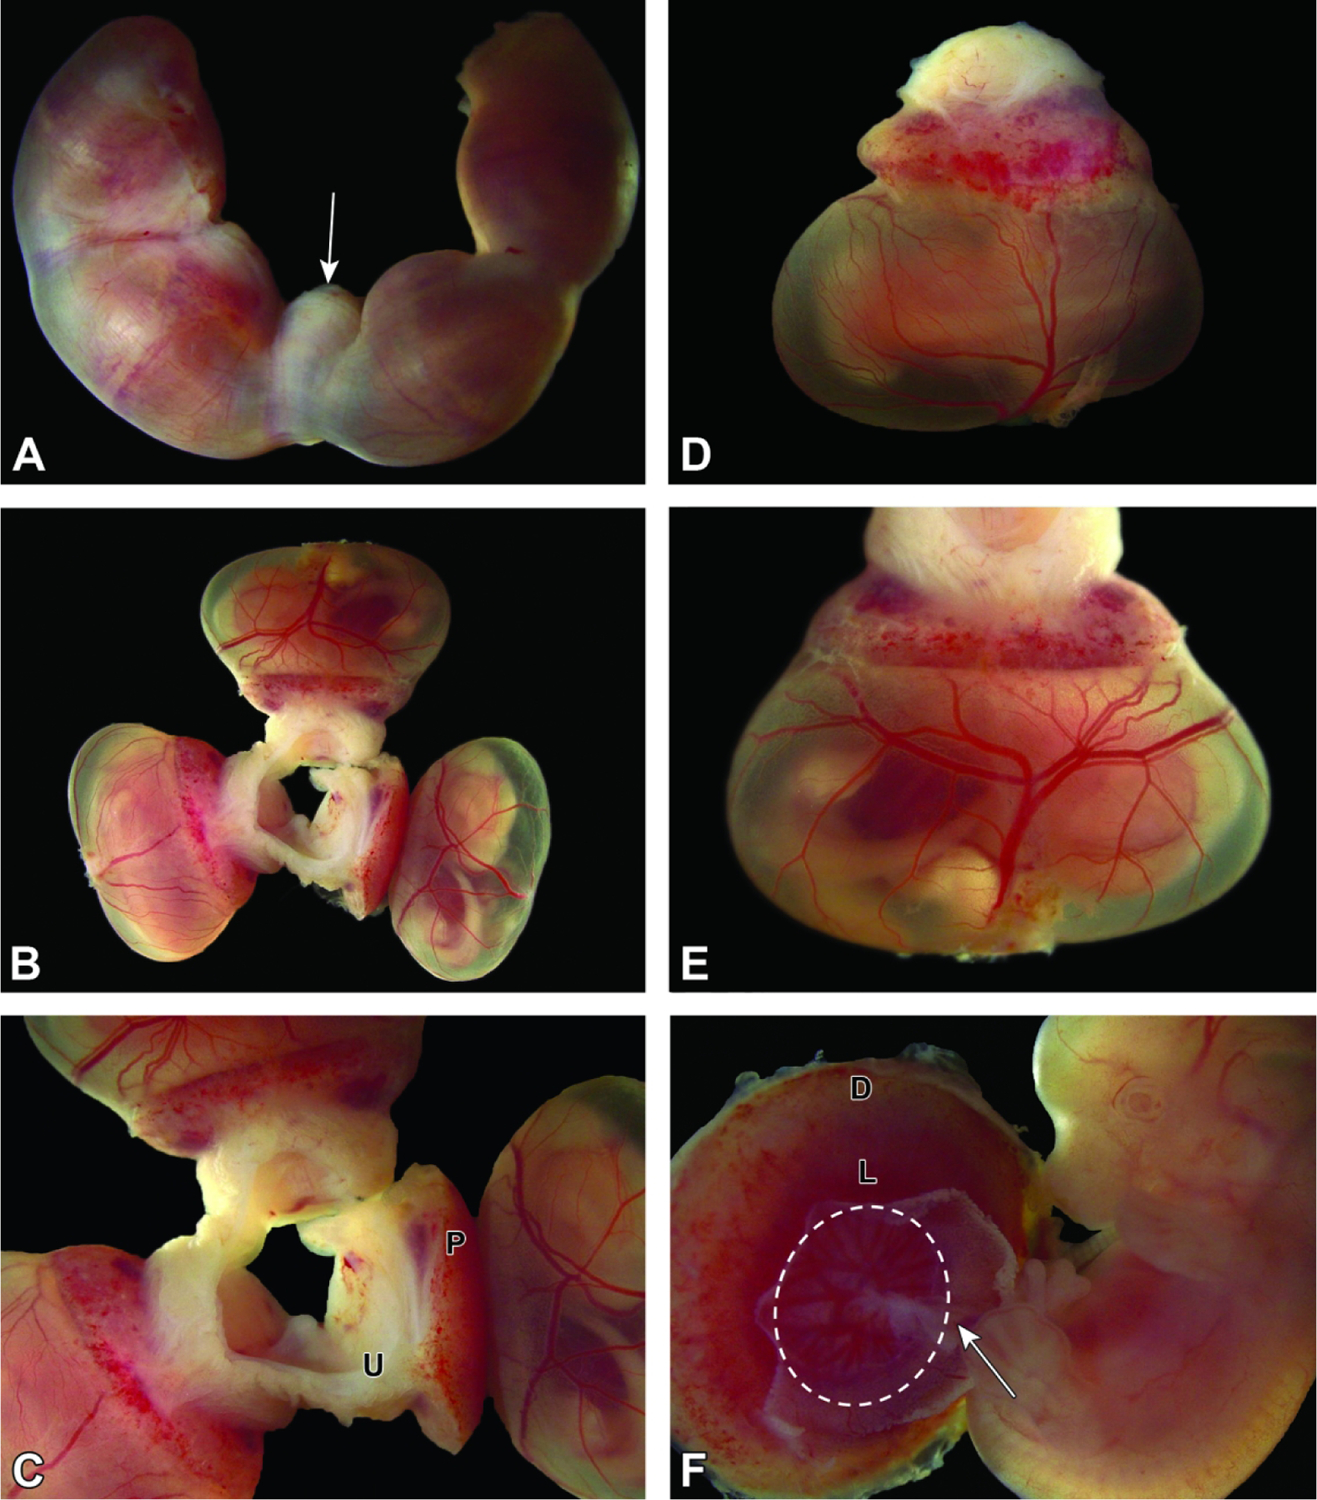
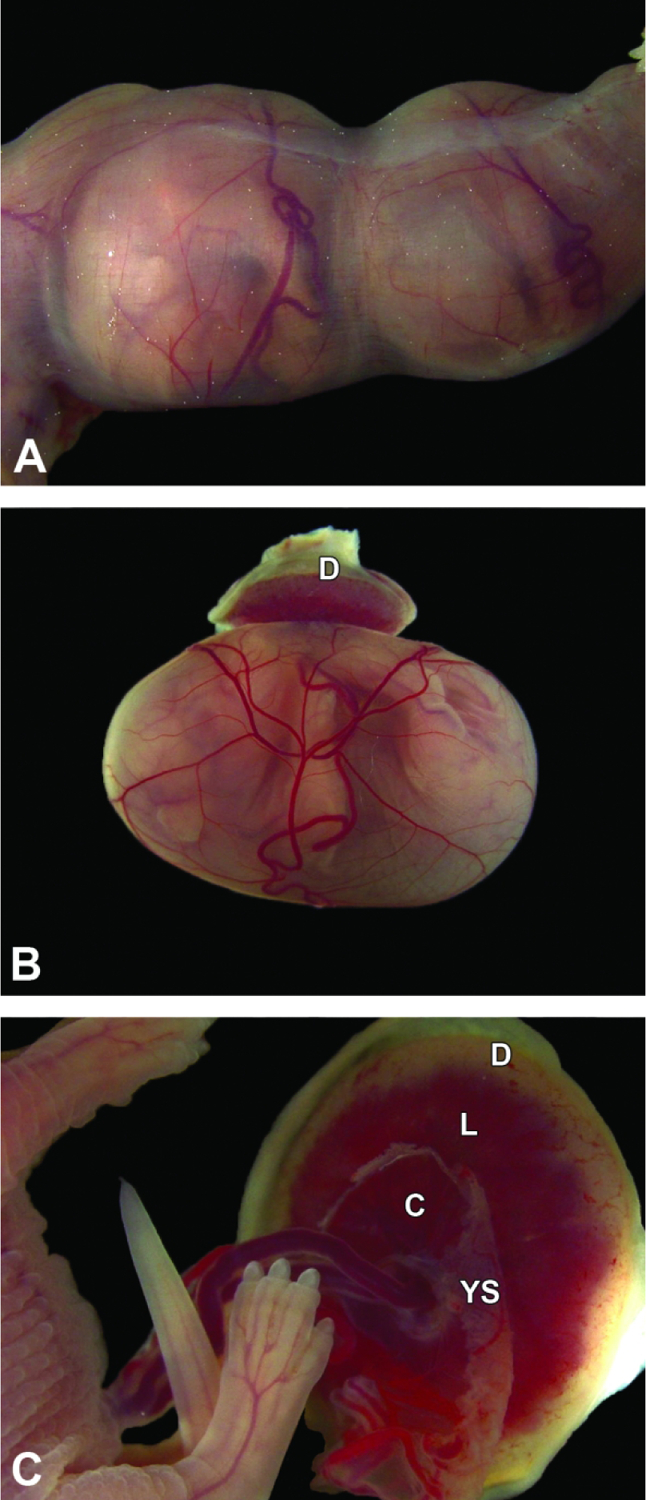
Conceptuses at E12.5. Figure A: In utero, four bulging conceptuses greatly expand the uterine diameter except at the point where the two uterine horns meet at the cervix (arrow). Figure B: Three intact conceptuses still attached to the mesometrial uterine wall. The definitive placenta is smaller than the embryo compared to prior stages. The embryo is surrounded by translucent amniotic and yolk sac membranes. Figure C: The definitive placenta (P; comprised of multiple embryo-derived layers and maternal decidua) is now a hemispherical disc that is still attached to the uterus (U) and can be readily isolated. Figure D: This view is of an isolated conceptus with placenta and metrial gland attached. Figure E: The highly vascularized yolk sac has several large blood vessels with many narrower branches—all filled with embryonic blood. Figure F: The embryo is attached to the chorionic plate (dashed oval) at the base of the pale red labyrinth by the umbilical cord (arrow). Note the location of the labyrinth (L) and maternal decidua (D).
Figure 11.
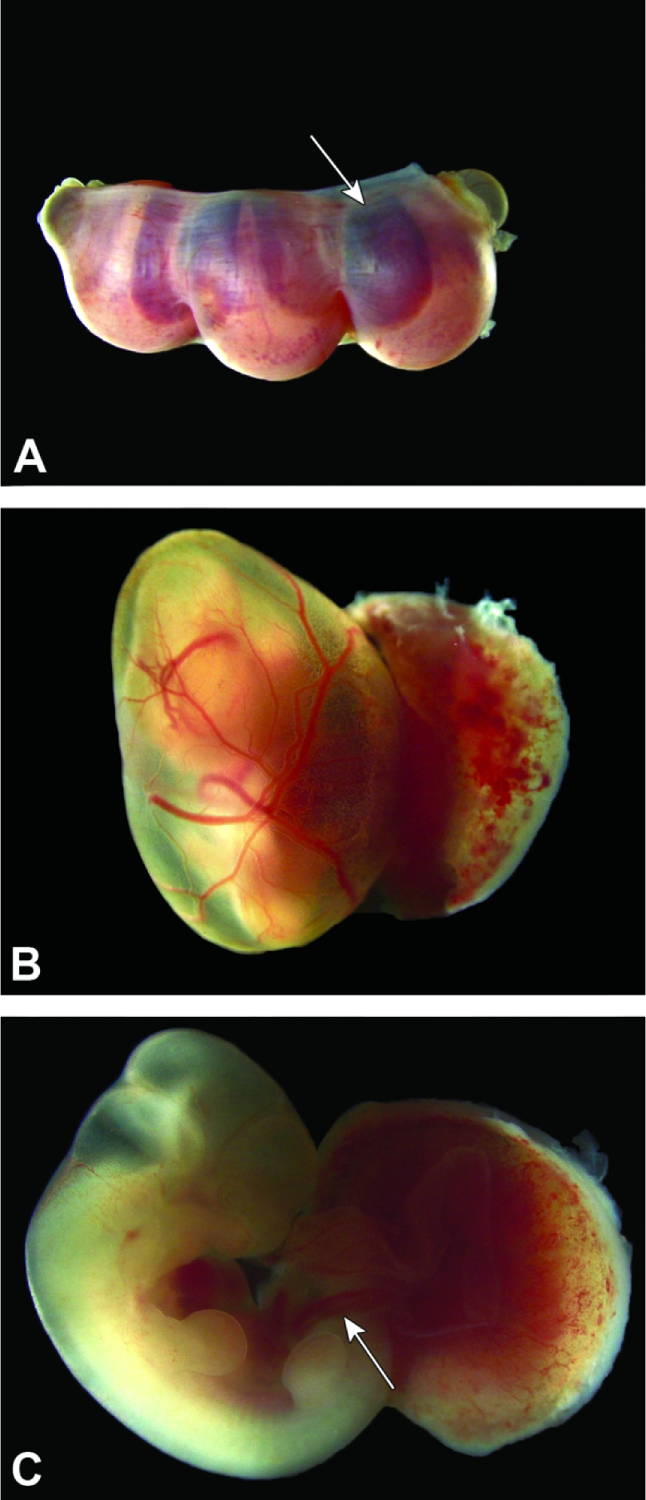
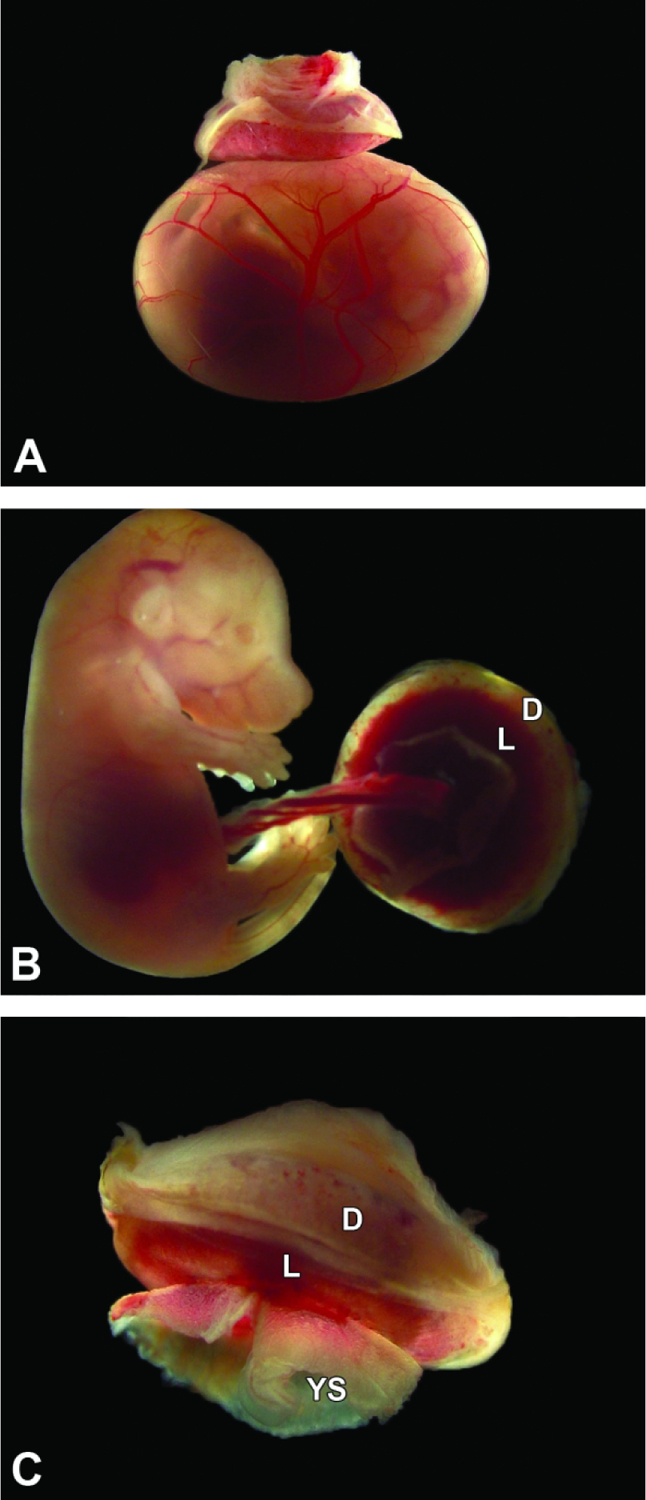
Conceptuses at E13.5. Figure A: Three intact conceptuses are shown within the uterine horn. The definitive placenta (arrow), comprised of multiple embryo-derived layers and maternal decidua, appears as a dark red disc through the thin uterine wall. Figure B: After removal from the uterus, the definitive placenta and highly vascularized yolk sac can be distinguished easily for macroscopic evaluation. Figure C: The umbilical cord (arrow) contains three blood-filled vessels (two arteries and one vein).
Figure 12.
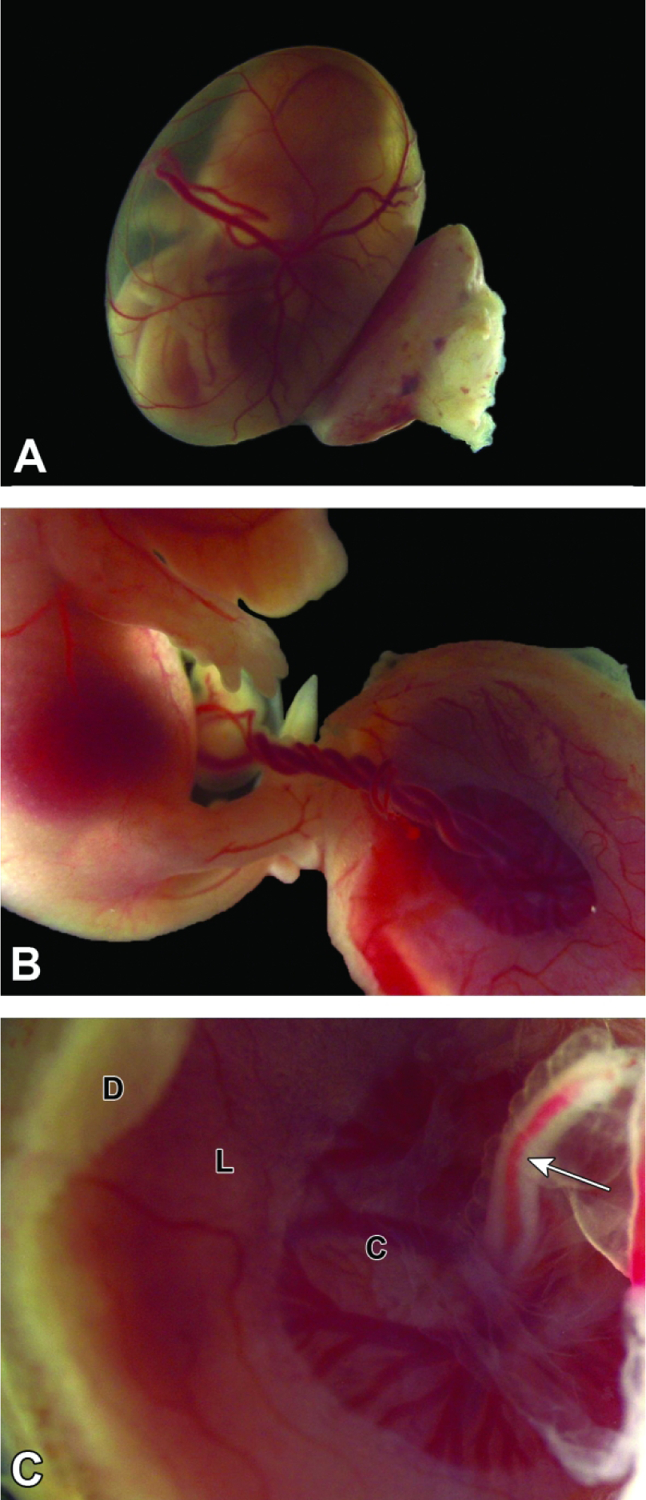
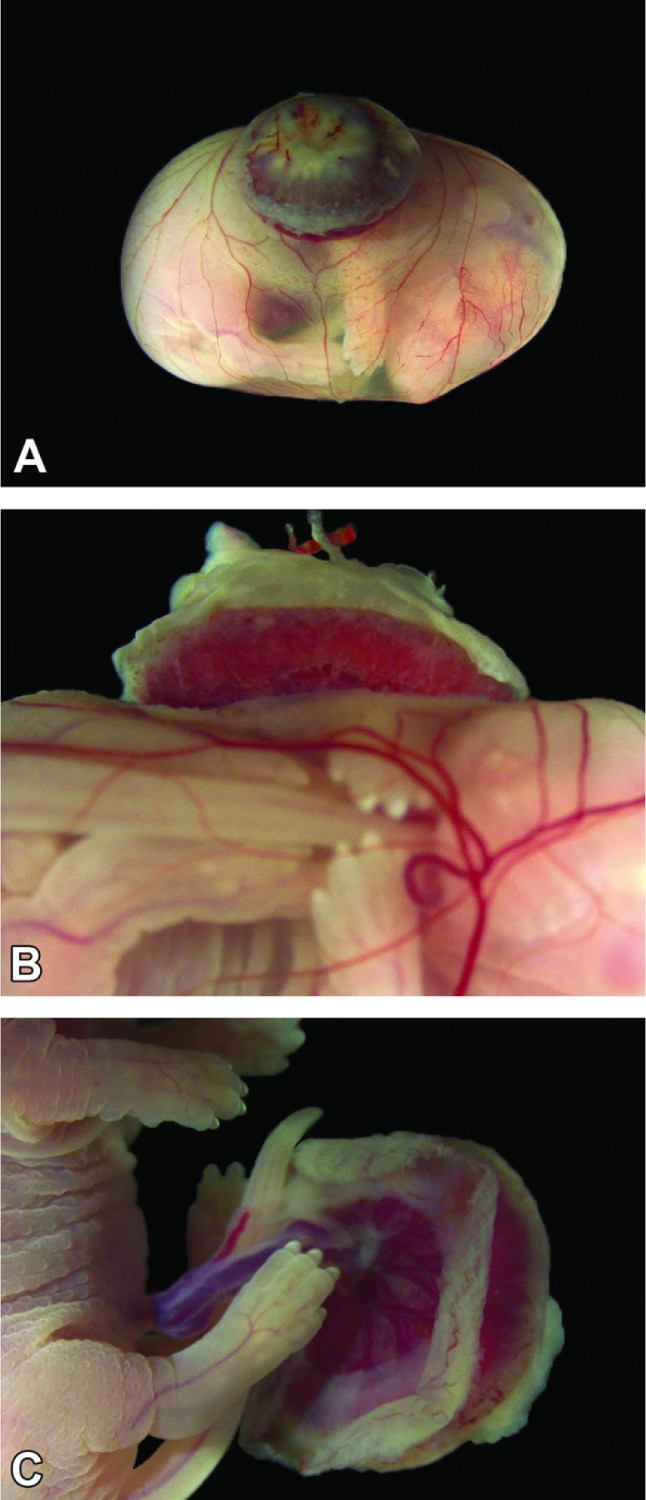
Conceptus at E14.5. Figure A: After removal from the uterus, the definitive (mature) placenta and yolk sac are easily discerned, and the embryo within the yolk sac can be seen to have body contours that are starting to approximate those of neonates. Figure B: The umbilical cord contains prominently entwined blood-filled vessels (two arteries and one vein). Such twisting of the umbilical cord is normal. Figure C: The umbilical cord (arrow) attaches to the chorionic plate (C), a central zone characterized by many radiating, branching vessels filled with embryonic blood. The other zones visible on the base of the definitive placenta are the labyrinth (L) and maternal decidua (D).
Figure 13.
Isolated conceptus at E15.5. Figures A and B: The definitive placenta (P) is attached to the mesometrial uterine wall (U) and intact, highly vascularized yolk sac. Figures C-E: Here most of the yolk sac (YS) has been removed to facilitate visualization. The umbilical cord blood vessels (arrow) are seen attached to the chorionic plate (C) and are parallel rather than entwined (compare to E14.5, Figure 12B), indicating that the umbilical cord has not twisted over time; both straight and twisted conformations are normal. The dimensions of the maternal decidua (D) are greatly attenuated compared to the labyrinth (L) relative to E12.5 (compare to Figure 10F). 181×124mm (300 × 300 DPI)
Figure 14.
Isolated conceptus at E16.5. Figure A: The definitive placenta is relatively small compared to the underlying intact yolk sac, which contains visibly reduced fluid due to the increased size of the embryo. Figures B and C: The umbilical cord blood vessels are twisted. The labyrinth (L) is much more prominent than the maternal decidua (D) when viewed from below, while the shell of maternal decidua obscures the labyrinth size when viewed from above. Note the remnants of the yolk sac (YS) that remain after removal.
Figure 15.
Conceptuses at E17.5. Figure A: The uterus is greatly distended due to the large embryos, and the uterine wall is so thin that it is translucent. Note the blood-filled yolk sac vessels. Figure B: The definitive placenta appears pale due to the paucity of blood in the maternal decidua (D) and is relatively small compared to the underlying intact yolk sac, which is filled with the embryo and contains relatively little fluid. Figure C: The umbilical cord blood vessels, attached to the chorionic plate (C), are fairly straight, and labyrinth (L) dimensions exceed those of the maternal decidua. Note the remnants of the yolk sac (YS) that remain after removal.
Figure 16.
Conceptus at E18.5 (near term). Figure A: The definitive placenta (appearing dark due to blood in the maternal decidua) is very small compared to the underlying intact yolk sac, which is stretched to cover the large embryo. Figure B: From the side, the definitive placenta is dwarfed by the embryo, but the yolk sac vessels remain prominent. Figure C: Yolk sac is removed allowing for a detailed inspection of the embryo and umbilical cord.
Figure 17.
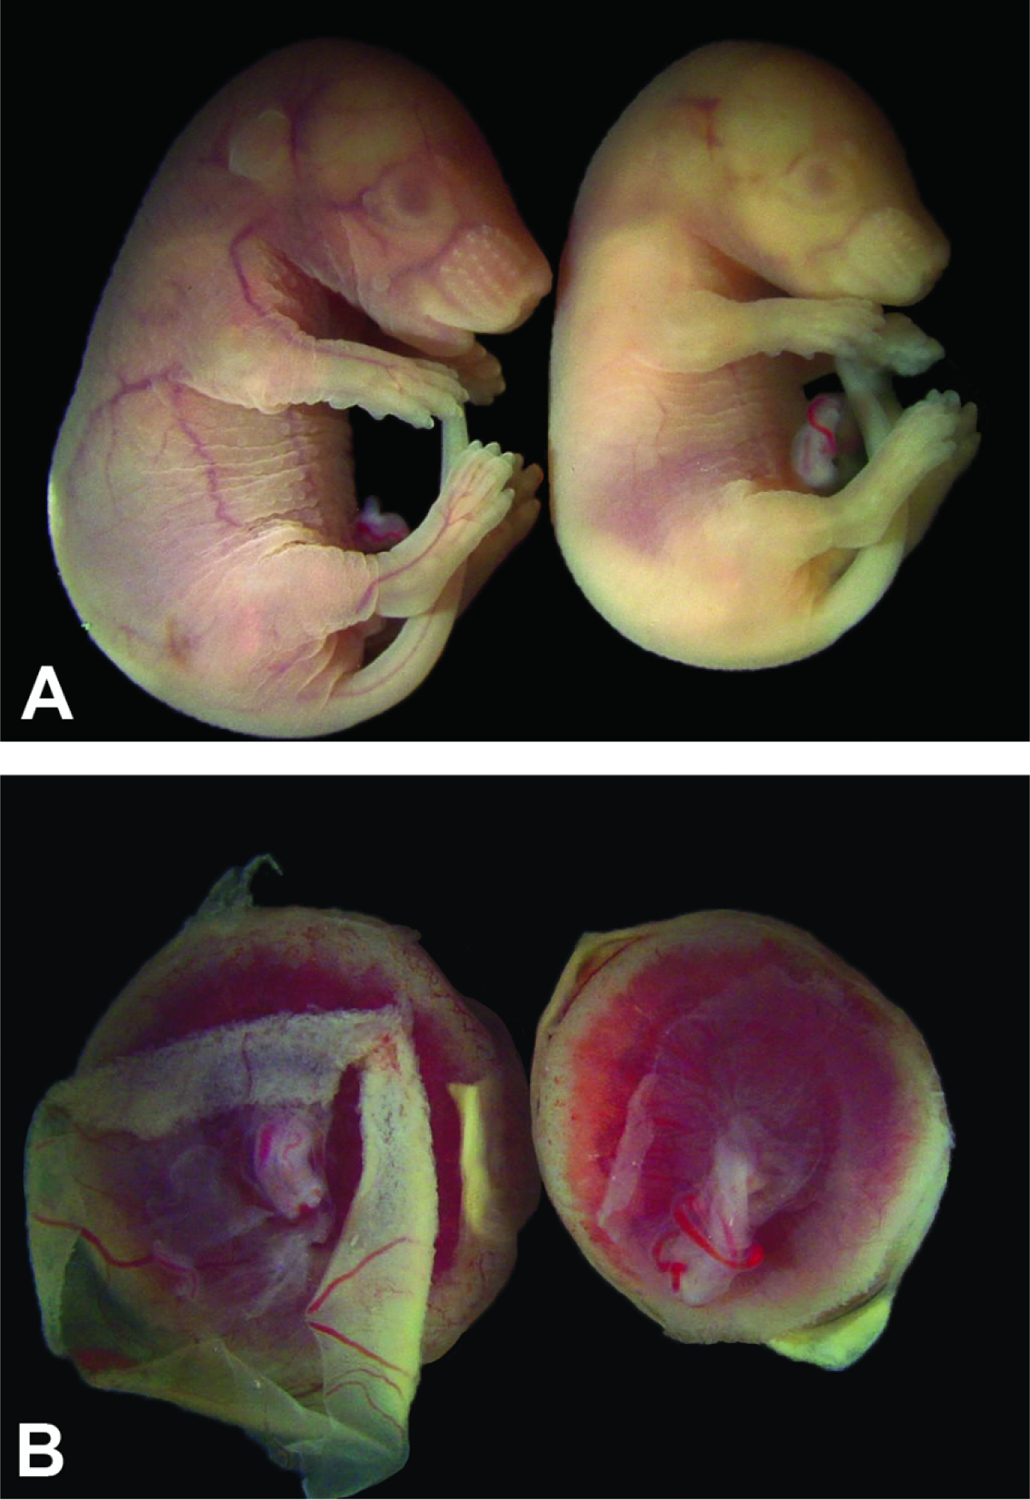
Developmental age does not equate to developmental stage for conceptuses of the same litter. Figure A: One E17.5 control embryo (left) is slightly larger and has demonstrably more folds in the cutaneous tissue than its pale but viable littermate (right). The features of the left embryo are consistent with those at an E17.5 developmental age, while those of the right embryo suggest a developmental age of approximately E16.5. Figure B: The placenta on the left is from the larger, more vascularized embryo in Figure A and is slightly larger than the placenta on the right from the smaller, pale sibling.
Beginning at E5.5, mouse implantation sites begin showing elongation of the ectoplacental cone and the initial formation of the choriovitelline placenta. The choriovitelline placenta consists of the chorion fused to the yolk sac which facilitates blood exchange interactions supporting the embryo until approximately E8.5. Going forward from E5.5, gross images are of increasing importance for assessing normal versus abnormal morphology due to the accelerated development that occurs until birth, around E19.5. During this 14-day period, drastic changes in development are occurring rather quickly, almost on a 24-hour basis in mice, with the bulk of these major changes occurring between E5.5 and E12.5. To underscore the importance of gross images and their use as a tool for pathological assessment, we have created a timeline highlighting gross placental development in 24-hour increments beginning at E5.5 and continuing through E18.5. Experts and non-experts alike can benefit from examining gross images such as these to help with orientation, direction, and positioning when moving to a microscopic level of pathological examination.
Stages of Normal Placental Anatomy and Development
E0 – E4.0 – Early Events in Embryogenesis Needed for Effective Placentation
For mouse development, the time of conception for overnight matings is often regarded as E0 and given the timestamp of midnight (Table 1).26 The following morning (regarded as E0.5), the copulation plug can be detected in the dam’s vagina, and the zygote (one-celled embryo) has formed after fertilization.26,27 The embryo remains in the oviduct lumen where it will continue to divide, transitioning over several days from a single-celled zygote to multicellular embryo while continuing its progress down the oviduct.27 By E2.5, the embryo exists as a morula, a solid mass of up to 32 totipotent embryonic stem (ES) cells that have equal potential to differentiate into any and all future embryonic or placental (i.e., extra-embryonic) tissues.27,28 Approaching E3.0, the morula, now comprised of approximately 64 cells, has reached the entrance to the uterus.27,28 Upon entering the uterine lumen, the morula begins to cavitate, transitioning from a solid mass of cells into a hollow ball termed a blastocyst.27 The formation of the blastocoel (i.e., the central cavity) results in the formation of two distinct cell lineages, the inner cell mass (ICM) and the trophectoderm, that define the initial polarity of the embryonic body axis.27 The ICM continues to accumulate cells via replication, building a crescent-shaped plate inside the blastocoel cavity at one margin (termed the “animal pole”); this thickened cell plate eventually will become the embryo proper.27 The thin trophectoderm away from the ICM (termed the “vegetal pole”) forms the remaining blastocyst wall and thus becomes the first extra-embryonic membrane. This accumulation of cells coupled with increasing fluid within the blastocoel leads to increasing pressure within the expanding cavity that results in hatching of the blastocyst from the zona pellicuda (a thick glycoprotein membrane covering the outer surface of the embryo).27–29 This “zona hatching” process occurs at approximately E4.0 in conjunction with the release of proteolytic enzymes by the maternal endometrium, which serves as a necessary precondition for embryonic implantation.29 In addition, by E4.0 the uterine lining has been prepared for implantation via cyclic fluctuations of blood-borne (i.e., maternal) progesterone and estrogen concentrations.27,30
Table 1.
Key Developmental Events in Placental Formation
| Gestational Time | Important Processes and Key Structures | Figure |
|---|---|---|
| E3.5 – 5.0 | Processes: Implantation and Initial Placenta Formation Key Structures: Blastocoel, Inner Cell Mass (ICM), Mural Trophoblast (TM), Polar Trophoblast (TP) • Blastocoel cavity forms by E3.0 – distinction of the ICM from the trophoblast • Polar trophoblast (TP) cells have migrated to surround (cover) the ICM • Mural trophoblast (TM) cells have migrated to bound the blastocoel, giving rise to the trophoblast giant (TG) cells • Decidualization of the anti-mesometrial endometrial tissue commences • Egg cylinder becomes positioned next to the anti-mesometrial side of the uterus |
1, 2 |
| E5.0 – 6.0 | Processes: Endometrial Decidualization and Formation of the Ectoplacental Cone (EpC) Key Structures: Egg Cylinder, Ectoplacental Cone (EpC), Metrial Triangle (MT) • Egg Cylinder forms by E5.0 via increased cellular replication by the mural trophoblast ○ TP cells differentiate to form the embryonic ectoderm (EE) ○ ICM orients toward the mesometrial uterine wall (entry point for maternal blood vessels) • The EpC forms by E5.5 as a result of proliferation in the egg cylinder ○ Primary trophoblast giant (TG) cells differentiate from the EpC ○ Parietal trophoblast giant (TGp) cells further differentiate from the primary giant cells • Metrial Triangle (MT) forms by E6.0 ○ Uterine natural killer (uNK) cells collect in the uterus to aid in decidualization, placental angiogenesis, and regulation of maternal immune responses against paternal antigens |
2, 3, 18 |
| E6.0 – 7.5 | Processes: Formation of the Yolk Sac (YS), Delineation of the Amnion from the Exocoelomic Cavity (ExC), and Initiation of Histiotrophic Nutrition Key Structures: Yolk Sac Cavity (YSC), Amniotic Cavity (AC), and the Exocoelomic Cavity (ExC) • Parietal endoderm and visceral endoderm (outer and inner walls of the YS) have moved to line the blastocoel cavity by E6.0; the space between them is the YSC • The Reichert’s membrane (RM) covers the outer surface of the parietal endoderm by E6.0, separating it from the adjacent mural trophoblast • The proamniotic cavity (PC) forms near E6.0 • The amniochorionic fold (AF) occurs by E7.0 and delineates the PC from the ExC while also establishing the chorion • The PC is sealed, and the amnion (AM) is formed by E7.5 • Choriovitelline (YS-based) placentation supplies embryo by histiotrophic means (phagocytosis and digestion of nutrient-laden maternal cells and secretions) |
4, 5, 19, 20 |
| E7.0 – 8.5 | Processes: Initiation of the Allantoic Bud, Yolk Sac (YS) Hematopoiesis, and Chorioallantoic Fusion Key Structures: Allantoic Bud, Allantois (AL), Chorionic Plate (C), Yolk Sac (YS) • The allantoic bud is initiated and begins to elongate by E7.5 • Clusters of hematopoietic stem cells (“blood islands”) form de novo in the YS • The extending AL becomes completely surrounded by flattened mesothelium near E8.5 • Endothelial tissue differentiates internally in the AL at multiple sites (prior to formation of continuous vascular channels) by E8.5 • The AL contacts the flattened C by E8.5 • Chorioallantoic attachment and fusion, which establishes the umbilical cord, occurs by E8.5 |
6, 21 |
| E8.5 – 9.5 | Processes: Labyrinth (L) Induction and Junctional Zone (JZ) Formation Key Structures: Labyrinth (L), Junctional Zone (JZ), Decidua (D) • Labyrinth is induced to form following chorioallantoic fusion at E8.5 ○ The differentiation of sinusoidal trophoblast giant (TGs) cells, syncytiotrophoblasts I (Sy-I), and syncytiotrophoblasts II (Sy-II) is initiated by E8.5 ○ Primary labyrinth tissues are formed by E9.0 ○ Maternal blood enters the labyrinth by E9.5 • The JZ is formed by E9.5 ○ The differentiation of spongiotrophoblast (ST) cells and glycogen cells (GC) cells in the JZ occurs by E9.5 |
7, 22, 23, 32 |
| E10.0-E12.0 | Processes: Definitive Placenta Launches, Transition to Hemotrophic Nutrition Key Structures: Labyrinth (L), Junctional Zone (JZ), Decidua (D), Chorionic Plate (C) • Transition from choriovitelline (yolk sac-based) placenta to chorioallantoic (labyrinth-based) placenta begins to take affect at E10.0 • Conversion from histiotrophic (yolk sac-based, phagocytosis-enabled) to hemotrophic (labyrinth-based, vascular-enabled) nutrition, where nutrient transfer occurs by countercurrent exchange from maternal sinusoids to embryonic blood vessels • Red blood cells (RBCs) in the labyrinth begin to include both nucleated (“primitive”) and nonnucleated (“definitive”) forms • Spiral arteries (SA) in the uterine wall become lined by TG cells |
8, 9, 25, 26, 36, 43 |
| E12.5-E13.5 | Processes: Definitive Placenta Becomes Fully Functioning Key Structures: Labyrinth (L), Junctional Zone (JZ), Decidua (D), Chorionic Plate (C) • Uterine natural killer (uNK) cell numbers plateau in the decidua by E12.5 • The ST cells of the JZ move from a mass to a more sheet-like configuration by E12.5 |
10, 11, 24, 27, 28, 32, 36 |
| E14.5 | Processes: Definitive Placenta Maximizes Maternal/Embryonic Blood Exchange Key Structures: Labyrinth (L), Junctional Zone (JZ), Decidua (D), Chorionic Plate (C) • The labyrinth contains solely non-nucleated RBCs of maternal and embryonic origin by E14.5 • The labyrinth has peaked in size and comprises approximately half the total placental weight |
12, 29, 36 |
| E15.5-E17.5 | Processes: Degradation of Decidual Tissue Key Structures: Labyrinth (L), Junctional Zone (JZ), Decidua (D), Chorionic Plate (C) • Numbers of uNK cells begin to decline in the decidua • Decidual tissue begins to deteriorate in preparation for birth |
13, 14, 15, 17, 30, 31, 32, 33, 34, 36, 42, 44, 45 |
| E18.5 | Processes: Preparation for Birth Key Structures: Labyrinth (L), Junctional Zone (JZ), Decidua (D), Chorionic Plate (C) • The quantity of GC in the JZ have increased 250-fold by E18.5 from the time of their differentiation around E9.5 |
16, 33, 35, 37, 38, 39, 40, 41, 46 |
If not listed in table, structure not yet formed at this timepoint
E4.5 – E5.0 – Implantation and Initial Placenta Formation
During the peri-implantation period (around E4.5), the ICM has developed into distinct cell layers, separating into trophectoderm (outer), epiblast (middle), and primitive endoderm (inner) strata.27 The trophectoderm associated with the ICM is continuous with the trophectoderm that forms the wall of the blastocoel.29,31,32 At this stage, the epiblast (which will contribute to the ectodermal and mesodermal components of the embryo proper) becomes distinct from the hypoblast, which will develop into the future extraembryonic endoderm that will be necessary for development of the yolk sac.27,33 Simultaneously, the trophectoderm further differentiates such that the trophectoderm surrounding the ICM becomes the polar trophoblast while that which surrounds the blastocoel becomes the mural trophoblast.29,34 The mural trophoblast gives rise to trophoblast giant cells at various times during placental development, beginning at E5.0-E5.5.35 The trophoblast giant cells serve as a nonproliferating layer that separates the embryo-derived extra-embryonic membranes from the maternal-derived decidua—which together form the elements that will differentiate into the placenta.27 These trophoblast giant cells form through a process of endoreduplication (also termed endoreplication), duplicating their DNA without undergoing cell division.35–37 As a result, mouse trophoblast giant cells exhibit polyploidy, containing many copies of embryonic DNA.35 As the hatched blastocyst becomes embedded in the anti-mesometrial uterine wall and the mural trophoblast abuts the maternal endometrium, the initial implantation site still remains visually indistinguishable from the surrounding endometrial lining of the uterus.26,38 The anti-mesometrial side of the uterus is the site responsible for implantation and is opposite the mesometrial side, which consists of the broad ligament of the uterus (a connective tissue attachment that holds the uterine blood supply) and is the portion of the uterine wall where placental formation occurs.
Once in contact with the uterine endometrium, the trophoblast giant cells of the mural trophectoderm will further differentiate into primary giant cells that are responsible for regulating decidualization, the process by which maternal endometrium is progressively remodeled into the specialized tissue (termed decidua) that is needed to support the conceptus.29,39 As implantation proceeds, uterine remodeling begins via the active invasion and phagocytic activity of the primary giant cells as they invade the uterine wall.30,40 The stromal cells comprising the endometrium differentiate under the influence of elevated circulating progesterone levels to become large, polygonal decidual cells.5,30 Only stromal cells at implantation sites undergo decidualization;30 intervening areas of the uterine wall between implantation sites retain their usual pre-pregnancy structure.30 Once decidualization is underway, trophoblast giant cells that contain many microvilli become interlocked with the maternal decidual cells of the anti-mesometrial wall, helping to initiate the encirclement of the embryo by uterine tissue.5,30 This interlocking connection is later lost as the trophoblast giant cell microvilli recede, thus allowing the trophoblast giant cells and decidual cells to become separated by channels (termed maternal blood spaces [MBS]) in which maternal blood will circulate.30
As the ICM continues to differentiate, the primitive endoderm of the ICM migrates to line the inner surface of the mural trophoblast.29 Immediately after making contact with the endometrium, the ICM has no distinct orientation.27 Cell-cell communication between the endometrium and polar trophoblast result in the ICM positioning itself such that it is as close as possible to the mesometrial wall of the uterus (i.e., the entrepot for nutrient- and oxygen-rich maternal blood).27 Once situated near the mesometrial wall, the polar trophoblast begins to proliferate, forming cell aggregates that will become the extraembryonic ectoderm (EE) and the ectoplacental cone.27,41 At this point in the immediate post-implantation process, the trophectoderm and its differentiated cell lineages make up the majority of the conceptus, comprising nearly 70%−80% of the cells.27
E5.0 – E6.0 – Egg Cylinder, Ectoplacental Cone, and the Metrial Gland
By E5.0, the cells of the mural trophoblast are continuing to divide, resulting in elongation of the blastocyst.27,40 This unidirectional expansion away from the mesometrial side of the implantation site leads to formation of the elongated egg cylinder (Figure 18).27 The polar trophoblast cells surrounding the ICM, now positioned near the mesometrial wall of the uterus, have continued to differentiate and form the extraembryonic ectoderm, which impinges on the epiblast and the primitive endoderm of the ICM.40 This proliferation and subsequent pressure causes formation of the ectoplacental cone and contributes to formation of the egg cylinder.40,42 At this time, the primitive endoderm of the ICM has begun to separate into visceral and parietal endoderm that will come to line the interior of the egg cylinder wall.28,29
Figure 18.
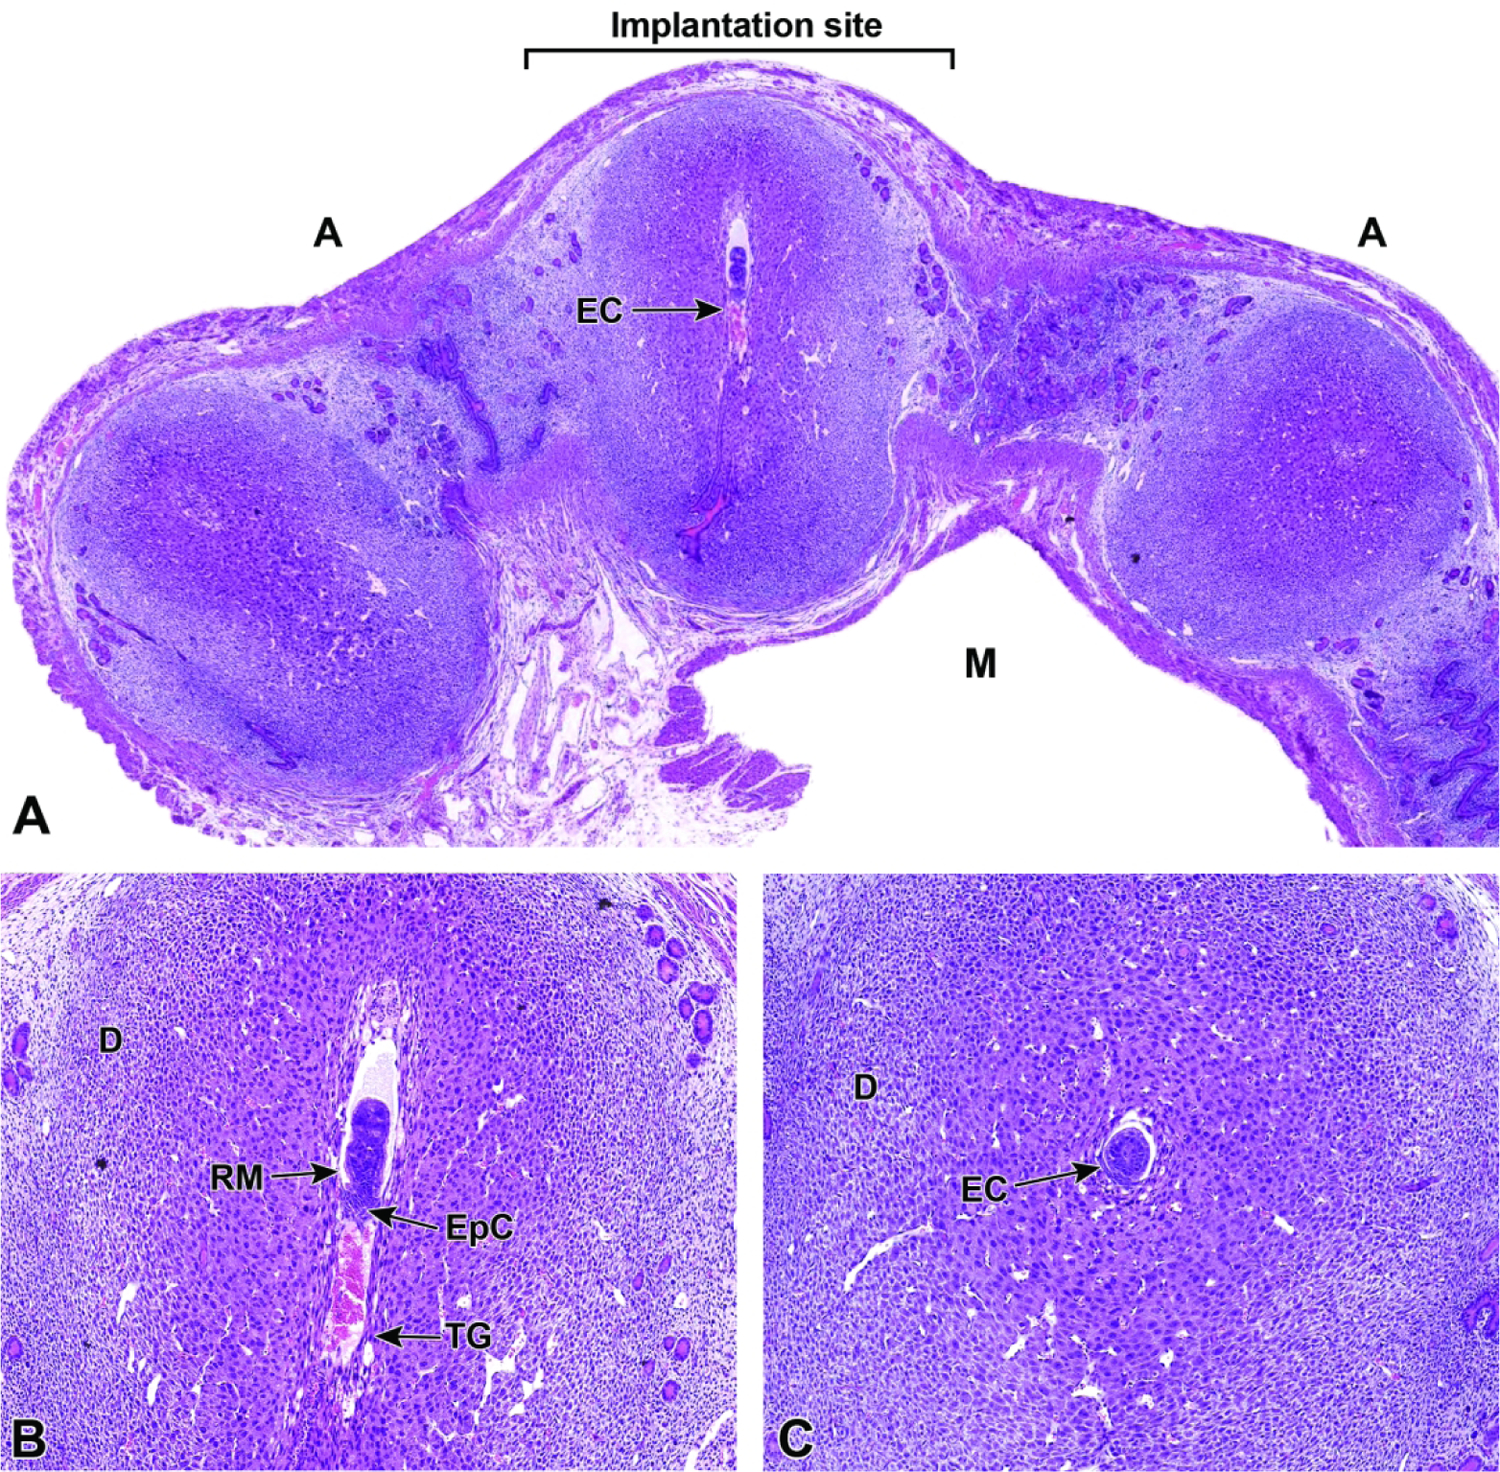
Representative images of a uterine horn and three implantation sites at E5.5. Figure A: Each implantation site should be sampled individually during early gestation to find the desired view of the egg cylinder (EC). Note the orientation of the mesometrial (M) and antimesometrial (A) poles relative to the developing egg cylinder. In mice, implantation always occurs towards the antimesometrial side of the uterus, while the placenta develops at the mesometrial side. Figure B: Ideal longitudinal orientation for viewing the entire egg cylinder stage embryo with the developing ectoplacental cone (EpC). Reichert’s membrane (RM), a thick multilayered basement membrane between the parietal endoderm cells, and trophoblast giant (TG) cells that help the embryo penetrate the uterine epithelium and implant into the endometrium, can be seen at this stage. Note the surrounding maternal decidua (D). Figure C: Cross section of the egg cylinder with no view of the developing embryonic placental tissues.
The ectoplacental cone appears as a triangular cap of cells that extends into the mesometrial decidua.27,42 The ectoplacental cone will later give rise to other important layers of the definitive placenta, such as the labyrinth and several other differentiated trophoblast giant cell types.29,42 The primary giant cells proliferating from the mural trophoblast to form the ectoplacental cone maintain a high level of cellular replication and retain the cytoarchitectural features typical of undifferentiated stem cells.34,40,43 These characteristics include sizable nuclei as well as the accumulation of free ribosomes on the Golgi apparatus and endoplasmic reticulum.40 Secondary trophoblast cells that arise from further differentiation of the primary giant cells after implantation has occurred continue to retain these same cell characteristics as well.34,43 Extending from the outer region of the ectoplacental cone, secondary trophoblast cells termed parietal giant cells come to surround the entire ectoplacental cone and eventually the entire embryo. These secondary trophoblast cells serve to take up nutrients from maternal tissue, including by phagocytosis of detached decidual cells (a process known as histiotrophic nutrition).30,40 The parietal giant cells maintain close connections with the decidua and are responsible for much of the uterine remodeling done in preparation for the formation of the junctional zone, which involves reconfiguring the maternal vascularization.40,43 Around E6.0, some decidual cells on the mesometrial side of the uterus undergo apoptosis to increase the channel volume of the maternal blood spaces.27,30 At this time, the maternal blood spaces in the vicinity of the ectoplacental cone begin to accumulate maternal anucleated red blood cells (aRBCs).27
Moving outward, these secondary trophoblast cells become larger and further spaced from one another, with more randomized shapes due to their multiple cytoplasmic connections with neighboring cells.40 They form the basis of the separating layer that will ultimately become the junctional zone and contribute to the development of the villous blood spaces.40 Because these trophoblast giant cells exhibit some phagocytic characteristics, after the proliferation and migration of secondary trophoblast cells, both leukocytes as well as erythrocytes may be seen among their intracellular spaces.5,40
Beginning at E5.5, the uterine wall is undergoing the substantial modifications necessary to facilitate initial placenta formation.22,44 These modifications include the collection of specialized innate immune cells, variously designated uterine natural killer (uNK) cells or granulated metrial gland (GMG) cells44, along the triangular area of ectoplacental cone invasion.32,44 These specialized maternal-origin lymphocytes of the NK cell lineage45 serve to aid decidualization, mediate the process of implantation (especially angiogenesis46), and down-regulate maternal immune reactions to the foreign (paternal) antigens inherent in the conceptus.27,44,47,48 The uNK cells of rodents express NK lymphocyte markers (e.g., granzyme, perforin22,45) and some macrophage markers (e.g., F4/8049,50). Collectively, the uNK cells as well as trophoblast giant cells and blood vessels cluster near the mesometrial uterine wall in the the metrial gland.
Early during decidualization, the uNK cells increase in number across the entire decidua. Subsequently, all uNK cells outside the triangular invasion area of the ectoplacental cone undergo degradation, thus focusing metrial gland formation in the center of the maternal tissue.44 Although uNK cells begin to differentiate around the time of implantation, they continue to develop throughout gestation and go through several changes in appearance until their degradation.44 They are commonly observed to produce many cytoplasmic projections, which is suggestive of substantial migratory capabilities.44 uNK cells contain many circular, dark pink cytoplasmic granules in H&E-stained sections.44 Up until E14.5, these granules continue to increase in both quantity and size.44
E6.0 – E7.5 – Yolk Sac Cavity, Reichert’s Membrane, and Amniotic Cavity
At E6.0, the primitive choriovitelline placenta is the main source of embryonic nutrition and regulator of maternal blood flow for the embryo.30 At this time, pre-streak gastrulation begins to establish the initial body plan for the embryo; the choriovitelline placenta, which forms via invasion of the maternal decidua by trophoblast cells, supports this embryonic transformation through generation of the first functional placental membrane—the yolk sac—as well as a constellation of trophoblast giant cells, vitelline vessels (which connect the yolk sac to the embryonic heart), and maternal blood vessels (Figure 19).30 All of these parts work in conjunction with one another to support the embryo while awaiting completion of the structures of the definitive placenta.30
Figure 19.
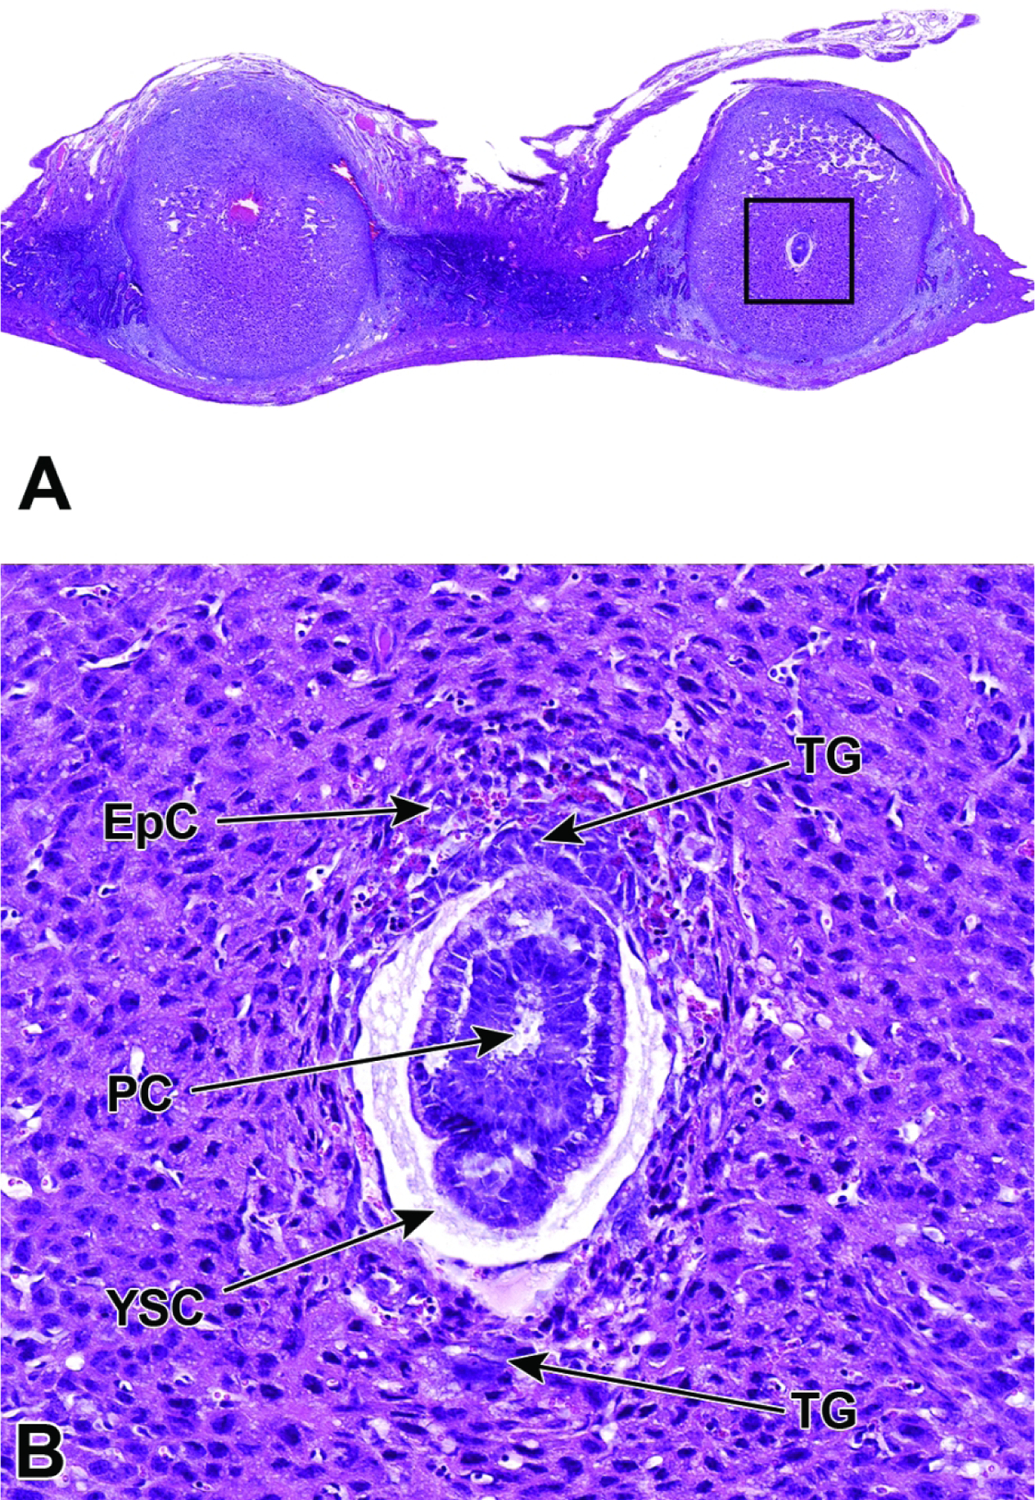
Representative images of a uterine horn and two implantation sites at E6.5. Figure A: At this stage the interaction between maternal decidua and embryonic trophoblast is the main source of embryonic nutrition. Figure B: Higher magnification of this implantation site (boxed region in Figure A) shows the ectoplacental cone (EpC) has formed and contains maternal blood, while trophoblast giant (TG) cells encompass the embryo. As the ectoplacental cone develops, the proamniotic cavity (PC) begins to form in tandem with initiation of gastrulation (formation of the three main embryonic germ layers – the endoderm, mesoderm, and ectoderm). The yolk sac cavity (YSC) is clearly seen at this stage of development. The yolk sac cavity is formed as the visceral yolk sac and parietal yolk sac line the embryo and the inner layer of blastocyst wall, respectively.
Once trophoblast invasion has commenced along the ectoplacental cone, the cells of the epiblast become distinguishable from the extraembryonic ectoderm.28 Gastrulation (i.e., the process by which the three main germ cell layers in the embryo proper are formed) occurs near E6.5, thereby giving rise to the mesoderm (middle) germ cell layer as well as the exocoelomic cavity from which the yolk sac cavity forms. At the same time, the amnion, allantois, and chorion elements of the placenta originate.7,28,51 The same morphogenetic rearrangements of the polar trophoblast that form the ectoplacental cone also form the interior lining of the extraembryonic ectoderm and epiblast by the differentiated cuboidal-shaped cells of the visceral and parietal endodermal cells of the hypoblast.40 The parietal endoderm has moved to line the internal layer of the former blastocoel wall while the visceral endoderm continues to envelop the embryo; the fluid-filled space arising between these two yolk sac-derived epithelial sheets is the yolk sac cavity.27,29 During the formation of the egg cylinder, a conformational change of the mouse embryo allows for inversion (twisting of the embryo within the placenta) around E5.5, which results in the parietal and visceral portions of the yolk sac being positioned close to one another (while embryonic endoderm faces the exterior of the egg cylinder and embryonic ectoderm faces the inner surface of the trophoblast layer).27 Near E6.0, the parietal endoderm cells secrete a variety of proteins and extracellular matrix components that come together to from Reichert’s membrane, a structure unique to the rodent placenta.27,29 Reichert’s membrane is a homogeneous, acellular, tough membrane that forms on the outer surface of the parietal endoderm, thus separating this portion of the yolk sac from the adjacent trophoblast cell layer.27,29 The Reichert’s membrane serves as an additional protective layer for the embryo by remaining on the exterior of the yolk sac.27 The yolk sac remains positioned such that its visceral (inner) wall approaches the amnion’s attachment to the embryo while its parietal (outer) wall is adjacent to Reichert’s membrane.27
Shortly after the yolk sac and Reichert’s membrane begin to be established (near E6.0), the proamniotic cavity begins to form as a precursor to the amniotic cavity.27,28 The cells of the primitive ectoderm that remain in the ICM cavitate to form the hollow lumen of the proamniotic cavity.29,52 The formation of the proamniotic cavity is dependent on initiation of the primitive streak in the embryo proper, which occurs at E6.0.28 The primitive streak promotes initiation of gastrulation, from which the mesodermal germ layer will arise as ectodermal epithelial cells lose their adhesiveness, transition to become mesenchymal cells, and then migrate between the embryonic ectodermal and endodermal germ layers.28,53 The extraembryonic mesoderm and extraembryonic ectoderm are derived from different areas along the epiblast, with amniotic mesoderm originating in the caudal region and amniotic ectoderm originating in the cranial region.53 After formation of the proamniotic cavity, extraembryonic mesoderm accumulates near the caudal end of the epiblast forming what is known as the amniochorionic fold, also referred to as the caudal amniotic fold.28,53 Formation of the amniochorionic fold is soon followed by additional folds along the lateral sides of the egg cylinder.53 The amniochorionic fold pushes into the lumen of the proamniotic cavity and begins to delineate the amnion from the exocoelomic cavity, oriented such that amniotic mesoderm faces the exocoelomic cavity and amniotic ectoderm faces the proamniotic cavity.28,53 In separating the exocoelomic cavity from the proamniotic cavity, the amniochorionic fold also forms the chorion, which was established by the extraembryonic ectoderm and the trophoblast giant cells of the ectoplacental cone and will soon develop multiple cell layers and participate in trophoblast cell differentiation.7,53 The portion of the chorion at which the allantois will attach is known as the chorionic plate and is key to initiating labyrinth formation and developing the vascular network.54 Once the amniochorionic fold has divided the proamniotic cavity from the chorion, the extraembryonic ectoderm is now referred to as chorionic ectoderm, and it remains separate from the amniotic ectoderm.53 In addition to the amniotic cavity and exocoelomic cavity, the amniochorionic fold also delineates the ectoplacental cone at this time.7 At E7.5, the proamniotic cavity is completely sealed, forming the amniotic cavity which serves as a space that divides the ectoplacental cone from the embryo (Figure 20).27 Later in development, the amnion will surround the entire embryo, which develops inside the amniotic cavity once it has undergone the process of turning.27
Figure 20.
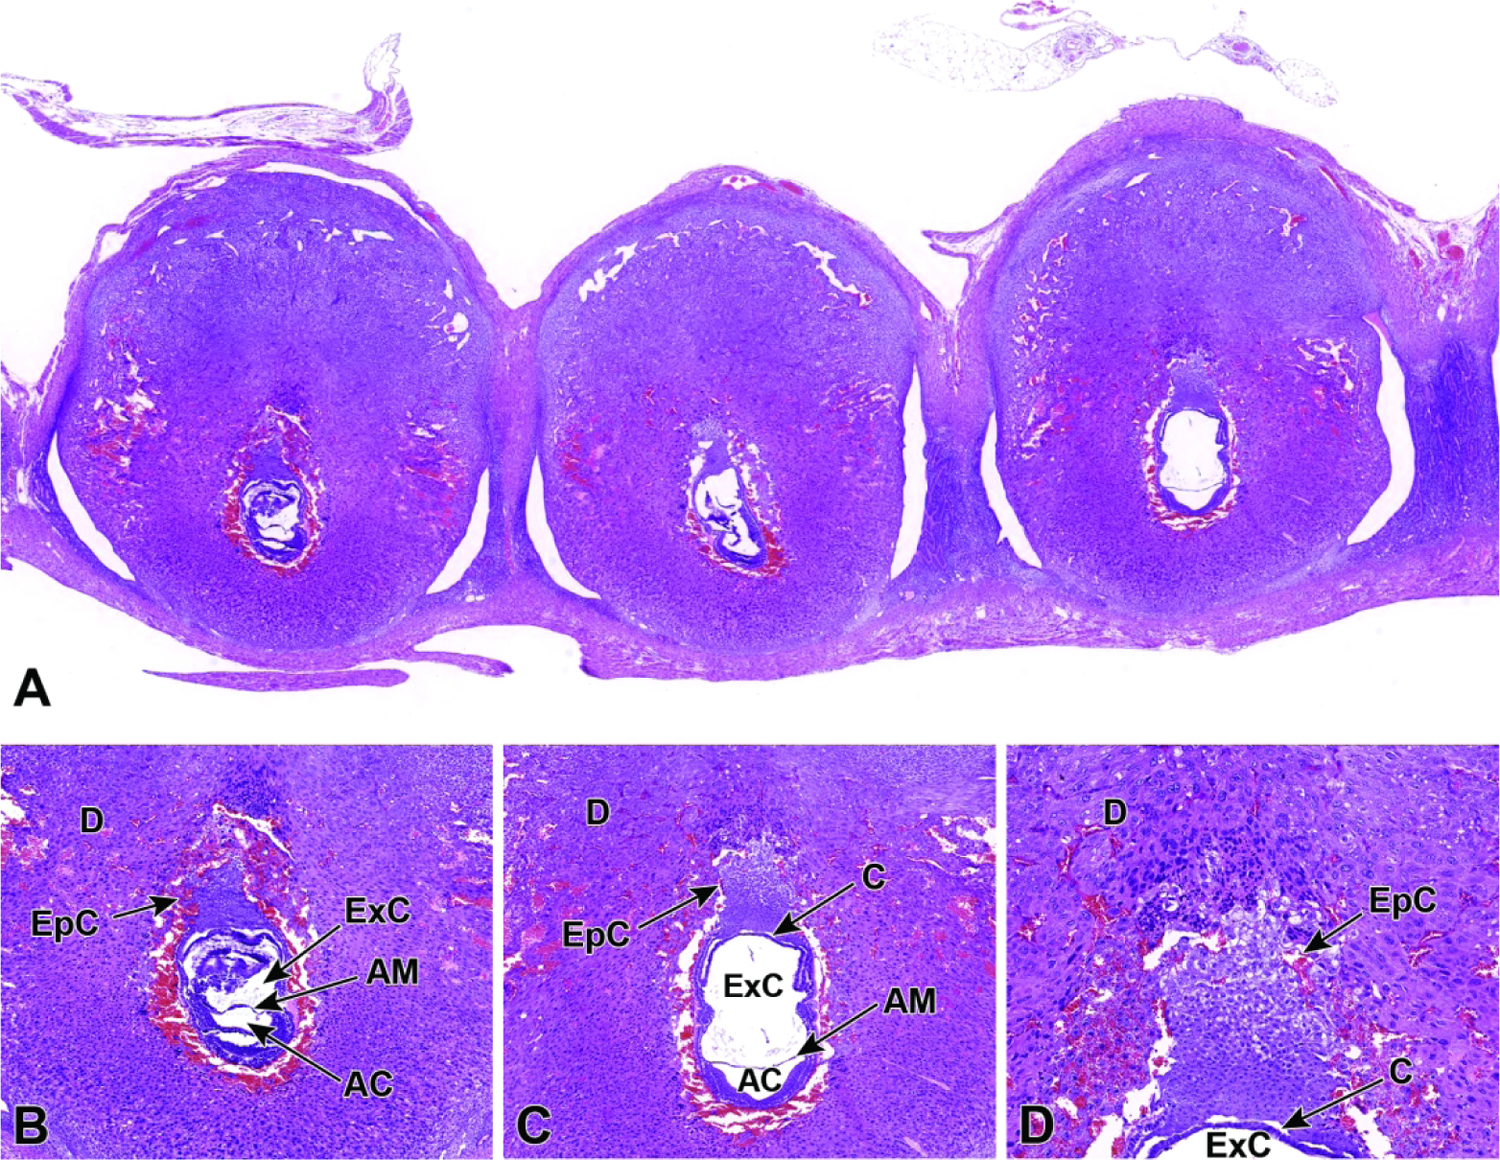
Representative images of a uterine horn showing three implantation sites at E7.5. Figure A: Viewing multiple implantation sites at once can help correctly age and identify formed placental (and embryonic) structures, as conceptuses of the same chronological age can differ by up to 24 hours when the stage of development is judged by structural features. Note that the orientation differs for placentas and embryos in adjacent implantation sites, with only some showing an ideal view. Figures B and C: The allantois has formed and has begun to cross the exocoelomic cavity (ExC) toward the chorionic plate (C). During this allantois spanning process, the proamniotic cavity and the exocoelomic cavity become distinct from one another, forming the amniotic cavity (AC) and the amnion (AM). Figure D: There is invasion of the ectoplacental cone (EpC) into the maternal decidua (D) in preparation for labyrinth induction.
After the yolk sac has been fully formed (around E7.5), aggregates of embryonic red blood cell progenitors (known as “blood islands”) begin to collect in the yolk sac.28 The blood islands represent some of the first primitive hematopoietic cells in the embryo while the aorta-gonad mesonephros (AGM) also plays a role in hematopoietic cell activity until definitive hematopoiesis begins in the liver at approximately E10.0.55–57
E7.0 – E8.5 – Initiation of the Allantoic Bud and Chorioallantoic Fusion
The late-streak stage of gastrulation occurs near E7.0.28 At this time, the allantoic bud begins to form at the caudal end of the embryo, through a process known as vasculogenesis. This allantoic bud will eventually serve as the umbilical cord (i.e., the bridge between the embryo and the chorionic plate located at the base of the placenta).27,28,53,58 The allantoic bud is comprised of mesoderm generated by the caudal end of the primitive streak shortly after the initiation of the amniochorionic fold.1 During allantoic bud initiation, the amnion and chorion have not become distinct from one another.28 The amniochorionic fold delineates the chorion, but by E8.0 the chorion is beginning to bulge outward from the center, which places it in contact with the basal layer of the ectoplacental cone.59 Once in contact, the ectoplacental cone then spreads along the entire chorion, thereby effectively removing the ectoplacental cavity and resulting in the chorion becoming several cell layers thick prior to chorioallantoic fusion.59 The amniochorionic fold has not yet separated the proamniotic cavity from the exocoelomic cavity at the time the allantoic bud is initiated. However, the enlargement of the allantois coincides with this separation event, which leads to formation of the amniotic cavity.1,27,28,53
Elongation of the allantoic bud occurs by three distinct means. These include cavitation, proliferation of cells already within the bud, and the migration of mesenchymal cells from the primitive streak to join the cells of the allantoic bud.1,60 The initiation of elongation is characterized by the differentiation of the bud cells into a flattened form of mesothelium at the point furthest from the embryonic attachment.1,61 The differentiation of flattened mesothelial cells continues throughout the elongation process as the allantois spans across the exocoelomic cavity toward the chorionic plate.51,61 Around E8.5 this results in the entire allantois being surrounded externally by a layer of flattened mesothelium.28,61 In addition to mesothelial tissue, the allantois also differentiates into endothelial tissue that will line the inner surfaces of embryonic blood vessels once fusion of the allantoic tip to the chorionic plate takes place.61 Differentiation of cells into endothelium occurs soon after mesothelial differentiation and leads to widespread blood vessel formation while the allantois is still elongating across the exocoelomic cavity.1,60,61 Vascularization in the allantois is a de novo multifocal process that initiates independently in areas most distal from the yolk sac and also in the developing embryo itself.1,60
Once the allantois has reached the chorionic plate by E8.5, another important event occurs without which the embryo cannot survive.37 This event is known as chorioallantoic attachment or fusion (Figure 21). This fusion is vital for the establishment of the chorioallantoic placenta that will serve as the definitive placenta from which all nutrient and gas exchanges will occur and supply the embryo throughout the latter half of gestation.1,27,28,62 The exact mechanism that drives chorioallantoic fusion is still unknown.1,62,63 The difficulty in understanding this phenomenon is in part due to the early death of embryos in which fusion fails to occur.63 However, it is known that chorioallantoic fusion is directed by the differential expression of proteins in the external mesothelium that covers the allantois.1,62,63 These mesothelial cells express proteins that facilitate a selective adhesiveness for chorionic tissue in a time-dependent manner and that helps facilitate the attraction and anchoring of the distal allantois to the chorionic plate. 1,60–62,64,65 The basal chorionic tissue also expresses proteins necessary for proper fusion; however, they are expressed over a wider time period in relation to allantoic protein expression.65 This fusion enables merging of the tissues that culminate ultimately in the induction of the labyrinth, which functions to enhance countercurrent exchange of gases and nutrients between the maternal and embryonic circulations of the placenta.3,66
Figure 21.
Representative images of a uterine horn at E8.5 with three implantation sites. Figure A: Uterine horn at low magnification illustrating the chorionic plate (C), exocoelomic cavity (ExC), amniotic cavity (AC), amnion (AM), yolk sac cavity (YSC), and embryo. Figure B: Higher magnification of boxed region in Figure A. The transition from a choriovitelline (yolk sac-based, phagocytosis-enabled) placenta providing histiotrophic nutrition to a chorioallantoic (labyrinth-centered, vascular-enabled) placenta providing hematogenous nutrition is initiated as labyrinth (L) induction commences and invades the maternal decidua (D). Figure C: Higher magnification of the labyrinth, illustrating its origin as a densely packed group of trophoblast cells extending from the chorionic plate (bottom margin of image) into the ectoplacental cone. This labyrinth will develop parallel embryonic vessels and maternal sinusoids by E9.5, forming the countercurrent exchange system that is characteristic of the definitive placenta.
Simultaneously around E8.5, the embryo undergoes the process of turning, in which the torso rotates back to the typical position (i.e., tail curling toward the ventral body wall) seen in the later stages of normal development.27,28,53 Embryonic rotation is necessary in mice to reverse the earlier inversion process that occurred around E5.5.53 After the process of turning is complete, the embryo is wholly surrounded by the amnion and yolk sac.53
E8.5 – E9.5 – Labyrinth Induction and Junctional Zone Formation
Once induced to form by chorioallantoic fusion at E8.5, the labyrinth begins to expand and differentiate, acquiring many branching channels by E9.0.3–5 The highly branched labyrinth serves to increase surface area for maternal/embryonic gas, nutrient, and waste exchange, in a fashion equivalent to the primary villi in the human placenta.3,65 The labyrinth forms from embryo-derived and extra-embryonic tissue through a combination of chorionic folding in conjunction with further invasion of the allantoic mesoderm into the chorionic plate (Figure 22).3 As the chorion folds, the allantoic mesoderm and its blood vessels penetrate into the gaps, wearing away chorionic tissue and promoting vascularization of the labyrinth while also bringing the allantoic branches of embryonic blood vessels into contact with the chorionic ectoderm.1,3,65,67 Once in contact with the chorionic ectoderm, the allantoic vasculature induces the formation of other differentiated trophoblast cell types including cytotrophoblasts (also known as sinusoidal trophoblast giant cells) as well as syncytiotrophoblast types I and II.1,3,4,65,67 The differentiation of these three trophoblast cell lineages is limited to the tips of the branching allantoic tissue as it invades the chorionic plate to form the labyrinth.3 The syncytiotrophoblast I and syncytiotrophoblast II cells form two stacked, continuous cell layers while the cytotrophoblasts form a discontinuous layer; these three embryonic strata are the only tissues separating the maternal blood spaces (termed “sinusoids”) and embryonic blood vessels of the labyrinth.3–5 This multi-layered barrier is known as the interhemal barrier.59 The direct apposition of the trilaminar embryonic elements (i.e., three trophoblast layers) with the blood-filled maternal sinusoids without any intervening maternal tissue layers defines the “hemotrichorial” nature of definitive placenta in mice (Figure 23).3,4,27 By comparison, the human and non-human primate placentas have a hemomonochorial arrangement that involves only a single layer of trophoblast separating the embryonic and maternal circulations in villus formation.68
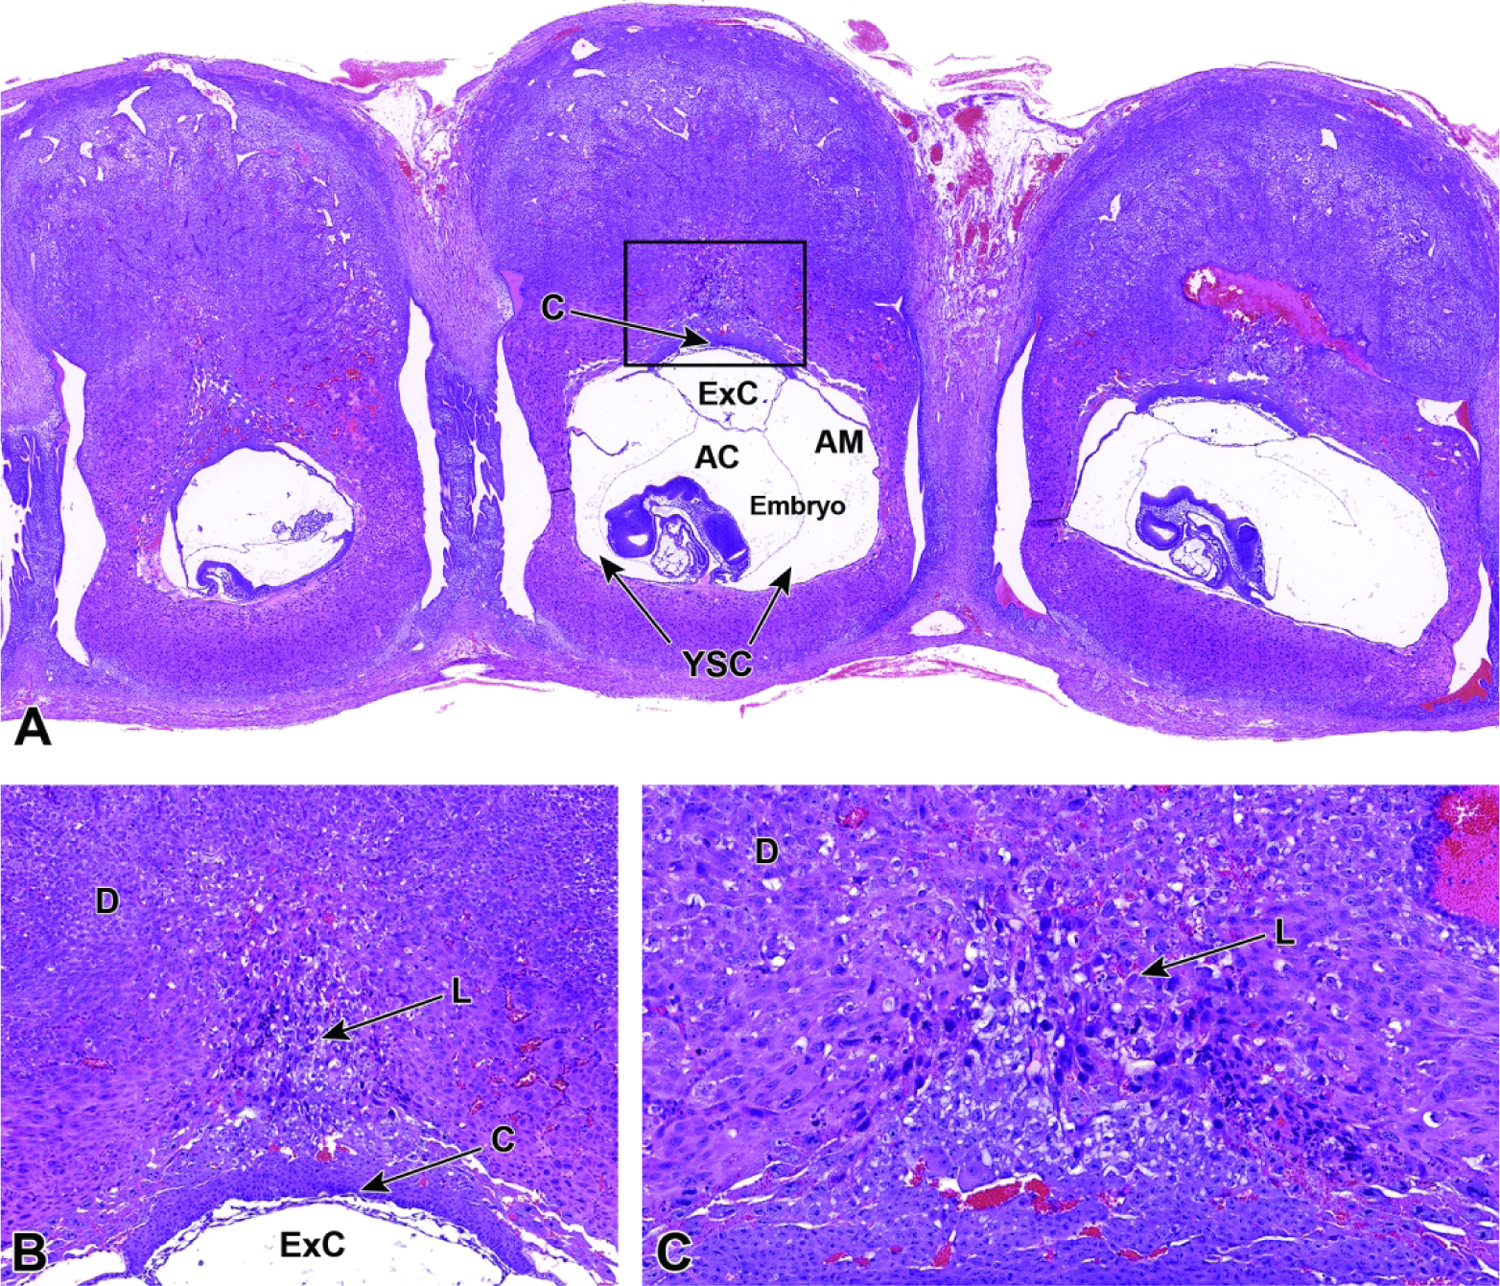
Figure 22.
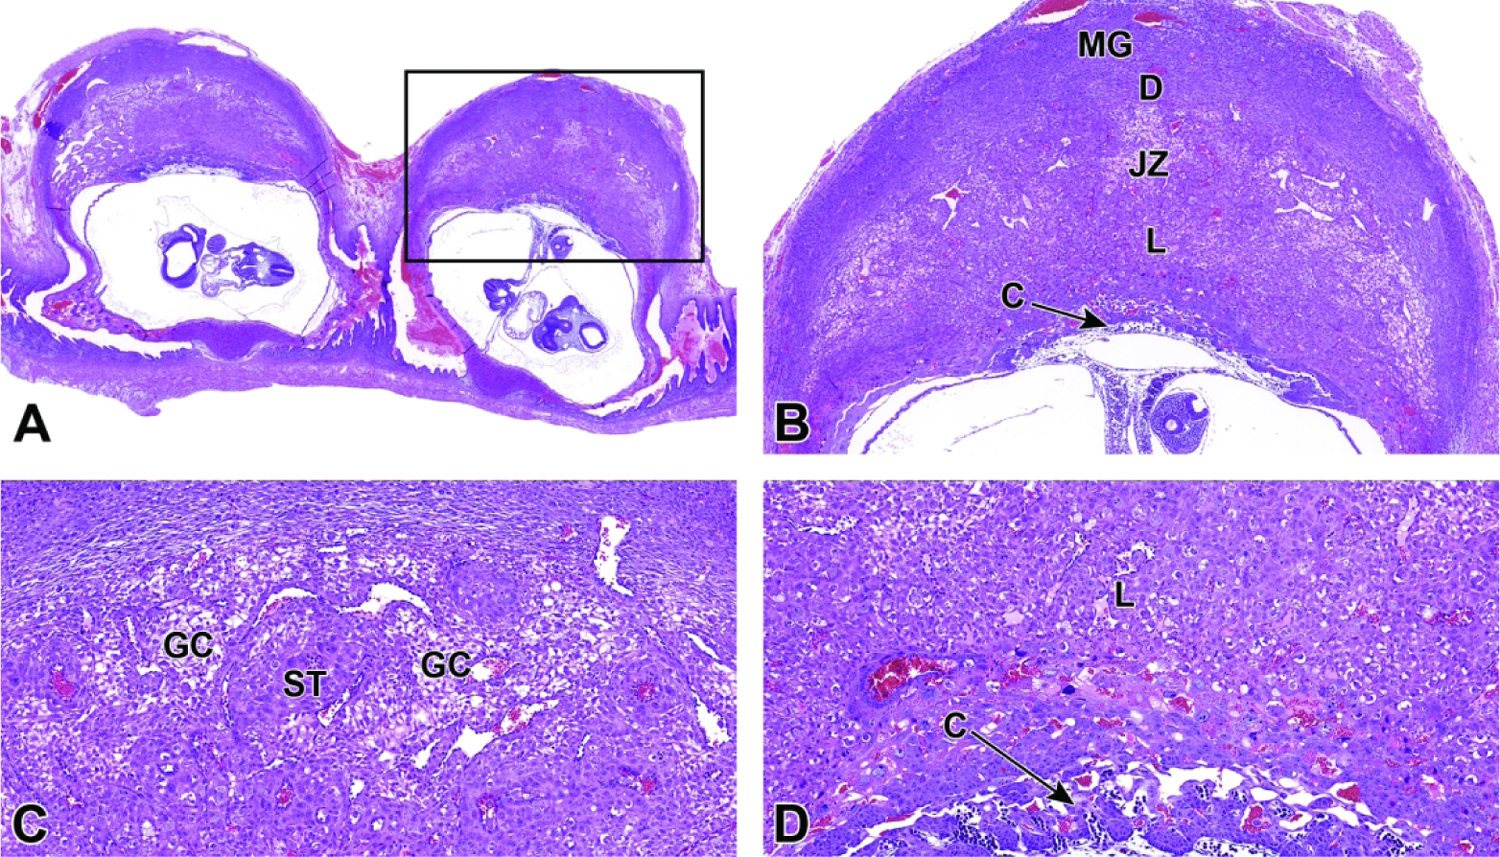
Representative images of uterine implantation sites at E9.5. Figure A: Uterine horn at low magnification showing two implantation sites. Figure B: Higher magnification of boxed region in Figure A. The embryonic labyrinth (L) and junctional zone (JZ) form discrete layers beneath a cap of maternal decidua (D). The metrial gland (MG) and chorionic plate (C) are also visible at this stage. Figure C: The junctional zone is comprised chiefly of spongiotrophoblast (ST) cells and glycogen cells (GC). Figure D: Higher magnification of the labyrinth and chorionic plate.
Figure 23.
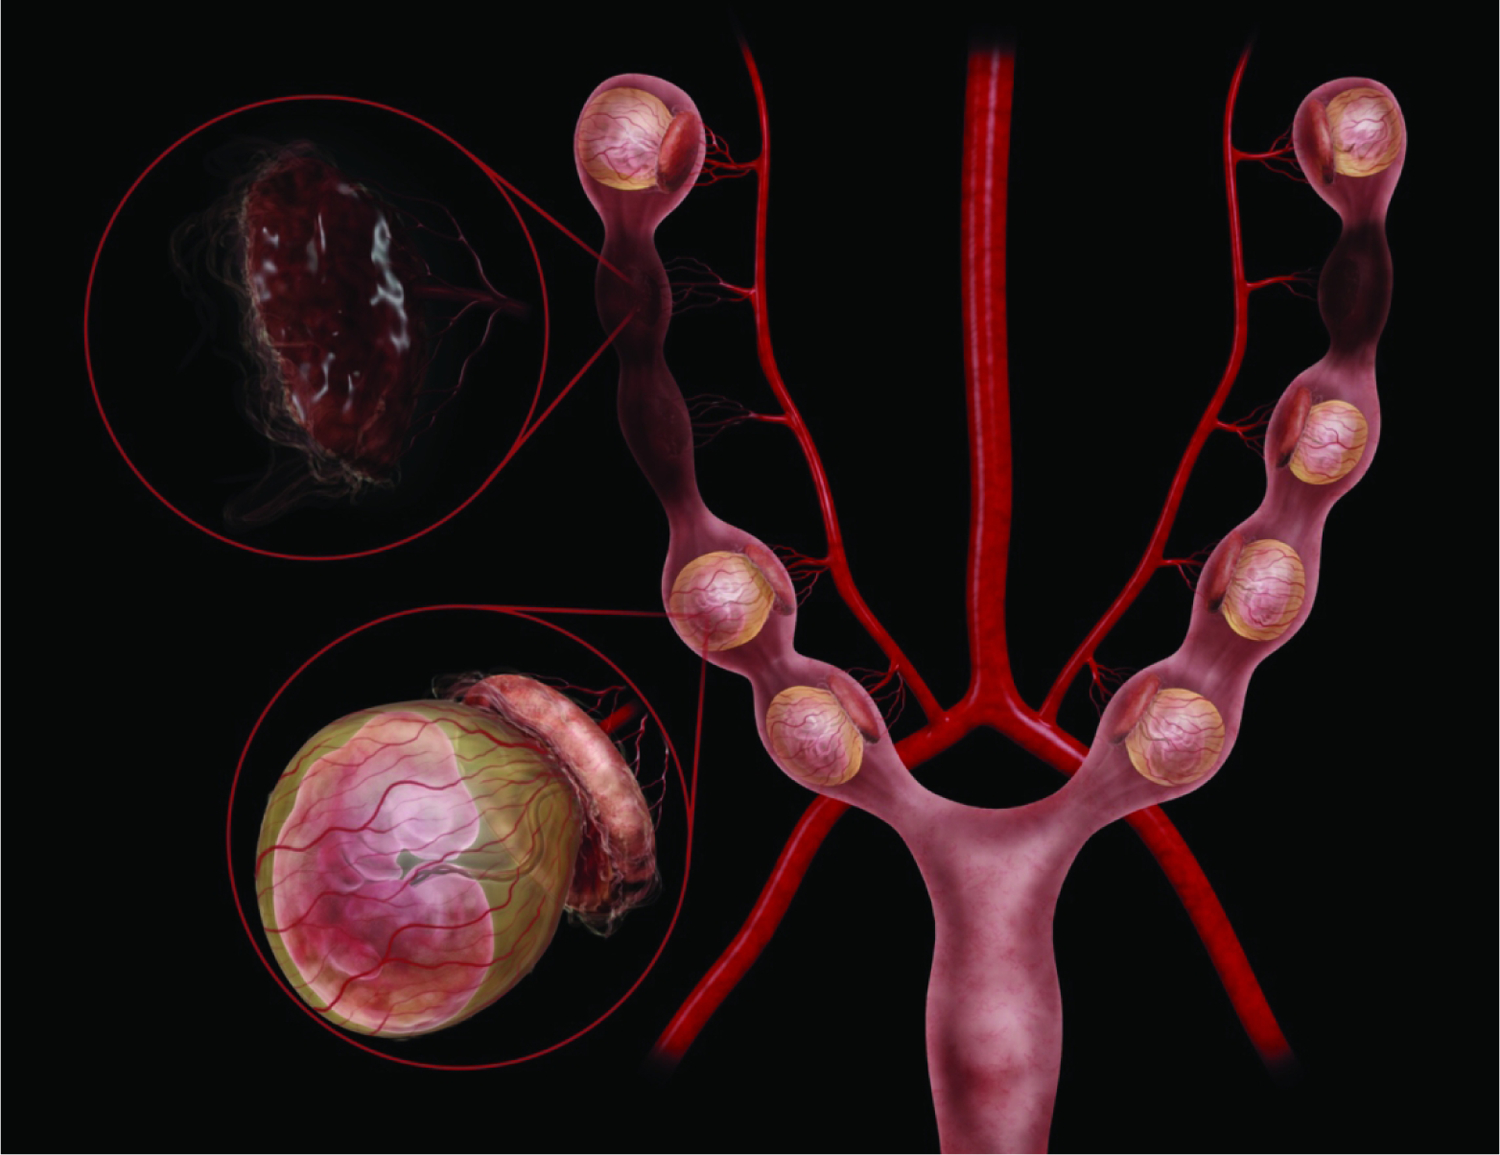
Diagrammatic representation of the mouse right and left uterine horns at E9.5. Illustrations here show both healthy, intact embryos and placentas (lower left magnification circle, with the definitive placenta capping the yolk sac-enveloped embryo) as well as some resorptions (upper left magnification circle, with collapsed placental residue). Within a single litter there can be both viable and non-viable conceptuses (i.e., embryo and placenta pairs), and among the viable offspring their developmental ages can be offset by as much as 24 hours. Embryo positioning within the yolk sac, in relationship to the placenta, can vary from embryo to embryo. The uterine vascular supply is from the aorta by way of the left and right uterine arteries, which then branch to form the arcuate and radial arteries that supply each developing embryo. 180×139mm (800 × 800 DPI)
The cytotrophoblasts are mononuclear cells that play an important role as secretory components for producing and transmitting hormones through the maternal/embryonic interface.3,5 The cytotrophoblasts constitute the outer, discontinuous layer of labyrinth trophoblast cells that directly contact the maternal blood within the maternal sinusoids.4,5 Syncytiotrophoblast I and syncytiotrophoblast II cells that make up the inner two continuous layers of the labyrinth are multinucleated due to cell-cell fusion (rather than endoreduplication).3,4 This multinucleation is associated with improved nutrient and gas exchange.3,5 The trilaminar structure of the mouse labyrinth is retained due to tight connections that syncytiotrophoblast I and syncytiotrophoblast II layers maintain with each other as well as the connection the syncytiotrophoblast II layer maintains with the endothelial cell layer that lines the embryonic blood spaces.3,4 Conversely, the cytotrophoblasts maintain loose connections to the underlying syncytiotrophoblast layers, sometimes exhibiting protrusions toward the embryonic blood spaces. This allows for easier access to the maternal blood spaces and maximizes exchange across the placental barrier.3,4 Prior to E9.5, the labyrinth layer is composed chiefly of embryonic endothelial cells that line the embryonic capillaries; these spaces are easily identified since they contain nucleated (embryo-derived) red blood cells (nRBCs).27,69 At E9.5, maternal blood begins to enter the labyrinth sinusoids once they are lined completely by the syncytiotrophoblast I and syncytiotrophoblast II cells.3,5,27 The maternal blood entering the labyrinth sinusoids at this time contains aRBCs.69
After the trilaminar trophoblast structure of the labyrinth has been established, an additional placental structure, the junctional zone, forms and serves as a separating layer between the labyrinth and the maternal decidua.4,67 Similar to the labyrinth, the junctional zone contains many sinusoids that function in the process of gas, nutrient, and waste exchange.4 However, substrate exchange from maternal to embryonic blood spaces is less efficient in the junctional zone because the dilated maternal blood spaces in this region consist of large venous sinusoids containing maternal blood that is being transported slowly back toward the decidua after having gone through and then exited the labyrinth.4 The junctional zone also contains two other types of differentiated trophoblast cells known as spongiotrophoblast cells and glycogen-containing trophoblast cells, also known as glycogen cells.4 The spongiotrophoblast cells line the maternal venous sinusoids and make up the bulk of the cells in the junctional zone beginning around E9.5.4 The parietal giant cells that extended into the decidua along the exterior of the ectoplacental cone during the earlier process of decidualization still remain in the region between the junctional zone and decidua, abutting the spongiotrophoblast cell layer of the junctional zone.59 Later in development of the junctional zone, the glycogen cells begin to differentiate, and the morphology of the spongiotrophoblast cells becomes more distinct (Figure 24).4
Figure 24.
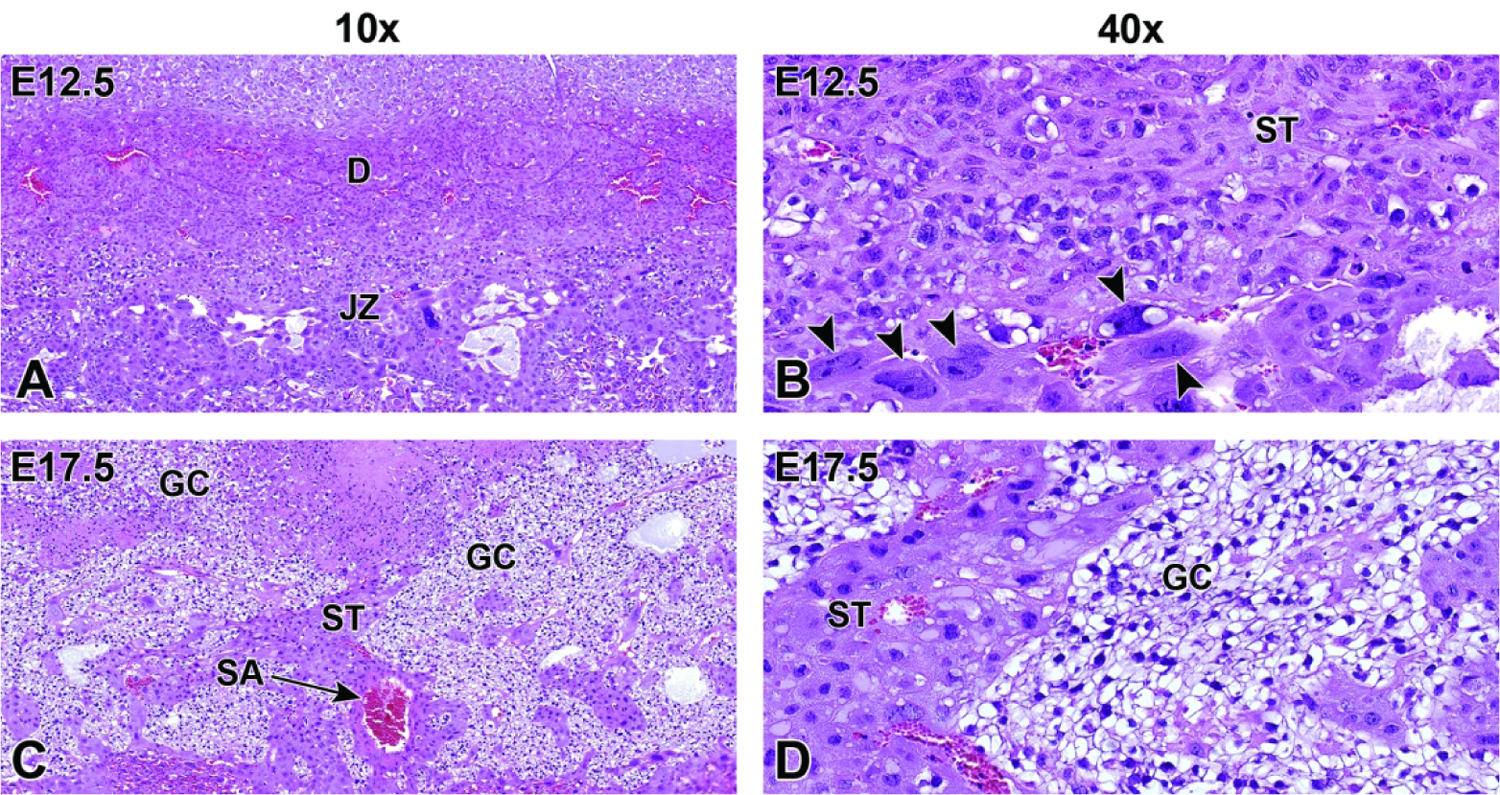
Representative images of junctional zone development following formation of the labyrinth at E12.5 and at E17.5. Figure A: At E12.5, the junctional zone (JZ) separates the labyrinth from the maternal decidua (D). Figure B: Higher magnification of the E12.5 junctional zone. Note the spongiotrophoblast (ST) cells and trophoblast giant cells (arrowheads) in this region. In addition to mediating implantation, trophoblast giant cells are the main endocrine cells of the placenta, producing several hormones that regulate the maternal endocrine and immune systems and promote maternal blood flow to the implantation site. Figures C and D: At E17.5, islands of glycogen cells (GC) with clear vacuolated cytoplasm containing glycogen granules are easily seen among the spongiotrophoblast cells. This area is also highly vascularized with spiral arteries (SA) containing maternal blood. Figures A and C, original scans = 10x. Figures B and D, original scans = 40x.
E10.0 – E18.5 Definitive Placenta Launches and Becomes Fully Functional by E12.5
By E10.0, the structure of the primitive choriovitelline (“yolk sac”) placenta is beginning the transition to the more mature chorioallantoic (“labyrinthine”) configuration, which is termed the “definitive” placenta once it develops fully around E12.5.59 The transition to the chorioallantoic placenta is marked by a switch to reliance on hematogenous nutrition (i.e., countercurrent exchange of vascular-borne nutrients along concentration gradients) rather than histiotrophic nutrition (i.e., phagocytic uptake of maternal secretions by embryonic cells). This conversion is an absolute prerequisite to sustain the substrate requirements for the rapidly growing embryo.27 At E10.0, a cross-section of the placenta reveals four distinct placental layers: the decidua (outer), junctional zone (middle), labyrinth (inner), and chorionic plate (basal site to which the umbilical cord attaches).59 Though formed and actively functioning by E12.5, each of the structural layers of the definitive placenta continues to undergo further modification designed to facilitate nutrient exchange until just before birth (E18.5) (Figures 25 and 26).
Figure 25.
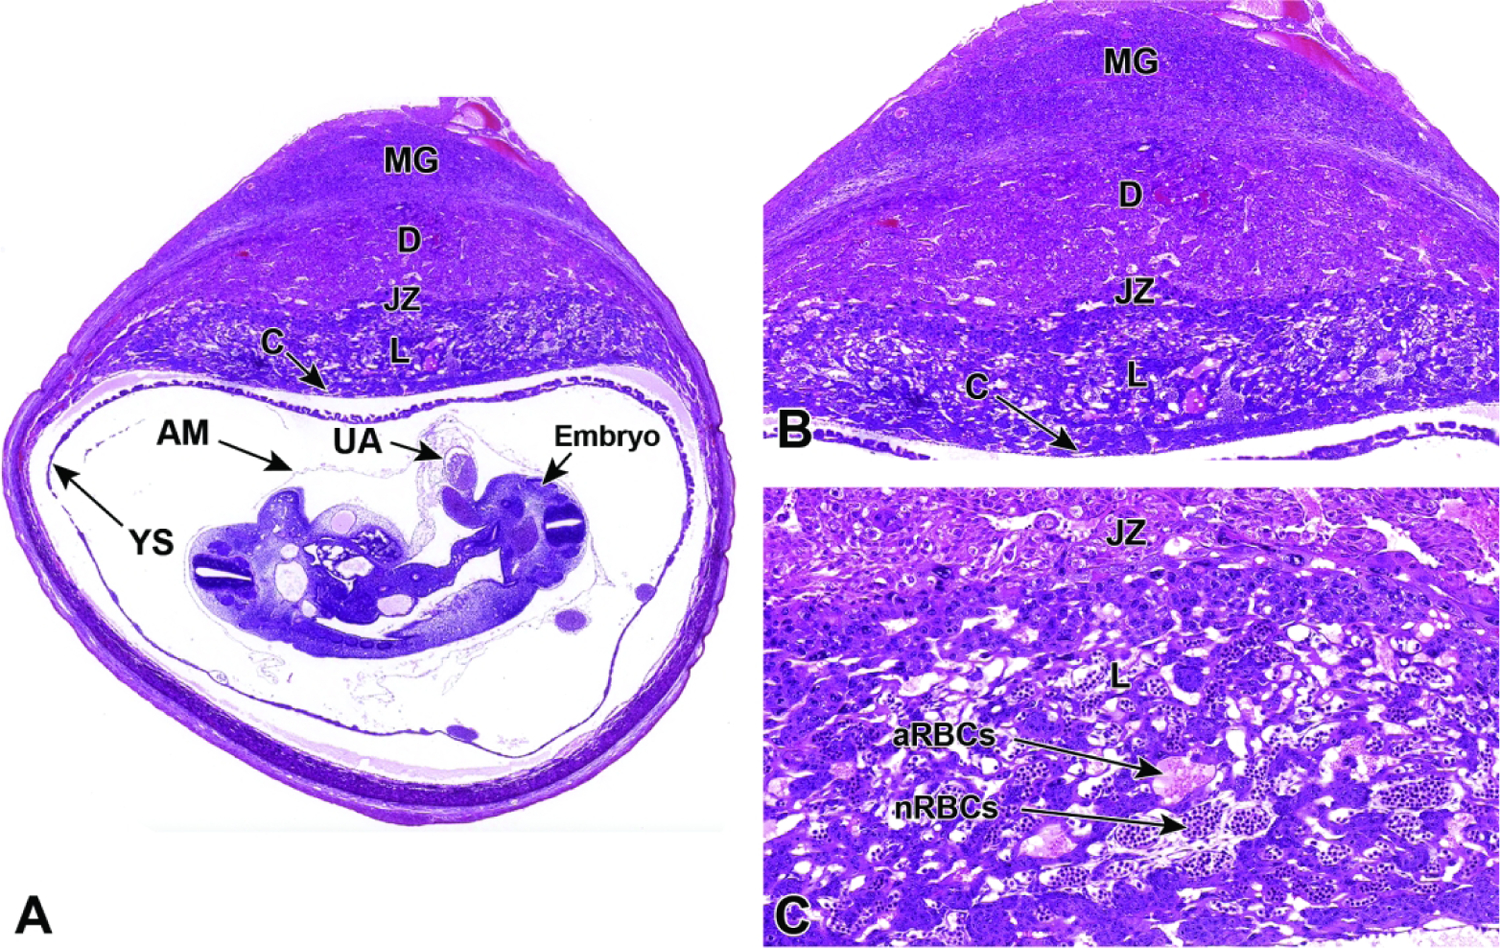
Representative images of a cross-section through a uterine implantation site at E10.5. Figure A: The labyrinthine placenta is maturing but is not yet fully mature, and positioning of the embryo, yolk sac (YS), and amnion (AM) can be seen in relation to the rest of the placenta; the lack of widespread anchoring allows these structures to shift position in unpredictable ways during tissue embedding. A cross-section of the umbilical artery (UA) can also be seen. Figure B: A higher magnification of this placental cross-section shows multiple distinct layers: the maternal decidua (D), the embryonic junctional zone (JZ), and the embryonic labyrinth (L) at the core adjacent to the chorionic plate (C). The metrial gland (MG) is not placental tissue but is instead a transient maternal immune organ that develops as a pregnancy-specific modification of the mesometrial uterus, opposite each implantation site. Figure C: The labyrinth contains intersecting columns of trophoblast cells (three embryonic cell lineages) that separate embryonic vessels packed with nucleated red blood cells (nRBCs) from maternal sinusoids containing anucleated red blood cells (aRBCs).
Figure 26.
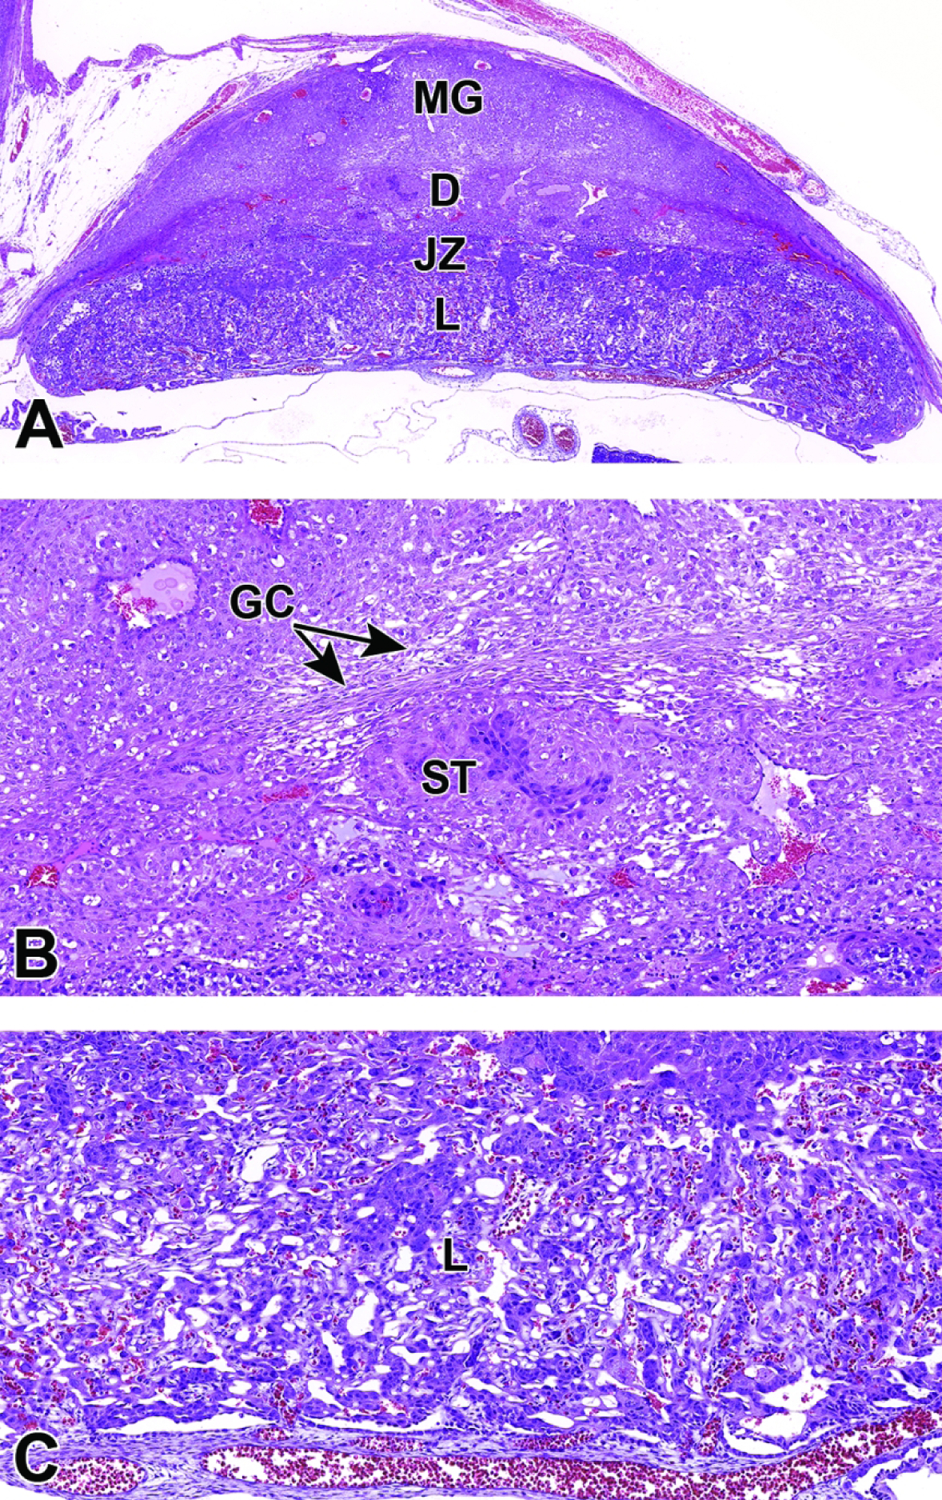
Representative images of a placental cross-section at E11.5. Figure A: The placenta is nearly mature as indicated by the highly vascular nature of the labyrinth (L) and clear separation between the labyrinth, junctional zone (JZ), and maternal decidua (D). Note the well-developed metrial gland (MG). Figure B: Higher magnification of the junctional zone illustrating the glycogen cells (GC) and spongiotrophoblast (ST) cells. Figure C: Higher magnification of the highly vascularized labyrinth with maternal vessels at the bottom delivering blood from the spiral artery.
The maternal decidua, the layer that is situated farthest from the embryo, is attached to the uterine wall. At E10.0, it is comprised of several maternal cell lineages—decidual cells, uNK cells, and incoming maternal vasculature—as well as several classes of invading, embryo-derived trophoblast cells.59 The remodeling of the maternal endometrium to form the decidua begins soon after implantation through the process of decidualization; however, further remodeling of maternal vasculature continues later in development as the chorioallantoic placenta becomes active.70 Spiral arteries located in the metrial gland and decidua make up the maternal vasculature in these placental layers.5 The spiral arteries coursing through the decidua lose smooth muscle in their vessel walls and become lined by trophoblast giant cells, first in the outer metrial gland (by E10.0) followed by the vessels in the deeper decidua (E10.5).5,69,70 These arteries are vital to the blood and nutrient exchange process that is carried out by the definitive placenta (Figures 27, 28, 29). After E12.5, the decidua serves as a protective barrier between the developing embryonic tissue and the maternal tissue, with uNK cells playing an important role in maintaining proper immune function at the embryo/maternal interface to protect both mother and embryo.27,47,48 Because the decidua contains much of the maternal vasculature, the decidual barrier also prevents potential threats posed by the maternal immune system by physically limiting the transfer of leukocytes and antibodies from maternal blood that could result in early death of the embryo.27 By E12.5, uNK cells in the decidua have reached peak levels as they complete their shift from initial aggregations in the uterine endometrium (which form around the time of implantation) to full-fledged migration into the abutting decidual tissue.27,59 The uNK cells in the metrial gland and decidua can be identified due to the many large, intracytoplasmic, eosinophilic granules. These cells are most prominent around modified, maternal-derived arterioles or veins.5,69 Approaching E16.0 (Figures 30 and 31), the uNK cells in the decidua begin to decline as the decidua begins to decrease in mass in preparation for birth.27 During this time, the cells of the decidua deteriorate leaving only residual tissue while the surrounding uterine tissue has largely returned to the preimplantation epithelial arrangement in all areas not directly associated with placentation.70
Figure 27.
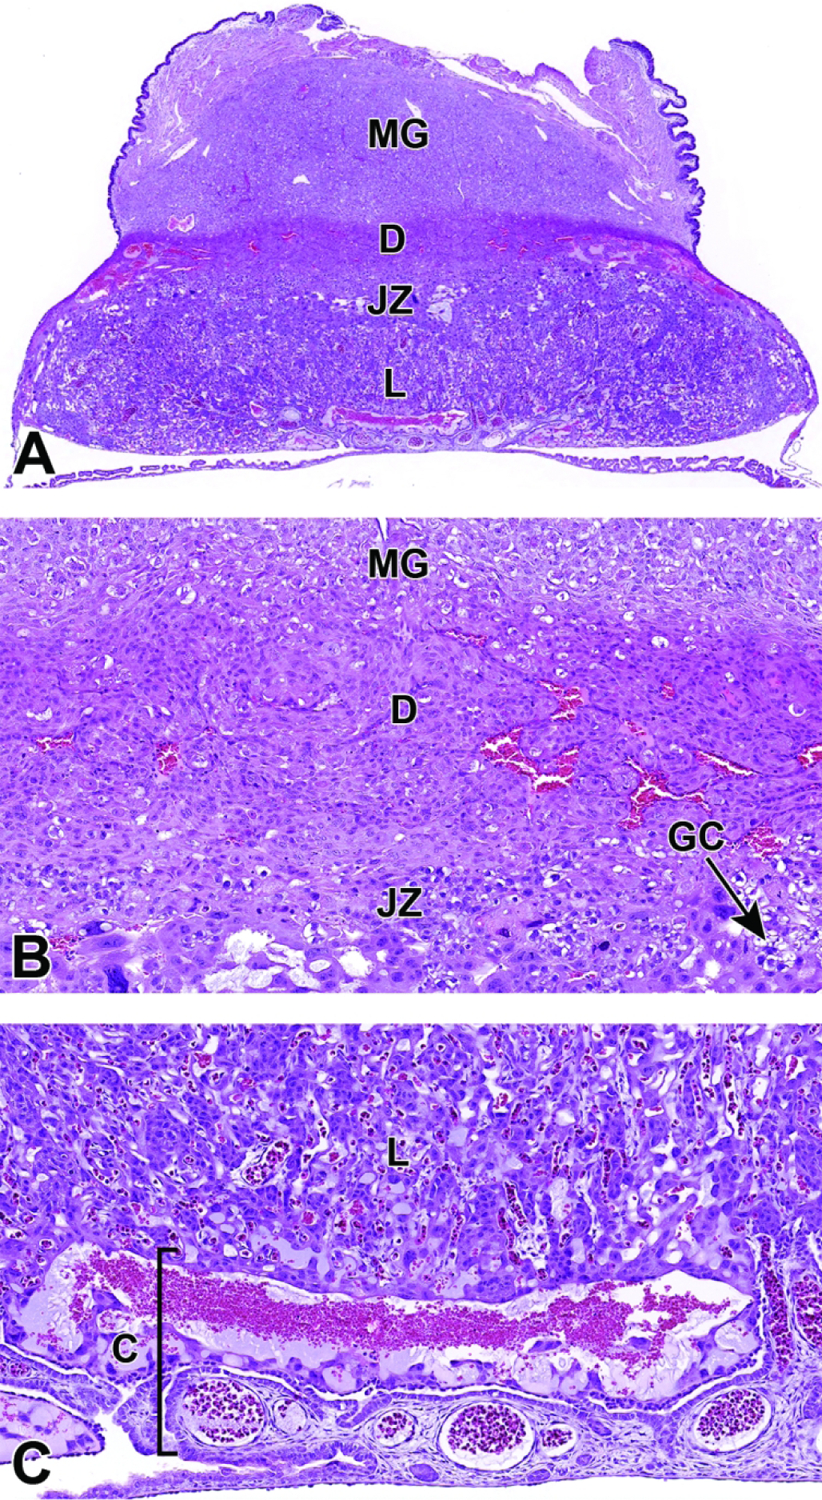
Representative images of a placental cross-section at E12.5 showing the fully functional definitive placenta with adjacent metrial gland (MG). Figure A: Low magnification of a placenta cross-section highlighting the various placental layers. Figure B: Higher magnification of the maternal decidua (D) and junctional zone (JZ). The junctional zone is composed primarily of glycogen cells (GC) and spongiotrophoblast cells that can form branching columns that extend into the labyrinth. Figure C: Higher magnification of the labyrinth (L) and chorionic plate (C). The highly vascular chorionic plate is the basal site for attachment of the umbilical cord vessels. At this stage the labyrinth makes up half of the entire placental weight as it fills with embryonic and maternal derived blood.
Figure 28.
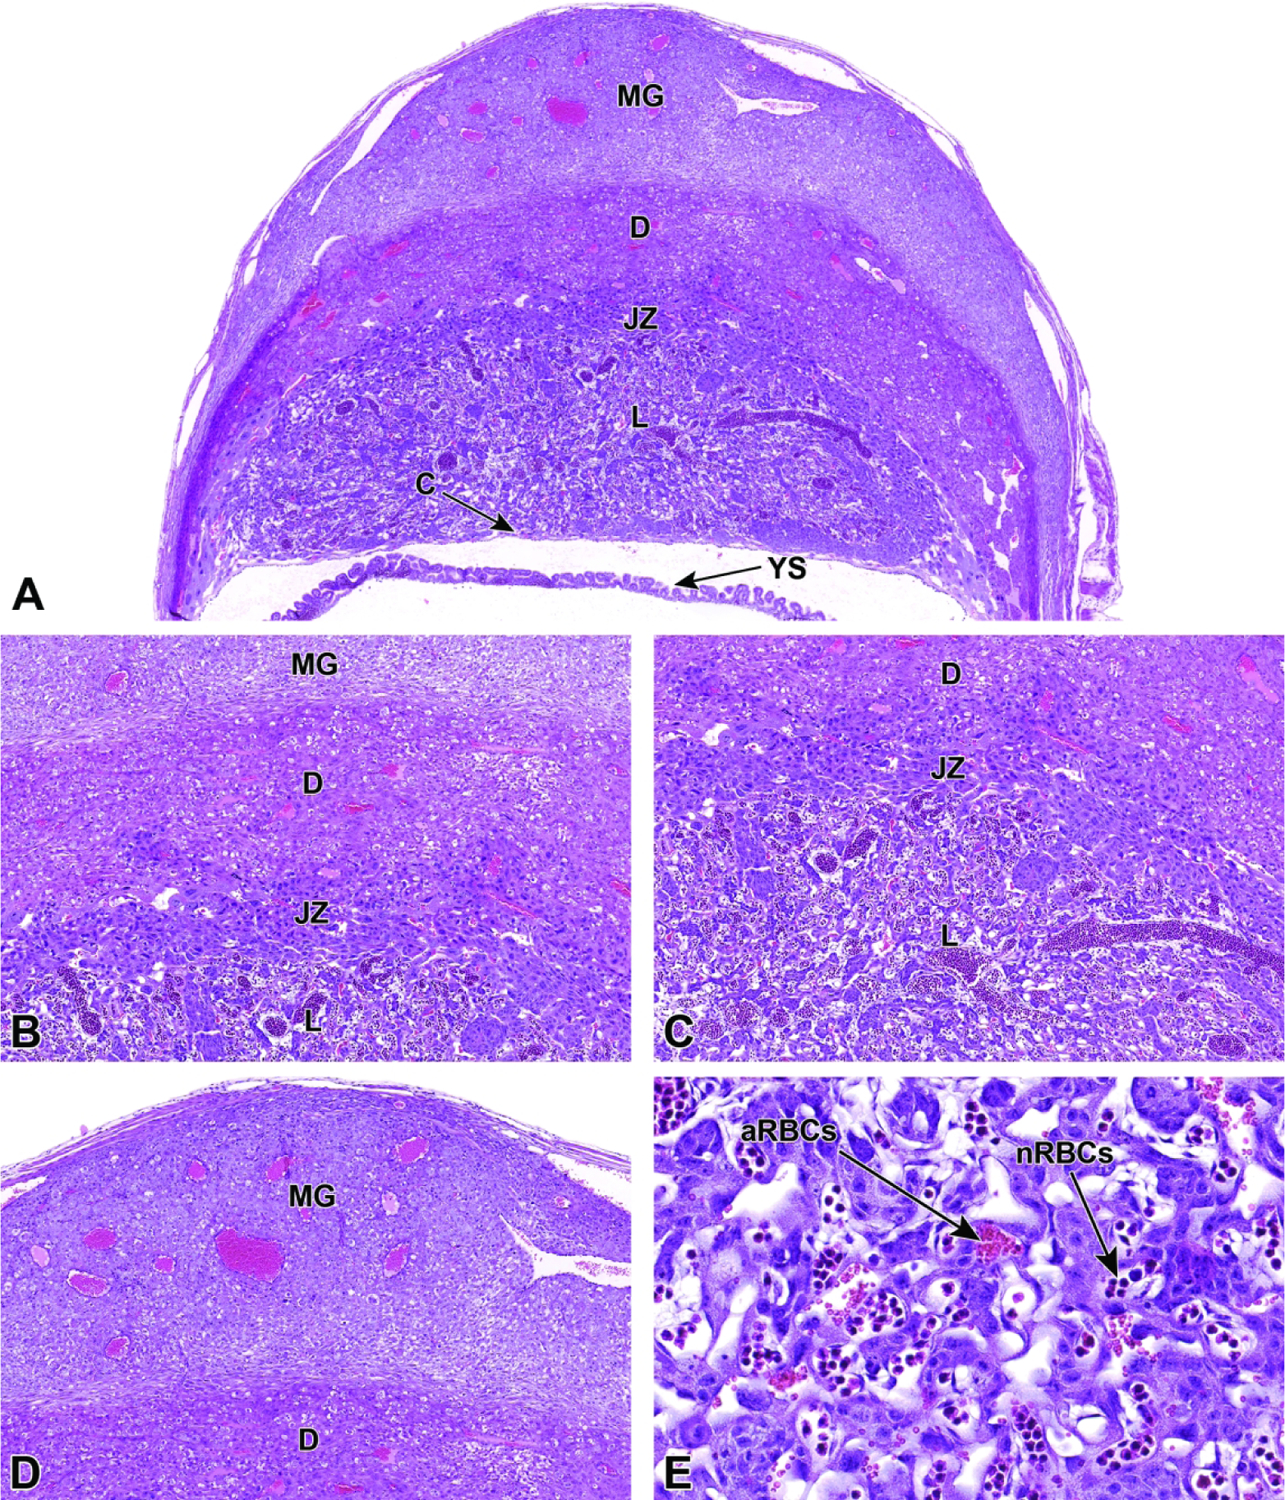
Representative images of a definitive placenta cross-section at E13.5. Figure A: Low magnification of a placenta cross-section highlighting the maternal decidua (D), junctional zone (JZ), labyrinth (L), and chorionic plate (C). The metrial gland (MG) and yolk sac (YS) are also present. Figures B and C: Higher magnification of placental layers. Figure D: The metrial gland attached to the outer maternal decidua continues to enlarge as various placental cell populations undergo proliferation. Figure E: Many nucleated (immature or “primitive”) red blood cells (nRBCs) are still circulating in the embryonic blood vessels of the labyrinth, but an increasing number of anucleated (mature or “definitive”) red blood cells (aRBCs) are now visible sharing the same blood vessels.
Figure 29.
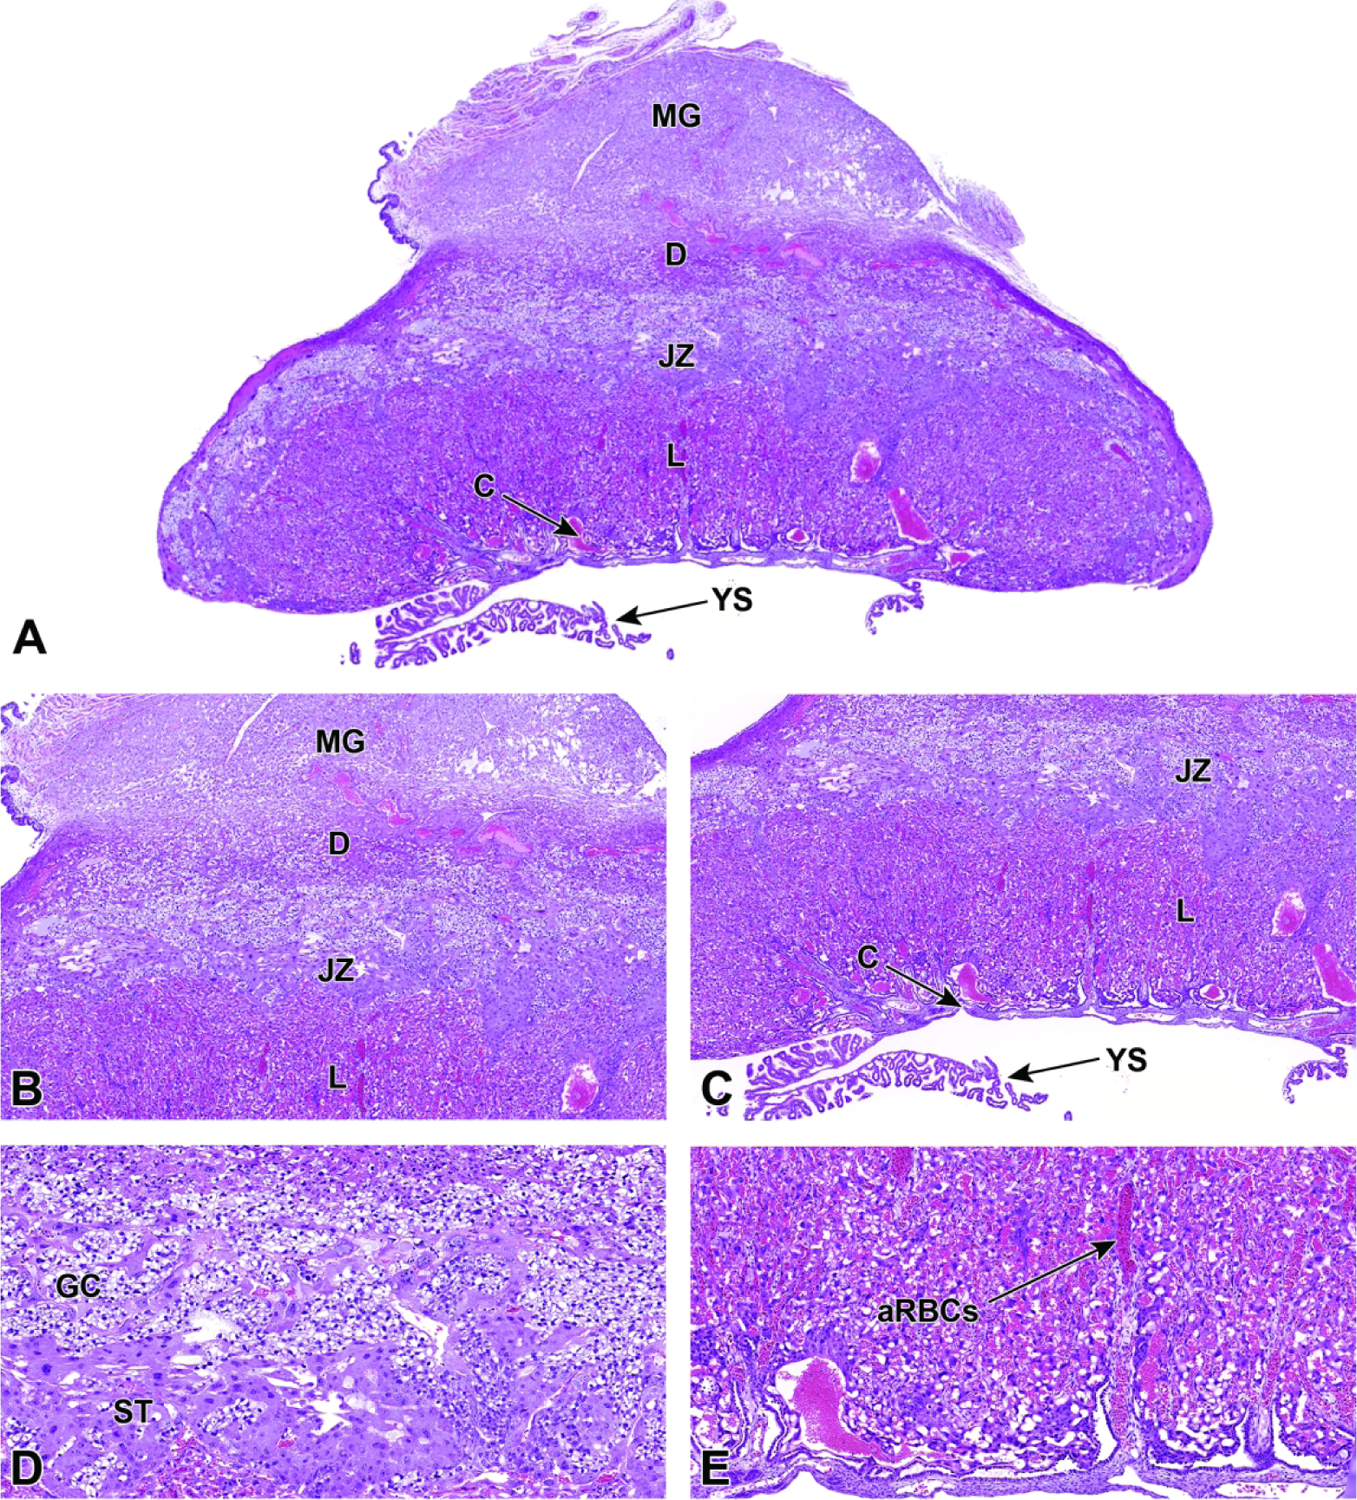
Representative images of a definitive placenta cross-section at E14.5. Figure A: Low magnification of a placenta cross-section highlighting the maternal decidua (D), junctional zone (JZ), labyrinth (L), and chorionic plate (C). The metrial gland (MG) and yolk sac (YS) are also present. Figures B and C: Higher magnification of placental layers. Figure D: Higher magnification of the junctional zone highlighting glycogen cells (GC) and spongiotrophoblast (ST) cells. Figure E: The labyrinth has reached its maximum dimensions, and the embryonic blood vessels now contain predominantly anucleated (mature) red blood cells (aRBCs).
Figure 30.
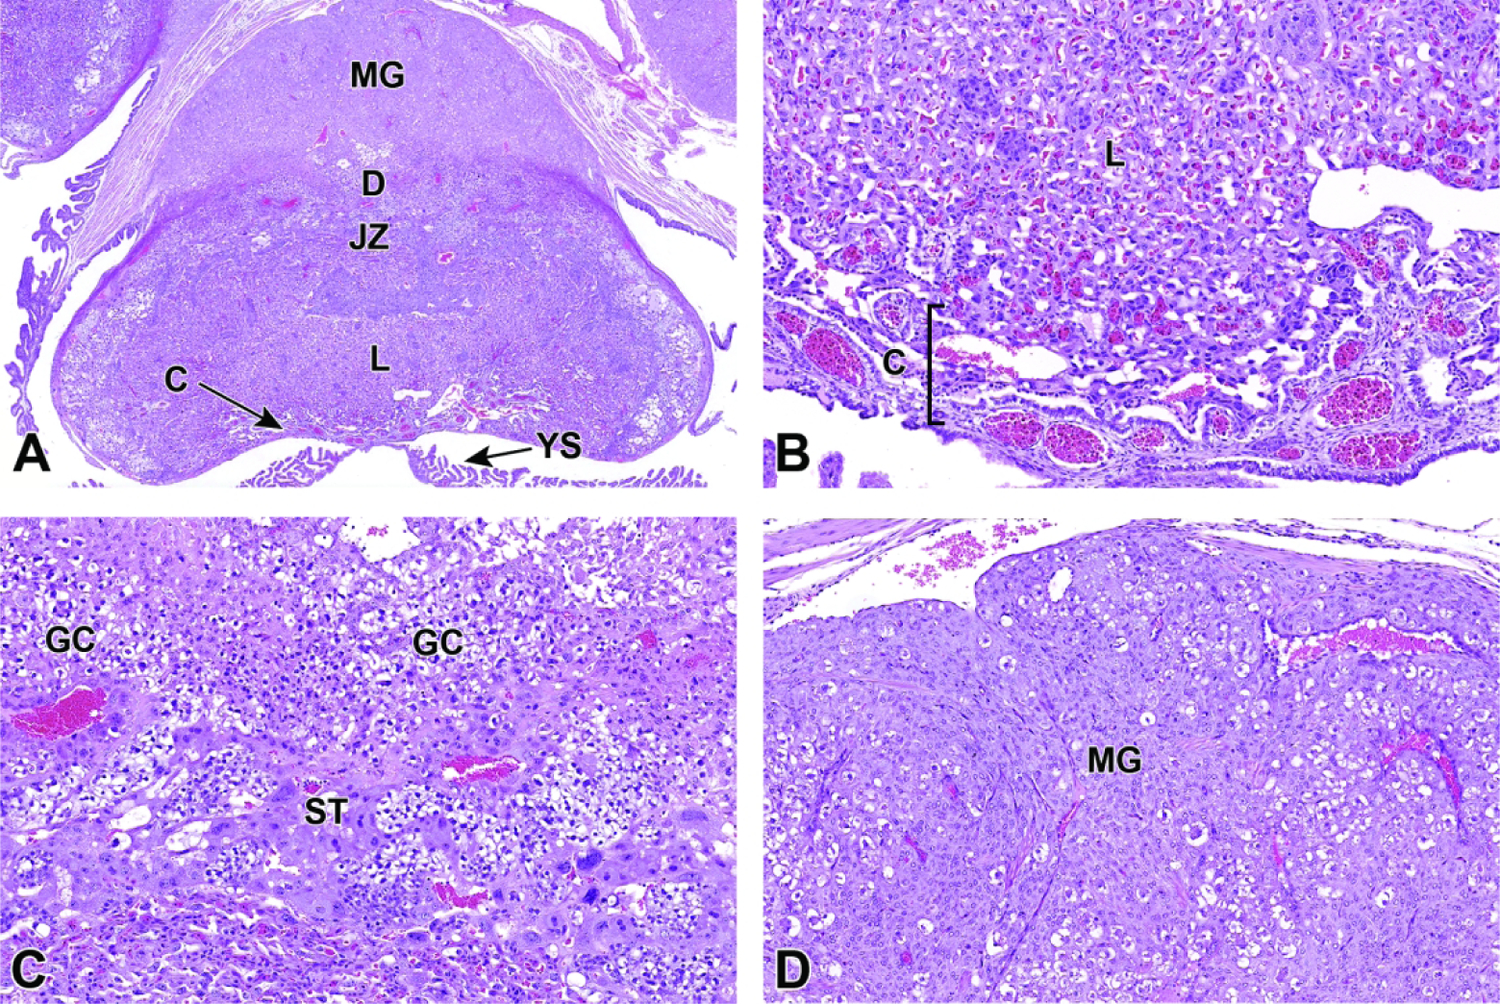
Representative images of a definitive placenta cross-section at E15.5. The placenta has reached its peak weight and is beginning its regression in preparation for birth. Figure A: Low magnification of a placenta cross-section highlighting the maternal decidua (D), junctional zone (JZ), labyrinth (L), and chorionic plate (C). The metrial gland (MG) and yolk sac (YS) are also present. Figure B: Higher magnification of the labyrinth and chorionic plate. Figure C: Higher magnification of the junctional zone highlighting glycogen cells (GC) and spongiotrophoblast (ST) cells. Figure D: High magnification of the metrial gland.
Figure 31.
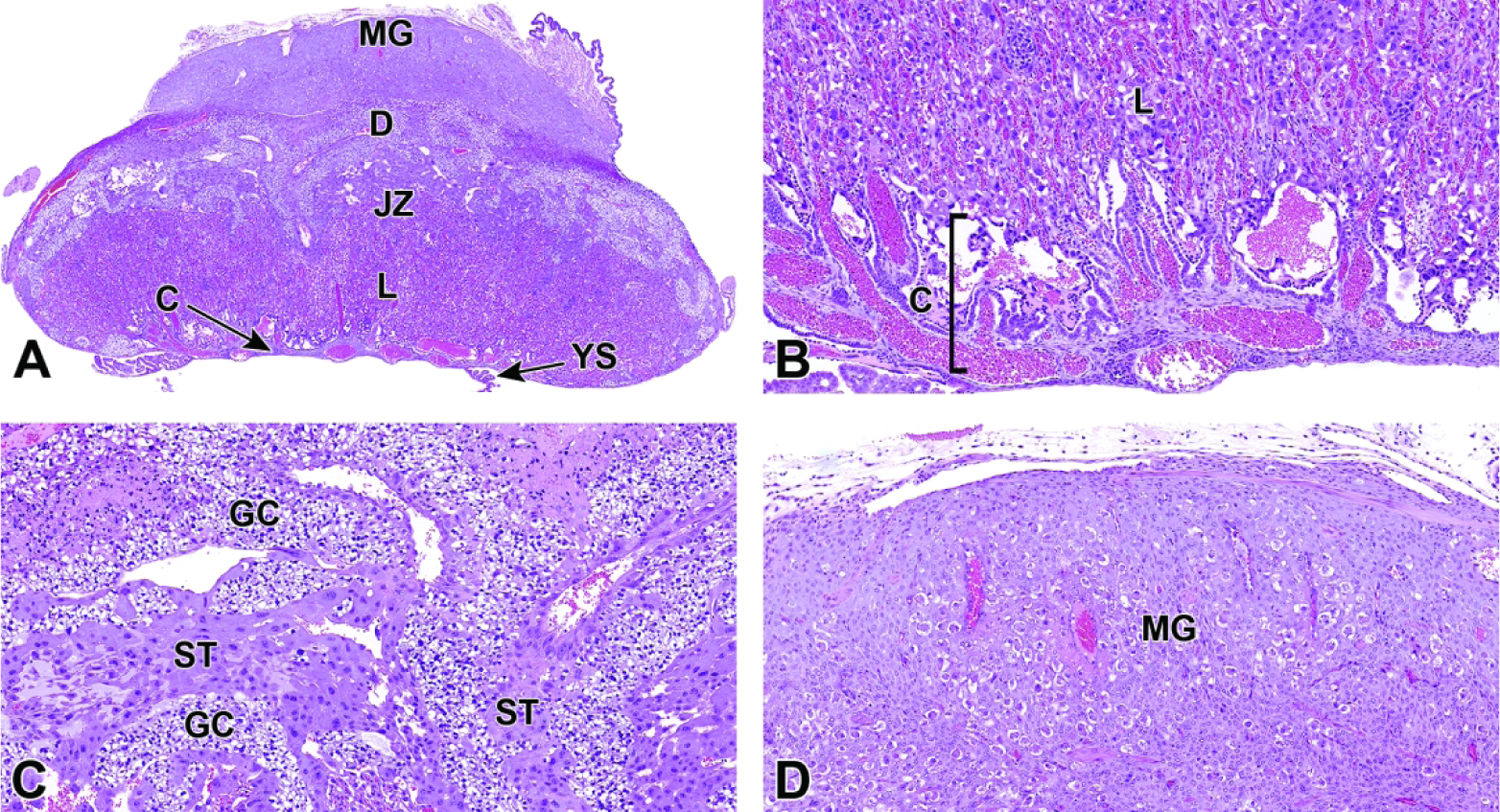
Representative images of a definitive placenta cross-section at E16.5 showing early evidence of regression. Figure A: Low magnification of a placenta cross-section highlighting the maternal decidua (D), junctional zone (JZ), labyrinth (L), and chorionic plate (C). The metrial gland (MG) and yolk sac (YS) are also present. Note how the overall mass of the junctional zone is decreasing. Figures B and C: Higher magnifications show the irregular blood-filled spaces in the labyrinth and chorionic plate (Figure B) and junctional zone (Figure C). Note the intertwining islands of spongiotrophoblasts (ST) and glycogen cells (GC) within the junctional zone. Figure D: Higher magnification of the metrial gland. Although not apparent at this magnification, the metrial gland uterine natural killer (uNK) cells are beginning to diminish at this stage.
Following the induction of the labyrinth at E8.5, trophoblast giant cell invasion continues, with several additional types of trophoblast giant cells differentiating to form the placental layers. Inside the labyrinth, the cytotrophoblasts and syncytiotrophoblast I and II cells continue to differentiate at E10.0.27,59,59 Simultaneously, spongiotrophoblast cells and parietal giant cells of the junctional zone continue to differentiate and line vessels that exist throughout the junctional zone and serve as venous sinusoids to transport blood back towards the maternal interface after nutrient and gas exchange has occurred in the labyrinth.3,59 The maternal and embryonic blood circulations throughout the placenta circulate via a countercurrent exchange arrangement such that deoxygenated embryonic blood flows through the umbilical vessels toward the labyrinth and then out to the junctional zone before reversing back to the base of the placenta as it returns to the embryo.59 The oxygenated maternal blood flows into the deep placenta from spiral arteries in the decidua where it merges into the maternal blood spaces of the labyrinth to sluggishly meander toward the placental base before reversing to move back toward the draining maternal vessels in the uterine wall. Throughout the labyrinth, maternal sinusoids are located in close proximity to the nearby parallel, tortuous embryonic vessels; despite their nearness, embryonic and maternal circulations do not mix anywhere at any time during gestation. Interactions between trophoblast cells and the maternal and fetal circulation in the mouse placenta with discussion of the countercurrent blood exchange has been well documented.5 Up until the beginning of organogenesis (about E8.0), embryonic nRBCs in endothelial-lined (i.e., embryo-derived) vessels within the labyrinth contain nuclei, and thus are termed “primitive;” these precursor erythroid elements are immature but functional.27,69 With the transition to hemotrophic nutrition (beginning at E10.0), erythropoiesis begins to shift from yolk sac blood islands and the aorta-gonad mesonephros to hematopoietic stem cell colonies in the embryonic liver.69 This transition is visible because liver-derived RBCs are anucleated, and thus are termed “definitive” (or mature). As gestation progresses, the ratio of primitive (nucleated) to definitive (anucleated) RBCs in umbilical vessels and trophoblast-lined embryonic blood spaces in the labyrinth shifts until most cells are anucleated by approximately E14.5.2,69
After the onset of organogenesis and an increase in maternal/embryonal blood exchange, the overall placental volume increases almost 9-fold from E10.5 to E18.5.27,69 The bulk of this increase is attributed to the expansion of the labyrinth as it fills with both embryonic and maternal blood.27,69 At the time the definitive placenta attains full function (E12.5), the labyrinth itself comprises half of the entire placental weight; however, placental weight plateaus around E14.0 and remains steady for the remainder of gestation.27 Additionally, by E14.5 cytotrophoblasts that surround the labyrinth vessels have begun to fuse, thus creating several bridge forms.4 At this time, the fused cytotrophoblasts have several protrusions that allow the cells in the syncytiotrophoblast I and II layers below to protrude through the cytotrophoblast layer into the maternal blood spaces and release hormones and other embryo-derived secretions into the blood.4 These cells continue to undergo dynamic changes, and by E16.5 the nuclei of the cytotrophoblasts occupy the bulk of the cell’s total volume (Figure 32).4
Figure 32.
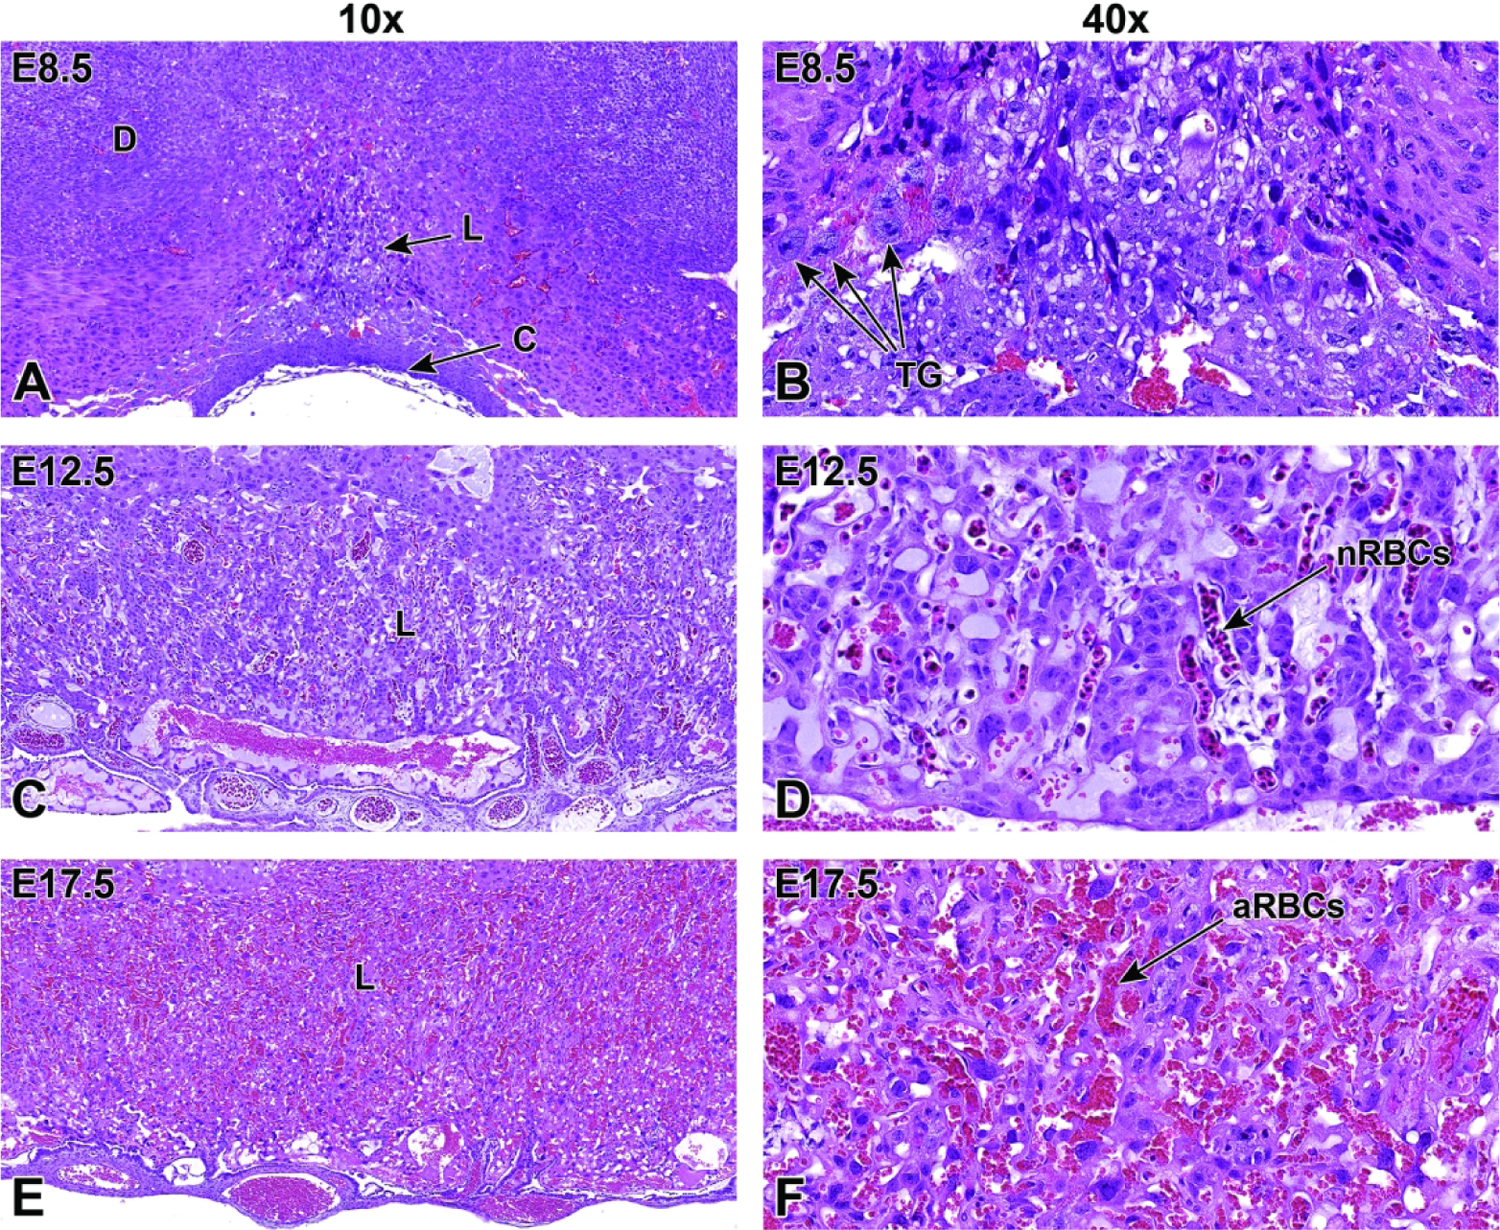
Representative images of labyrinth development from its induction at E8.5 to near birth at E17.5 showing the increase in size and intermingling of maternal and embryonic blood spaces. Figures A and B: At E8.5, the formation of the labyrinth (L) is induced when the allantois fuses with the chorionic plate (C), yielding a partially vascularized tissue comprised of trophoblast and embryonic endothelial cells. The trophoblast giant (TG) cells are involved in remodeling of the maternal decidua (D) at this state. Figures C and D: By E12.5, the highly vascularized labyrinth consists of layers of trophoblast separating parallel embryonic vessels containing many embryonal nucleated (immature or “primitive”) red blood cells (nRBCs). Within the labyrinth, the maternal and embryonic blood spaces are separated by three layers of trophoblast cells and by a layer of embryonal endothelial cells. The trilaminar trophoblast includes a single discontinuous layer of mononuclear sinusoidal trophoblast giant cells that line the maternal sinusoids and two continuous layers of syncytiotrophoblast cells that envelop the embryonal endothelial cells. Figures E and F: By E17.5, the vascular channels in the labyrinth become more prominent with the embryonic and maternal vasculature containing higher blood volumes, and the embryonic vessels contain mainly anucleated (mature or “definitive”) red blood cells (aRBCs).
Like the trophoblast giant cells of the labyrinth, the spongiotrophoblast and glycogen cells of the junctional zone go through continued modification after becoming established by about E9.5. By E10.5, the spongiotrophoblast cells have diverged to form a sheet that more closely resembles a mass of cells near the ectoplacental cone.59 By E12.5, the junctional zone is composed primarily of spongiotrophoblast cells. From the onset of junctional zone differentiation through the end of gestation, the numbers of spongiotrophoblast cells increase by 4-fold while the numbers of glycogen cells rise by 250-fold.59 At E12.5, the spongiotrophoblast cells appear as densely packed cells with many ribosomes and mitochondria occupying their cytoplasm.4 In contrast, the glycogen cells are expanded by glycogen-filled cytoplasm that also contains many mitochondria.4 Because of the large quantities of glycogen present in the glycogen cells, they appear as large, clear cells in a typical H&E-stained section but are filled with brilliant pink granules when stained with periodic acid-Schiff (PAS) (Figure 33).59 After E14.5, glycogen cells increase in quantity in the junctional zone and gather near the maternal venous sinuses that transport blood out of the placenta.4 It is still unclear whether glycogen cells maintain any direct contact with the maternal blood spaces of the junctional zone.4 The glycogen cells of the junctional zone also frequently extend through, and past, the nonmigratory spongiotrophoblast layer that invades the decidua and occasionally downward into the labyrinth layer.59 An overview of specific cell lineages throughout the entirety of placental development is provided (Supplemental Table 3), as is a table of cell specific markers for important placental cell populations (Supplemental Table 4) (Figures 34, 35, 36).
Figure 33.
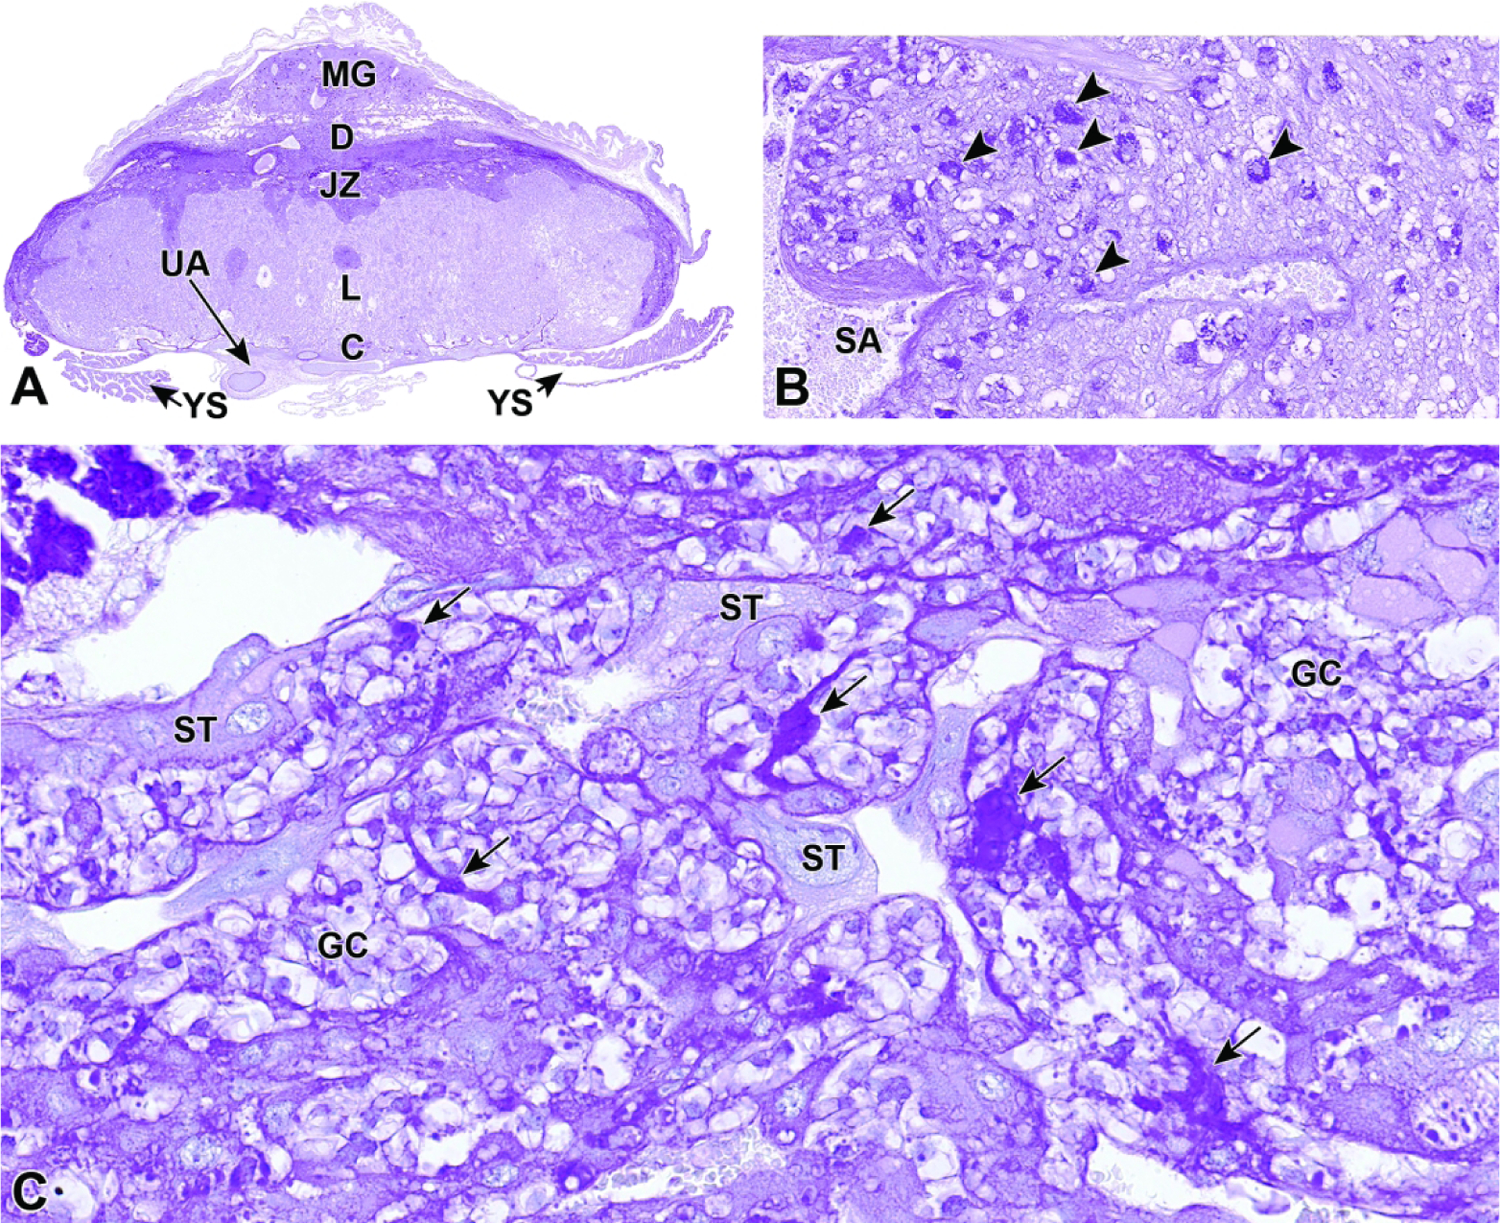
Representative images from an E18.5 placenta visualized with a periodic acid–Schiff (PAS) stain highlighting glycogen (bright magenta) within select placental tissues and cell populations. Glycogen content in the normal placenta is thought to regulate fetal blood glucose levels in early pregnancy and decreases gradually towards term. Figure A: Glycogen is found mainly in the metrial gland (MG), maternal decidua (D), and junctional zone (JZ) at this time point. Figure B: A higher magnification of the metrial gland showing glycogen that is concentrated in uterine natural killer (uNK) cells (arrowheads). Figure C: A higher magnification of the junctional zone highlighting accumulation of glycogen in a specialized trophoblast subtype termed glycogen cells (GC; arrows); note the lack of PAS staining in the spongiotrophoblast (ST) cells. Other abbreviations: C = chorionic plate, L = labyrinth, SA = spiral artery, UA = umbilical artery, YS = yolk sac.
Figure 34.
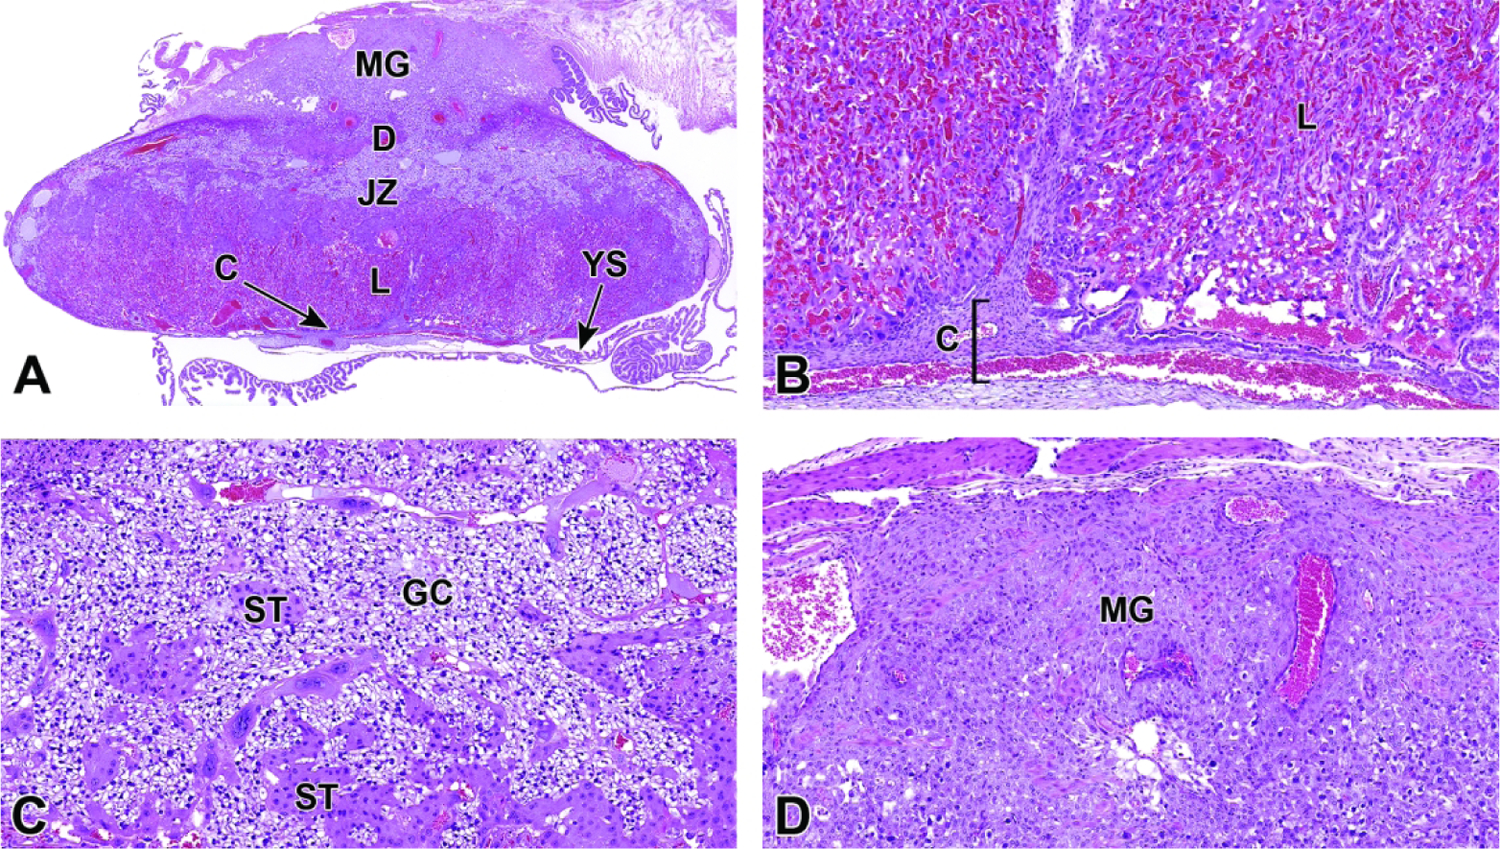
Representative images of a definitive placenta cross-section at E17.5. Figure A: Low magnification highlighting the maternal decidua (D), junctional zone (JZ), labyrinth (L), and chorionic plate (C). The maternal decidua is considerably reduced in mass compared to its peak development at E14.5. The metrial gland (MG) and yolk sac (YS) are also present. Figure B: Near term, the embryonic blood vessels in the labyrinth contain mainly mature (anucleated) red blood cells. Figure C: The junctional zone continues to contain large quantities of glycogen cells (GC) and spongiotrophoblast (ST) cells. Figure D: Higher magnification of the metrial gland. Similar to the maternal decidua, the metrial gland is considerably reduced in mass at this stage, in preparation for birth.
Figure 35.
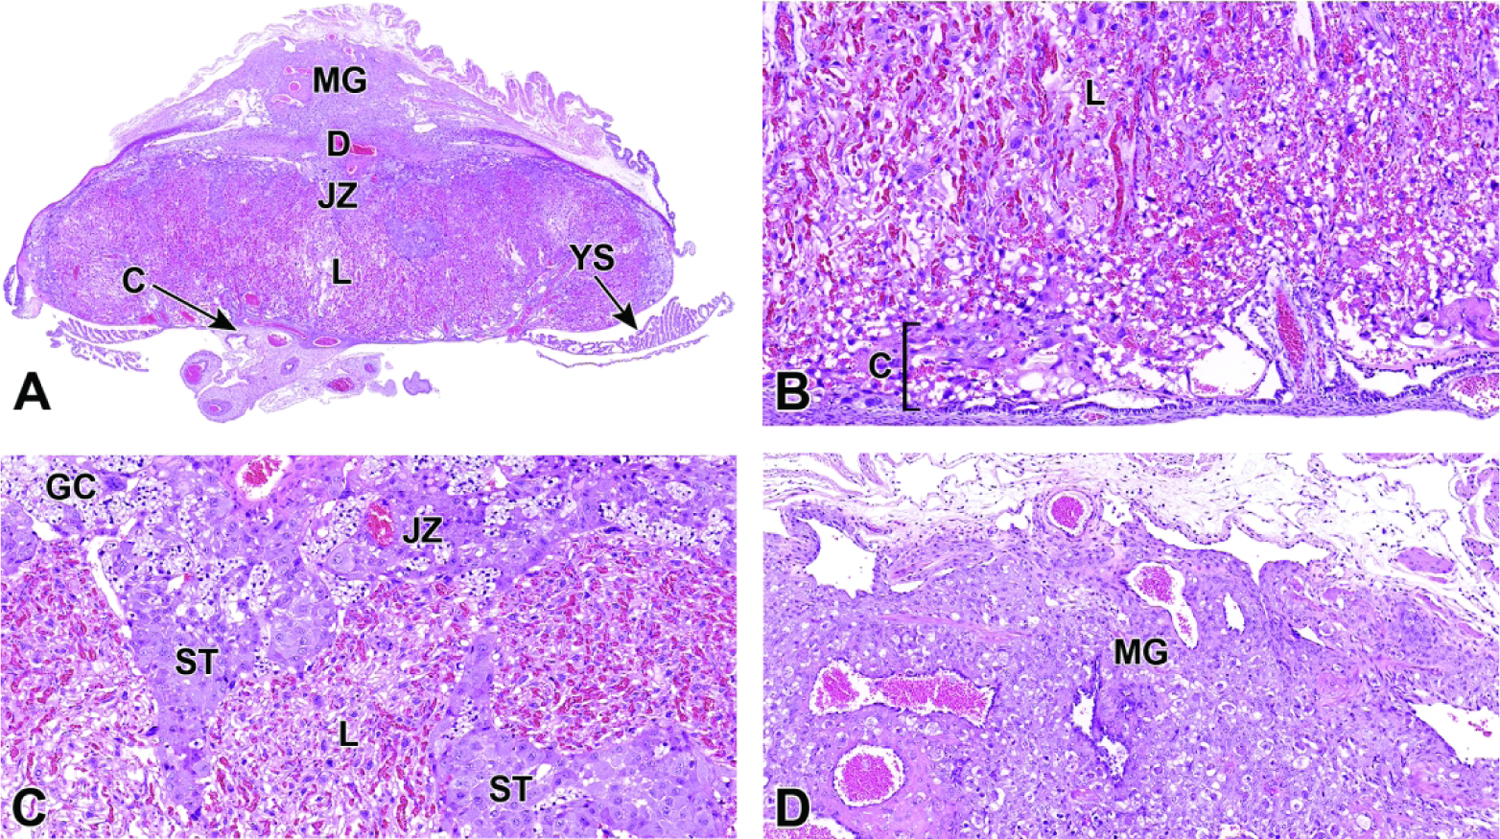
Representative images of the near-term definitive placenta at E18.5. Figure A: Low magnification of a placenta cross-section highlighting the maternal decidua (D), junctional zone (JZ), labyrinth (L), and chorionic plate (C). The maternal decidua continues to degenerate in preparation for birth. The metrial gland (MG) and yolk sac (YS) are also indicated. Figures B-D: The substantial decrease in overall mass includes widespread attenuation of the trophoblast layers in the labyrinth (Figure B) and junctional zone (Figure C), and there is continued regression of the metrial gland (Figure D). Other abbreviations: ST = spongiotrophoblasts, GC = glycogen cells
Figure 36.
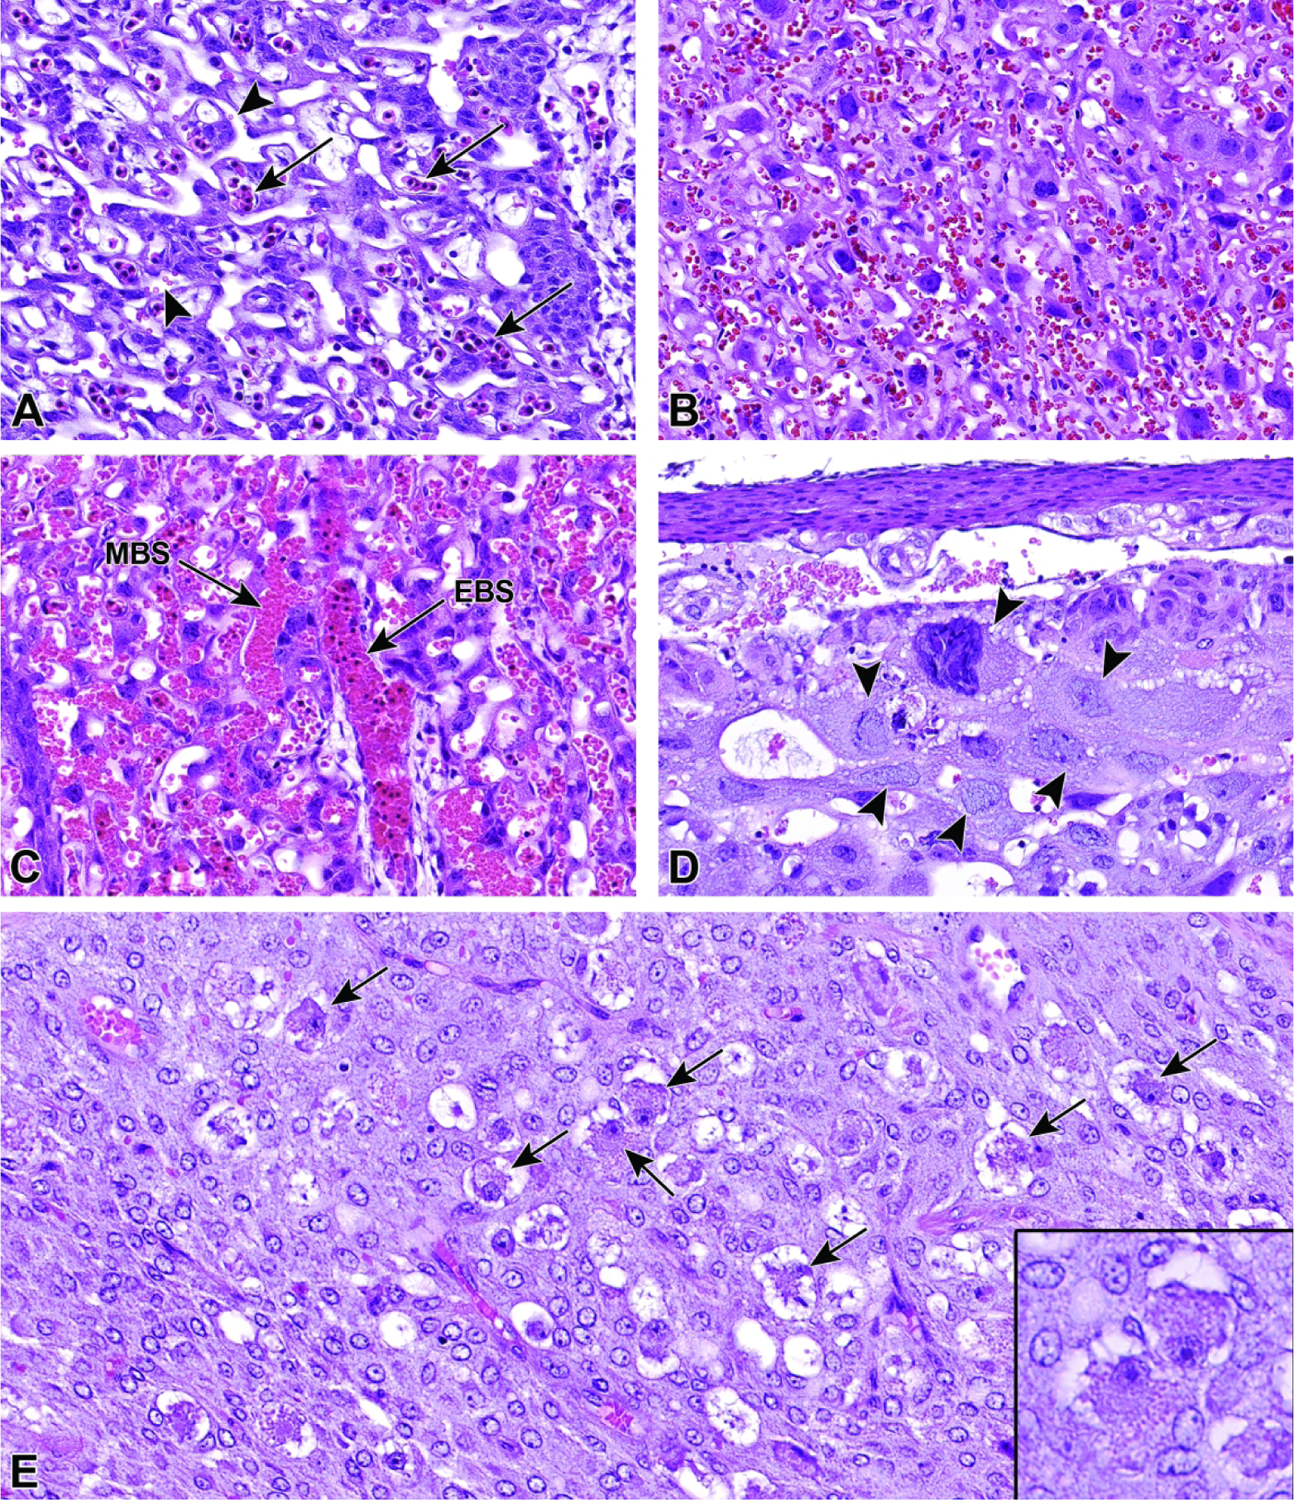
Representative images of specific cell types throughout mouse placental development. Figure A: In the labyrinth at E12.5, the embryonic blood spaces primarily contain nucleated (immature or “primitive”) embryonic red blood cells (arrows) whereas the maternal blood spaces contain smaller anucleated red blood cells (arrowheads). Figure B: Compared to Figure A, at E16.5 the blood spaces contain primarily anucleated (mature or “definitive”) red blood cells. Figure C: At E14.5, the intermingling embryonic blood spaces (EBS) and maternal blood spaces (MBS) can more easily be distinguished by the type of blood cells contained within each. Note that the embryonic vessels contain a mixture of immature and mature red blood cells. Figure D: At E11.5, trophoblast giant cells (arrowheads) located at the boundary between the maternal decidua and junctional zone can be identified by their large size as well as their large nuclei that are packed with polyploid (endoreduplicated) DNA. Figure E: At E16.5, the uterine natural killer (uNK) cells (arrows) become concentrated in the metrial gland within the maternal decidua. A higher magnification of the uNK cells is provided in the inset.
Immunohistochemical Staining
Immunohistochemistry (IHC) is an important tool for pathologists. Key IHC endpoints in placental evaluation include targeting specific cell lineages to understand the tissue structure’s cellular makeup and visualizing the dispersion of certain cell types. This type of staining can be used for diagnostic purposes as well as accentuating normal development. For our purposes, select IHC stains were chosen to stain E18.5 placentas, highlighting specific cell lineages near term (Figures 37, 38, 39, 40). At this timepoint there is much degeneration as the placenta prepares to detach in preparation for birth. However, highlighting the cell types that are present, as well as noting those that are diminishing, can be of equal importance when analyzing the growth and development of this transient structure.
Figure 37.
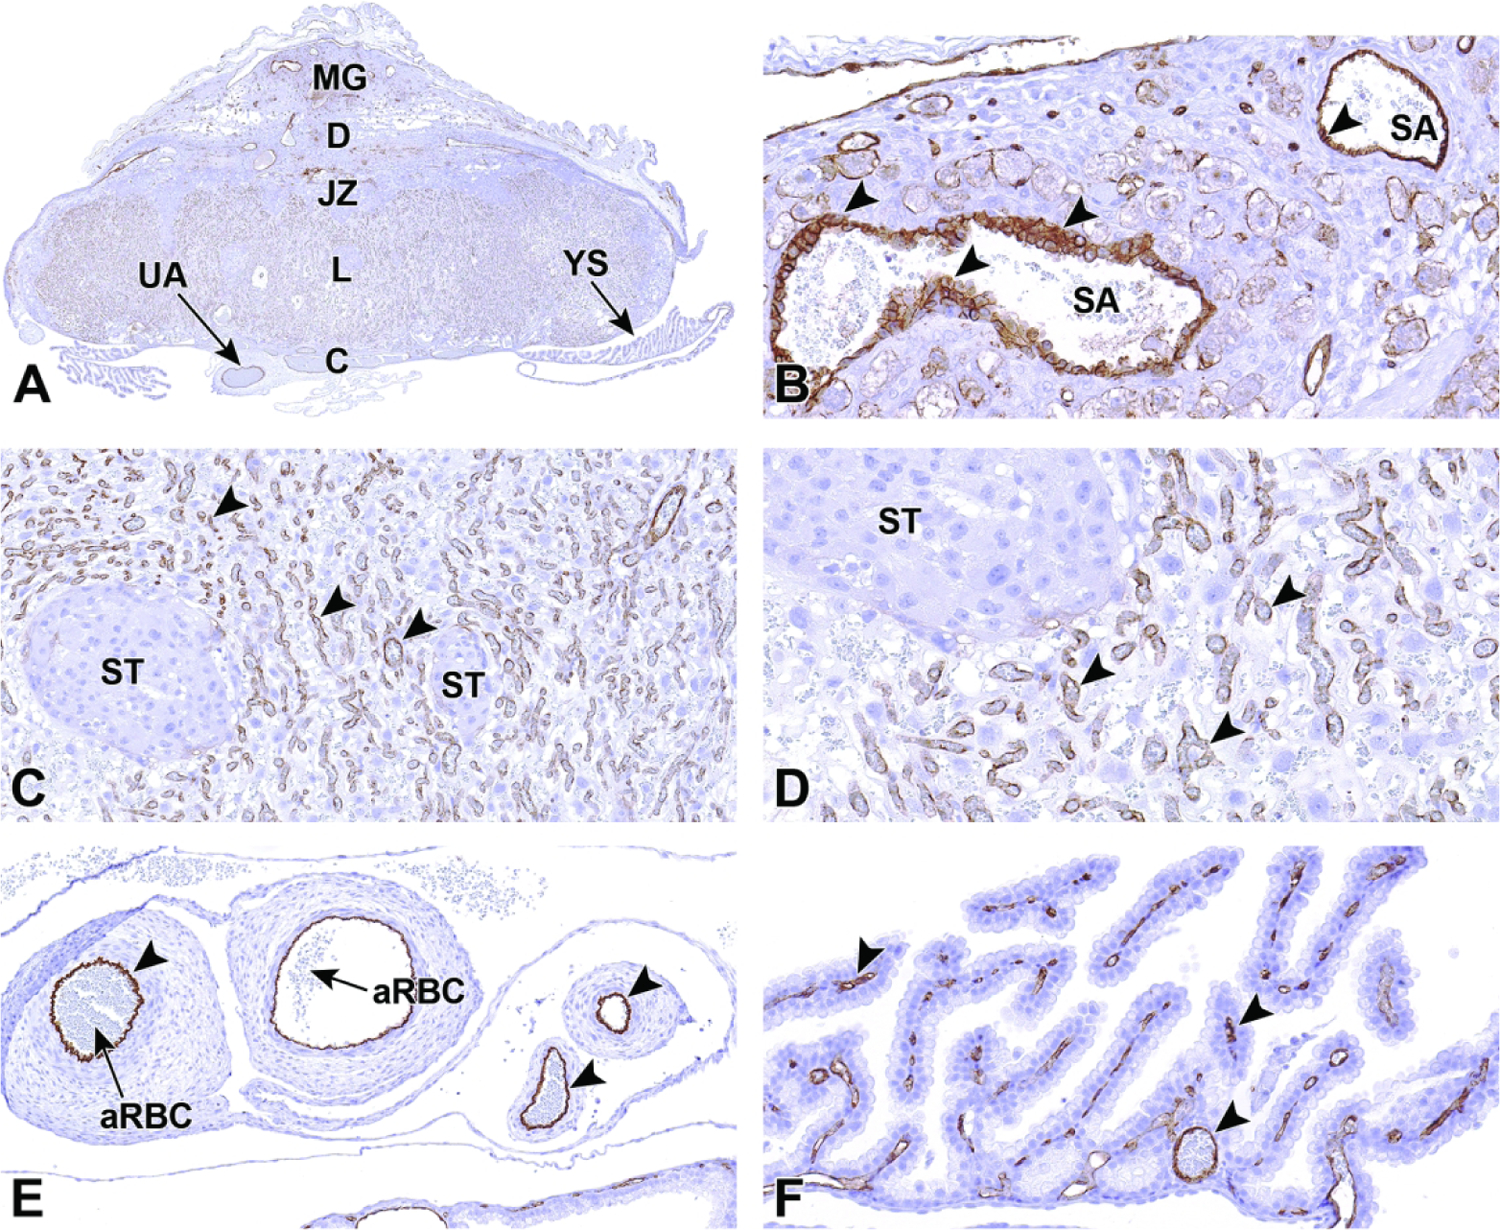
Representative images from an E18.5 placenta visualized with a CD31 immunohistochemical stain to highlight endothelial cells (arrowheads in all figures). CD31 is an integral membrane glycoprotein that mediates cell-to-cell adhesion and is expressed at high levels on endothelial cells. Figure A: At low magnification, the overall vascular nature of the placenta and metrial gland (MG) is apparent. Figure B: High magnification of the metrial gland (MG in Figure A). The endothelial cells that line the maternal-derived spiral arteries (SA) in the metrial gland show typical membranous brown cytoplasmic staining. Figures C and D: High magnification of the labyrinth (L in Figure A). The labyrinth is where most nutrient and oxygen exchange occurs. This region is highly vascular with endothelial cells lining fetal blood vessels but not maternal sinusoids. Figure E: The endothelial lining of the embryo-derived umbilical arteries (UA in Figure A), shown in cross section, with intraluminal anucleated (mature) red blood cells (aRBC) is highlighted with this stain. Figure F: The yolk sac (YS in Figure A) vasculature also express CD31. Other abbreviations: C= chorionic plate, D = decidua.
Figure 38.
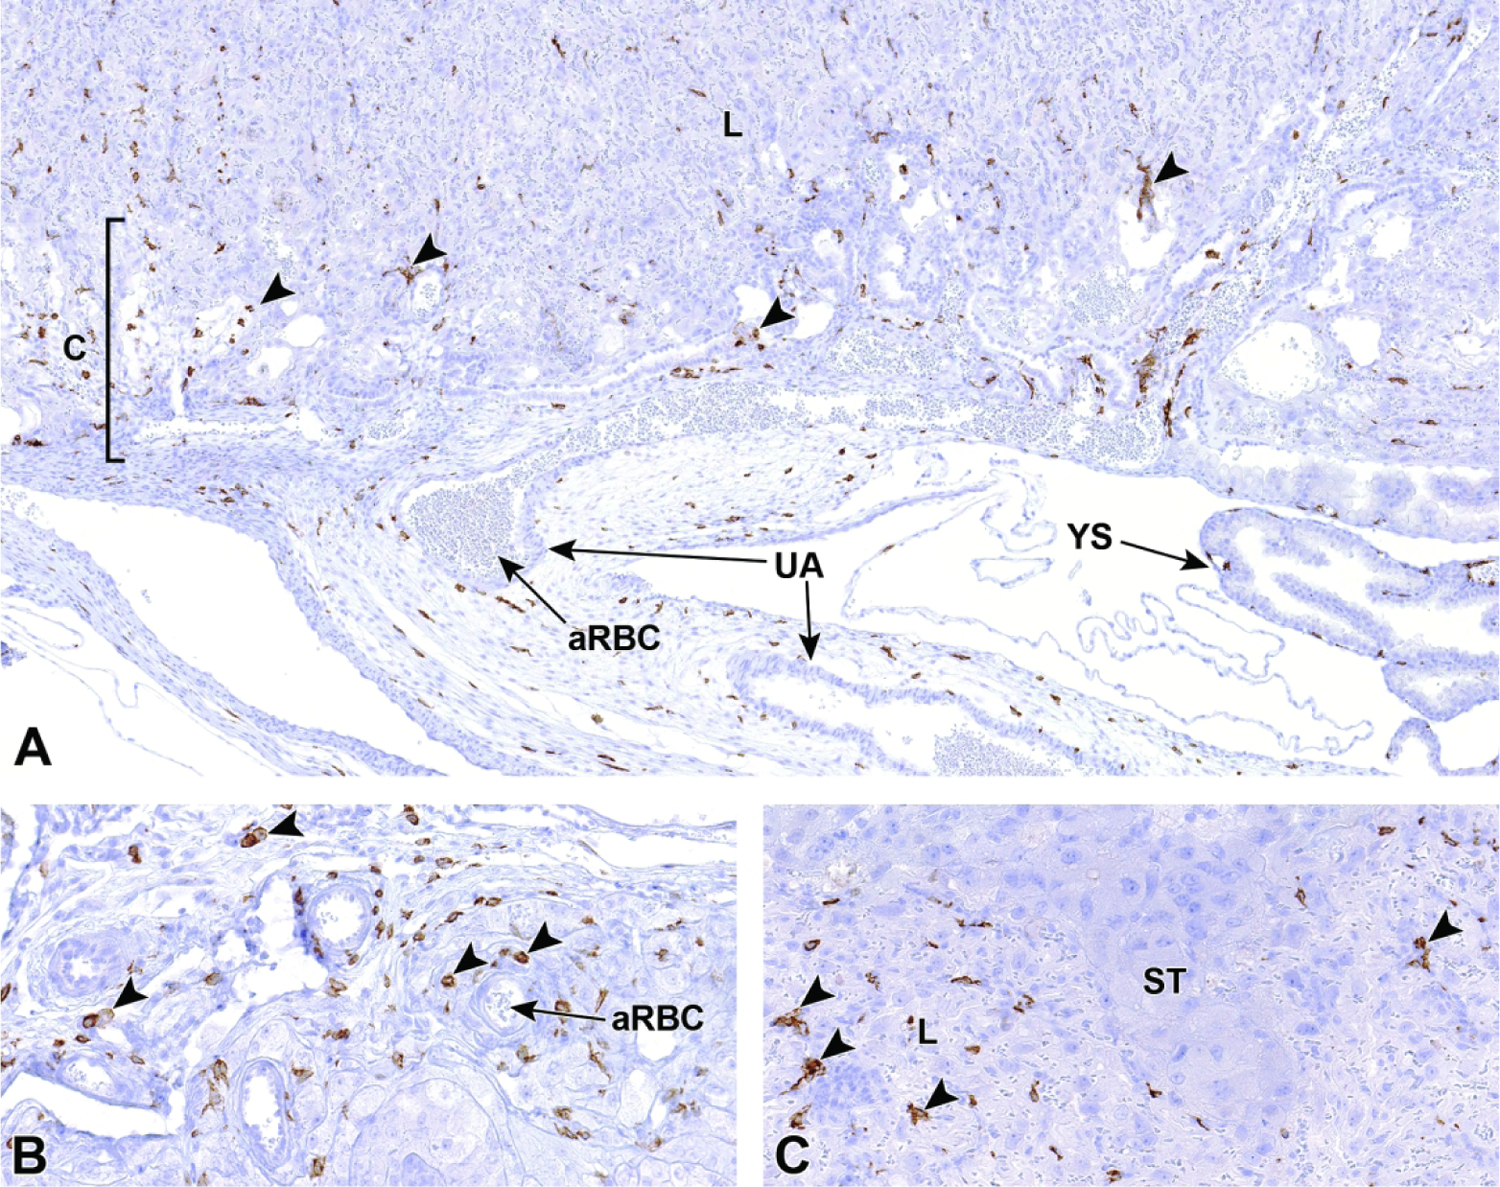
Representative images from an E18.5 placenta visualized with an F4/80 immunohistochemical stain highlighting macrophages. F4/80 is a mature mouse cell surface glycoprotein expressed at high levels on various macrophage lineages. At this time point, macrophages (arrowheads in all figures) are found throughout most placental layers, becoming more concentrated in areas like the metrial gland and peripheral tissue of the placenta as it detaches from the uterus. Figure A: Below the junctional zone, macrophages can be seen scattered throughout the labyrinth (L), chorionic plate (C) and connective tissue surrounding the umbilical arteries (UA) and yolk sac (YS). Figure B: Higher magnification of the chorionic plate showing scattered macrophages throughout the mesenchymal tissue. Figure C: The junctional zone contains spongiotrophoblasts (ST) and has few to no macrophages compared to the underlying labyrinth. Other abbreviation: aRBC = anucleated (mature) red blood cells.
Figure 39.
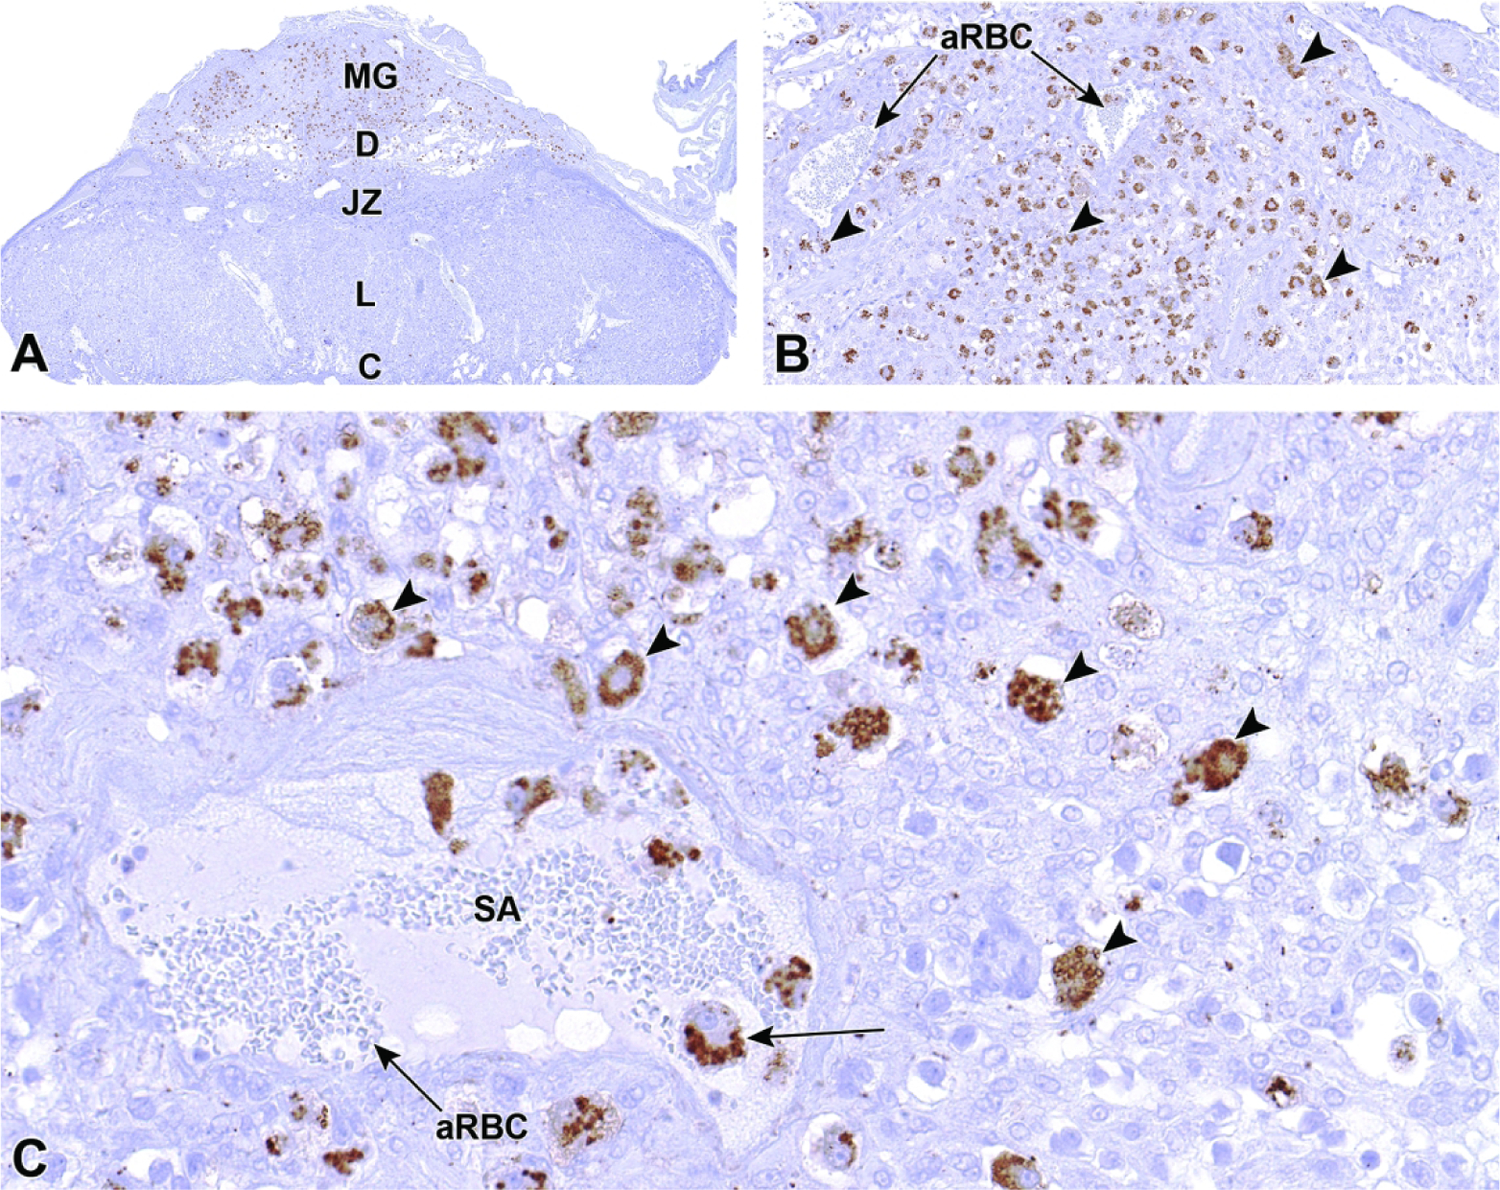
Representative images from an E18.5 placenta visualized with a perforin immunohistochemical stain, highlighting cytoplasmic granules in uterine natural killer (uNK) cells (arrowheads in all figures). Perforin is a glycoprotein released by natural killer (NK) cells of the immune system and is responsible for pore formation in cell membranes of target cells. Figures A and B: The majority of uNK cells are dispersed throughout the metrial gland (MG) at this time point as the placenta prepares to detach near term. Figure C: The uNK cells in the metrial gland contain numerous large, perforin-laden (brown-staining) cytoplasmic granules, several of which are present within the lumen of a maternal spiral artery (SA). Other abbreviations: C= chorionic plate, D = decidua, JZ = junctional zone, L = labyrinth, aRBC = anucleated (mature) red blood cells.
Figure 40.
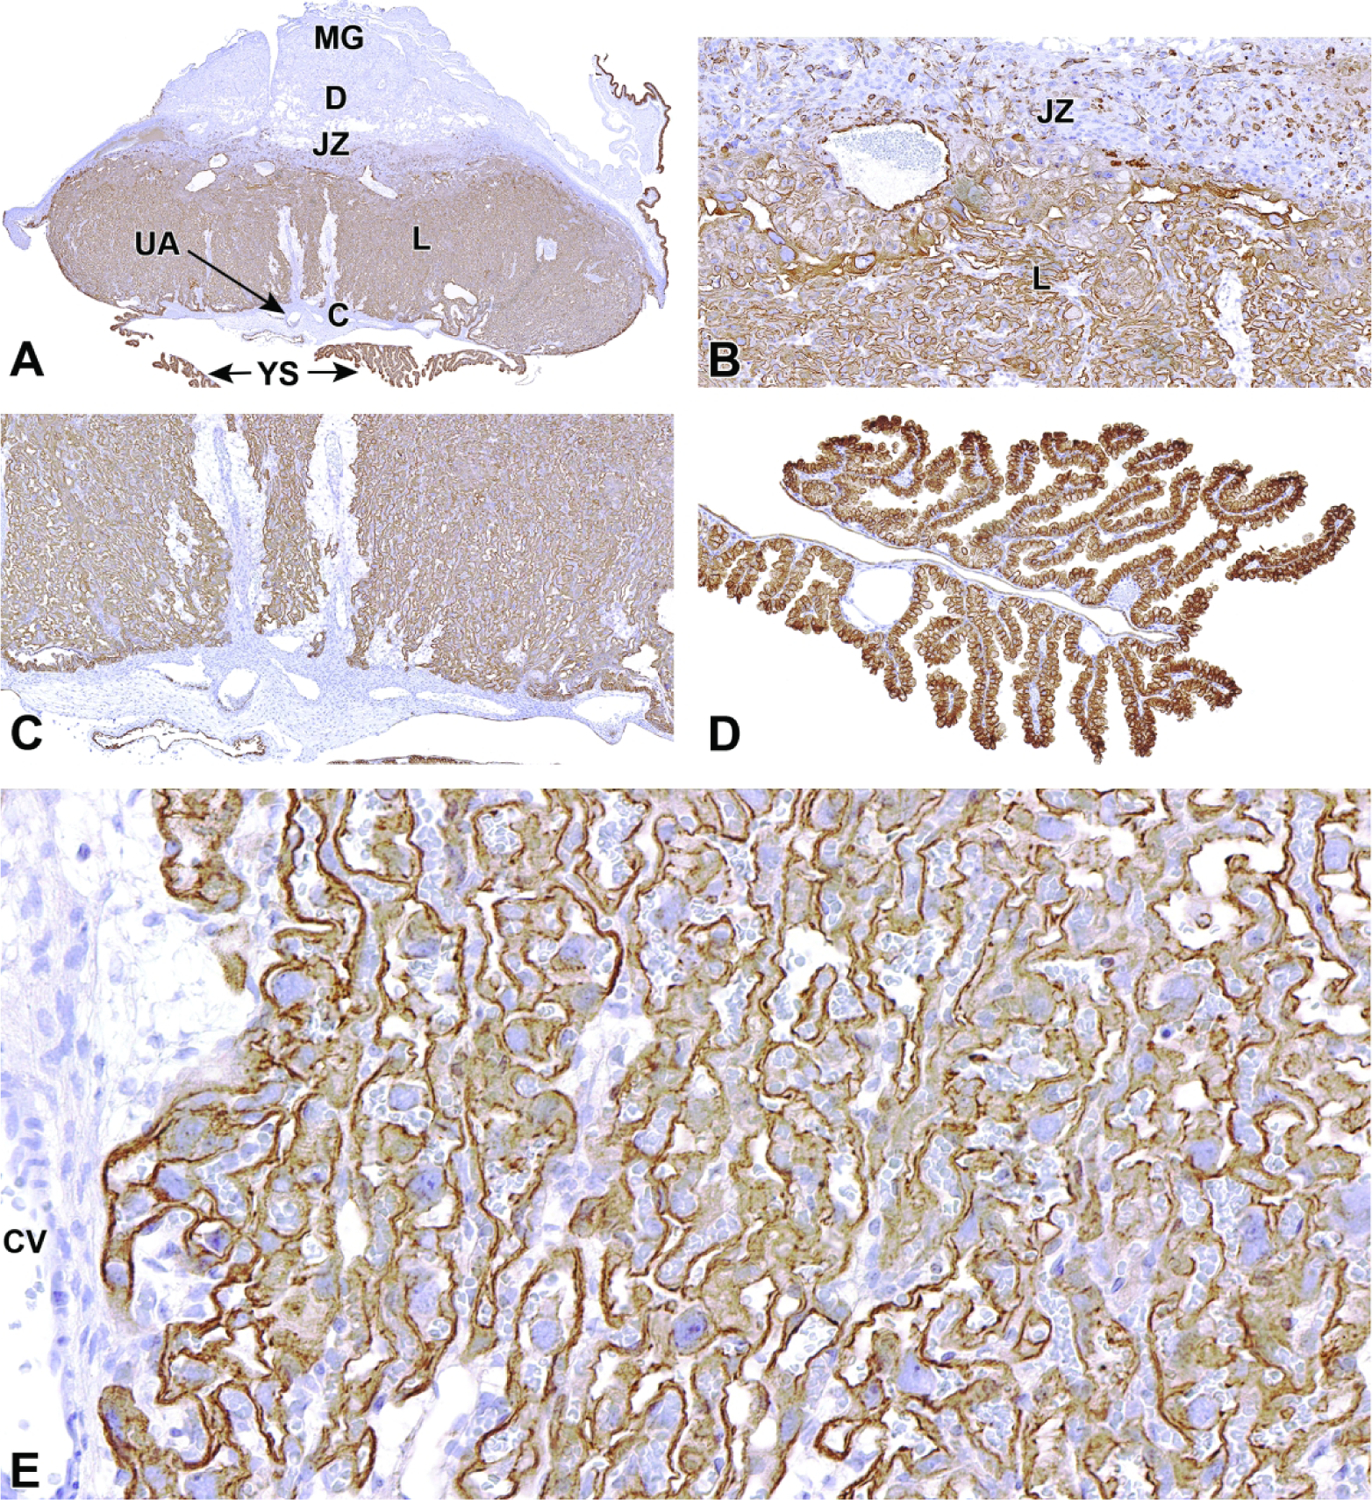
Representative images from an E18.5 placenta visualized with a cytokeratin 18 (CK18) immunohistochemical stain, highlighting an epithelial cytoskeletal protein in trophoblasts (including intermediate trophoblasts, cytotrophoblasts, and syncytiotrophoblasts) in the labyrinth (L in Figure A) and cuboidal epithelium in the yolk sac (YS in Figure A). Trophoblast cells separate and regulate material exchanges between maternal blood sinuses and fetal blood vessels. Figure A: The majority of CK18-stained cells are found within the labyrinth, where the bulk of trophoblast cells exist. Figure B: The border between the junctional zone (JZ in Figure A) and labyrinth is defined by the differing concentrations of trophoblast cells in these layers. Figure C: The border between the labyrinth and chorionic plate (C in Figure A) shows the lack of trophoblast cells within the chorionic mesenchyme. Figure D: Cuboidal epithelium lining the yolk sac diffusely expresses CK18. Figure E: A higher magnification of the labyrinth highlighting the continuity of the vascular networks defined by the various trophoblast cells. Other abbreviations: CV = chorionic vessel, D = decidua, MG = metrial gland, UA = umbilical artery.
Abnormal Placental Anatomy and Development
Cell Specific Mechanisms
Extraembryonic tissues (i.e., placenta and umbilical cord) are essential for normal development and overall health of the embryo during gestation. The placenta is regularly impacted by genetic mutations and toxicants leading to overt structural abnormalities, but even subtle functional insufficiencies associated with insufficient placental mass may result in intrauterine growth retardation (IUGR) of the embryo that can subsequently cause late embryonic death or postnatal-onset disease.6 Despite the slightly different structures of human and murine placentas, their forms and functions are largely the same and thus subject to the same kinds of placental defects. Both murine and human placentas rely on maternal blood from the uterus to enter the placenta through the decidua and then filter through the analogous structures of the labyrinth (murine) or villous tree (human).71 Because placental complications may impact both embryonic and maternal health, clinical understanding of normal and abnormal placental development is essential for researchers involved with evaluating mouse models of human developmental disease and physicians tasked with maintaining healthy pregnancies. This section will focus on common structural lesions in the mouse placenta throughout gestation, which are similar across mouse stocks and strains (Figures 41, 42, 43, 44, 45, 46 and Table 2).72
Figure 41.
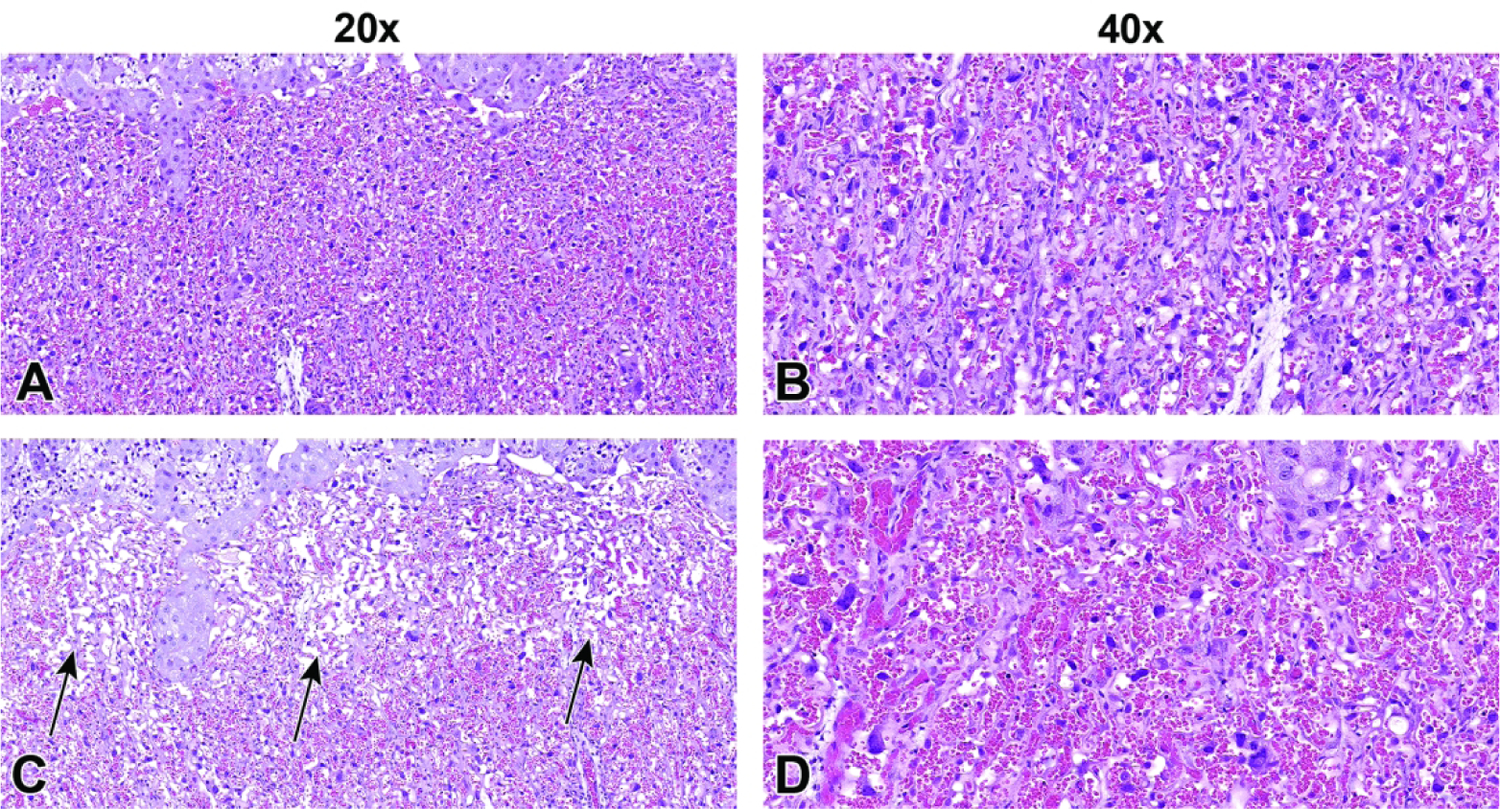
Comparative images of abnormal labyrinth development, representing atrophy and congestion at E17.5 following experimental treatment. Figures A and B: Labyrinth from a control mouse showing normal vascular morphology. Figure C: Substantial atrophy (arrows), characterized by decreased labyrinth trophoblasts and other cellular contents (compare to Figure A). Figure D: Labyrinth congestion characterized by higher blood volumes expanding the vasculature (compare to Figure B). Both conditions can result in poor maternal and fetal blood exchange (i.e., placental insufficiency). Figures A and C, original scan = 20x. Figures B and D, original scan = 40x.
Figure 42.
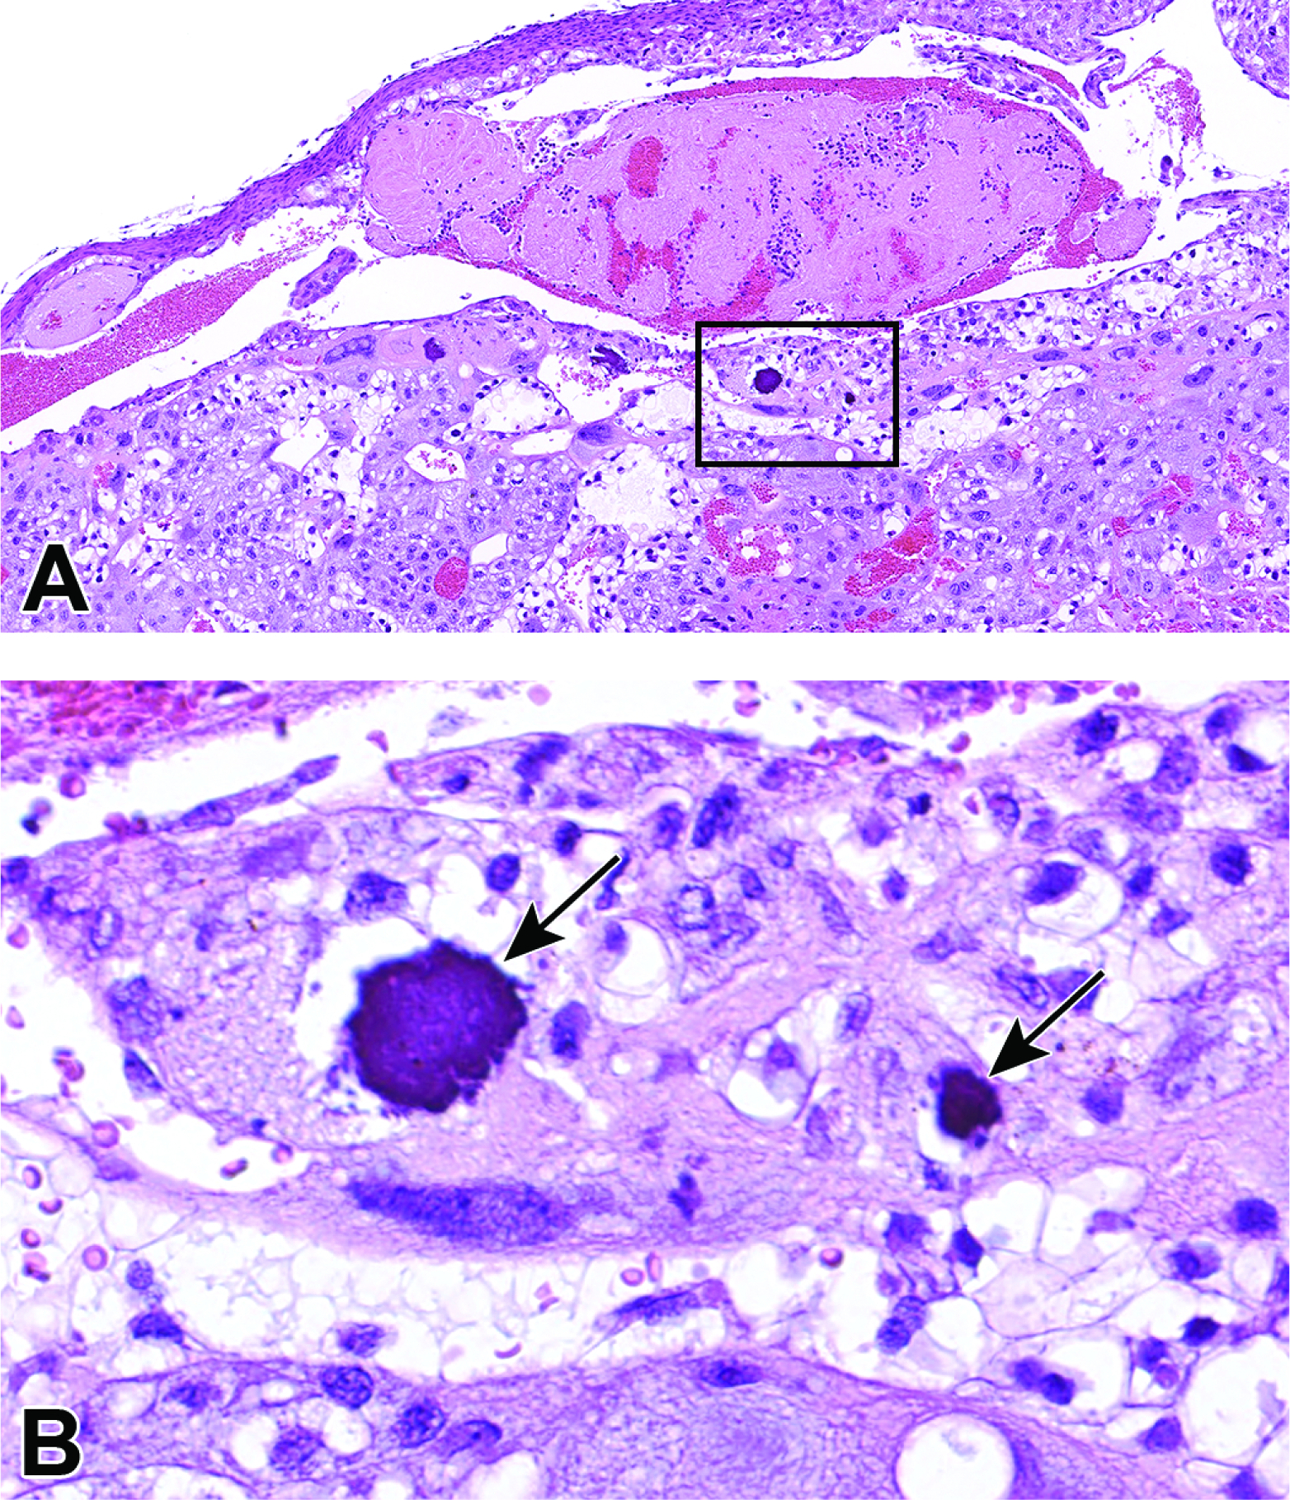
Thrombus formation and associated mineralization in an E17.5 placenta following experimental treatment. Figure A: An early thrombus in a maternal vessel within the decidua. Note the trapped blood cells (bright red areas) within the thrombus (pale pink mass) and mineral foci (boxed) in the adjacent maternal decidua. Figure B: Higher magnification of boxed region in Figure A showing two foci of mineralization (arrows). Mineralization in the placenta can be a normal finding when placentas are near term. Mineralization at earlier time points could be an indicator of previous cell degeneration or necrosis related to improper placental function or poor blood exchange.
Figure 43.
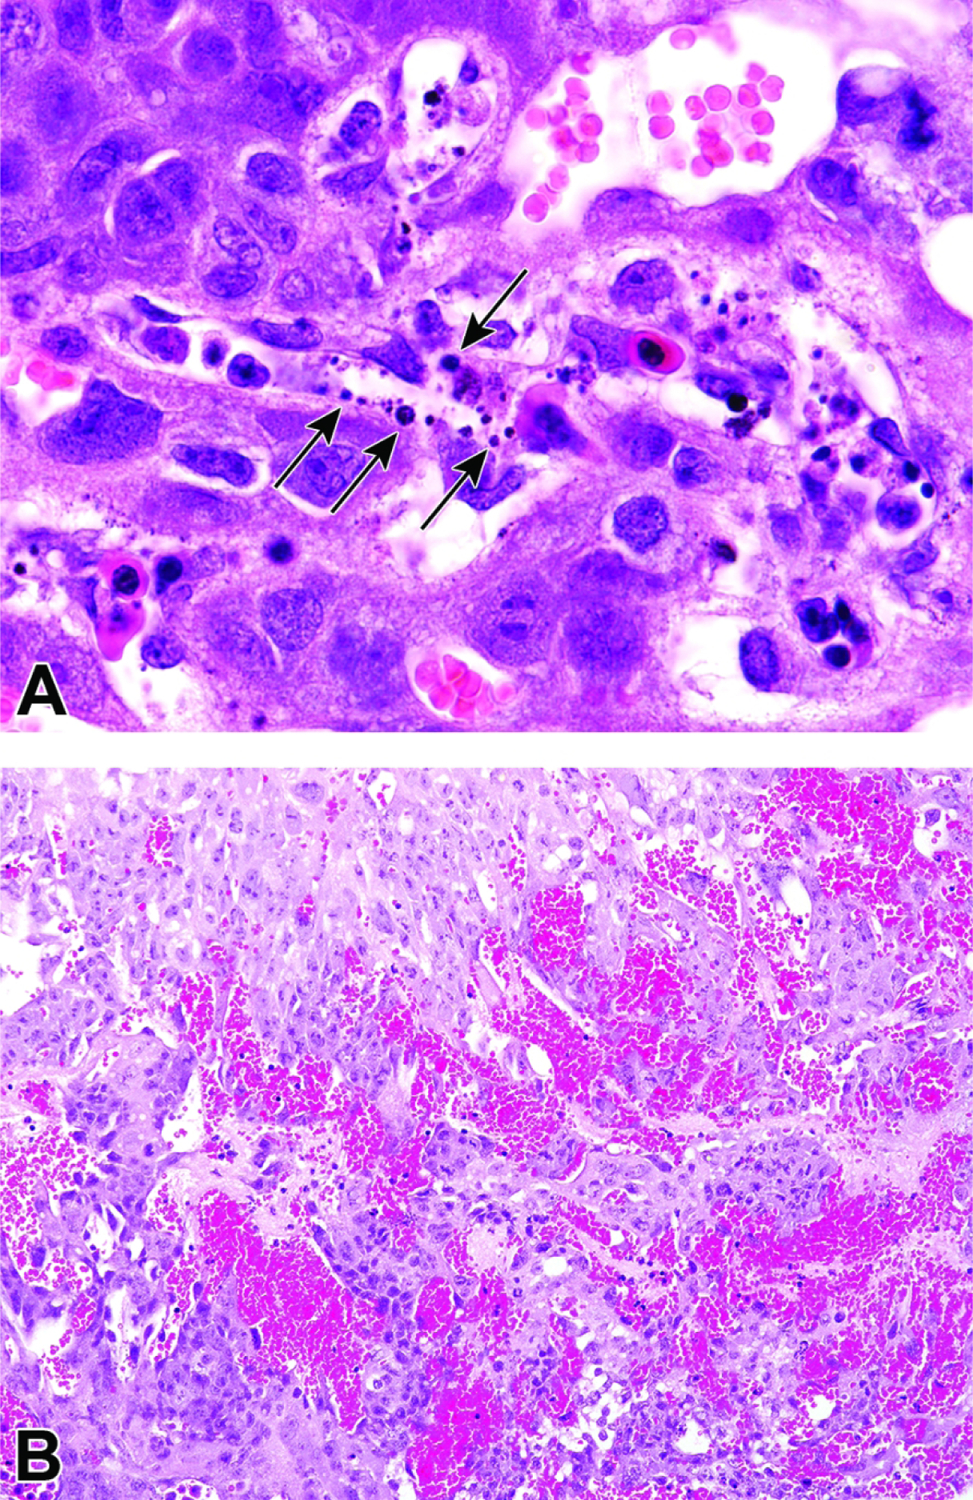
Examples of embryonic endothelial cell death and hemorrhage in the placental labyrinth. Figure A: Embryonic endothelial cell death (arrows) in the labyrinth of an E11.5 embryo that resulted from experimental viral infection. Figure B: A developmental abnormality in an E12.5 knockout embryo that resulted in labyrinthine hemorrhage. Placental hemorrhage generally occurs in the labyrinth or junctional zone where most maternal and fetal blood exchange takes place.
Figure 44.
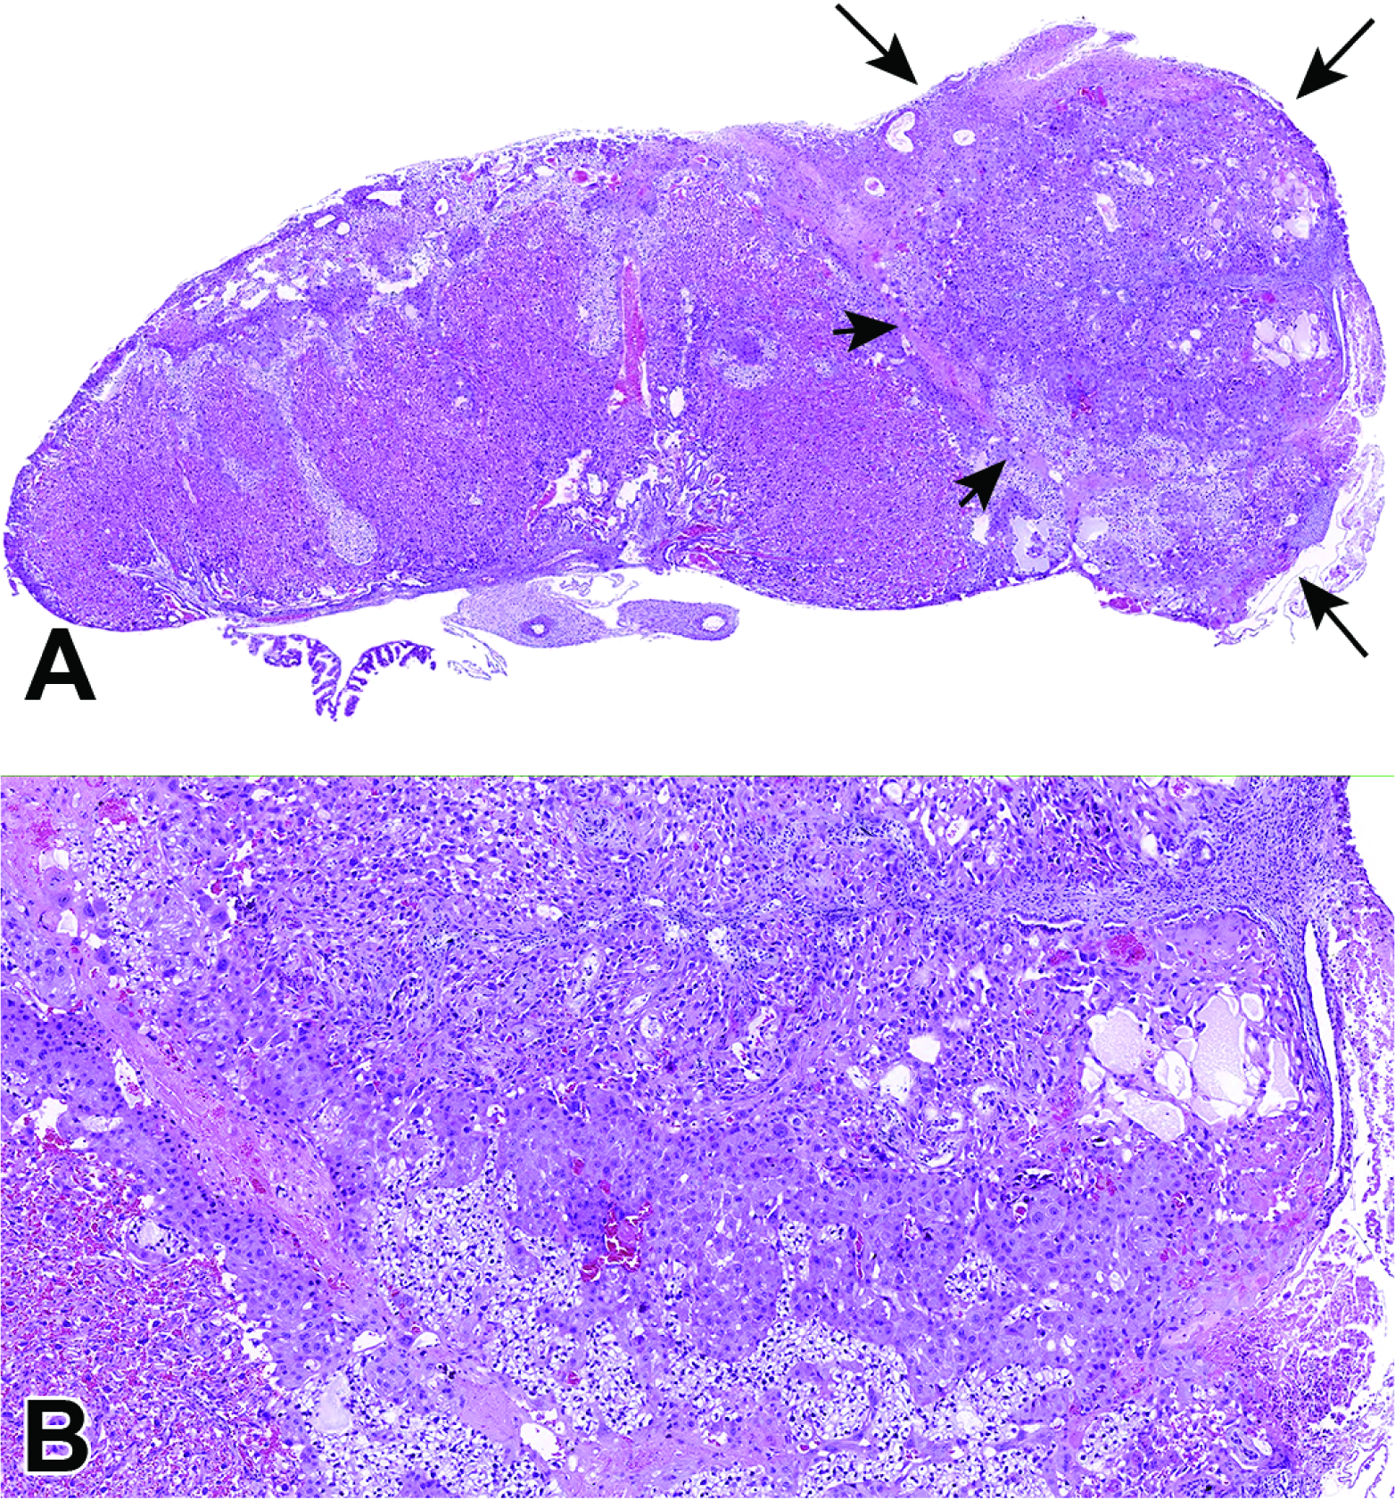
Representative images of a placental resorption site at E17.5 formed during twin development. Figure A: Focal placental resorption (arrows highlight the margins of this region) characterized by a mass of disordered tissue containing remnants of junctional zone and maternal decidua tissue. The border between the disorganized resorption site and the functioning (zonally organized) placenta can be clearly seen (short arrows). Figure B: Higher magnification of the placental resorption site demonstrating marked jumbling of the placental layers. Note the adjacent normal labyrinth in lower left-hand corner.
Figure 45.
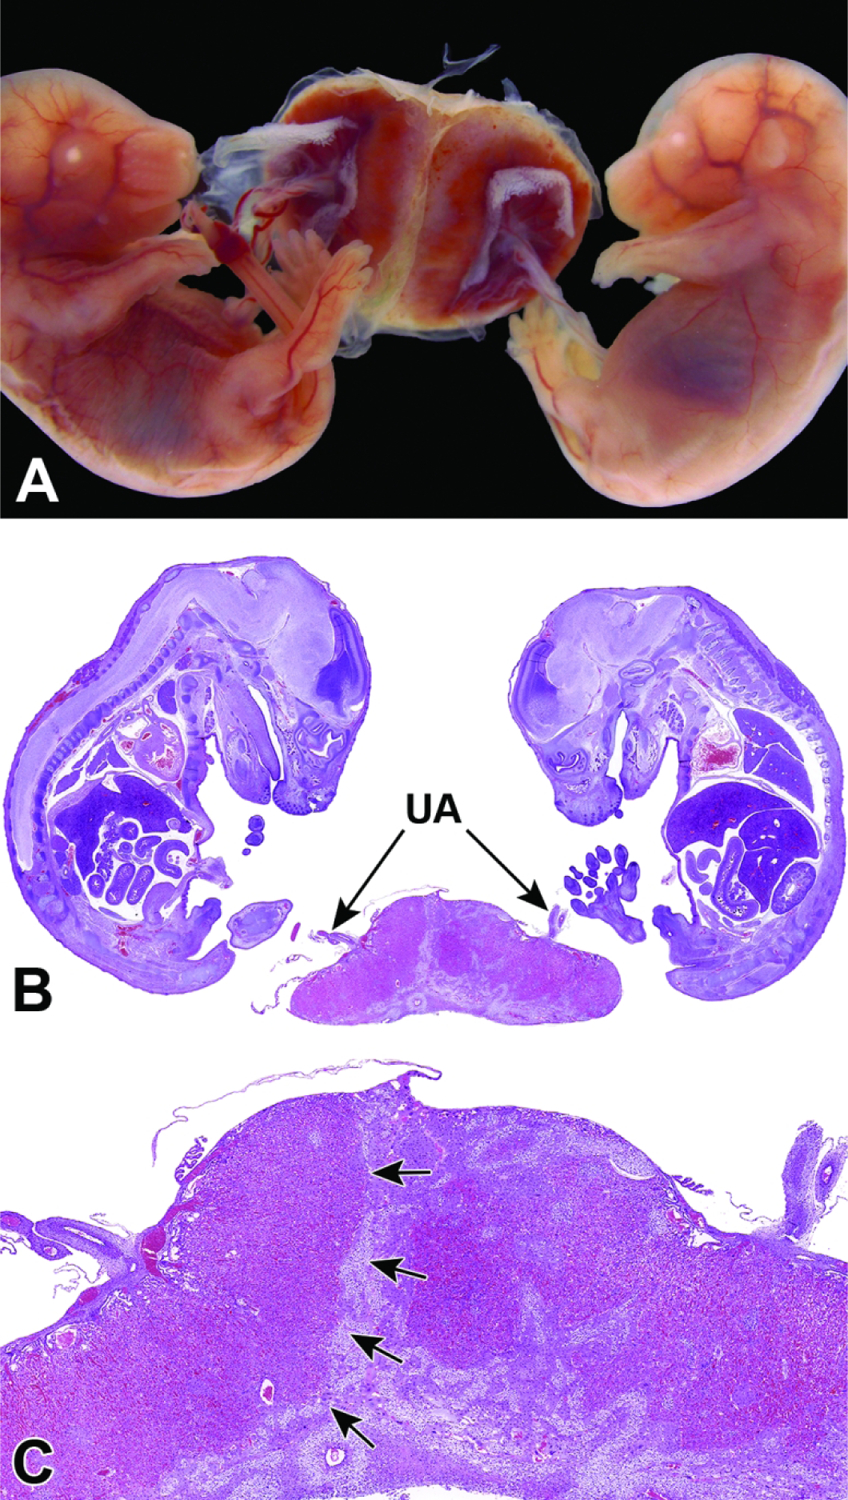
Example of twinning with a fused placenta at E15.5. Figure A: Gross image of twin embryos sharing a fused placenta. The embryo shown on the right is slightly smaller and paler than its counterpart on the left. Figure B: Low magnification of twin embryos sharing a fused placenta supporting two sets of umbilical arteries (UA). Figure C: Higher magnification of fused placenta and separate uterine arteries with a clear border (arrows) between the two placentas where there is chorionic fusion. Note the disorganization of the placenta associated with the right embryo. Intertwin growth discrepancy is a common finding and is likely due to differential nutrient exchange, oxygen supply, and waste removal within the respective placentas.
Figure 46.
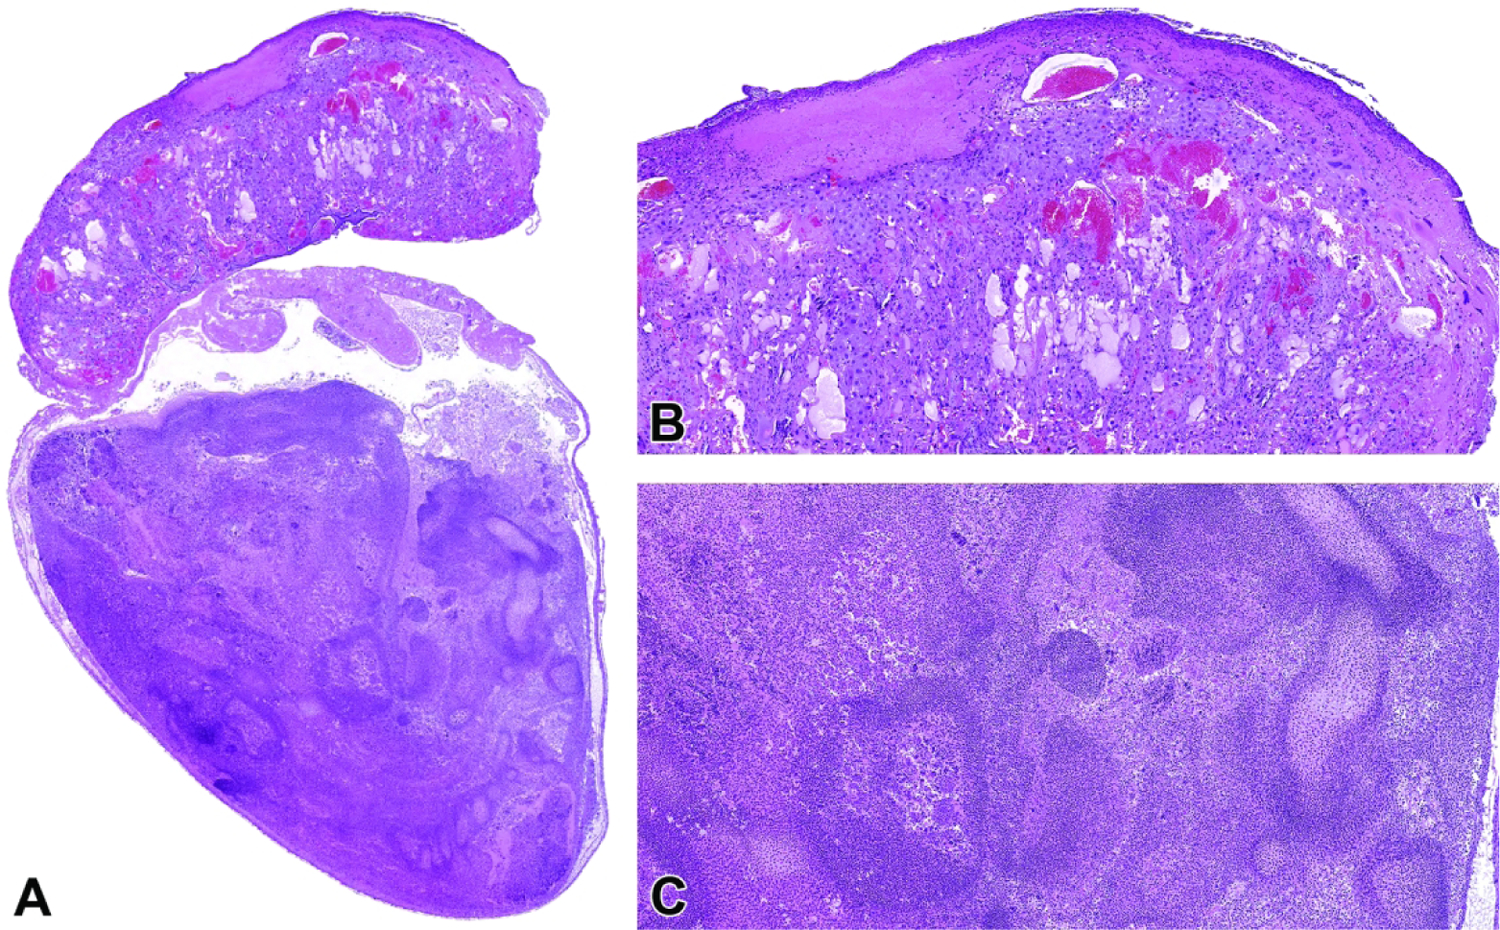
Representative images of a necrotic embryo and placenta at E18.5. Figure A: Low magnification of a necrotic embryo (bottom) and associated placenta (top) with enveloping yolk sac and amnion still intact. Figures B and C: Higher magnifications of the necrotic placenta (B) and embryo (C). 181×112mm (300 × 300 DPI)
Table 2.
Primary Placental Defects Associated with Embryonic Lethal Phenotypes
| Affected Structure | Potential Lesions and Timing | Proposed Defect | References |
|---|---|---|---|
| Decidua | G: reduced volume H: fewer cells and vessels TD: Variable (usually before E10.5) |
Formation and development | 1 |
| Ectoplacental cone | G + H: decreased cone size TD: E6.5 to E8.0 |
Formation and development | 2,3 |
| Yolk sac | G + H: blood vessels and blood islands fewer and smaller TD: E8.5 to E10.0 |
Hematopoiesis | 4–13 |
| Vascularization | 4–11,13–29 | ||
| Chorioallantois | G + H: separation of the allantois and chorion TD: E9.5 to E11.0 |
Chorioallantoic fusion | 17,26,27,30–45 |
| Labyrinth Trophoblast Lineages |
G: altered placental size (increased or decreased) H: hyperplasia and/or hypoplasia of one or multiple lineages, usually leading to altered labyrinthine vascularity TD: E9 to E11 (altered expansion of trophoblast) E13 to E16 (abnormal genesis of terminal villi) |
Differentiation of: Giant cells Labyrinthine Spongiotrophoblasts Stem Cells |
46–50 51–57 48,51,57–63 38,44,54,64,65 |
| Developmental Processes | Similar to those for trophoblast lineages | Endothelial / trophoblast interactions | 66,67 |
| G + H: similar to trophoblast lineages, but may be none TD: any stage through birth (E19) |
Nutrient transport | 68,69 | |
| Similar to those for trophoblast lineages | Vascularization (vasculogensis, angiogenesis) | 22–25,29,39,50,55,70–86 |
NOTE: Structures are listed in the order in which they first gain a prominent role in placental structure and function
Abbreviations: G = gross (macroscopic) findings, H = histopathologic (microscopic) findings, TD = time of death (approximate)
Adapted from Pathology of the Developing Mouse: A Systematic Approach87
Nagao T, Saitoh Y, Yoshimura S. Possible mechanism of congenital malformations induced by exposure of mouse preimplantation embryos to mitomycin C. Teratology. 2000;61(4):248–261.
Yamamoto H, Flannery ML, Kupriyanov S, et al. Defective trophoblast function in mice with a targeted mutation of Ets2. Genes Dev. 1998;12(9):1315–1329.
Sebastiano V, Dalvai M, Gentile L, et al. Oct1 regulates trophoblast development during early mouse embryogenesis. Development. 2010;137(21):3551–3560.
Shi W, van den Hurk JA, Alamo-Bethencourt V, et al. Choroideremia gene product affects trophoblast development and vascularization in mouse extra-embryonic tissues. Dev Biol. 2004;272(1):53–65.
Satyanarayana A, Gudmundsson KO, Chen X, et al. RapGEF2 is essential for embryonic hematopoiesis but dispensable for adult hematopoiesis. Blood. 2010;116(16):2921–2931.
Oike Y, Takakura N, Hata A, et al. Mice homozygous for a truncated form of CREB-binding protein exhibit defects in hematopoiesis and vasculo-angiogenesis. Blood. 1999;93(9):2771–2779.
Shalaby F, Rossant J, Yamaguchi TP, et al. Failure of blood-island formation and vasculogenesis in Flk-1-deficient mice. Nature. 1995;376(6535):62–66.
Dickson MC, Martin JS, Cousins FM, Kulkarni AB, Karlsson S, Akhurst RJ. Defective haematopoiesis and vasculogenesis in transforming growth factor-b1 knock out mice. Development. 1995;121(6):1845–1854.
Matsumoto N, Kubo A, Liu H, et al. Developmental regulation of yolk sac hematopoiesis by Kruppel-like factor 6. Blood. 2006;107(4):1357–1365.
Takashima S, Kitakaze M, Asakura M, et al. Targeting of both mouse neuropilin-1 and neuropilin-2 genes severely impairs developmental yolk sac and embryonic angiogenesis. Proc Natl Acad Sci U S A. 2002;99(6):3657–3662.
Baudino TA, McKay C, Pendeville-Samain H, et al. c-Myc is essential for vasculogenesis and angiogenesis during development and tumor progression. Genes Dev. 2002;16(19):2530–2543.
Robb L, Lyons I, Li R, et al. Absence of yolk sac hematopoiesis from mice with a targeted disruption of the scl gene. 1995;92(15):7075–7079.
Regan CP, Li W, Boucher DM, Spatz S, Su MS, Kuida K. Erk5 null mice display multiple extraembryonic vascular and embryonic cardiovascular defects. Proc Natl Acad Sci U S A. 2002;99(14):9248–9253.
Feng Y, Yang Y, Ortega MM, et al. Early mammalian erythropoiesis requires the Dot1L methyltransferase. Blood. 2010;116(22):4483–4491.
Weinstein M, Yang X, Deng C. Functions of mammalian Smad genes as revealed by targeted gene disruption in mice. Cytokine Growth Factor Rev. 2000;11(1–2):49–58.
Wang LC, Kuo F, Fujiwara Y, Gilliland DG, Golub TR, Orkin SH. Yolk sac angiogenic defect and intra-embryonic apoptosis in mice lacking the Ets-related factor TEL. EMBO J. 1997;16(14):4374–4383.
Firulli AB, McFadden DG, Lin Q, Srivastava D, Olson EN. Heart and extra-embryonic mesodermal defects in mouse embryos lacking the bHLH transcription factor Hand1. 1998;18(3):266–270.
Cui J, O’Shea KS, Purkayastha A, Saunders TL, Ginsburg D. Fatal haemorrhage and incomplete block to embryogenesis in mice lacking coagulation factor V. Nature. 1996;384(6604):66–68.
Lin Q, Lu J, Yanagisawa H, et al. Requirement of the MADS-box transcription factor MEF2C for vascular development. Development. 1998;125(22):4565–4574.
Yang JT, Rayburn H, Hynes RO. Embryonic mesodermal defects in a5 integrin-deficient mice. Development. 1993;119(4):1093–1105.
Takahashi T, Takahashi K, St John PL, et al. A mutant receptor tyrosine phosphatase, CD148, causes defects in vascular development. Mol Cell Biol. 2003;23(5):1817–1831.
Schreiber M, Wang Z-Q, Jochum W, Fetka I, Elliott C, Wagner EF. Placental vascularisation requires the AP-1 component Fra1. Development. 2000;127(22):4937–4948.
Ishikawa T, Tamai Y, Zorn AM, et al. Mouse Wnt receptor gene Fzd5 is essential for yolk sac and placental angiogenesis. 2001;128(1):25–33.
Schorpp-Kistner M, Wang Z-Q, Angel P, Wagner EF. JunB is essential for mammalian placentation. EMBO Journal. 1999;18(4):934–948.
Krüger O, Plum A, Kim J-S, et al. Defective vascular development in connexin 45-deficient mice. Development. 2000;127(19):4179–4193.
Saunders DN, Hird SL, Withington SL, et al. Edd, the murine hyperplastic disc gene, is essential for yolk sac vascularization and chorioallantoic fusion. 2004;24(16):7225–7234.
Escalante-Alcalde D, Hernandez L, Le Stunff H, et al. The lipid phosphatase LPP3 regulates extra-embryonic vasculogenesis and axis patterning. Development. 2003;130(19):4623–4637.
Fischer A, Schumacher N, Maier M, Sendtner M, Gessler M. The Notch target genes Hey1 and Hey2 are required for embryonic vascular development. 2004;18(8):901–911.
Krebs LT, Xue Y, Norton CR, et al. Notch signaling is essential for vascular morphogenesis in mice. 2000;14(11):1343–1352.
Kwee L, Baldwin HS, Shen HM, et al. Defective development of the embryonic and extraembryonic circulatory systems in vascular cell adhesion molecule (VCAM-1) deficient mice. Development. 1995;121(2):489–503.
Gurtner GC, Davis V, Li H, McCoy MJ, Sharpe A, Cybulsky MI. Targeted disruption of the murine VCAM1 gene: essential role of VCAM-1 in chorioallantoic fusion and placentation. 1995;9(1):1–14.
Yang JT, Rayburn H, Hynes RO. Cell adhesion events mediated by a4 integrins are essential in placental and cardiac development. Development. 1995;121(2):549–560.
Hunter PJ, Swanson BJ, Haendel MA, Lyons GE, Cross JC. Mrj encodes a DnaJ-related co-chaperone that is essential for murine placental development. Development. 1999;126(6):1247–1258.
Lechleider RJ, Ryan JL, Garrett L, et al. Targeted mutagenesis of Smad1 reveals an essential role in chorioallantoic fusion. 2001;240(1):157–167.
Mahlapuu M, Ormestad M, Enerbäck S, Carlsson P. The forkhead transcription factor Foxf1 is required for differentiation of extra-embryonic and lateral plate mesoderm. Development. 2001;128(2):155–166.
Hildebrand JD, Soriano P. Overlapping and unique roles for C-terminal binding protein 1 (CtBP1) and CtBP2 during mouse development. 2002;22(15):5296–5307.
Li E, Bestor TH, Jaenisch R. Targeted mutation of the DNA methyltransferase gene results in embryonic lethality. Cell. 1992;69(6):915–926.
Luo J, Sladek R, Bader JA, Matthyssen A, Rossant J, Giguere V. Placental abnormalities in mouse embryos lacking the orphan nuclear receptor ERR-b. Nature. 1997;388(6644):778–782.
Mo F-E, Muntean AG, Chen C-C, Stolz DB, Watkins SC, Lau LF. CYR61 (CCN1) is essential for placental development and vascular integrity. Molecular & Cellular Biology. 2002;22(24):8709–8720.
Oka C, Nakano T, Wakeham A, et al. Disruption of the mouse RBP-Jk gene results in early embryonic death. Development. 1995;121(10):3291–3301.
Parr BA, Cornish VA, Cybulsky MI, McMahon AP. Wnt7b regulates placental development in mice. Dev Biol. 2001;237(2):324–332.
Saxton TM, Cheng AM, Ong SH, et al. Gene dosage-dependent functions for phosphotyrosine-Grb2 signaling during mammalian tissue morphogenesis. 2001;11(9):662–670.
Stumpo DJ, Byrd NA, Phillips RS, et al. Chorioallantoic fusion defects and embryonic lethality resulting from disruption of Zfp36L1, a gene encoding a CCCH tandem zinc finger protein of the Tristetraprolin family. 2004;24(14):6445–6455.
Xu X, Weinstein M, Li C, et al. Fibroblast growth factor receptor 2 (FGFR2)-mediated reciprocal regulation loop between FGF8 and FGF10 is essential for limb induction. Development. 1998;125(4):753–765.
Inman KE, Downs KM. The murine allantois: emerging paradigms in development of the mammalian umbilical cord and its relation to the fetus. Genesis (New York, NY : 2000). 2007;45(5):237–258.
Kraut N, Snider L, Chen CM, Tapscott SJ, Groudine M. Requirement of the mouse I-mfa gene for placental development and skeletal patterning. EMBO J. 1998;17(21):6276–6288.
Riley P, Anson-Cartwright L, Cross JC. The Hand1 bHLH transcription factor is essential for placentation and cardiac morphogenesis. 1998;18(3):271–275.
Ma GT, Soloveva V, Tzeng SJ, et al. Nodal regulates trophoblast differentiation and placental development. 2001;236(1):124–135.
Takahashi Y, Carpino N, Cross JC, Torres M, Parganas E, Ihle JN. SOCS3: an essential regulator of LIF receptor signaling in trophoblast giant cell differentiation. EMBO J. 2003;22(3):372–384.
Cowden Dahl KD, Fryer BH, Mack FA, et al. Hypoxia-inducible factors 1a and 2a regulate trophoblast differentiation. Mol Cell Biol. 2005;25(23):10479–10491.
Threadgill DW, Dlugosz AA, Hansen LA, et al. Targeted disruption of mouse EGF receptor: effect of genetic background on mutant phenotype. Science. 1995;269(5221):230–234.
Uehara Y, Minowa O, Mori C, et al. Placental defect and embryonic lethality in mice lacking hepatocyte growth factor/scatter factor. Nature. 1995;373(6516):702–705.
Kozak KR, Abbott B, Hankinson O. ARNT-deficient mice and placental differentiation. 1997;191(2):297–305.
Adelman DM, Gertsenstein M, Nagy A, Simon MC, Maltepe E. Placental cell fates are regulated in vivo by HIF-mediated hypoxia responses. Genes Dev. 2000;14(24):3191–3203.
Li Y, Behringer RR. Esx1 is an X-chromosome-imprinted regulator of placental development and fetal growth. 1998;20(3):309–311.
Sachs M, Brohmann H, Zechner D, et al. Essential role of Gab1 for signaling by the c-Met receptor in vivo. 2000;150(6):1375–1384.
Takahashi K, Kobayashi T, Kanayama N. p57Kip2 regulates the proper development of labyrinthine and spongiotrophoblasts. Molecular human reproduction. 2000;6(11):1019–1025.
Xiao X, Zuo X, Davis AA, et al. HSF1 is required for extra-embryonic development, postnatal growth and protection during inflammatory responses in mice. EMBO J. 1999;18(21):5943–5952.
Sibilia M, Wagner EF. Strain-dependent epithelial defects in mice lacking the EGF receptor. Science. 1995;269(5221):234–238.
Guillemot F, Nagy A, Auerbach A, Rossant J, Joyner AL. Essential role of Mash-2 in extraembryonic development. Nature. 1994;371(6495):333–336.
Tanaka M, Gertsenstein M, Rossant J, Nagy A. Mash2 acts cell autonomously in mouse spongiotrophoblast development. Dev Biol. 1997;190(1):55–65.
Arima T, Hata K, Tanaka S, et al. Loss of the maternal imprint in Dnmt3Lmat−/− mice leads to a differentiation defect in the extraembryonic tissue. Dev Biol. 2006;297(2):361–373.
Rodriguez TA, Sparrow DB, Scott AN, et al. Cited1 is required in trophoblasts for placental development and for embryo growth and survival. 2004;24(1):228–244.
Russ AP, Wattler S, Colledge WH, et al. Eomesodermin is required for mouse trophoblast development and mesoderm formation. Nature. 2000;404(6773):95–99.
Barak Y, Nelson MC, Ong ES, et al. PPARg is required for placental, cardiac, and adipose tissue development. 1999;4(4):585–595.
Miner JH, Cunningham J, Sanes JR. Roles for laminin in embryogenesis: exencephaly, syndactyly, and placentopathy in mice lacking the laminin a5 chain. 1998;143(6):1713–1723.
Lin SP, Coan P, da Rocha ST, et al. Differential regulation of imprinting in the murine embryo and placenta by the Dlk1-Dio3 imprinting control region. Development. 2007;134(2):417–426.
Gabriel H-D, Jung D, Bützler C, et al. Transplacental uptake of glucose is decreased in embryonic lethal connexin26-deficient mice. Journal of Cell Biology. 1998;140(6):1453–1461.
Wu L, de Bruin A, Saavedra HI, et al. Extra-embryonic function of Rb is essential for embryonic development and viability. Nature. 2003;421(6926):942–947.
Anson-Cartwright L, Dawson K, Holmyard D, Fisher S, Lazzarini RA, Cross J. The glial cells missing-1 protein is essential for branching morphogenesis in the chorioallantoic placenta. Nature Genet. 2000;25(3):311–314.
Itoh M, Yoshida Y, Nishida K, Narimatsu M, Hibi M, Hirano T. Role of Gab1 in heart, placenta, and skin development and growth factor- and cytokine-induced extracellular signal-regulated kinase mitogen-activated protein kinase activation. 2000;20(10):3695–3704.
Qian X, Esteban L, Vass WC, et al. The Sos1 and Sos2 Ras-specific exchange factors: differences in placental expression and signaling properties. EMBO J. 2000;19(4):642–654.
Giroux S, Tremblay M, Bernard D, et al. Embryonic death of Mek1-deficient mice reveals a role for this kinase in angiogenesis in the labyrinthine region of the placenta. Curr Biol. 1999;9(7):369–372.
Adams RH, Porras A, Alonso G, et al. Essential role of p38a MAP kinase in placental but not embryonic cardiovascular development. Molecular cell. 2000;6(1):109–116.
Voss AK, Thomas T, Gruss P. Mice lacking HSP90b fail to develop a placental labyrinth. Development. 2000;127(1):1–11.
Morasso MI, Grinberg A, Robinson G, Sargent TD, Mahon KA. Placental failure in mice lacking the homeobox gene Dlx3. Proc Natl Acad Sci USA. 1999;96(1):162–167.
Ohlsson R, Falck P, Hellström M, et al. PDGFB regulates the development of the labyrinthine layer of the mouse fetal placenta. Dev Biol. 1999;212(1):124–136.
Wendling O, Chambon P, Mark M. Retinoid X receptors are essential for early mouse development and placentogenesis. 1999;96(2):547–551.
Gnarra JR, Ward JM, Porter FD, et al. Defective placental vasculogenesis causes embryonic lethality in VHL-deficient mice. Proc Natl Acad Sci USA. 1997;94(17):9102–9107.
Steingrímsson E, Tessarollo L, Reid SW, Jenkins NA, Copeland NG. The bHLH-Zip transcription factor Tfeb is essential for placental vascularization. Development. 1998;125(23):4607–4616.
Monkley SJ, Delaney SJ, Pennisi DJ, Christiansen JH, Wainwright BJ. Targeted disruption of the Wnt2 gene results in placentation defects. Development. 1996;122(11):3343–3353.
Shalom-Barak T, Nicholas JM, Wang Y, et al. Peroxisome proliferator-activated receptor g controls Muc1 transcription in trophoblasts. 2004;24(24):10661–10669.
Tamai Y, Ishikawa T, Bosl MR, et al. Cytokeratins 8 and 19 in the mouse placental development. Journal of Cell Biology. 2000;151(3):563–572.
Coan PM, Fowden AL, Constância M, Ferguson-Smith AC, Burton GJ, Sibley CP. Disproportional effects of Igf2 knockout on placental morphology and diffusional exchange characteristics in the mouse. 2008;586(Pt 20):5023–5032.
Ouseph MM, Li J, Chen HZ, et al. Atypical E2F repressors and activators coordinate placental development. Dev Cell. 2012;22(4):849–862.
Takeda K, Ho VC, Takeda H, Duan LJ, Nagy A, Fong GH. Placental but not heart defects are associated with elevated hypoxia-inducible factor a levels in mice lacking prolyl hydroxylase domain protein 2. Mol Cell Biol. 2006;26(22):8336–8346.
Bolon B. Pathology analysis of the placenta. In: Croy BA, Yamada AT, DeMayo F, Adamson SL, eds. The Guide to Investigations of Mouse Pregnancy. San Diego: Academic Press (Elsevier); 2014:175–188.
The formation and histogenesis of the placenta can be interrupted if the function of a gene that plays a role in the development of the placenta and its various components (cells, structures) is affected. If the gene is expressed in specific cells and placental components but is lacking in null mutant mice, the gene’s function(s) will not be available to support the normal development and function of the placenta. Loss of placenta-specific genes may arise due to spontaneous (background) or intentional (“induced”) causes, where ablation usually stems from deliberate gene targeting or toxicant-associated genetic damage, microenvironmental disruption, or receptor blockade. The impact of such insults on placental structure and function depends on when injury occurs during gestation.
The junctional zone is the less-understood fetal compartment of the murine placenta that is primarily responsible for hormone secretion, while also producing growth factors and cytokines that are necessary for normal placentation.31,73–75 It forms a barrier between the labyrinth and maternal uterine tissue and largely consists of several types of trophoblast cells including glycogen cells, parietal giant cells, and spongiotrophoblast cells after E12.5.4,31,74,76 The junctional zone also protects the fetal side of the placenta from invading maternal endothelial cells by expressing anti-angiogenic proteins in spongiotrophoblast cells.74 Studies have shown that it is essential for embryo survival. For example, Mash-2-deficient embryos die at E10.0 as the placenta lacks spongiotrophoblast cells and also suffers a reduction in the chorionic ectoderm.77 This may be due to premature trophoblast differentiation.78
One of the major roles of the junctional zone is to function as the main endocrine compartment of the placenta.31,74 It has been shown that both an increase or insufficiency in glycogen cell numbers, and therefore total glycogen, can lead to IUGR.31 Glycogen is also suspected to act as a reserve, storing energy and supplying nutrition to the placenta and embryo.31 Mice with Ascl2 null mutations demonstrate that the cells in this zone are necessary for fetal survival as these mutants have been shown to lack a junctional zone, which results in embryonic death.74 During normal development, the junctional zone expands until E16.5 but generally regresses in size by E18.5 due to modifications in cell size, proliferation, and migration.74 Because the junctional zone is filled with glycogen cells, an absence of this structure, or these cells, can in turn lead to severe birth defects caused by lack of important energy reserves and hormone production during late gestation.31,79
Many of the most common murine placental lesions are found in the labyrinth, the prime location of nutrient and gas diffusion.6,54 Without proper vascularization, oxygen and nutrient transport are impaired, thereby failing to perfuse the placenta and consistently leading to early embryonic death.54 The labyrinth provides a circulatory roadway in which maternal and fetal blood are in close proximity but remain segregated.19 Impacts to its architecture disrupt oxygen and nutrient exchange, leading to a definitive impact on fetal growth and therefore on the placenta as a whole. Because defects in this layer can lead to such an imbalance, the labyrinth is the most common site of placental failure.31 The majority of abnormalities occurring in the labyrinth of 103 mutant mice were expressed in the trophoblast cells at the time of labyrinth induction.6 This provides further evidence of the significant role proper growth of trophoblast cells plays in determining normal mouse development. Defects in labyrinth formation may result from abnormalities in other placental zones. For instance, placentas with decreased glycogen cells and spongiotrophoblasts may exhibit a marked increase in apoptosis and a reduction on labyrinth zone proliferation.76
Patterns of Placental Lesions
Placental lesions linked to prenatal or perinatal embryonic mortality have been associated with damage in any of several placental elements (Table 3).16,17,36,54 Common mechanisms of early placental dysgenesis are circulatory defects due to vascular abnormalities in the yolk sac or failed chorioallantoic fusion. Later in gestation, most placental lesions reflect altered formation of the placental labyrinth. Defects in other placental components have been reported much less often. In many cases, the pathogenesis remains unknown and a diagnosis of “small labyrinth” is given as a nonspecific end-stage change.54 Defects related to lesions in multiple placental zones may also occur if an affected gene is critical to several cell lineages.
Table 3.
Most Common Abnormal Placenta Phenotypes in Mice
| Placenta phenotype | Number of genotypes with a certain phenotype |
|---|---|
| Abnormal chorionic plate morphology | 14 |
| Abnormal ectoplacental cone morphology | 45 |
| Absent ectoplacental cone | 8 |
| Small ectoplacental cone | 18 |
| Abnormal maternal decidual layer morphology | 41 |
| Abnormal decidua basalis morphology | 7 |
| Abnormal decidua capsularis morphology | 2 |
| Abnormal placenta metrial gland morphology | 25 |
| Abnormal uterine NK cell morphology | 25 |
| Decreased uterine NK cell number | 12 |
| Increased uterine NK cell number | 8 |
| Absent placenta metrial gland | 0 |
| Abnormal placenta junctional zone morphology | 116 |
| Abnormal spongiotrophoblast layer morphology | 111 |
| Abnormal spongiotrophoblast cell morphology | 21 |
| Abnormal spongiotrophoblast size | 41 |
| Abnormal trophoblast glycogen cell morphology | 15 |
| Decreased trophoblast glycogen cell number | 8 |
| Increased trophoblast glycogen cell number | 6 |
| Absent spongiotrophoblast | 8 |
| Placenta junctional zone necrosis | 1 |
| Abnormal placenta labyrinth morphology | 286 |
| Abnormal placenta fetal blood space morphology | 9 |
| Abnormal placenta intervillous maternal lacunae morphology | 11 |
| Abnormal placenta labyrinth size | 76 |
| Decreased placental labyrinth size | 70 |
| Placental labyrinth hypoplasia | 18 |
| Thin placenta labyrinth | 26 |
| Increased placental labyrinth size | 6 |
| Thick placenta labyrinth | 3 |
| Abnormal placental labyrinth villi morphology | 9 |
| Absent placental labyrinth | 30 |
| Disorganized placental labyrinth | 17 |
| Abnormal placenta size | 276 |
| Abnormal placenta weight | 68 |
| Decreased placenta weight | 40 |
| Increased placenta weight | 30 |
| Enlarged placenta | 48 |
| Small placenta | 132 |
| Abnormal placenta vasculature | 240 |
| Abnormal placental labyrinth vasculature morphology | 129 |
| Abnormal trophoblast layer morphology | 275 |
| Abnormal spongiotrophoblast layer morphology | 111 |
| Abnormal syncytiotrophoblast morphology | 8 |
| Abnormal trophoblast giant cell morphology | 123 |
| Decreased trophoblast giant cell number | 54 |
| Absent trophoblast giant cells | 12 |
| Increased trophoblast giant cell number | 25 |
| Absent placenta | 1 |
| Pale placenta | 15 |
| Placenta necrosis | 8 |
Main categories of placental phenotypes are indicated in bold, and subcategories are italicized and further indented. The number of genotypes with a certain renal phenotype is indicated. One genotype may have several different placental abnormalities. These data were collected from the Mouse Genome Database, Mouse Genome Informatics web site, The Jackson Laboratory, Bar Harbor, Maine. (http://www.informatics.jax.org/vocab/mp_ontology/MP:0001711), Last accessed 4/5/21.
Circulatory abnormalities may be seen in the yolk sac at approximately E7.5 and tend to become progressively more severe as gestation progresses. These defects may sometimes be observed macroscopically as decreased vascular branching and often can be confirmed microscopically to represent lesions in endothelial cells lining blood vessels and/or reduced numbers of hematopoietic cells in blood islands (i.e., the source of primitive erythrocytes beginning at about E8.0) and vascular lumens.80–85 The yolk sac may have impaired blood vessel patterning or growth,86–91 laminar separation,88,90 or thinning89 with yolk sac defects generally resulting in embryonic death between E8.5 to E10.0.
Failed chorioallantoic fusion (or attachment) usually follows abnormal formation of the allantois, or less often the chorionic plate, which thwarts the normal union of these structures at E8.5. Failure to fuse prevents formation of umbilical blood vessels, leading to impaired placental labyrinth vasculogenesis arising from the lack of growth factors that are normally delivered by the combined chorioallantois. Microscopic evaluation may demonstrate allantois defects such as altered shape and size,88,90,92 impaired growth,88,90,93,94 and/or reduced vascularity.88,90 The amnion may be hypoplastic or show thickening88 or retention of the pro-amniotic canal.94 In cases of successful but malformed chorioallantoic fusion, the characteristics may include small fusion sites90,95 or developed vessels that fail to fuse.88–90,92,93,96,97 Defects in chorioallantoic fusion are among the most common causes of embryo lethality in mid-gestation (between E9.5 to E11.0).
Disrupted formation of the placental labyrinth is by far the most frequent mechanism responsible for placental failure in mice.54 After chorioallantoic fusion is complete, trophoblast columns assemble into labyrinth “primary villi”.65 Capillaries branching from the umbilical vessels enter these villi36 and undergo branching morphogenesis throughout the rest of gestation to generate a labyrinthine capillary network capable of sustaining the growing embryo. Aberrant early vascular branching in the developing labyrinth results in embryonic death between E9.0 – E11.0 due to impaired capillary bed formation, while impaired vessel branching after formation of the definitive placenta at E12.0 leads to death later in gestation (E13.0 – E16.0).98,99
Labyrinth defects can be detected microscopically as lesions in the trophoblast and/or vascular components. Trophoblast lesions typically result from impaired syncytiotrophoblast generation,100 spongiotrophoblast hypoplasia,101–104 or over-production of trophoblast giant cells,102,105 labyrinth trophoblasts, and/or spongiotrophoblasts.106 Common vascular defects include endothelial cell hypoplasia107 and aberrant vasculogenesis from the chorionic plate mesenchyme, which prevent development of embryonic blood vessels in the labyrinth.77,108,109
Dysregulation of both trophoblast and vascular components can result in a “small labyrinth” due to either reduced thickness or overall volume of this region.54 This finding generally is caused by defects in trophoblast lineage differentiation or organization;86,100 issues with capillary development,108,110–112 growth,87,91,111,113–117 and patterning;105,116,118,119 and labyrinth edema.112,120 In cases of insufficient trophoblast differentiation, vascular volume is impaired due to lack of trophoblast surface area, and the resulting vessels have insufficient capacity to support the growing embryo. In contrast, over-production of trophoblast cells may impair gas and nutrient exchange between embryonic and maternal vasculature.121,122
In addition to abnormal trophoblast cells or vascular differentiation, lethal phenotypes associated with placental lesions may arise from other pathologic processes. Cell death such as apoptosis and necrosis may represent a sign of primary placental damage but also may occur as a secondary consequence of primary injury to the embryo. Common placental lesions include dilation of labyrinth blood vessels (both maternal112,114,119,120,123 and embryonic118), delayed hematopoietic precursor differentiation105 and/or reduced blood cell counts117, and potential hemorrhagic foci95,108,112,124 and thrombi99,120. Other signs of placental damage include the accumulation of blood, fluid or fibrin, which can disrupt placental layering101,120 and exacerbate the blood flow issues. These findings may be observed any time during gestation. Mild and localized placental changes, especially near the end of gestation, may be consistent with continued embryonic survival, but more severe or widespread lesions may lead to embryonic death.
Conclusions
This in-depth overview of a macroscopic and microscopic placental anatomy, a transient but developmentally critical tissue in all mammalian test species and humans, should serve as a useful reference to aid researchers in identifying and describing structural changes that may be encountered when working with engineered, induced, and spontaneous mouse models of disease. The detailed descriptions will provide a fundamental understanding of normal placental anatomy and physiology as well as information regarding common findings and mechanisms by which placental insufficiency may develop at various stages of gestation. Additional information and examples on gross evaluations, the usefulness of immunohistochemistry to understand cellular makeup and visualize the dispersion of certain cell types with the placenta, and examples of common structural lesions have also been provided. Pathologists who are tasked routinely or even occasionally with placental evaluation should be able to approach analyses of this organ with greater confidence using the numerous well-annotated images in this treatise.
Supplementary Material
Acknowledgements
This research was supported [in part] by the National Institutes of Health (NIH), and specifically the National Institute of Environmental Health Sciences (NIEHS). We would like to give special thanks to the Charan Ganta and the NIEHS Immunohistochemistry Laboratory, as well as Vanessa Parslow for their helpful contributions to this atlas.
Footnotes
Declaration of Conflicting Interest Statement
The author(s) declared no potential, real, or perceived conflicts of interest with respect to the research, authorship, and/or publication of this article.
References
- 1.Inman KE, Downs KM. The murine allantois: emerging paradigms in development of the mammalian umbilical cord and its relation to the fetus. Genesis 2007;45(5):237–258. [DOI] [PubMed] [Google Scholar]
- 2.Bult C, Blake J, Smith C, Kadin J, Richardson J. Mouse Genome Database (MGD) http://www.informatics.jax.org/vocab/mp_ontology/MP:0001711. Published 2019. Updated May 14, 2019. Accessed May 21, 2019.
- 3.Simmons DG, Natale DRC, Begay V, Hughes M, Leutz A, Cross JC. Early patterning of the chorion leads to the trilaminar trophoblast cell structure in the placental labyrinth. Development 2008;135(12):2083. [DOI] [PMC free article] [PubMed] [Google Scholar]
- 4.Coan PM, Ferguson-Smith AC, Burton GJ. Ultrastructural changes in the interhaemal membrane and junctional zone of the murine chorioallantoic placenta across gestation. Journal of anatomy 2005;207(6):783–796. [DOI] [PMC free article] [PubMed] [Google Scholar]
- 5.Adamson SL, Lu Y, Whiteley KJ, et al. Interactions between Trophoblast Cells and the Maternal and Fetal Circulation in the Mouse Placenta. Developmental Biology 2002;250(2):358–373. [DOI] [PubMed] [Google Scholar]
- 6.Perez-Garcia V, Fineberg E, Wilson R, et al. Placentation defects are highly prevalent in embryonic lethal mouse mutants. Nature 2018;555(7697):463–468. [DOI] [PMC free article] [PubMed] [Google Scholar]
- 7.Kaufman MH. The atlas of mouse development London;: Academic Press; 1992. [Google Scholar]
- 8.Theiler K The house mouse: atlas of embryonic development New York: Springer-Verlag; 1989. [Google Scholar]
- 9.Kaufman MH. The anatomical basis of mouse development San Diego, Calif.;: Academic; 1999. [Google Scholar]
- 10.Bolon B, Rousseaux C. Essential terminology for mouse developmental pathology studies. In: Bolon B, ed. Pathology of the Developing Mouse: A Systematic Approach Boca Raton, FL: CRC Press; 2015:27–38. [Google Scholar]
- 11.Malle D, Economou L, Sioga A, et al. Somitogenesis in different mouse strains. Folia Anat 2004;32(1):5–10. [Google Scholar]
- 12.Rugh R The mouse : its reproduction and development Oxford [England];: Oxford University Press; 1990. [Google Scholar]
- 13.Thiel R, Chahoud I, Jurgens M, Neubert D. Time-dependent differences in the development of somites of four different mouse strains. Teratog Carcinog Mutagen 1993;13(6):247–257. [DOI] [PubMed] [Google Scholar]
- 14.Bolon B, Ward JM. Anatomy and physiology of the developing mouse and placenta. In: Bolon B, ed. Pathology of the Developing Mouse: A Systematic Approach Boca Raton, FL: CRC Press; 2015:39–98. [Google Scholar]
- 15.Natale DRC, Starovic M, Cross JC. Phenotypic analysis of the mouse placenta. In: Soares MJ, Hunt JS, eds. Placenta and Trophoblast: Methods and Protocols Vol 1. Totowa, NJ: Humana Press; 2006:275–293. [DOI] [PubMed] [Google Scholar]
- 16.Ward JM, Devor-Henneman DE. Gestational mortality in genetically engineered mice: evaluating the extraembryonal embryonic placenta and membranes. In: Ward JM, Mahler JF, Maronpot RR, Sundberg JP, Frederickson RM, eds. Pathology of Genetically Engineered Mice Ames, IA: Iowa State University Press; 2000:103–122. [Google Scholar]
- 17.Ward JM, Elmore SA, Foley JF. Pathology methods for the evaluation of embryonic and perinatal developmental defects and lethality in genetically engineered mice. Vet Pathol 2012;49(1):71–84. [DOI] [PubMed] [Google Scholar]
- 18.Pijnenborg R The metrial gland is more than a mesometrial lymphoid aggregate of pregnancy. Journal of reproductive immunology 2000;46(1):17–19. [DOI] [PubMed] [Google Scholar]
- 19.Ain R, Soares MJ. Is the metrial gland really a gland? Journal of reproductive immunology 2004;61(2):129–131. [DOI] [PubMed] [Google Scholar]
- 20.Croy BA. Hasn’t the time come to replace the term metrial gland? Journal of reproductive immunology 1999;42(2):127–129; discussion 131–124. [DOI] [PubMed] [Google Scholar]
- 21.Stewart. The metrial gland is more than a mesometrial lymphoid aggregate of pregnancy--a response. Journal of reproductive immunology 2001;49(1):67–69. [DOI] [PubMed] [Google Scholar]
- 22.Picut CA, Swanson CL, Parker RF, Scully KL, Parker GA. The Metrial Gland in the Rat and Its Similarities to Granular Cell Tumors. Toxicologic Pathology 2009;37(4):474–480. [DOI] [PubMed] [Google Scholar]
- 23.Peel S Granulated metrial gland cells. Adv Anat Embryol Cell Biol 1989;115:1–112. [DOI] [PubMed] [Google Scholar]
- 24.Peterson DA. Stereology. In: Kompoliti K, Metman LV, eds. Encyclopedia of Movement Disorders Oxford: Academic Press; 2010:168–170. [Google Scholar]
- 25.Bolon B 14 - Pathology Analysis of the Placenta. In: Croy BA, Yamada AT, DeMayo FJ, Adamson SL, eds. The Guide to Investigation of Mouse Pregnancy Boston: Academic Press; 2014:175–188. [Google Scholar]
- 26.Pang SC, Janzen-Pang J, Tse MY, Croy BA, Lima PDA. 1 - The Cycling and Pregnant Mouse: Gross Anatomy. In: Croy BA, Yamada AT, DeMayo FJ, Adamson SL, eds. The Guide to Investigation of Mouse Pregnancy Boston: Academic Press; 2014:3–19. [Google Scholar]
- 27.Bolon B, Ward JM. 4 - Anatomy and Physiology of the Developing Mouse and Placenta. In: Bolon B, ed. Pathology of the Developing Mouse: A Systematic Approach CRC Press; 2015:39–98. [Google Scholar]
- 28.Lawson KA, Wilson V. 3 - A Revised Staging of Mouse Development Before Organogenesis. In: Baldock R, Bard J, Davidson DR, Morriss-Kay G, eds. Kaufman’s Atlas of Mouse Development Supplement Boston: Academic Press; 2016:51–64. [Google Scholar]
- 29.Carretero A, Ruberte J, Navarro M, Lope S, Pujol A. Anatomy of Development. In: Jesus Ruberte AC, Marc Navarro, ed. Morphological Mouse Phenotyping: Anatomy, Histology and Imaging Madrid, Spain: Academic Press; 2017:252–268. [Google Scholar]
- 30.Favaro R, Abrahamsohn PA, Zorn MT. 11 - Decidualization and Endometrial Extracellular Matrix Remodeling. In: Croy BA, Yamada AT, DeMayo FJ, Adamson SL, eds. The Guide to Investigation of Mouse Pregnancy Boston: Academic Press; 2014:125–142. [Google Scholar]
- 31.Woods L, Perez-Garcia V, Hemberger M. Regulation of Placental Development and Its Impact on Fetal Growth—New Insights From Mouse Models. Frontiers in Endocrinology 2018;9(570). [DOI] [PMC free article] [PubMed] [Google Scholar]
- 32.Gardner RL, Rossant J. Investigation of the fate of 4·5 day post-coitum mouse inner cell mass cells by blastocyst injection. Journal of embryology and experimental morphology 1979;52(1):141–152. [PubMed] [Google Scholar]
- 33.Jollie WP. Development, morphology, and function of the yolk-sac placenta of laboratory rodents. Teratology 1990;41(4):361–381. [DOI] [PubMed] [Google Scholar]
- 34.Gardner RL, Papaioannou VE, Barton SC. Origin of the ectoplacental cone and secondary giant cells in mouse blastocysts reconstituted from isolated trophoblast and inner cell mass. Journal of embryology and experimental morphology 1973;30(3):561–572. [PubMed] [Google Scholar]
- 35.Cross JC. Genetic insights into trophoblast differentiation and placental morphogenesis. Seminars in Cell & Developmental Biology 2000;11(2):105–113. [DOI] [PubMed] [Google Scholar]
- 36.Rossant J, Cross JC. Placental development: lessons from mouse mutants. Nat Rev Genet 2001;2(7):538–548. [DOI] [PubMed] [Google Scholar]
- 37.Cross J, Werb Z, Fisher S. Implantation and the placenta: key pieces of the development puzzle. Science 1994;266(5190):1508–1518. [DOI] [PubMed] [Google Scholar]
- 38.Hofmann AP, Rätsep MT, Chen Z, Croy BA. 5 - Whole-Mount Immunohistochemistry of Early Implantation Sites. In: Croy BA, Yamada AT, DeMayo FJ, Adamson SL, eds. The Guide to Investigation of Mouse Pregnancy Boston: Academic Press; 2014:75–78. [Google Scholar]
- 39.Nadra K, Anghel SI, Joye E, et al. Differentiation of trophoblast giant cells and their metabolic functions are dependent on peroxisome proliferator-activated receptor beta/delta. Mol Cell Biol 2006;26(8):3266–3281. [DOI] [PMC free article] [PubMed] [Google Scholar]
- 40.Bevilacqua E, Lorenzon AR, Bandeira CL, Hoshida MS. 10 - Biology of the Ectoplacental Cone. In: Croy BA, Yamada AT, DeMayo FJ, Adamson SL, eds. The Guide to Investigation of Mouse Pregnancy Boston: Academic Press; 2014:113–124. [Google Scholar]
- 41.Natale DR, Starovic M, Cross JC. Phenotypic analysis of the mouse placenta. Methods in molecular medicine 2006;121:275–293. [DOI] [PubMed] [Google Scholar]
- 42.Rossant J, Cross JC. Placental development: Lessons from mouse mutants. Nature Reviews Genetics 2001;2(7):538–548. [DOI] [PubMed] [Google Scholar]
- 43.Cross JC. How to make a placenta: mechanisms of trophoblast cell differentiation in mice--a review. Placenta 2005;26. [DOI] [PubMed]
- 44.Croy BA, Kiso Y. Granulated metrial gland cells: A natural killer cell subset of the pregnant murine uterus. Microscopy Research and Technique 1993;25(3):189–200. [DOI] [PubMed] [Google Scholar]
- 45.Allen MP, Nilsen-Hamilton M. Granzymes D, E, F, and G Are Regulated Through Pregnancy and by IL-2 and IL-15 in Granulated Metrial Gland Cells. The Journal of Immunology 1998;161(6):2772. [PubMed] [Google Scholar]
- 46.Lima PD, Zhang J, Dunk C, Lye SJ, Croy BA. Leukocyte driven-decidual angiogenesis in early pregnancy. Cell Mol Immunol 2014;11(6):522–537. [DOI] [PMC free article] [PubMed] [Google Scholar]
- 47.Blois SM, Barrientos G, Garcia MG, et al. Interaction between dendritic cells and natural killer cells during pregnancy in mice. J Mol Med (Berl) 2008;86(7):837–852. [DOI] [PubMed] [Google Scholar]
- 48.Scherjon S, Lashley L, van der Hoorn ML, Claas F. Fetus specific T cell modulation during fertilization, implantation and pregnancy. Placenta 2011;32 Suppl 4:S291–297. [DOI] [PubMed] [Google Scholar]
- 49.Cousins FL, Kirkwood PM, Saunders PTK, Gibson DA. Evidence for a dynamic role for mononuclear phagocytes during endometrial repair and remodelling. Scientific Reports 2016;6(1):36748. [DOI] [PMC free article] [PubMed] [Google Scholar]
- 50.De M, Choudhuri R, Wood GW. Determination of the Number and Distribution of Macrophages, Lymphocytes, and Granulocytes in the Mouse Uterus From Mating Through Implantation. Journal of Leukocyte Biology 1991;50(3):252–262. [DOI] [PubMed] [Google Scholar]
- 51.Downs KM. 1 The Murine Allantois. In: Pedersen RA, Schatten GP, eds. Current Topics in Developmental Biology Vol 39. Academic Press; 1998:1–33. [DOI] [PubMed] [Google Scholar]
- 52.Bedzhov I, Zernicka-Goetz M. Self-organizing properties of mouse pluripotent cells initiate morphogenesis upon implantation. Cell 2014;156(5):1032–1044. [DOI] [PMC free article] [PubMed] [Google Scholar]
- 53.Pereira PN, Dobreva MP, Graham L, Huylebroeck D, Lawson KA, Zwijsen A. Amnion formation in the mouse embryo: the single amniochorionic fold model. BMC developmental biology 2011;11(1):48. [DOI] [PMC free article] [PubMed] [Google Scholar]
- 54.Watson ED, Cross JC. Development of structures and transport functions in the mouse placenta. Physiology (Bethesda, Md) 2005;20:180–193. [DOI] [PubMed] [Google Scholar]
- 55.Palis J, McGrath K, Kingsley P. Initiation of hematopoiesis and vasculogenesis in murine yolk sac explants. Blood 1995;86(1):156–163. [PubMed] [Google Scholar]
- 56.Kingsley PD, Malik J, Fantauzzo KA, Palis J. Yolk sac–derived primitive erythroblasts enucleate during mammalian embryogenesis. Blood 2004;104(1):19–25. [DOI] [PubMed] [Google Scholar]
- 57.Medvinsky A, Dzierzak E. Definitive Hematopoiesis Is Autonomously Initiated by the AGM Region. Cell 1996;86(6):897–906. [DOI] [PubMed] [Google Scholar]
- 58.Swartley OM, Foley JF, Livingston DP 3rd, Cullen JM, Elmore SA. Histology atlas of the developing mouse hepatobiliary hemolymphatic vascular system with emphasis on embryonic days 11.5–18.5 and early postnatal development. Toxicol Pathol 2016;44(5):705–725. [DOI] [PMC free article] [PubMed] [Google Scholar]
- 59.Simmons DG. 12 - Postimplantation Development of the Chorioallantoic Placenta. In: Croy BA, Yamada AT, DeMayo FJ, Adamson SL, eds. The Guide to Investigation of Mouse Pregnancy Boston: Academic Press; 2014:143–161. [Google Scholar]
- 60.Downs KM, Gifford S, Blahnik M, Gardner RL. Vascularization in the murine allantois occurs by vasculogenesis without accompanying erythropoiesis. Development 1998;125(22):4507–4520. [DOI] [PubMed] [Google Scholar]
- 61.Downs KM, Bertler C. Growth in the pre-fusion murine allantois. Anatomy and embryology 2000;202(4):323–331. [DOI] [PubMed] [Google Scholar]
- 62.Downs KM, Gardner RL. An investigation into early placental ontogeny: allantoic attachment to the chorion is selective and developmentally regulated. Development 1995;121(2):407–416. [DOI] [PubMed] [Google Scholar]
- 63.Gurtner GC, Davis V, Li H, McCoy MJ, Sharpe A, Cybulsky MI. Targeted disruption of the murine VCAM1 gene: essential role of VCAM-1 in chorioallantoic fusion and placentation. Genes & development 1995;9(1):1–14. [DOI] [PubMed] [Google Scholar]
- 64.Downs KM, Davies T. Staging of gastrulating mouse embryos by morphological landmarks in the dissecting microscope. Development 1993;118. [DOI] [PubMed]
- 65.Cross JC, Simmons DG, Watson ED. Chorioallantoic morphogenesis and formation of the placental villous tree. Annals of the New York Academy of Sciences 2003;995:84–93. [DOI] [PubMed] [Google Scholar]
- 66.Coan PM, Ferguson-Smith AC, Burton GJ. Developmental dynamics of the definitive mouse placenta assessed by stereology. Biology of reproduction 2004;70(6):1806–1813. [DOI] [PubMed] [Google Scholar]
- 67.Rinkenberger J, Werb Z. The labyrinthine placenta. Nature Genetics 2000;25(3):248–250. [DOI] [PubMed] [Google Scholar]
- 68.Georgiades P, Ferguson-Smith AC, Burton GJ. Comparative developmental anatomy of the murine and human definitive placentae. Placenta 2002;23(1):3–19. [DOI] [PubMed] [Google Scholar]
- 69.Baron MH, Vacaru A, Nieves J. Erythroid development in the mammalian embryo. Blood Cells Mol Dis 2013;51(4):213–219. [DOI] [PMC free article] [PubMed] [Google Scholar]
- 70.Edwards AK, Janzen-Pang J, Peng A, et al. 3 - Microscopic Anatomy of the Pregnant Mouse Uterus Throughout Gestation. In: Croy BA, Yamada AT, DeMayo FJ, Adamson SL, eds. The Guide to Investigation of Mouse Pregnancy Boston: Academic Press; 2014:43–67. [Google Scholar]
- 71.Cox B, Kotlyar M, Evangelou AI, et al. Comparative systems biology of human and mouse as a tool to guide the modeling of human placental pathology. Mol Syst Biol 2009;5:279. [DOI] [PMC free article] [PubMed] [Google Scholar]
- 72.Cline JM, Dixon D, Ernerudh J, et al. The Placenta in Toxicology. Part III: Pathologic Assessment of the Placenta. Toxicologic Pathology 2013;42(2):339–344. [DOI] [PubMed] [Google Scholar]
- 73.Georgiades P, Watkins M, Burton GJ, Ferguson-Smith AC. Roles for genomic imprinting and the zygotic genome in placental development. Proc Natl Acad Sci U S A 2001;98(8):4522–4527. [DOI] [PMC free article] [PubMed] [Google Scholar]
- 74.Coan PM, Conroy N, Burton GJ, Ferguson-Smith AC. Origin and characteristics of glycogen cells in the developing murine placenta. Developmental dynamics : an official publication of the American Association of Anatomists 2006;235(12):3280–3294. [DOI] [PubMed] [Google Scholar]
- 75.Fowden AL, Moore T. Maternal-fetal resource allocation: co-operation and conflict. Placenta 2012;33 Suppl 2:e11–15. [DOI] [PubMed] [Google Scholar]
- 76.Sarkar AA, Nuwayhid SJ, Maynard T, et al. Hectd1 is required for development of the junctional zone of the placenta. Developmental biology 2014;392(2):368–380. [DOI] [PMC free article] [PubMed] [Google Scholar]
- 77.Guillemot F, Nagy A, Auerbach A, Rossant J, Joyner AL. Essential role of Mash-2 in extraembryonic development. Nature 1994;371(6495):333–336. [DOI] [PubMed] [Google Scholar]
- 78.Cross JC, Werb Z, Fisher SJ. Implantation and the placenta: key pieces of the development puzzle. Science 1994;266(5190):1508–1518. [DOI] [PubMed] [Google Scholar]
- 79.Oh-McGinnis R, Bogutz AB, Lefebvre L. Partial loss of Ascl2 function affects all three layers of the mature placenta and causes intrauterine growth restriction. Dev Biol 2011;351(2):277–286. [DOI] [PMC free article] [PubMed] [Google Scholar]
- 80.Baudino TA, McKay C, Pendeville-Samain H, et al. c-Myc is essential for vasculogenesis and angiogenesis during development and tumor progression. Genes Dev 2002;16(19):2530–2543. [DOI] [PMC free article] [PubMed] [Google Scholar]
- 81.Dickson MC, Martin JS, Cousins FM, Kulkarni AB, Karlsson S, Akhurst RJ. Defective haematopoiesis and vasculogenesis in transforming growth factor-beta 1 knock out mice. Development 1995;121(6):1845–1854. [DOI] [PubMed] [Google Scholar]
- 82.Shalaby F, Rossant J, Yamaguchi TP, et al. Failure of blood-island formation and vasculogenesis in Flk-1-deficient mice. Nature 1995;376(6535):62–66. [DOI] [PubMed] [Google Scholar]
- 83.Shi W, van den Hurk JA, Alamo-Bethencourt V, et al. Choroideremia gene product affects trophoblast development and vascularization in mouse extra-embryonic tissues. Dev Biol 2004;272(1):53–65. [DOI] [PubMed] [Google Scholar]
- 84.Takashima S, Kitakaze M, Asakura M, et al. Targeting of both mouse neuropilin-1 and neuropilin-2 genes severely impairs developmental yolk sac and embryonic angiogenesis. Proc Natl Acad Sci U S A 2002;99(6):3657–3662. [DOI] [PMC free article] [PubMed] [Google Scholar]
- 85.Takahashi T, Takahashi K, St John PL, et al. A mutant receptor tyrosine phosphatase, CD148, causes defects in vascular development. Mol Cell Biol 2003;23(5):1817–1831. [DOI] [PMC free article] [PubMed] [Google Scholar]
- 86.Hildebrand JD, Soriano P. Overlapping and unique roles for C-terminal binding protein 1 (CtBP1) and CtBP2 during mouse development. Mol Cell Biol 2002;22(15):5296–5307. [DOI] [PMC free article] [PubMed] [Google Scholar]
- 87.Krebs LT, Xue Y, Norton CR, et al. Notch signaling is essential for vascular morphogenesis in mice. Genes Dev 2000;14(11):1343–1352. [PMC free article] [PubMed] [Google Scholar]
- 88.Mahlapuu M, Ormestad M, Enerback S, Carlsson P. The forkhead transcription factor Foxf1 is required for differentiation of extra-embryonic and lateral plate mesoderm. Development 2001;128(2):155–166. [DOI] [PubMed] [Google Scholar]
- 89.Tetzlaff MT, Bai C, Finegold M, et al. Cyclin F disruption compromises placental development and affects normal cell cycle execution. Mol Cell Biol 2004;24(6):2487–2498. [DOI] [PMC free article] [PubMed] [Google Scholar]
- 90.Saunders DN, Hird SL, Withington SL, et al. Edd, the murine hyperplastic disc gene, is essential for yolk sac vascularization and chorioallantoic fusion. Mol Cell Biol 2004;24(16):7225–7234. [DOI] [PMC free article] [PubMed] [Google Scholar]
- 91.Parekh V, McEwen A, Barbour V, et al. Defective extraembryonic angiogenesis in mice lacking LBP-1a, a member of the grainyhead family of transcription factors. Mol Cell Biol 2004;24(16):7113–7129. [DOI] [PMC free article] [PubMed] [Google Scholar]
- 92.Chawengsaksophak K, de Graaff W, Rossant J, Deschamps J, Beck F. Cdx2 is essential for axial elongation in mouse development. Proc Natl Acad Sci U S A 2004;101(20):7641–7645. [DOI] [PMC free article] [PubMed] [Google Scholar]
- 93.Oka C, Nakano T, Wakeham A, et al. Disruption of the mouse RBP-J kappa gene results in early embryonic death. Development 1995;121(10):3291–3301. [DOI] [PubMed] [Google Scholar]
- 94.Zhang H, Bradley A. Mice deficient for BMP2 are nonviable and have defects in amnion/chorion and cardiac development. Development 1996;122(10):2977–2986. [DOI] [PubMed] [Google Scholar]
- 95.Barak Y, Liao D, He W, et al. Effects of peroxisome proliferator-activated receptor delta on placentation, adiposity, and colorectal cancer. Proc Natl Acad Sci U S A 2002;99(1):303–308. [DOI] [PMC free article] [PubMed] [Google Scholar]
- 96.Lechleider RJ, Ryan JL, Garrett L, et al. Targeted mutagenesis of Smad1 reveals an essential role in chorioallantoic fusion. Dev Biol 2001;240(1):157–167. [DOI] [PubMed] [Google Scholar]
- 97.Wilson V, Rashbass P, Beddington RS. Chimeric analysis of T (Brachyury) gene function. Development 1993;117(4):1321–1331. [DOI] [PubMed] [Google Scholar]
- 98.Kingdom J, Huppertz B, Seaward G, Kaufmann P. Development of the placental villous tree and its consequences for fetal growth. Eur J Obstet Gynecol Reprod Biol 2000;92(1):35–43. [DOI] [PubMed] [Google Scholar]
- 99.Thumkeo D, Keel J, Ishizaki T, et al. Targeted disruption of the mouse rho-associated kinase 2 gene results in intrauterine growth retardation and fetal death. Mol Cell Biol 2003;23(14):5043–5055. [DOI] [PMC free article] [PubMed] [Google Scholar]
- 100.Anson-Cartwright L, Dawson K, Holmyard D, Fisher SJ, Lazzarini RA, Cross JC. The glial cells missing-1 protein is essential for branching morphogenesis in the chorioallantoic placenta. Nat Genet 2000;25(3):311–314. [DOI] [PubMed] [Google Scholar]
- 101.Kozak KR, Abbott B, Hankinson O. ARNT-deficient mice and placental differentiation. Dev Biol 1997;191(2):297–305. [DOI] [PubMed] [Google Scholar]
- 102.Ma GT, Soloveva V, Tzeng SJ, et al. Nodal regulates trophoblast differentiation and placental development. Dev Biol 2001;236(1):124–135. [DOI] [PubMed] [Google Scholar]
- 103.Stumpo DJ, Byrd NA, Phillips RS, et al. Chorioallantoic fusion defects and embryonic lethality resulting from disruption of Zfp36L1, a gene encoding a CCCH tandem zinc finger protein of the Tristetraprolin family. Mol Cell Biol 2004;24(14):6445–6455. [DOI] [PMC free article] [PubMed] [Google Scholar]
- 104.Plum A, Winterhager E, Pesch J, et al. Connexin31-deficiency in mice causes transient placental dysmorphogenesis but does not impair hearing and skin differentiation. Dev Biol 2001;231(2):334–347. [DOI] [PubMed] [Google Scholar]
- 105.Lotz K, Pyrowolakis G, Jentsch S. BRUCE, a giant E2/E3 ubiquitin ligase and inhibitor of apoptosis protein of the trans-Golgi network, is required for normal placenta development and mouse survival. Mol Cell Biol 2004;24(21):9339–9350. [DOI] [PMC free article] [PubMed] [Google Scholar]
- 106.Kanayama N, Takahashi K, Matsuura T, et al. Deficiency in p57Kip2 expression induces preeclampsia-like symptoms in mice. Molecular human reproduction 2002;8(12):1129–1135. [DOI] [PubMed] [Google Scholar]
- 107.Giroux S, Tremblay M, Bernard D, et al. Embryonic death of Mek1-deficient mice reveals a role for this kinase in angiogenesis in the labyrinthine region of the placenta. Curr Biol 1999;9(7):369–372. [DOI] [PubMed] [Google Scholar]
- 108.Gnarra JR, Ward JM, Porter FD, et al. Defective placental vasculogenesis causes embryonic lethality in VHL-deficient mice. Proc Natl Acad Sci U S A 1997;94(17):9102–9107. [DOI] [PMC free article] [PubMed] [Google Scholar]
- 109.Ma J, Wu J, Han L, et al. Comparative analysis of mesenchymal stem cells derived from amniotic membrane, umbilical cord, and chorionic plate under serum-free condition. Stem Cell Research & Therapy 2019;10(1):19. [DOI] [PMC free article] [PubMed] [Google Scholar]
- 110.Barak Y, Nelson MC, Ong ES, et al. PPAR gamma is required for placental, cardiac, and adipose tissue development. Mol Cell 1999;4(4):585–595. [DOI] [PubMed] [Google Scholar]
- 111.Fischer A, Schumacher N, Maier M, Sendtner M, Gessler M. The Notch target genes Hey1 and Hey2 are required for embryonic vascular development. Genes Dev 2004;18(8):901–911. [DOI] [PMC free article] [PubMed] [Google Scholar]
- 112.Monkley SJ, Delaney SJ, Pennisi DJ, Christiansen JH, Wainwright BJ. Targeted disruption of the Wnt2 gene results in placentation defects. Development 1996;122(11):3343–3353. [DOI] [PubMed] [Google Scholar]
- 113.Begay V, Smink J, Leutz A. Essential requirement of CCAAT/enhancer binding proteins in embryogenesis. Mol Cell Biol 2004;24(22):9744–9751. [DOI] [PMC free article] [PubMed] [Google Scholar]
- 114.Mo FE, Muntean AG, Chen CC, Stolz DB, Watkins SC, Lau LF. CYR61 (CCN1) is essential for placental development and vascular integrity. Mol Cell Biol 2002;22(24):8709–8720. [DOI] [PMC free article] [PubMed] [Google Scholar]
- 115.Voss AK, Thomas T, Gruss P. Mice lacking HSP90beta fail to develop a placental labyrinth. Development 2000;127(1):1–11. [DOI] [PubMed] [Google Scholar]
- 116.Steingrimsson E, Tessarollo L, Reid SW, Jenkins NA, Copeland NG. The bHLH-Zip transcription factor Tfeb is essential for placental vascularization. Development 1998;125(23):4607–4616. [DOI] [PubMed] [Google Scholar]
- 117.Morasso MI, Grinberg A, Robinson G, Sargent TD, Mahon KA. Placental failure in mice lacking the homeobox gene Dlx3. Proc Natl Acad Sci U S A 1999;96(1):162–167. [DOI] [PMC free article] [PubMed] [Google Scholar]
- 118.Miner JH, Cunningham J, Sanes JR. Roles for laminin in embryogenesis: exencephaly, syndactyly, and placentopathy in mice lacking the laminin alpha5 chain. J Cell Biol 1998;143(6):1713–1723. [DOI] [PMC free article] [PubMed] [Google Scholar]
- 119.Rodriguez TA, Sparrow DB, Scott AN, et al. Cited1 is required in trophoblasts for placental development and for embryo growth and survival. Mol Cell Biol 2004;24(1):228–244. [DOI] [PMC free article] [PubMed] [Google Scholar]
- 120.Ware CB, Horowitz MC, Renshaw BR, et al. Targeted disruption of the low-affinity leukemia inhibitory factor receptor gene causes placental, skeletal, neural and metabolic defects and results in perinatal death. Development 1995;121(5):1283–1299. [DOI] [PubMed] [Google Scholar]
- 121.Chong JL, Tsai SY, Sharma N, et al. E2f3a and E2f3b contribute to the control of cell proliferation and mouse development. Mol Cell Biol 2009;29(2):414–424. [DOI] [PMC free article] [PubMed] [Google Scholar]
- 122.Wu L, de Bruin A, Saavedra HI, et al. Extra-embryonic function of Rb is essential for embryonic development and viability. Nature 2003;421(6926):942–947. [DOI] [PubMed] [Google Scholar]
- 123.Shalom-Barak T, Nicholas JM, Wang Y, et al. Peroxisome proliferator-activated receptor gamma controls Muc1 transcription in trophoblasts. Mol Cell Biol 2004;24(24):10661–10669. [DOI] [PMC free article] [PubMed] [Google Scholar]
- 124.Tamai Y, Ishikawa T, Bosl MR, et al. Cytokeratins 8 and 19 in the mouse placental development. J Cell Biol 2000;151(3):563–572. [DOI] [PMC free article] [PubMed] [Google Scholar]
Associated Data
This section collects any data citations, data availability statements, or supplementary materials included in this article.