

Abstract
Older individuals infected by Human Immunodeficiency Virus (HIV) are at risk for developing HIV-Associated Neurocognitive Disorder (HAND), i.e., from reduced cognitive functioning similar to HIV-negative individuals with Mild Cognitive Impairment (MCI) or to Alzheimer’s Disease (AD) if more severely affected. Incompletely understood is how brain structure can serve to differentiate cognitive impairment (CI) in the HIV-positive (i.e., HAND) from the HIV-negative cohort (i.e., MCI and AD). To that end, we designed a multi-label classifier that labels the structural magnetic resonance images (MRI) of individuals by their HIV and CI status via two binary variables. Proper training of such an approach traditionally requires well-curated datasets containing large number of samples for each of the corresponding four cohorts (healthy controls, CI HIV-negative adults a.k.a. CI-only, HIV-positive patients without CI a.k.a. HIV-only, and HAND). Because of the rarity of such datasets, we proposed to improve training of the multi-label classifier via a multi-domain learning scheme that also incorporates domain-specific classifiers on auxiliary single-label datasets specific to either binary label. Specifically, we complement the training dataset of MRIs of the four cohorts (Control: 156, CI-only: 335, HIV-only: 37, HAND: 145) acquired by the Memory and Aging Center at the University of California - San Francisco with a CI-specific dataset only containing MRIs of HIV-negative subjects (Controls: 229, CI-only: 397) from the Alzheimer’s Disease Neuroimaging Initiative and an HIV-specific dataset (Controls: 75, HIV-only: 75) provided by SRI International. Based on cross-validation on the UCSF dataset, the multi-domain and multi-label learning strategy leads to superior classification accuracy compared with one-domain or multi-class learning approaches, specifically for the undersampled HIV-only cohort. The ‘prediction logits’ of CI computed by the multi-label formulation also successfully stratify motor performance among the HIV-positive subjects (including HAND). Finally, brain patterns driving the subject-level predictions across all four cohorts characterize the independent and compounding effects of HIV and CI in the HAND cohort.
Keywords: Multi-label classification, Multi-domain learning, HIV-Associated Neurocognitive Disorder, Alzheimer’s disease, MRI
1. Introduction
Despite the success of antiretroviral therapy in suppressing human immunodeficiency virus (HIV)-mediated immune dysfunction, upwards of 30% of older HIV-positive individuals exhibit reduced cognitive functioning (Rumbaugh and Tyor, 2015; Saloner and Cysique, 2017) clinically labelled as HIV-associated neurocognitive disorders (HAND) (Heaton et al., 2010; Wenzel et al., 2019) (Fig 1). HIV-negative individuals exhibiting similar symptoms are often referred to as having mild cognitive impairment (MCI) or, if more severe, are diagnosed with Alzheimer’s disease (AD), which we collectively refer to as Cognitive Impairment (CI). To improve the long-term treatment of older HIV-positive patients, researchers have been focusing on identifying brain phenotypes that distinguish brain injury associated with HIV versus alternative etiologies prevalent among older individuals, particularly AD, and finding commonalities across HAND (presence of both HIV and CI), HIV-positive patients not showing CI (a.k.a. HIV-only), CI in HIV-negative patients (a.k.a. CI-only), and normal aging (Ghosh et al., 2017).
Figure 1:

HIV-Associated Neurocognitive Disorder (HAND) is a condition of cognitive impairment (CI) found in patients infected by the human immunodeficiency virus (HIV).
Identifying novel brain phenotypes is increasingly probed by training deep learning models to distinguish the magnetic resonance images (MRI) of the relevant cohorts (Basaia et al., 2018; Zhao et al., 2020; Shen et al., 2017), such as multi-class classifiers in the case of multiple cohorts (Majid and Anwar, 2018). Multi-class classifiers label each cohort with a categorical number based on the simplifying assumption that conditions are mutually exclusive. Thus, they ignore compounding effects of multiple conditions (such as HIV and CI in HAND patients), which often result in inconclusive or contradicting findings (Wosiak et al., 2017). Compounding effects can be modelled by multi-label classifiers (Tsoumakas and Katakis, 2007) as they explicitly encode each condition as a binary label. For example, a binary label representing the HIV status (0 for HIV-negative, 1 for HIV-positive) and one for the CI status could specify cohort assignment of participants of a study containing healthy controls (HIV=0, CI=1), CI-only (HIV=0, CI=1), HIV-only (HIV=1, CI=0), and patients diagnosed with HAND (HIV=1, CI=1).
Given the large number of model parameters, the leading challenge in accurately training multi-label classifiers on brain MRIs is the relatively small number of subjects recruited by MRI studies (Shen et al., 2017; Willemink et al., 2020). “Multi-domain strategies deal with the small sample size problem by training a classifier on multiple, independently acquired datasets (Popuri et al., 2020). However, this strategy assumes that all datasets used for training contain samples from each of the conditions under investigation (Mei and Deng, 2018), which rarely exist as studies generally focus on a single condition. For example, the Alzheimer’s Disease Neuroimaging Initiative (ADNI) (Jack et al., 2008) excludes HIV-positive subjects (and thus anybody with HAND). Herein, we propose to reduce the low sample-size problem for training multi-label classifiers by being the first to augment a multi-label cohort with single-label datasets specific to only one of the conditions.
To do so, our model first learns common patterns underlying the conditions by using a shared convolutional block to extract features across all training datasets (Fig. 2). We then use domain-specific classifiers to separately handle each dataset in an either multi-label or single-label setting. By doing so, our experiments reveal that these predictors are robust against domain differences related to demographic factors, scanner type, imaging protocols, and processing pipelines. We test this classification framework on differentiating the T1w MRIs of a study performed by Memory and Aging Center at the University of California - San Francisco (PI: V. Valcour). The training data are augmented with Controls and CI-Only individuals from the ADNI dataset (Jack et al., 2008) and a separate dataset of Controls and HIV-only individuals acquired at SRI International (mPI: A. Pfefferbaum and E.V. Sulllivan). Compared with single-domain and multi-class classifiers, our multi-domain, multi-label model achieves superior classification accuracy across all four cohorts with a significant increase in accuracy for the small sample of HIV-only patients. We further legitimize the CI predicted score by correlating it with motor performance of HIV-positive subjects (including those with HAND). Finally, we derive a brain pattern for each of the three neurological conditions via back-propagation highlighting compounding and differentiating effects of HIV and CI in the HAND cohort.
Figure 2:

The proposed domain-specific prediction model for multi-label classification.
2. Related Work
2.1. Multi-Domain Classification
Multi-domain classification refers to training classifiers on data from different domains (e.g., studies). While increasing the size of the training data is an effective strategy for reducing the risk of model overfitting, the primary challenge of multi-domain classification is to handle the “domain shift”, i.e., the discrepancy in data distribution across domains. A popular approach for dealing with this issue is domain-invariant feature learning (Ranzato et al., 2007; Zhao et al., 2019), which aims to encourage the distribution of image representations (i.e., intermediate features learned by the model) to be similar across different domains. This harmonization of distributions can be formulated via representation cross-stitching (Misra et al., 2016), minimizing Maximum Mean Discrepancy (Baktashmotlagh et al., 2013; Hoffman et al., 2013), minimizing the domain confusion loss (Tzeng et al., 2014), or adversarial training (Xie et al., 2017; Ganin et al., 2016; Akuzawa et al., 2019; Adeli et al., 2021; Wang et al., 2019).
Instead of focusing on image representation, one can design networks specifically for multi-domain learning (Ruder, 2017). For example, Caruana (1993) implemented a single network performing the classification for each domain separately based on the assumption that the same set of model parameters can be shared between multiple domains. An alternative to the single model is to implement a network for each domain with the corresponding model parameters being encouraged to be similar across networks (Duong et al., 2015; Yang and Hospedales, 2017). A hybrid implementation of these two strategies is to share certain layers across domains while using domain-specific branches for prediction (Lu et al., 2017; Nam and Han, 2016). Recently, Wang et al. (2020) proposed domain-specific learning by designing an ND-way classifier, which uses a shared feature extractor across the D domains and performs independent N-class classification for each domain. In this article, we generalize this strategy to the multi-label setting, which allows combining domains that vary in their cohort composition.
2.2. Multi-Label Deep Learning
Multi-label classification involves simultaneously predicting multiple labels associated with a single instance (Tsoumakas and Katakis, 2007). Unlike the multi-class classification where each instance can only be categorized into one class, multi-label classifiers can assign a sample to multiple mutually non-exclusive classes. In the computer vision community, multi-label classification is widely used for semantic annotation to jointly label various attributes (e.g., object, scene, and action) of an image (Wang et al., 2016; Wu et al., 2015; Gong et al., 2014). In medical imaging studies, multi-label classification is increasingly used for jointly segmenting multiple tissue types in MRIs and computed tomography images (Payer et al., 2018), analyzing concurrent chronic diseases including fatty liver and diabetes (Zhang et al., 2019), and studying the comorbidity of HIV infection and alcohol use disorder (Adeli et al., 2018a). To the best of our knowledge, we are the first to create a multi-label classifier for distinguishing the T1w MRIs of Controls, HIV-only, CI-only, and HAND. With respect to this application, prior classifiers were confined to two of the four cohorts, e.g. between HAND and Controls (Tu et al., 2019), between HAND and CI-only (Zhang et al., 2016), between HIV-only and Controls (Adeli et al., 2018b; Xu et al., 2021), and between sub-populations of HIV individuals (Paul et al., 2020).
3. Materials and Methods
We now briefly describe three independently acquired MRI datasets (Section 3.1) with a focus on the one containing HAND samples, i.e., the data acquired by the Memory and Aging Center at University of California, San Francisco (UCSF). We then present in Section 3.2 our multi-label formulation for achieving our primary goal of classifying MRIs of UCSF into Control, HIV-only, CI-only, and HAND subjects. In Section 3.3, we extend this formulation to a multi-domain setting, which separately performs HIV and CI single-label classification based on the data made available by ADNI and SRI International.
3.1. Datasets
The UCSF dataset (N = 673) includes T1-weighted MRIs from 156 Controls, 335 CI-only adults, 37 HIV-only participants, and 145 HAND patients. Among the 335 CI-only subjects, 169 were categorized as MCI (Albert et al., 2011) and the remaining 166 were diagnosed with AD (Bondi et al., 2014). 79 of the MCI subjects underwent a followup cognitive test (average time between baseline and followup was 2.3 years) revealing that 14 subjects had progressed to AD (a.k.a. Progressive) while 65 remained stable (a.k.a. Stable). Diagnosis of HAND and MCI were determined based on comprehensive neuropsychological testing at consensus conference, guided by published criteria (Albert et al., 2011; Antinori et al., 2007). All HIV-positive subjects (both HIV-only and HAND) underwent a 60-minute neuropsychological assessment covering domains needed to identify HAND, including a finger tapping (FT) test to assess their motor control integrity of the neuromuscular system (Axelrod et al., 2014).
The second dataset (used for augmenting the training data) was collected at SRI International (SRI, N = 150) and consisted of T1-weighted MRIs from 75 Controls and 75 age-gender-matched HIV-only infected patients (Murri et al., 1996; Adeli et al., 2018b). The third dataset was made publicly available by ADNI-1 (N = 626, referred to as ADNI in the following), which consisted of baseline T1 scans of 229 Controls and 397 individuals labeled as MCI from ADNI1 (Bondi et al., 2014). Table 1 summarizes the demographics of the three datasets with respect to age, sex, and brain size.
Table 1:
Class distribution and demographics for each dataset
| Brain size* (cm3) | |||||
|---|---|---|---|---|---|
| UCSF | Control | 156 | 70.15.9 | 146 M / 10 F | 1311107 |
| HIV-only | 37 | 64.93.8 | 36 M / 1 F | 1287105 | |
| Cl-only | 335 | 67.37.3 | 165 M / 170 F | 1217134 | |
| HAND | 145 | 64.15.0 | 136 M / 9 F | 1304128 | |
| SRI | Control | 75 | 51.710.6 | 53 M / 22 F | 1305125 |
| HIV-only | 75 | 51.012.5 | 53 M / 22 F | 1316166 | |
| ADNI | Control | 229 | 75.95.0 | 119 M / 110 F | 1234120 |
| CI-only | 397 | 74.87.4 | 254 M / 143 F | 1250141 |
brain size is defined by the supratentorial volume.
Image processing for the MRIs of all three datasets complied with our prior studies (Zhao et al., 2020; Adeli et al., 2020), which involved bias field correction via the Computational Morphometry Toolkit (CMTK) (Rohlfing et al., 2003), skull stripping via majority voting of Robust Brain Extraction (ROBEX) (Iglesias et al., 2011), FSL BET (Jenkinson et al., 2012), and AFNI (Cox, 1996), affine registration to the SRI24 atlas (Rohlfing et al., 2010a), and resampling to 64×64×64 resolution. Image intensities within the brain mask were normalized to z-scores.
3.2. Multi-Label Classification to Distinguish Control, HIV-only, CI-only, and HAND
We encode the four cohorts of the UCSF dataset as the combinatorial status of two binary labels (Table 2), i.e., whether a subject is HIV-positive (HIV) and whether a subject shows cognitive impairment (CI). To solve this multi-label classification problem, a typical deep learning framework first uses convolutional layers to extract a set of features from the raw MRIs (Lu et al., 2017; Wang et al., 2020). Then the features are fed into a classification network consisting of a fully connected Multi-Layer Perception (MLP), which outputs a binary prediction for each label (see Single-Domain Classification in Figure 2). To formalize this model, let be the dataset containing the MRIs of N subjects. Let yi and zi be the two ground-truth labels for HIV and CI of the ith subject, and let be their predicted values generated by the network. We then design an objective loss function based on the Binary Cross-Entropy function :
| (1) |
where wi determines the weight of a training sample.
Table 2:
Multi-label definition of the four cohorts of Control, CI-only, HIV-only, and HAND.
| Cohorts | CI Label | HIV Label |
|---|---|---|
| Control | 0 | 0 |
| CI-only | 1 | 0 |
| HIV-only | 0 | 1 |
| HAND | 1 | 1 |
3.3. Multi-Domain Classification
Now the UCSF dataset only contains 37 HIV-only subjects (Table 1), which is much smaller than the number of training samples of other cohorts. Moreover, HIV-positive subjects are significantly younger than the Controls, and (unlike any other cohort) only one HIV-only subject is female. This will potentially bias the HIV prediction towards young male participants. To address this potential bias, we augment the dataset with the MRIs of 75 Controls and 75 HIV-only patients from SRI, whose age and sex are strictly matched (see Table 1). As the SRI dataset does not contain any participants with CI, we only measure the prediction loss on this dataset with respect to the HIV binary classification task. Further extending this multi-domain setting, we include the Control and age-matched MCI subjects from ADNI and perform prediction only with respect to the CI label (Fig. 2). Note, the ADNI data is not strictly gender matched as the CI-only cohort of UCSF is more balanced with respect to gender than the HIV-only cohort.
To ensure the robustness of model and reduce potential overfitting, we use a shared convolutional feature extractor across all three datasets. Given the differences in image acquisition across the three datasets, the extracted features most likely will have domain-specific distributions, so it will be extremely difficult for a single predictor to distinguish those effects from the fine-grained and interesting cues related to a neurological condition. While many studies solve this problem by domain adaption techniques that explicitly merge the domain shift across datasets, we separately classify the features from each dataset (in the multi-label or single-label setting) via domain-specific predictors (Wang et al., 2020). Specifically, let be the ensemble of MRIs from all three datasets, and , , be the three MLP predictors for the three domains:
| (2) |
Then the final multi-label and multi-domain classification objective function is defined as
| (3) |
i.e., we measure the multi-label prediction loss on the UCSF dataset and measure the single-label loss with respect to HIV and CI on the other two datasets.
4. Experimental Setup
This section describes the implementation of the baseline approaches and our proposed three-domain model, their evaluation, and determining ROIs critical for predicting the three conditions.
4.1. Implementation
The one-domain model contained a feature extractor and an MLP predictor. The feature extractor was designed as 4 stacks of 3 × 3 × 3 convolution with dimension (16, 32, 64, 32), ReLU activation, batch normalization, and max-pooling layers. The MLP consisted of 3 fully connected layers with dimension (2048, 128, 16) and ReLU activation. The two output logits for HIV and CI prediction were activated by the sigmoid function. The training of the one-domain model was confined to the UCSF dataset.
The two-domain model also predicted the HIV label for the SRI dataset by adding another MLP predictor to the feature extractor of the one-domain model. Note, we did not consider training only on MRIs of ADNI and UCSF as it further exacerbated the issue associated with the low sample size in the HIV-only cohort. Finally, was added for CI prediction on the ADNI dataset, which resulted in a three-domain model trained on all datasets. The architecture of the MLP predictor in the multi-domain models was the same as in the one-domain model.
To evaluate the benefit of our multi-label formulation, we implemented a multi-class model that used a single MLP predictor with a soft-max activation to directly differentiate the four cohorts from the 3 datasets. Finally, to justify the strategy of using separate predictors for each domain, we implemented a model (called ‘single-predictor’ here) that applied a single MLP predictor to data from all three domains (BCE loss only evaluated on the HIV prediction for the SRI domain and only on the CI prediction for ADNI).
4.2. Evaluation of Prediction Accuracy
In our experiments, 5-fold cross validation was used to evaluate the prediction accuracy of the models. For each of the 5 training runs, the models were trained for 100 epochs using the AdamW optimizer with its default setting (Paszke et al., 2019). A weight decay of 0.01 and 0.1 was applied to the feature extractor and the predictors. Focusing on modeling the bilateral effects linked to cognitive decline and HIV, we flipped each brain hemisphere (Prez-Garca et al., 2020) which also doubled the size of the training data. In addition, each resulting training image was augmented by applying random translation (± 2 voxels in each direction) and rotation (± 2 degrees in each direction). We randomly sampled 10 subjects from each cohort of a dataset and combined them into a mini-batch. This practice implicitly set the parameter , if the ith sample belongs to dataset ( is the number of subjects in ). This practice reduces the risk of the model biasing predictions towards the larger dataset.
For each epoch, we measured the prediction accuracy for each cohort of the UCSF dataset as the recall rate averaged over the 5 testing folds. To do so, we computed the average prediction scores (after sigmoid activation) over the last 10 epochs to avoid potential oscillation caused by the stochastic gradient descent. The average scores of the two labels were then binarized and compared with their ground-truth. We also recorded the balanced accuracy, i.e., the average recall over the four cohorts, and the standard deviation of the per-cohort accuracy to measure the overall performance of the models.
We tested whether the accuracy scores of a model were significantly higher than those of a null classifier (random classifier) based on a non-parametric permutation testing. Specifically, on the UCSF dataset we ran the null classifier 5,000 times, which randomly assigned each sample into one of the four cohorts with an impartial probability of 25%. We then built the null distributions for the per-cohort and balanced accuracy and derived one-tailed p-values based on the true accuracy scores of our model. Further, we tested whether the proposed three-domain model was significantly more accurate than other models using the Hardin-Shumway test (Hardin and Shumway, 1997), which is also a non-parametric test that builds the null distribution of accuracy scores by boot-strapping model predictions.2 Two-tailed p < 0.05 was used as the significance level for these two statistical tests.
Finally, we tested if predictions (i.e, CI or HIV) were significantly affected (p < 0.05) by potential confounders age, sex, and head size. We did so by fitting for each prediction a general linear model (GLM) between the corresponding prediction logit (i.e, before sigmoid activation) and the three confounders. The fitting was confined to the Controls across the 5 folds as we have done in prior publications (Adeli et al., 2018b; Zhao et al., 2020; Park et al., 2018).
4.3. Identifying Critical ROIs for Prediction
We identified brain regions significantly driving model predictions via a saliency visualization technique based on guided back-propagation (Springenberg et al., 2014). Given an MRI of the test set (registered to the SRI24 atlas), the approach quantified the saliency of a voxel as the partial derivative of the prediction value with respect to the voxel intensity. Since our model had two prediction outputs, we derived two saliency values sHIV and sCI at each voxel and used (sHIV + sCI)/2 to encode the saliency associated with HAND (i.e., a small change in the voxel intensity could increase the prediction values for both labels). The saliency values were then averaged between the left and right hemispheres in line with the data augmentation pipeline. We further normalized the saliency map by the 95% quantile of the saliency values (to avoid outliers in the map) and computed the average saliency map over the entire cohort. Voxels with z-score > 3 were identified as the patterns associated with HAND, and they were overlaid with the SRI24 atlas (Rohlfing et al., 2010b) to identify critical brain regions. In addition, we also visualized regions that were more critical for HIV prediction relative to CI by computing max(sHIV − sCI, 0), and visualized the CI patterns with max(sCI − sHIV, 0). Steps of bilateral average, normalization, group average, z-score thresholding, and overlaying with the SRI24 atlas were repeated for either saliency map.
5. Results
We first present the prediction accuracy of the model in comparison to the baselines. A post-hoc analysis then further legitimizes the prediction scores of the CI label. We end the section by displaying brain regions critical for HIV, CI, and HAND prediction.
5.1. Cross Validation
The bAcc curves of all models converged after 100 epochs (Fig. 3) as there was no significant increase in bAcc over the last 50 epochs (one-tailed p > 0.5). Fig. 4a plots the bAcc of each model over the last 10 epochs.
Figure 3:

Prediction accuracy (averaged over 5 testing folds and last 10 epochs) for each cohort and the balanced accuracy (bAcc) over the four cohorts. The prediction accuracy of a null (random) classifier is 25%.
Figure 4:

(a) Distribution of bAcc over the last 10 epochs for each model. (b) Confusion matrix of the three-domain model.
According to Fig. 4a and Table 3, the multi-class model resulted in lower bAcc than all other models based on multi-label classification, which highlighted the efficacy of multi-label formulation in studying the interaction of multiple conditions. Among the four multi-label models, the accuracy scores generally increased with the number of domains used during training. Specifically, the one-domain model resulted in a bAcc of 49.4%, which was significantly lower than the three-domain model (p = 0.015, Hardin-Shumway test). Moreover, the accuracy (recall rate) of HIV-only prediction from the one-domain model was not significantly higher than chance (p = 0.21, permutation test). The one-domain model also recorded the largest variation in terms of per-cohort accuracy (±18.4%), indicating the predictive power of the model was highly imbalanced across cohorts. When the SRI dataset was added to the model, the bAcc of the two-domain model increased to 52.5%. Although this accuracy was not significantly lower than that of the three-domain model, the accuracy in HIV-only remained low and not significantly higher than chance (p = 0.19, permutation test). Moreover, the across-cohort variation in prediction accuracy still remained large for the two-domain model (±18.0%). Finally, when all three datasets were considered, the three-domain model achieved the highest bAcc (55.1%), lowest across-cohort variation (±13.2%, see also confusion matrix in Fig. 4b), and best prediction for the HIV-only cohort (43% recall, p = 0.0019, permutation test).
Table 3:
Prediction accuracy of each cohort and the balanced accuracy (bAcc) of the four cohorts for different models. Each model is characterized by either multi-class or multi-label prediction and by the datasets used for training (in brackets). The best result in each row is bold.
|
Multi-class (All) |
Multi-Label | ||||
|---|---|---|---|---|---|
| Ours | |||||
|
One-Domain (UCSF) |
Single-Predictor (ALL) |
Two-Domain (UCSF+SRI) |
Three-Domain (All) |
||
| Control | 55.7±8.0% | 51.8±10.2% | 43.5±13.4% † | 51.9±9.1% | 51.8±7.5% |
| CI-only | 65.3±6.1% † | 73.4±4.8% | 71.6±5.3% | 76.1±6.7% | 74.0±3.4% |
| HIV-only | 24.6±12.3% †* | 29.6±4.7% †* | 43.6±16.4% | 32.9±13.7% * | 43.9±13.6% |
| HAND | 49.6±8.6% | 42.8±9.3% † | 49.6±5.8% | 49.6±12.6% | 51.0±13.6% |
| bAcc | 48.8±3.6% † | 49.4±1.7% † | 52.1%±3.7 | 52.6%±7.6 | 55.2±4.7% |
| Std | 17.5% | 18.4% | 13.4% | 18.0% | 13.2% |
Accuracy not significantly higher than chance (two-tailed p > 0.05, permutation test)
Accuracy significantly lower than the three-domain model (two-tailed p < 0.05, Hardin-Shumway test).
Note, the CI-only cohort of ADNI was composed of all MCI individuals. When further augmenting it with subjects diagnosed with AD from ADNI, the prediction accuracy for the CI-only cohort of the UCSF dataset did not further improve. The limited impact of adding AD samples to the training was potentially due to AD classification being a much easier task compared to MCI classification. Furthermore, the predictions of the three-domain model were not confounded by age, gender, or brain size (based on the GLM test). Finally, training the single-predictor model on all three datasets (without using domain-specific predictors) resulted in lower prediction accuracy for all four cohorts than the three-domain model, which was significant for Controls (p = 0.012, Hardin-Shumway test). These results further motivate our modelling decision for using domain-specific predictors to account for the potential ‘domain-shift’ of the features extracted across datasets.
5.2. Analysis of CI Prediction Score
Further supporting our three-domain model was that it was the only model whose CI prediction scores for the 65 stable MCIs were significantly lower (two-tailed p = 0.03, Mann-Whitney U-test) than the 14 progressive MCIs (Fig. 5). Furthermore, of the 14 progressive MCIs, 13 were successfully predicted as CI by our model (Table 4, recall = 92.9%) while the recall rate of the stable MCIs was as expected much lower (i.e., 69.5%).
Figure 5:

CI prediction scores for the stable and progressive CI cohorts produced by our three-domain model.
Table 4:
Recall rates of 14 subjects who later progressed to Alzheimer’s disease and of 65 subjects with stable cognitive impairment.
| # of subjects | TP | FN | Recall | |
|---|---|---|---|---|
| Progressive CI | 14 | 13 | 1 | 92.9% |
| Stable CI | 65 | 45 | 20 | 69.2 % |
| Overall | 79 | 58 | 21 | 73.4% |
In addition to encoding CI subtypes, results from all multi-label models revealed that the logit of the CI prediction was also associated with motor performance. Specifically, we tested if the variance of the finger tapping (FT) score was significantly explained by age, sex, the binary group indicator g (0 for HIV-only, 1 for HAND) or the predicted CI logit by first fitting the following GLM model3 to the HIV-only and HAND cohorts:
| (4) |
t-tests were then used to examine whether each α coefficient significantly differed from 0.
Supporting our prior statement, the FT score was significantly associated with the CI logit produced by the three-domain model (α4 ≠ 0, p = 0.009, Pearson’s r = −0.21, Fig. 6b). This indicates that the model learned morphological information relevant to motor control, as the CI logit was able to stratify the HIV-infected individuals (including HAND) with respect to their motor performance4. FT was also significantly associated with g (α3 ≠ 0, p < 0.001, Fig. 6a), which encodes the group difference in cognitive ability between HIV-only and HAND subjects. This association comports with the exist literature frequently reporting strong link between cognitive impairment and motor dysfunction (Aggarwal et al., 2007; Wu et al., 2015).
Figure 6:

(a) Finger tapping scores of the HIV-only and HAND cohorts; (b) The finger tapping score correlates with the CI prediction score in either the HIV-only or HAND cohort.
5.3. Model Interpretation
Fig. 7(a) shows the brain regions critical for HAND prediction; i.e., regions that drove the model to produce positive predictions for both the HIV and CI labels. We observed that the strongest saliency associated with HAND was present in the temporal lobe, inferior frontal cortex, cerebellum, corpus callosum, and subcortical regions including the hippocampus. Among these regions, cerebellum and temporal lobe atrophy has been independently reported for HIV (Klunder et al., 2008; Sullivan et al., 2011; Zahr et al., 2019) and CI (Visser et al., 2002), suggesting that these regions are highly probable targets of HAND. Disruption to the cerebellum, which supports motor functions, also comported with the findings in the finger tapping analysis (Fig. 6). Among the other HAND-associated regions, the rectus located in the inferior frontal cortex and the corpus callosum were more specific to HIV infection (blue in Fig. 7(b)), which is in line with published data (Thompson et al., 2006) and our prior work noting frontal lobe atrophy (Clifford et al., 2017; Pfefferbaum et al., 2012, 2014, 2018). On the other hand, the hippocampus was found to be more affected in CI compared to HIV (red in Fig. 7(b)), which is consistent with the recognition of hippocampal atrophy as a key marker of MCI and AD (Mueller et al., 2010). However, as cognitive testing patterns have changed in the era of antiretroviral therapy (Woods et al., 2009), it is reasonable to speculate that hippocampal atrophy patterns may differ between HAND and CI-only subjects, particularly for older patients (Pfefferbaum et al., 2018).
Figure 7:
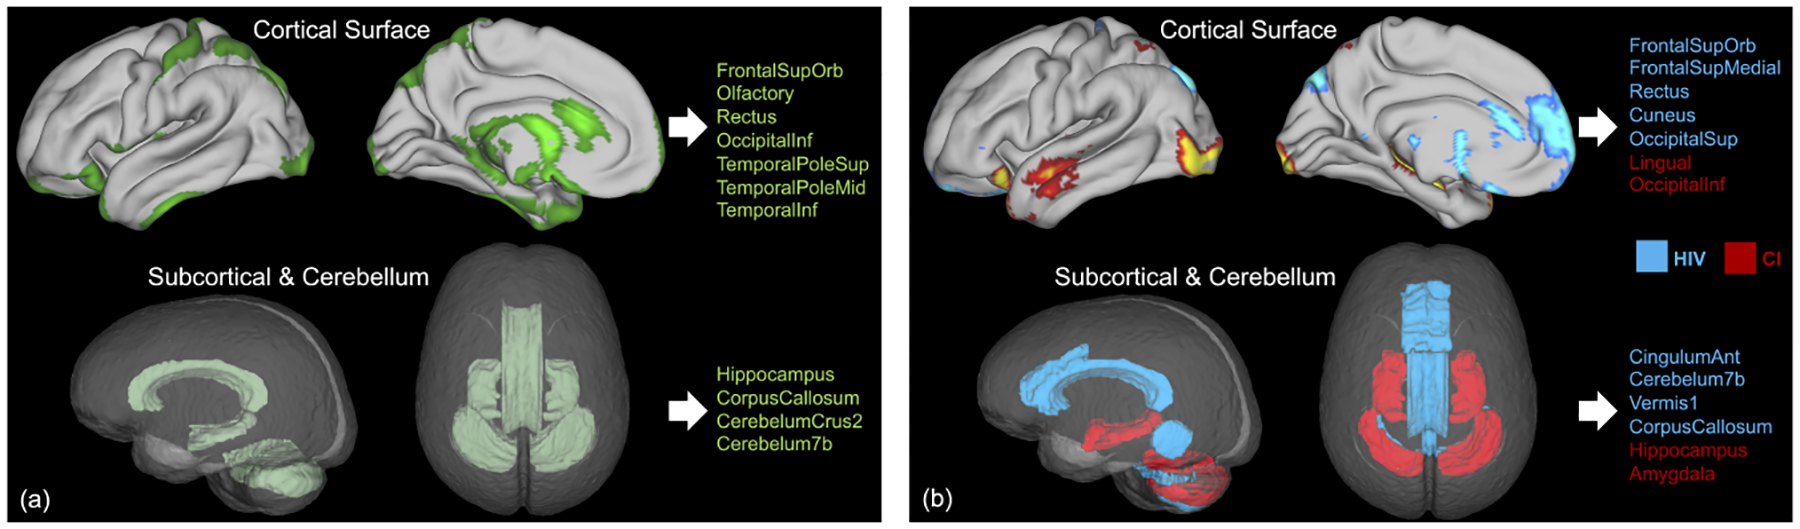
(a) Patterns associated with HAND identified by the multi-domain model. Important cortical regions with high saliency are displayed on the pial surface (top), and important subcortical and cerebellar regions are displayed in the glass brain (bottom); (b) Critical regions for HIV prediction (blue) and for CI prediction (red).
6. Limitations
The present study investigated prediction accuracies of all models on a fixed number of training epochs. A more principled way would have been to define the stopping criteria using a validation set. In our scenario, however, a further split (e.g., using a 70%/10%/20% split) of the undersampled HIV-only cohort (N = 37) would result in too few HIV-only cases in the validation set, potentially creating an excessive variation in the bAcc.
As it was, the small sample size in the HIV-only cohort negatively impacted the convergence of the approach (Fig. 3) as the accuracy curves for HIV-only exhibited the largest variation over epochs compared to the other three groups. Specifically, the model was overly sensitive (high recall) towards the HIV-only cohort in the beginning phase of the training as it could repeatedly sample through the very few HIV-only cases within a few mini-batches. As the training continued, the model tended to overfit on the few HIV-only cases resulting in poor generalizability to test data. This issue can be potentially resolved in future studies by adding more samples to the analysis as data collection of the UCSF study is ongoing.
Another limitation of the study was our approach for augmenting the training data by flipping the brain hemispheres. This resulted in the model only estimating the bilateral effects associated with the conditions. A principled way of disentangling unilateral effects (Kim et al., 2011; Shi et al., 2009) from the bilateral ones needs further investigation.
7. Conclusion
We have proposed a multi-label, multi-domain deep learning strategy to differentiate HIV-only, CI-only, and HAND based on MRI data. Results indicated that our classification accuracy outperformed baseline strategies and revealed factors explaining the severity of cognitive and psychomotor impairment. Brain regions related to the compounding effects of HAND converged with findings of recent studies that focused on HIV and CI. Our work not only sheds light on solving the small sample size problem in the context of analyzing multiple conditions, but also shows the potential in advancing the current HIV research focusing on rapid screening of cognitive impairment in clinical practice, improving our current understanding of HAND pathogenesis, and identification of potential biomarkers for therapeutic intervention.
Highlights.
Multi-label classification of individual and comorbid neurological conditions
Data augmentation from multi-domain data sets of single neurological conditions
Interaction and difference among normal aging, cognitive impairment, HIV, and HAND
8. Acknowledgments
Funding for this study was received from the U.S. National Institutes Health (NIH) grants (AA026762, AA021697, AA010723, AA017347, AG062422, DA041123, MH113406, NR015223, MH113560, and MH098759), Stanford HAI Google Cloud Credit, and the Larry H. Hillblom Foundation.
Footnotes
Publisher's Disclaimer: This is a PDF file of an unedited manuscript that has been accepted for publication. As a service to our customers we are providing this early version of the manuscript. The manuscript will undergo copyediting, typesetting, and review of the resulting proof before it is published in its final form. Please note that during the production process errors may be discovered which could affect the content, and all legal disclaimers that apply to the journal pertain.
Declaration of competing interest
None of the authors have biomedical financial interests or conflicts of interest with the reported data or their interpretation.
MRIs of 14 Control and 15 MCI subjects were omitted from the analysis as image processing failed on them.
The typical Fisher’s exact test can only be applied to binary classification setting but not to our multi-cohort scenario.
Head size was omitted in the model as FT is a non-imaging measure
Other multi-label models also resulted in significant association
References
- Adeli E, Kwon D, Pohl K, 2018a. Multi-label Transduction for Identifying Disease Comorbidity Patterns: 21st International Conference, Granada, Spain, September 16–20, 2018, Proceedings, Part III. pp. 575–583. doi: 10.1007/978-3-030-00931-1_66. [DOI] [PMC free article] [PubMed] [Google Scholar]
- Adeli E, Kwon D, Zhao Q, Pfefferbaum A, Zahr NM, Sullivan EV, Pohl KM, 2018b. Chained regularization for identifying brain patterns specific to HIV infection. NeuroImage 183, 425–437. doi: 10.1016/j.neuroimage.2018.08.022. [DOI] [PMC free article] [PubMed] [Google Scholar]
- Adeli E, Zhao Q, Pfefferbaum A, Sullivan EV, Fei-Fei L, Niebles JC, Pohl KM, 2021. Representation learning with statistical independence to mitigate bias, in: IEEE Winter Conference on Applications of Computer Vision (WACV), pp. 2512–2522. [DOI] [PMC free article] [PubMed] [Google Scholar]
- Adeli E, Zhao Q, Zahr NM, Goldstone A, Pfefferbaum A, Sullivan EV, Pohl KM, 2020. Deep learning identifies morphological determinants of sex differences in the pre-adolescent brain. NeuroImage 223, 1–13. doi: 10.1016/j.neuroimage.2020.117293. [DOI] [PMC free article] [PubMed] [Google Scholar]
- Aggarwal N, Wilson R, Beck T, Bienias J, Bennett D, 2007. Motor dysfunction in mild cognitive impairment and the risk of incident Alzheimer disease. Archives of Neurology 63, 1763–9. doi: 10.1001/archneur.63.12.1763. [DOI] [PubMed] [Google Scholar]
- Akuzawa K, Iwasawa Y, Matsuo Y, 2019. Adversarial invariant feature learning with accuracy constraint for domain generalization, in: Brefeld U, Fromont É, Hotho A, Knobbe AJ, Maathuis MH, Robardet C (Eds.), Machine Learning and Knowledge Discovery in Databases - European Conference, ECML PKDD 2019, Würzburg, Germany, September 16–20, 2019, Proceedings, Part II, Springer. pp. 315–331. URL: 10.1007/978-3-030-46147-8_19, doi:. [DOI] [Google Scholar]
- Albert M, DeKosky S, Dickson D, 2011. The diagnosis of mild cognitive impairment due to Alzheimer’s disease: Recommendations from the national institute on aging and Alzheimer’s association workgroup. Alzheimer’s & Dementia 7, 1–10. [DOI] [PMC free article] [PubMed] [Google Scholar]
- Antinori A, Arendt G, Becker J, Brew B, Byrd D, Cherner M, Clifford D, Cinque P, Epstein L, Goodkin K, Gisslen M, Grant I, Heaton R, Joseph J, Marder K, Marra C, Mcarthur J, Nunn M, Price R, Wojna V, 2007. Updated research nosology for HIV-associated neurocognitive disorders. Neurology 69, 1789–99. doi: 10.1212/01.WNL.0000287431.88658.8b. [DOI] [PMC free article] [PubMed] [Google Scholar]
- Axelrod B, Meyers J, Davis J, 2014. Finger tapping test performance as a measure of performance validity. The Clinical Neuropsychologist 28, 1–13. doi: 10.1080/13854046.2014.907583. [DOI] [PubMed] [Google Scholar]
- Baktashmotlagh M, Harandi MT, Lovell BC, Salzmann M, 2013. Unsupervised domain adaptation by domain invariant projection, in: Proceedings of the IEEE International Conference on Computer Vision (ICCV), pp. 769–776. [Google Scholar]
- Basaia S, Agosta F, Wagner L, Canu E, Magnani G, Santangelo R, Filippi M, 2018. Automated classification of Alzheimer’s disease and mild cognitive impairment using a single MRI and deep neural networks. NeuroImage: Clinical 21, 1–8. doi: 10.1016/j.nicl.2018.101645. [DOI] [PMC free article] [PubMed] [Google Scholar]
- Bondi M, Edmonds E, Jak A, Clark L, Delano-Wood L, McDonald C, Nation D, Libon D, Au R, Galasko D, Salmon D, 2014. Neuropsychological criteria for mild cognitive impairment improves diagnostic precision, biomarker associations, and progression rates. Journal of Alzheimer’s Disease : JAD 42, 275–89. doi: 10.3233/JAD-140276. [DOI] [PMC free article] [PubMed] [Google Scholar]
- Caruana R, 1993. Multitask learning: A knowledge-based source of inductive bias, in: ICML, p. 4148. [Google Scholar]
- Clifford K, Samboju V, Cobigo Y, Milanini B, Marx G, Hellmuth J, Rosen H, Kramer J, Allen I, Valcour V, 2017. Progressive brain atrophy despite persistent viral suppression in HIV over age 60. Journal of Acquired Immune Deficiency Syndromes (1999) 76, 289–297. doi: 10.1097/QAI.0000000000001489. [DOI] [PMC free article] [PubMed] [Google Scholar]
- Cox R, 1996. Afni: software for analysis and visualization of functional magnetic resonance neuroimages. Comput Biomed Res. 29, 162–73. [DOI] [PubMed] [Google Scholar]
- Duong L, Cohn T, Bird S, Cook P, 2015. Low resource dependency parsing: Cross-lingual parameter sharing in a neural network parser, in: Proceedings of the 53rd Annual Meeting of the Association for Computational Linguistics and the 7th International Joint Conference on Natural Language Processing (Volume 2: Short Papers), Association for Computational Linguistics, Beijing, China. pp. 845–850. URL: https://www.aclweb.org/anthology/P15-2139, doi: 10.3115/v1/P15-2139. [DOI] [Google Scholar]
- Ganin Y, Ustinova E, Ajakan H, Germain P, Larochelle H, Laviolette F, March M, Lempitsky V, 2016. Domain-adversarial training of neural networks. Journal of Machine Learning Research 17, 1–35. URL: http://jmlr.org/papers/v17/15-239.html. [Google Scholar]
- Ghosh A, Sarkar A, Mitsuya H, 2017. HIV-associated neurocognitive disorder (HAND) and the prospect of brain-penetrating protease inhibitors for antiretroviral treatment. Medical Research archives 5, 1–22. [PMC free article] [PubMed] [Google Scholar]
- Gong Y, Jia Y, Toshev A, Leung T, Ioffe S, 2014. Deep convolutional ranking for multilabel image annotation, in: International Conference on Learning Representations. [Google Scholar]
- Hardin P, Shumway JM, 1997. Statistical significance and normalized confusion matrices. Photogrammetric Engineering and Remote Sensing 63, 735–740. [Google Scholar]
- Heaton R, Franklin D Jr, Ellis R, Mccutchan JA, Letendre S, Leblanc S, 2010. HIV-associated neurocognitive disorders before and during the era of combination antiretroviral therapy: Differences in rates, nature, and predictors. J Neurovirol 17, 3–16. [DOI] [PMC free article] [PubMed] [Google Scholar]
- Hoffman J, Rodner E, Donahue J, Darrell T, Saenko K, 2013. Efficient learning of domain-invariant image representations, in: International Conference on Learning Representations (ICLR). [Google Scholar]
- Iglesias J, Liu CY, Thompson P, Tu Z, 2011. Robust brain extraction across datasets and comparison with publicly available methods. IEEE Transactions on Medical Imaging 30, 1617–34. doi: 10.1109/TMI.2011.2138152. [DOI] [PubMed] [Google Scholar]
- Jack C, Bernstein M, Fox N, Thompson P, Alexander G, Harvey D, Borowski B, Britson P, Whitwell J, Ward C, Dale A, Felmlee J, Gunter J, Hill D, Killiany R, Schuff N, Fox-Bosetti S, Lin C, Studholme C, Weiner M, 2008. The Alzheimer’s disease neuroimaging initiative (ADNI): MRI methods. Journal of Magnetic Resonance Imaging : JMRI 27, 685–91. doi: 10.1002/jmri.21049. [DOI] [PMC free article] [PubMed] [Google Scholar]
- Jenkinson M, Beckmann CF, Behrens TE, Woolrich MW, Smith SM, 2012. FSL. NeuroImage 62, 782–790. Doi: 10.1016/j.neuroimage.2011.09.015. [DOI] [PubMed] [Google Scholar]
- Kim JH, Lee J, Kim GH, Roh JH, Kim MJ, Seo S, Kim ST, Jeon S, Lee J, Heilman K, Na D, 2011. Cortical asymmetries in normal, mild cognitive impairment, and alzheimer’s disease. Neurobiology of Aging 33, 1959–66. doi: 10.1016/j.neurobiolaging.2011.06.026. [DOI] [PubMed] [Google Scholar]
- Klunder A, Chiang MC, Dutton R, Lee S, Toga A, Aizenstein H, Becker J, Thompson P, 2008. Mapping cerebellar degeneration in HIV/AIDS. Neuroreport 19, 1655–9. doi: 10.1097/WNR.0b013e328311d374. [DOI] [PMC free article] [PubMed] [Google Scholar]
- Lu Y, Kumar A, Zhai S, Cheng Y, Javidi T, Feris R, 2017. Fully-adaptive feature sharing in multi-task networks with applications in person attribute classification, in: CVPR, pp. 1131–1140. [Google Scholar]
- Majid M, Anwar S, 2018. Multi-class alzhiemer’s disease classification using image and clinical features. Biomedical Signal Processing and Control 43, 64–74. doi: 10.1016/j.bspc.2018.02.019. [DOI] [Google Scholar]
- Mei W, Deng W, 2018. Deep visual domain adaptation: A survey. Neurocomputing 312, 135–153. doi: 10.1016/j.neucom.2018.05.083. [DOI] [Google Scholar]
- Misra I, Shrivastava A, Gupta A, Hebert M, 2016. Cross-stitch networks for multi-task learning, in: 2016 IEEE Conference on Computer Vision and Pattern Recognition (CVPR), pp. 3994–4003. doi: 10.1109/CVPR.2016.433. [DOI] [Google Scholar]
- Mueller S, Schuff N, Yaffe K, Madison C, Miller B, Weiner M, 2010. Hippocampal atrophy patterns in mild cognitive impairment and Alzheimer’s disease. Human Brain Mapping 31, 1339–47. doi: 10.1002/hbm.20934. [DOI] [PMC free article] [PubMed] [Google Scholar]
- Murri R, Scoppettuolo G, Damiano F, Ammassari A, Fantoni M, Antinori A, 1996. Karnofsky performance status and assessment of global health status. J Acquir Immune Defic Syndr Hum Retrovirol. 13, 294–5. [DOI] [PubMed] [Google Scholar]
- Nam H, Han B, 2016. Learning multi-domain convolutional neural networks for visual tracking. arXiv:1510.07945. [Google Scholar]
- Park S, Zhang Y, Kwon D, Zhao Q, Zahr NM, Pfefferbaum A, Sullivan EV, Pohl KM, 2018. Alcohol use effects on adolescent brain development revealed by simultaneously removing confounding factors, identifying morphometric patterns, and classifying individuals. Scientific Reports 8, 1–14. doi: 10.1038/s41598-018-26627-7. [DOI] [PMC free article] [PubMed] [Google Scholar]
- Paszke A, Gross S, Massa F, Lerer A, Bradbury J, Chanan G, Killeen T, Lin Z, Gimelshein N, Antiga L, Desmaison A, Kopf A, Yang E, DeVito Z, Raison M, Tejani A, Chilamkurthy S, Steiner B, Fang L, Bai J, Chintala S, 2019. Pytorch: An imperative style, high-performance deep learning library, in: Advances in Neural Information Processing Systems 32. Curran Associates, Inc., pp. 8024–8035. URL: http://papers.neurips.cc/paper/9015-pytorch-an-imperative-style-high-performance-deep-learning-library.pdf. [Google Scholar]
- Paul R, Cho K, Luckett P, Strain J, Belden A, Bolzenius J, Navid J, Egan P, Cooley S, Wisch J, Boerwinkle A, Tomov D, Obosi A, Mannarino J, Ances B, 2020. Machine learning analysis reveals novel neuroimaging and clinical signatures of frailty in HIV. JAIDS Journal of Acquired Immune Deficiency Syndromes 84, 414–421. doi: 10.1097/QAI.0000000000002360. [DOI] [PMC free article] [PubMed] [Google Scholar]
- Payer C, tern D, Bischof H, Urschler M, 2018. Multi-label whole heart segmentation using cnns and anatomical label configurations, in: International Workshop on Statistical Atlases and Computational Models of the Heart, pp. 190–198. doi: 10.1007/978-3-319-75541-0_20. [DOI] [Google Scholar]
- Pfefferbaum A, Rogosa D, Rosenbloom M, Chu W, Sassoon S, Kemper C, Deresinski S, Rohlfing T, Zahr N, Sullivan E, 2014. Accelerated aging of selective brain structures in human immunodeficiency virus infection: A controlled, longitudinal magnetic resonance imaging study. Neurobiology of Aging 35, 1755–68. doi: 10.1016/j.neurobiolaging.2014.01.008. [DOI] [PMC free article] [PubMed] [Google Scholar]
- Pfefferbaum A, Rosenbloom M, Sassoon S, Kemper C, Deresinski S, Rohlfing T, Sullivan E, 2012. Regional brain structural dysmorphology in human immunodeficiency virus infection: Effects of acquired immune deficiency syndrome, alcoholism, and age. Biological Psychiatry 72, 361–70. doi: 10.1016/j.biopsych.2012.02.018. [DOI] [PMC free article] [PubMed] [Google Scholar]
- Pfefferbaum A, Zahr N, Sassoon S, Kwon D, Pohl K, Sullivan E, 2018. Accelerated and premature aging characterizing regional cortical volume loss in human immunodeficiency virus infection: Contributions from alcohol, substance use, and hepatitis c coinfection. Biological Psychiatry: Cognitive Neuroscience and Neuroimaging 3, 844–859. doi: 10.1016/j.bpsc.2018.06.006. [DOI] [PMC free article] [PubMed] [Google Scholar]
- Popuri K, Ma D, Wang L, Beg MF, 2020. Using machine learning to quantify structural MRI neurodegeneration patterns of Alzheimer’s disease into dementia score: Independent validation on 8,834 images from ADNI, AIBL, OASIS, and MIRIAD databases. Human Brain Mapping 41, 4127–4147. doi: 10.1002/hbm.25115. [DOI] [PMC free article] [PubMed] [Google Scholar]
- Prez-Garca F, Sparks R, Ourselin S, 2020. Torchio: a python library for efficient loading, preprocessing, augmentation and patch-based sampling of medical images in deep learning. arXiv:2003.04696. [DOI] [PMC free article] [PubMed] [Google Scholar]
- Ranzato M, Huang FJ, Boureau Y, LeCun Y, 2007. Unsupervised learning of invariant feature hierarchies with applications to object recognition, in: 2007 IEEE Conference on Computer Vision and Pattern Recognition, pp. 1–8. doi: 10.1109/CVPR.2007.383157. [DOI] [Google Scholar]
- Rohlfing T, Maurer CR Jr, Bluemke DA, Jacobs M, 2003. Volume-preserving nonrigid registration of mr breast images using free-form deformation with an incompressibility constraint. IEEE TMI 22, 730741. Doi: 10.1109/TMI.2003.814791. [DOI] [PubMed] [Google Scholar]
- Rohlfing T, Zahr NM, Sullivan EV, Pfefferbaum A, 2010a. The SRI24 multi-channel atlas of normal adult human brain structure. Hum. Brain Mapp 31, 798819. Doi: 10.1002/hbm.20906. [DOI] [PMC free article] [PubMed] [Google Scholar]
- Rohlfing T, Zahr NM, Sullivan EV, Pfefferbaum A, 2010b. The SRI24 multichannel atlas of normal adult human brain structure. Human Brain Mapping 31, 798–819. [DOI] [PMC free article] [PubMed] [Google Scholar]
- Ruder S, 2017. An overview of multi-task learning in deep neural networks arXiv:1706.05098. [Google Scholar]
- Rumbaugh J, Tyor W, 2015. Hiv-associated neurocognitive disorders. Neurology: Clinical Practice 5, 224–231. doi: 10.1212/CPJ.0000000000000117. [DOI] [PMC free article] [PubMed] [Google Scholar]
- Saloner R, Cysique L, 2017. Hiv-associated neurocognitive disorders: A global perspective. Journal of the International Neuropsychological Society 23, 860–869. doi: 10.1017/S1355617717001102. [DOI] [PMC free article] [PubMed] [Google Scholar]
- Shen D, Wu G, Suk HI, 2017. Deep learning in medical image analysis. Annual Review of Biomedical Engineering 19, 221–248. [DOI] [PMC free article] [PubMed] [Google Scholar]
- Shi F, Liu B, Yuan Z, Yu C, Jiang T, 2009. Hippocampal volume and asymmetry in mild cognitive impairment and alzheimer’s disease: Meta-analyses of MRI studies. Hippocampus 19, 1055–64. doi: 10.1002/hipo.20573. [DOI] [PubMed] [Google Scholar]
- Springenberg JT, Dosovitskiy A, Brox T, Riedmiller M, 2014. Striving for simplicity: The all convolutional net. arXiv preprint arXiv:1412.6806. [Google Scholar]
- Sullivan E, Rosenbloom M, Rohlfing T, Kemper C, Deresinski S, Pfefferbaum A, 2011. Pontocerebellar contribution to postural instability and psychomotor slowing in HIV infection without dementia. Brain Imaging and Behavior 5, 12–24. doi: 10.1007/s11682-010-9107-y. [DOI] [PMC free article] [PubMed] [Google Scholar]
- Thompson P, Dutton R, Hayashi K, Lu A, Lee SI, Lee J, Lopez O, Aizenstein H, Toga A, Becker J, 2006. 3d mapping of ventricular and corpus callosum abnormalities in HIV/AIDS. NeuroImage 31, 12–23. doi: 10.1016/j.neuroimage.2005.11.043. [DOI] [PubMed] [Google Scholar]
- Tsoumakas G, Katakis I, 2007. Multi-label classification: An overview. Int J Data Warehousing and Mining 3, 1–13. [Google Scholar]
- Tu W, Chen P, Koenig N, Gomez D, Fujiwara E, Gill M, Kong L, Power C, 2019. Machine learning models reveal neurocognitive impairment type and prevalence are associated with distinct variables in HIV/AIDS. Journal of NeuroVirology 26, 41–51. doi: 10.1007/s13365-019-00791-6. [DOI] [PubMed] [Google Scholar]
- Tzeng E, Hoffman J, Zhang N, Saenko K, Darrell T, 2014. Deep domain confusion: Maximizing for domain invariance. CoRR abs/1412.3474. URL: http://arxiv.org/abs/1412.3474, arXiv:1412.3474. [Google Scholar]
- Visser P, Verhey F, Hofman P, Scheltens P, Jolles J, 2002. Medial temporal atrophy predicts Alzheimer’s disease in patients with minor cognitive impairment. Journal of Neurology, Neurosurgery, and Psychiatry 72, 491–7. doi: 10.1136/jnnp.72.4.491. [DOI] [PMC free article] [PubMed] [Google Scholar]
- Wang J, Yang Y, Mao J, Huang Z, Huang C, Xu W, 2016. Cnn-rnn: A unified framework for multi-label image classification, in: Proceedings of the IEEE Conference on Computer Vision and Pattern Recognition (CVPR), pp. 2285–2294. [Google Scholar]
- Wang T, Zhao J, Yatskar M, Chang KW, Ordonez V, 2019. Balanced datasets are not enough: Estimating and mitigating gender bias in deep image representations, in: Proceedings of the IEEE/CVF International Conference on Computer Vision (ICCV), pp. 5309–5318. [Google Scholar]
- Wang Z, Qinami K, Karakozis I, Genova K, Nair P, Hata K, Russakovsky O, 2020. Towards fairness in visual recognition: Effective strategies for bias mitigation, in: IEEE Conference on Computer Vision and Pattern Recognition (CVPR), pp. 8916–8925. doi: 10.1109/CVPR42600.2020.00894. [DOI] [Google Scholar]
- Wenzel E, Avdoshina V, Mocchetti I, 2019. HIV-associated neurodegeneration: exploitation of the neuronal cytoskeleton. Journal of NeuroVirology 25, 301–312. doi: 10.1007/s13365-019-00737-y. [DOI] [PMC free article] [PubMed] [Google Scholar]
- Willemink M, Koszek W, Hardell C, Wu J, Fleischmann D, Harvey H, Folio L, Summers R, Rubin D, Lungren M, 2020. Preparing medical imaging data for machine learning. Radiology 295, 4–15. doi: 10.1148/radiol.2020192224. [DOI] [PMC free article] [PubMed] [Google Scholar]
- Woods S, Moore D, Weber E, Grant I, 2009. Cognitive neuropsychology of HIV-associated neurocognitive disorders. Neuropsychology Review 19, 152–68. doi: 10.1007/s11065-009-9102-5. [DOI] [PMC free article] [PubMed] [Google Scholar]
- Wosiak A, Glinka K, Zakrzewska D, 2017. Multi-label classification methods for improving comorbidities identification. Computers in Biology and Medicine 100, 279–288. doi: 10.1016/j.compbiomed.2017.07.006. [DOI] [PubMed] [Google Scholar]
- Wu F, Wang Z, Zhang Z, Yang Y, Luo J, Zhu W, Zhuang Y, 2015. Weakly semi-supervised deep learning for multi-label image annotation. IEEE Transactions on Big Data 1, 109–122. doi: 10.1109/TBDATA.2015.2497270. [DOI] [Google Scholar]
- Wu Q, Chan SY, Yan J, 2015. Mild cognitive impairment affects motor control and skill learning. Reviews in the Neurosciences 27, 197–217. doi: 10.1515/revneuro-2015-0020. [DOI] [PubMed] [Google Scholar]
- Xie Q, Dai Z, Du Y, Hovy E, Neubig G, 2017. Controllable invariance through adversarial feature learning, in: Guyon I, Luxburg UV, Bengio S, Wallach H, Fergus R, Vishwanathan S, Garnett R (Eds.), Advances in Neural Information Processing Systems, Curran Associates, Inc.. pp. 585–596. URL: https://proceedings.neurips.cc/paper/2017/file/8cb22bdd0b7ba1ab13d742e22eed8da2-Paper.pdf. [Google Scholar]
- Xu Y, Lin Y, Bell R, Towe S, Pearson J, Nadeem T, Chan C, Meade C, 2021. Machine learning prediction of neurocognitive impairment among people with hiv using clinical and multimodal magnetic resonance imaging data. Journal of NeuroVirology 27, 111. doi: 10.1007/s13365-020-00930-4. [DOI] [PMC free article] [PubMed] [Google Scholar]
- Yang Y, Hospedales TM, 2017. Trace norm regularised deep multi-task learning, in: 5th International Conference on Learning Representations, ICLR 2017, Toulon, France, April 24–26, 2017, Workshop Track Proceedings, Open-Review.net. URL: https://openreview.net/forum?id=rknkNR7Ke. [Google Scholar]
- Zahr N, Pohl K, Pfefferbaum A, Sullivan E, 2019. Dissociable contributions of precuneus and cerebellum to subjective and objective neuropathy in HIV. Journal of Neuroimmune Pharmacology 14, 436–447. doi: 10.1007/s11481-019-09837-2. [DOI] [PMC free article] [PubMed] [Google Scholar]
- Zhang X, Zhao H, Zhang S, li R, 2019. A novel deep neural network model for multi-label chronic disease prediction. Frontiers in Genetics 10, 1–11. doi: 10.3389/fgene.2019.00351. [DOI] [PMC free article] [PubMed] [Google Scholar]
- Zhang Y, Kwon D, Esmaeili P, Pfefferbaum A, Sullivan E, Javitz H, Valcour V, Pohl K, 2016. Extracting patterns of morphometry distinguishing HIV associated neurodegeneration from mild cognitive impairment via group cardinality constrained classification: Morphometric patterns parting HAND from MCI. Human Brain Mapping 37, 45234538. doi: 10.1002/hbm.23326. [DOI] [PMC free article] [PubMed] [Google Scholar]
- Zhao H, des Combes RT, Zhang K, Gordon GJ, 2019. On learning invariant representations for domain adaptation, in: Chaudhuri K, Salakhutdinov R (Eds.), Proceedings of the 36th International Conference on Machine Learning, ICML 2019, 9–15 June 2019, Long Beach, California, USA, PMLR. pp. 7523–7532. URL: http://proceedings.mlr.press/v97/zhao19a.html. [Google Scholar]
- Zhao Q, Adeli E, Pohl KM, 2020. Training confounder-free deep learning models for medical applications. Nature Communications 11, 1–9. doi: 10.1038/s41467-020-19784-9. [DOI] [PMC free article] [PubMed] [Google Scholar]