

Abstract
Loss-of-function mutations of JAK1/2 impair cancer cell responsiveness to IFN-γ and immunogenicity. Therefore, an understanding of compensatory pathways to activate IFN-γ signaling in cancer cells is clinically important for the success of immunotherapy. Here we demonstrate that the transcription factor SOX10 hinders immunogenicity of melanoma cells through the IRF4-IRF1 axis. Genetic and pharmacological approaches revealed that SOX10 repressed IRF1 transcription via direct induction of a negative regulator, IRF4. The SOX10-IRF4-IRF1 axis regulated PD-L1 expression independently of JAK-STAT pathway activity, and suppression of SOX10 increased the efficacy of combination therapy with an anti-PD-1 antibody and HDAC inhibitor against a clinically relevant melanoma model. Thus, the SOX10-IRF4-IRF1 axis serves as a potential target that can bypass JAK-STAT signaling to immunologically warm up melanoma with a “cold” tumor immune microenvironment.
Keywords: SOX10, melanoma, PD-L1, IRF1, immune checkpoint inhibitor
Introduction
Unresponsiveness to cancer immunotherapies, including immune checkpoint inhibitors (ICBs), is mainly determined by the immunogenicity of the cancer cells as well as surrounding tumor microenvironment (TME) (1). In general, an immunologically inflamed “hot” TME shows a signature of anti-tumor CD8+ T cell responses and corresponds to better clinical responses to ICBs, whereas an immunologically “cold” TME corresponds to poor clinical responses to ICBs (2). In such immunologically “cold” TME, cancer cells often show low immunogenicity because of their low mutation burden (3), lacking expression of cancer-specific or -associated antigens, or impairing antigen-presentation machineries (4–6); therefore, they cannot be recognized by anti-tumor CD8+ T cells.
IFN-γ is a pro-inflammatory cytokine and mainly produced by cytotoxic CD8+ T cells, NK cells, and type I helper CD4+ T (Th1) cells. Once it binds to a specific receptor, IFN-γ activates the JAK-STAT signaling pathway and induces pro-inflammatory gene expression through the transcription of interferon regulatory factor 1 (IRF1). IRF1 is considered as a master regulator of cell immunogenicity because many of its target genes are critical for determining the immunogenicity of cells such as antigen-presenting molecules (MHC class I, TAP, β2M) (7) and ligands of immune inhibitory receptors (PD-L1 and PD-L2) (8). In particular, the association between PD-L1 expression on cancer cells and clinical responsiveness to ICBs has been reported in a variety of cancers including melanoma, which is one of the most immunogenic cancer types (9–12). Recently, JAK1/2 mutation was identified as both a primary and acquired mechanism of resistance to ICBs in cancers including melanoma (5,6). By lacking responsiveness to IFN-γ with loss-of-function mutations of JAK1/2, the immunogenicity of cancer cells is significantly impaired; therefore, having an understanding of other by-passing pathways that activate IRF1 in cancer cells is clinically important.
In this study, we demonstrate that SOX10 regulates the immunogenicity of melanoma through transcriptional control of the IRF4-IRF1 axis. Using both genetic and pharmacological approaches, we also demonstrate that SOX10 represses IRF1 transcription through the direct induction of a negative IRF1 regulator, IRF4. Importantly, the SOX10-IRF4 axis independently regulates IRF1 expression from the JAK-STAT signaling pathway in melanoma, and the suppression of SOX10 is involved in the efficacy of combination therapy of anti-PD-1 antibody and HDAC inhibitor against a clinically-relevant murine melanoma model.
Materials and Methods
Reagents and Plasmids
JAK inhibitor, Baricitinib, was purchased from MedChem Express (Tokyo, Japan). Histone deacetylase inhibitors used were vorinostat (suberoylanilide hydroxamic acid) (Cayman Chemical, Ann Arbor, MI, USA), TMP269 (Cayman Chemical), ACY-1215 (BioVision, Milpitas, CA, USA), RGFP109 (MedChemExpress, Monmouth Junction, NJ, USA), CAY10683 (Cayman Chemical), and BRD73954 (Sigma-Aldrich).
The plasmids used were pLenti CMV-E2/Crimson and pLenti-CMV-SOX10, which subcloned E2-Crimson fluorescent gene (Takara Bio, Shiga, Japan) human SOX10 cDNA into pLenti CMV Hygro DEST (13) (a gift from Eric Campeau & Paul Kaufman (Addgene plasmid # 17454)). pLNCX and pLNCX-SOX10 were described previously(14).
Cell cultures
Human melanoma lines UACC62, UACC257, and Malme-3M were obtained from the National Cancer Institute. 501mel was a gift from Ruth Halaban (Yale University Medical School, New Haven, CT). Other human melanoma cell lines were from American Type Culture Collection. UACC257, A2058, SK-MEL-28, Malme-3M, UACC62, and SK-MEL-2 human melanoma cells were cultured in RPMI-1640 medium (Nissui, Tokyo, Japan) containing 10% fetal bovine serum (FBS) and penicillin/streptomycin/L-glutamine. A375, MeWo, Hs 940.T, M14, and SK-MEL-5 human melanoma cells were cultured in Dulbecco’s Modified Eagle’s Medium (Nissui) containing 10% FBS and penicillin/streptomycin/L-glutamine. RPMI-7951 human melanoma cells were cultured in Eagle’s Minimum Essential Medium (Nissui) containing 10% FBS and penicillin/streptomycin/L-glutamine. The D4M melanoma cell line was a gift from David Mullins (15). The D4M.3A.3 cell line, referred to as D4M in this study, was derived from single cell cloning of D4M.3A, as described previously (16).
For siRNA knock down experiments, siRNA for SOX10 (s13309 and s13310, Thermo Fisher Scientific, Rockford, IL, USA), siRNA for IRF1 (s7503, Thermo Fisher Scientific), siRNA for IRF4 (s7511, Thermo Fisher Scientific), or negative control #1 (Thermo Fisher Scientific) was used for transfection at a final concentration of 12.5 nM of melanoma cells by Lipofectamine RNAiMAX reagent (Thermo Fisher Scientific).
The stable A375 transformed cells containing pLNCX empty or pLNCX-SOX10 (full-length SOX10) (14) were selected with G418 (500 μg/mL) (Sigma-Aldrich), and referred to as A375 (–) and A375/SOX10. The stable A2058 transformed cells containing pLenti CMV-E2/Crimson or pLenti-CMV-SOX10 were selected with hygromycin (400 μg/mL) (Sigma-Aldrich), and referred to as A2058 (–) and A2058 SOX10. The stable D4M/SOX10 cells were established similarly to A2058/SOX10 cells.
Gene expression and bioinformatics
Gene profiles were analyzed by GenePattern (Broad Institute of Harvard and MIT). Publically available datasets used in this paper were GSE7127 containing 63 melanomas (17) and data on 62 skin cancers were obtained from the Broad Novartis Cancer Cell line Encyclopedia (http://www.broadinstitute.org/ccle/home) (18). Pearson’s Correlation values of other mRNA expressions with PD-L1 mRNA expression were calculated by Excel.
qRT-PCR
Total RNAs were prepared using RNeasy Plus Mini Kit (Thermo Fisher Scientific) from human melanoma cells. qRT-PCR was performed using One Step SYBR PrimeScript RT-PCR Kit II (Perfect Real-Time) (Takara Bio). The primers used were: 5’-AGC TCA GCA AGA CGC TGG-3’ (sense) and 5’-CTT TCT TGT GCT GCA TAC GG-3’ (antisense) for SOX10 mRNA, 5’-CCA GCA CAC TGA GAA TCA ACA-3’ (sense) and 5’-ATT TGG AGG ATG TGC CAG AG-3’ (antisense) for PD-L1 mRNA, 5’- CTT CCA TGG GAT CTG GAA GA −3’ (sense) and 5’- GAC CCT GGC TAG AGA TGC AG −3’ (antisense) for IRF1 mRNA, and 5’-GCA CAG AGC CTC GCC TT-3’ (sense) and 5’-GTT GTC GAC GAC GAG CG-3’ (antisense) for β-actin mRNA. All reactions were run in triplicate, and mRNA levels were normalized to β-actin mRNA expression. To check correlations, expression values for each gene were normalized to a mean of zero and a standard deviation of one.
Flow cytometry
Cells were reverse transfected with 12.5 nM siRNA for 96 hours, as above, treated with each HDAC inhibitor for 24 hours, or treated with IFN-γ for 24 hours. Human or mouse CD274 was stained with PE-conjugated anti-human or mouse CD274 antibody (eBioscience). Human CD273 or HLA-A/B/C was stained with PE-conjugated anti-human CD273 antibody (eBioscience) or FITC-conjugated anti-human HLA-ABC (BD Pharmingen). For staining immune cells in melanoma tissues, FITC-anti-CD3ε (2C11), PE-anti-CD4, PerCP Cy5.5-anti-NK1.1 (PK136), PE Cy7-anti-4–1BB, and APC-anti-CD8 antibody were purchased from BioLegend or eBioscience. All flow cytometry data were analyzed using FlowJo software (Treestar Software).
Western blotting analysis
Whole-cell extracts (10 μg/lane) or nuclear extracts were prepared using the method of Schreiber, E. et al.(19) and then subjected to Western blotting analysis using anti-SOX10 antibody (Santa Cruz), anti-MITF antibody (C5), anti-IRF4 antibody (Santa Cruz), anti-IRF1 antibody (Cell Signaling Technology, Danvers, MA, USA), anti-α-tubulin antibody (Sigma), or anti-Histone H3 antibody (Abcam). The band intensities were measured by ImageJ and normalized to that of each control lane.
Chromatin immunoprecipitation assay (ChIP)
ChIP assays were performed as described previously (20). Antibody used was anti-RNA polymerase II serine2 phosphorylation (Abcam, MA, USA) or anti-SOX10 antibody (Santa cruz). Primers used were; 5’- GAG GAA ACT GAG GTC CAA AGA A −3’ (sense) and 5’- GCC CAG ACT TCA GAG CTA ATC −3’ (antisense) for the PD-L1 intron 3 gene region, 5’- GCA AAG GCA TTC CAC TGT TC −3’ (sense) and 5’- GCA TCT TCT ACC TCC ATC CAT AC −3’ (antisense) for the PD-L1 exon 7 gene region, 5’- TGG AGG GAA TCG TGA CCT A −3’ (sense) and 5’- GCT AAG ACC AGG ACG CTA AC −3’ (antisense) for the IRF1 intron 1 gene region, 5’- AGG GCA GCT GAT CTC TTC A −3’ (sense) and 5’- GGC TAA ACC TGG CAC CAA A −3’ (antisense) for the IRF4 intron 4 gene region, and 5’- TGG GCT GTT TCT GGT AAT CA −3’ (sense) and 5’- CAC CTT GGA ATT TCC TGT GC −3’ (antisense) for the MIA gene region.
TCGA patient survival data
We classified the TCGA melanoma patients as SOX10low and SOX10high based on the bottom and top quintile of SOX10 mRNA expression, respectively. We used the ‘lifelines’ package for Python to plot Kaplan-Meier curves and to compute the associated log-rank p-value. In order to control for age, we also evaluated age-adjusted p-values using the Cox model with two parameters: patient age and indicator variable specifying SOX10high and SOX10low groups. Since in the latest version of the TCGA data, the expression value of SOX10 is erroneously set to zero for all TCGA samples across all cancers, our patient survival analysis used the legacy TCGA data downloaded from the GDC Legacy Archive on March 26, 2021.
Animal model
C57BL/6 mice (6 weeks old) were purchased from Japan SLC Inc. (Hamamatsu, Japan). All experiments were approved and performed according to the guidelines of the Care and Use of Laboratory Animals of University of Toyama. The D4M or D4M/SOX10 cells were inoculated s.c. (5 × 10⁵ cells/100 μL in PBS/mice) into the flanks of anesthetized mice. Mice in each group intra-peritoneally received vorinostat in 10% DMSO solution (25 mg/kg/day) or vehicle every day and anti-PD-1 antibody (10 mg/kg/day, RMP1–14, BioXcell, Lebanon, NH) on Days 7 and 9. The tumor volume was assessed every two days starting from day 3. The data are presented as the mean luminescence ± SEM.
Statistical analysis
Significance was calculated using Graphpad Prism software (GraphPad Software, Inc., San Diego, CA, USA). All statistical analysis were performed using the data from at least three independent experiments. More than three means were compared using two- or one-way ANOVA with Bonferroni correction, and two means were compared using the unpaired Student’s t-test. P<0.01 was considered significant.
Results
SOX10 is negatively correlated with PD-L1 expression in melanoma.
To identify genes that intrinsically regulate PD-L1 expression in melanoma, we first examined the correlation of gene expression relative to PD-L1 in melanoma using publically available datasets (GSE7127 (17) and datasets from the Broad Novartis Cancer Cell line Encyclopedia (CCLE) (18)) (Fig. 1A and Supplementary Fig. S1). A gene with one of the strongest negative correlations with PD-L1 expression in melanoma is SOX10 (Pearson correlation values are −0.554, top of 54676 probes in GSE7127, and −0.621, ninth of 18988 genes in CCLE, respectively), and it was also confirmed in mRNA expression (Pearson correlation value is −0.349) (Fig. 1B). To determine the negative correlation at protein levels of SOX10 and PD-L1, we used four melanoma cell lines that have a distinct SOX10 expression status (Fig. 1C). As shown in Figure 1C, the cell surface expression of PD-L1 on melanoma cell lines with a high SOX10 status (UACC257 and A2058) was lower than that on melanoma cells with a low SOX10 status (RPMI7951 and Hs.940.T). The expression of SOX10 in UACC257 and A2058 cells should be functional because MITF, which is a down-stream target of SOX10 (21–24), was co-expressed in those cells. In order to examine the clinical relevance of our findings in melanoma patients, we reanalyzed the dataset of gene expression of melanoma patients by classifying the SOX10high and SOX10low status. As shown in Figure 1D, there was a strong correlation with poor survival in patients with the SOX10high status compared with the patients with the SOX10low status, therefore SOX10 expression could serve as a prognostic factor in melanoma patients (age adjusted Cox regression p-value = 0.041, log rank p-value = 0.023).
Figure 1. SOX10 is negatively correlated with PD-L1 expression in melanoma.
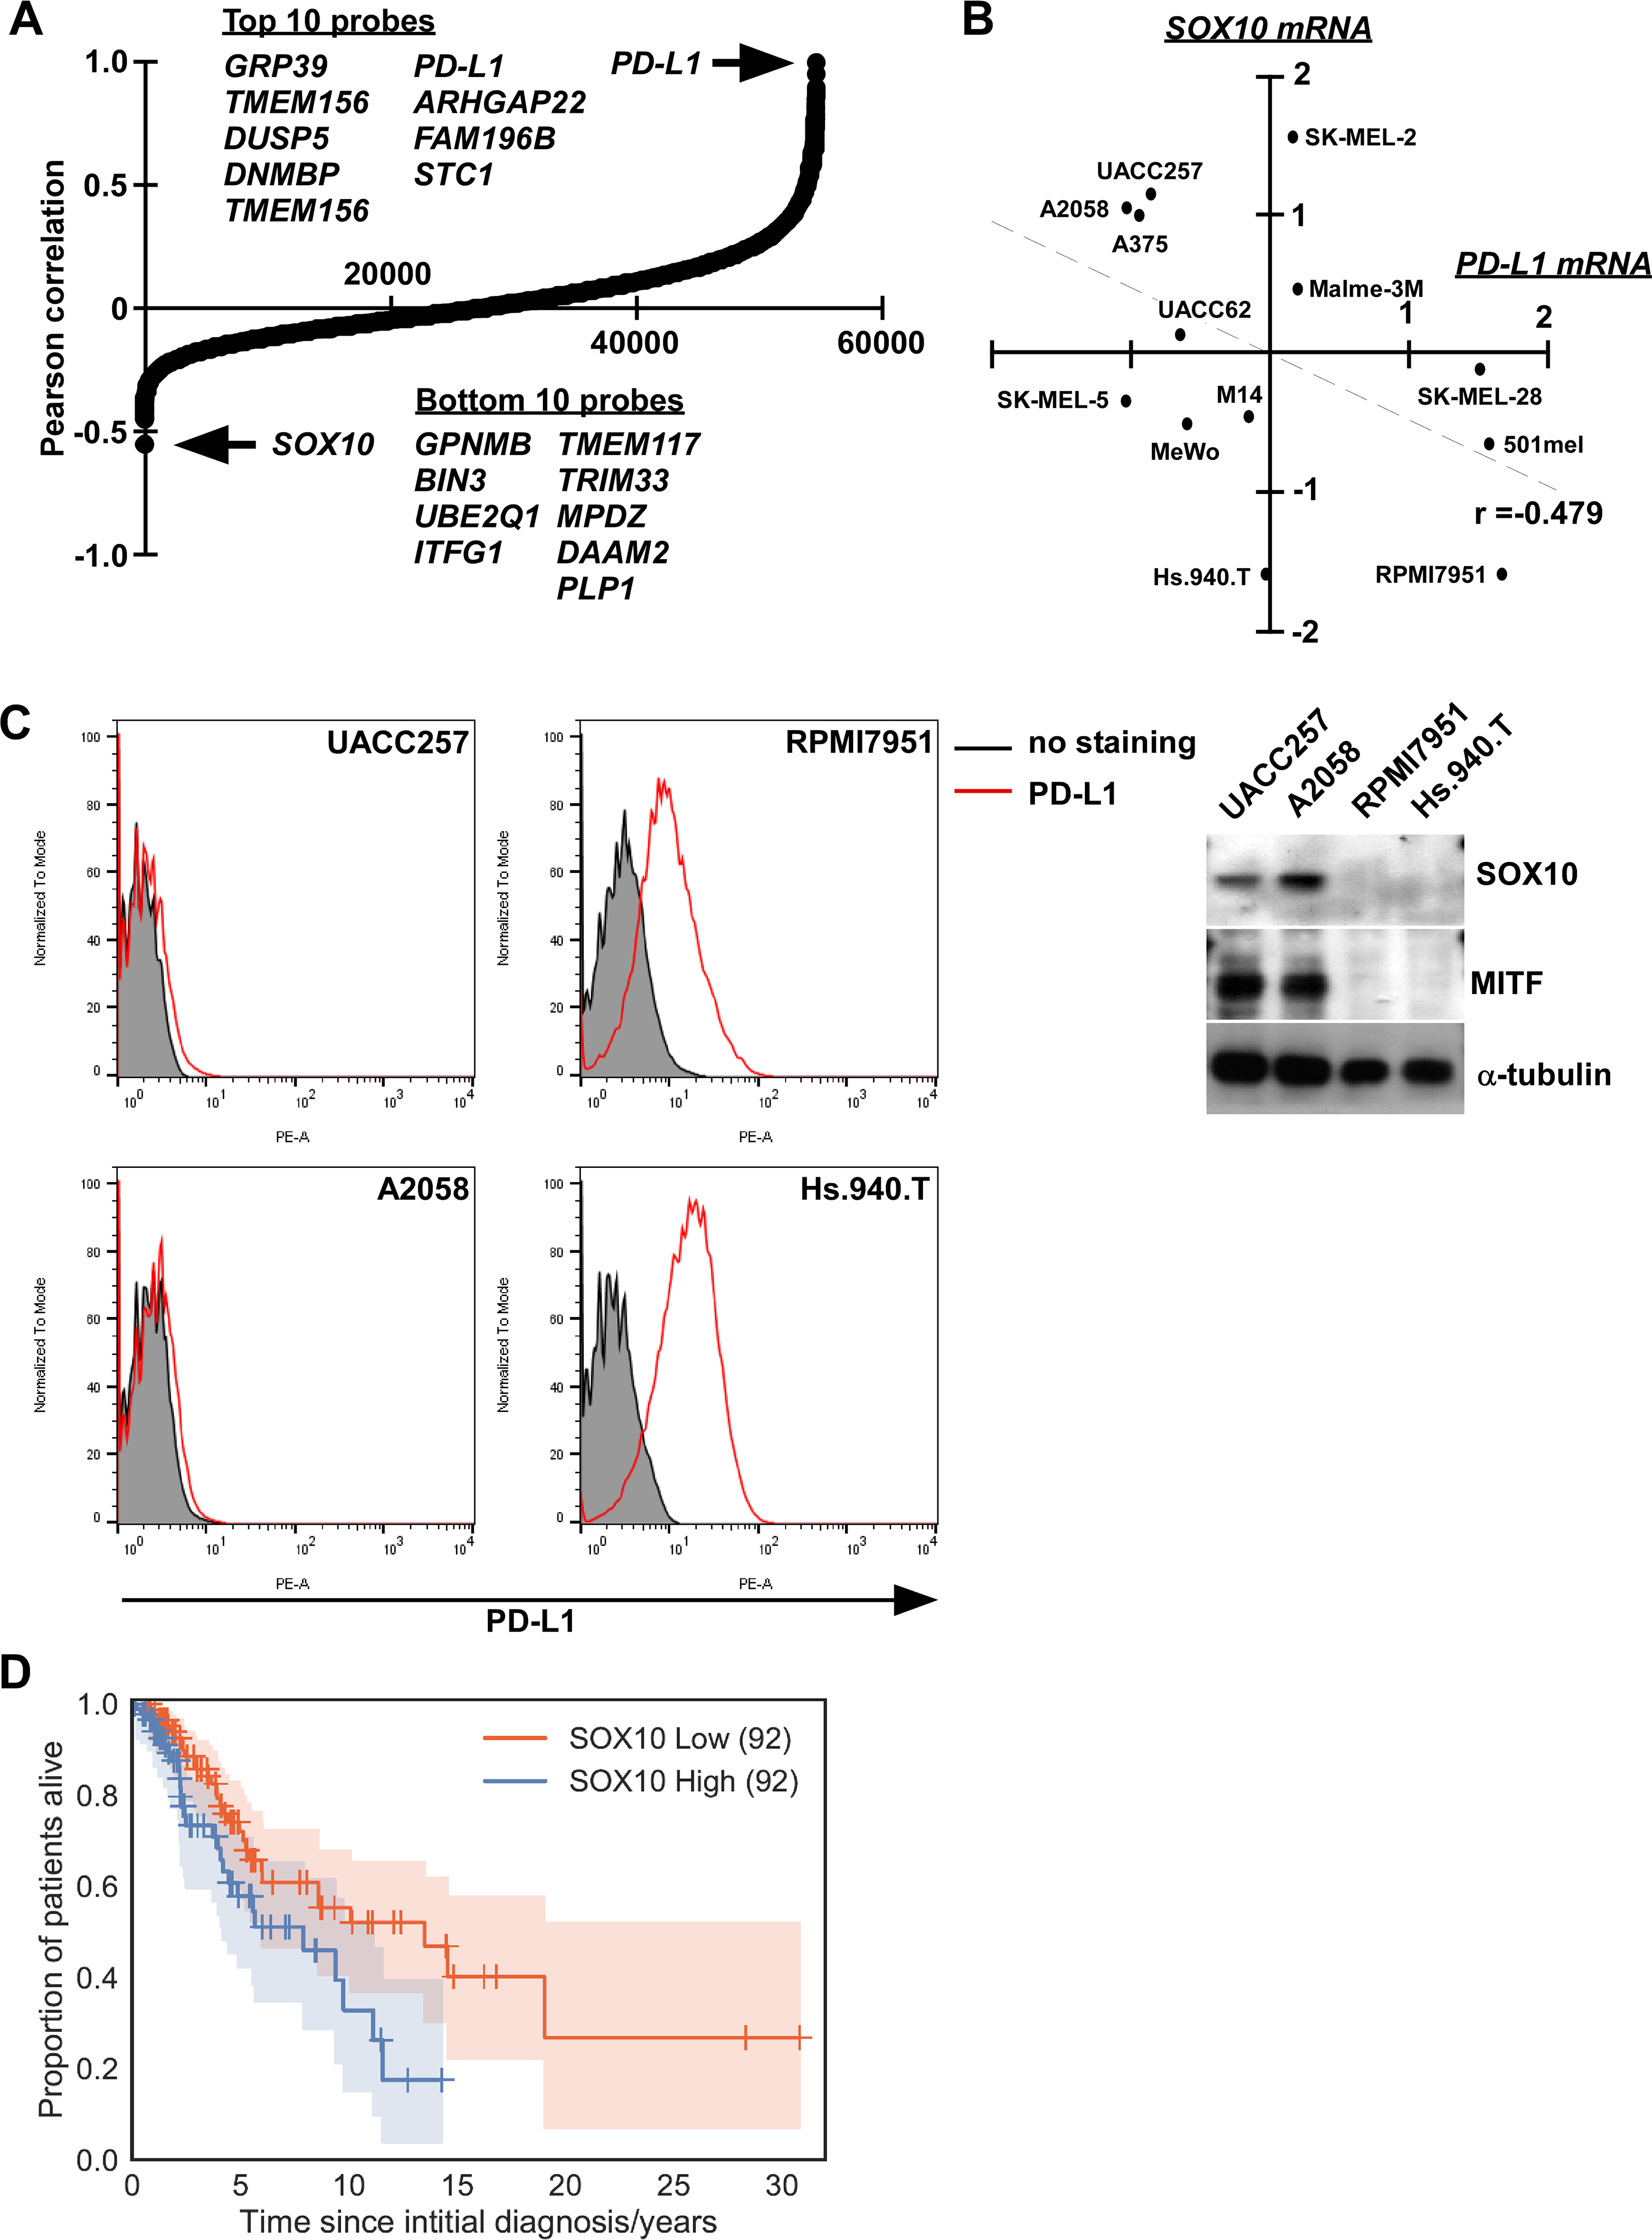
A, Expression analysis of SOX10 mRNA and all other mRNAs in melanoma cell lines shows an inverse Pearson correlation relative to PD-L1 mRNA (GSE7127). B, SOX10 mRNA shows a negative correlation with PD-L1 mRNA by real-time RT-PCR. Pearson correlation value (r) were shown. C, The expressions of SOX10 and MITF were determined in melanoma cells with high SOX10 levels (UACC257 and A2058) or with low SOX10 levels (RPMI7951 and Hs.940.T). PD-L1 expressions on the cell surface were also determined by flow cytometry. D, Kaplan-Meier curves for SOX10low (red) and SOX10high (blue) groups of TCGA melanoma patients. Log-rank p-value = 2.3×10⁻², age-adjusted Cox-model p-value = 4.1×10⁻². The number of patients in each group is indicated in parentheses.
SOX10 negatively regulates PD-L1 expression in melanoma
Next, to understand the functional involvement of SOX10 in regulating PD-L1 expression in melanoma, we knocked down SOX10 in several human melanoma cell lines with high SOX10 expression (UACC257, A2058, and A375) or medium SOX10 expression (MeWo, SK-MEL-28, and Malme-3M). SOX10 knockdown using SOX10 siRNA in UACC257, A2058, MeWo, and A375 cells resulted in up-regulation of cell surface expression of PD-L1 (Fig. 2A and Supplementary Fig. 2A). Although SOX10 knockdown in SK-MEL-28 and Malme-3M cells did not solely affect their PD-L1 expression (Fig. 2A and Supplementary Fig. 2A), IFN-γ-induced PD-L1 expression in both cell lines was increased by SOX10 knockdown (Fig. 2B). These results suggest that SOX10 also regulates PD-L1 expression in SK-MEL-28 and Malme-3M cells in response to IFN-γ. Conversely, SOX10 overexpression inhibited IFN-γ-induced PD-L1 expression in A2058 cells (Fig. 2C). Importantly, the JAK-dependent IFN-γ-signaling pathway was not involved in the SOX10-dependent control of PD-L1 expression, considering that treatment with the JAK inhibitor baricitinib did not affect PD-L1 expression induced by siSOX10 treatment (Fig. 2D, Supplementary Fig. S2B, and S2C), although baricitinib could inhibit IFN-γ-induced PD-L1 expression. These results clearly indicate that SOX10 negatively regulates PD-L1 expression independently of the JAK-STAT IFN-γ-signaling pathway in melanoma.
Figure 2. SOX10 negatively regulates PD-L1 expression in melanoma.

A, Melanoma cells with high SOX10 expression (UACC257, A2058, and A375) or medium SOX10 expression (MeWo, SK-MEL-28, and Malme-3M) transfected with siCNTL or siSOX10 (#9 or #10) were subjected to flow cytometry. Representative flow cytometry graphs were shown. The mean fluorescent intensities are presented as the mean ± SD of at least three independent experiments. *p <0.01 vs. mean fluorescent intensity in each siCNTL-transfected cells by one-way ANOVA followed by the Bonferroni post test. B, UACC257, A2058, SK-MEL-28, and Malme-3M transfected with siCNTL or siSOX10 (#10) were treated with IFN-γ and then subjected to flow cytometry. Representative flow cytometry graphs were shown. The mean fluorescent intensities are presented as the mean ± SD of at least three independent experiments. *p <0.01 vs. mean fluorescent intensity in siCNTL/IFN-γ-treated cells compared with siSOX10/IFN-g -treated cells by one-way ANOVA followed by the Bonferroni post test. Other conditions were similar to those in Fig. 2A. C, A2058 (–) and A2058/SOX10 cells were treated with IFN-γ and then subjected to flow cytometry. Right panels shows the overexpression of SOX10 determined by Western blotting. Representative flow cytometry graphs were shown. The mean fluorescent intensities are presented as the mean ± SD of at least three independent experiments. *p <0.01 vs. mean fluorescent intensity in IFN-γ-treated A2058 cells compared with IFN-g-treated A2058/SOX10 cells by two-way ANOVA followed by the Bonferroni post test. Other conditions were similar to those in Fig. 2A. D, UACC257 cells were transfected with siCNTL and siSOX10 #10, and treated with 0.5 μM Baricitinib. After 72-hour transfection, the culture medium was refreshed with 0.5 μM Baricitinib. The cells were subjected to flow cytometry. Representative flow cytometry graphs were shown. The mean fluorescent intensities are presented as the mean ± SD of at least three independent experiments. Other conditions were similar to those in Fig. 2A.
SOX10 regulates PD-L1 expression by repressing IRF1
As mRNA expression of PD-L1 was inversely correlated with that of SOX10 (Fig. 1A), we subsequently examined the role of SOX10 in transcriptional control of PD-L1 gene expression by the chromatin immunoprecipitation assay using antibody against polymerase II with Ser2 phosphorylation (Pol-II S2). As shown in Figure 3a, increased Pol-II S2 occupancy was seen in intron 3 and exon 7 of the PD-L1 gene by SOX10 knockdown in UACC257 cells. In addition, we also observed increased Pol-II S2 occupancy in intron 1 of the IRF1 gene, which is known as a key regulator of PD-L1 expression(8) (Fig. 3A). Consistently, mRNA expression of PD-L1 and IRF1 was increased by SOX10 knockdown in UACC257 cells (Fig. 3B), suggesting the function of SOX10 to control IRF1 transcription machinery. To determine the role of SOX10 as a negative regulator of IRF1, we analyzed the protein expression of IRF1 in different melanoma cell lines by knocking down SOX10. As shown in Figure 3C, SOX10 knockdown significantly upregulated IRF1 expression in A2058, UACC257, SK-MEL-28, and Malme-3M cells, suggesting the function of SOX10 as a repressor of IRF1. We also observed that such IRF1 induction after SOX10 knockdown was independent on JAK activity (Supplementary Fig. S2B). In addition to PD-L1, both PD-L2 and HLA-A/B/C are known as IRF1-target genes (7,8), were up-regulated by SOX10 knockdown in UACC257 cells (Fig. 3D). Conversely, IRF1 knockdown significantly impaired the PD-L1 up-regulation by SOX10 knockdown in UACC257 cells (Fig. 3E). Collectively, these results indicate that SOX10 regulates PD-L1 expression in melanoma cells through the repression of IRF1.
Figure 3. SOX10 regulates PD-L1 expression by repressing IRF1.

A, UACC257 cells were transfected with the indicated siRNAs for 96 hours. The chromatin immunoprecipitation assay was performed using antibody against the polymerase II phosphorylated serine 2 site (α-pol II S2). Immunoprecipitated DNA was quantified by real-time PCR using primers specific to the gene region of PD-L1 or IRF1. Results are normalized to the Pol-II S2 occupancy in siCNTL-transfected cells. Data are presented as the mean ± SD of three independent experiments. *p <0.01 vs. α-pol II S2-precipitated DNA in siCNTL-transfected cells by two-way ANOVA followed by the Bonferroni post test. B, UACC257 cells transfected with siCNTL or siSOX10 (#9 or #10) were subjected to qRT-PCR. Data are presented as the mean ± SD of three independent experiments.*p <0.01 vs. mRNA in siCNTL-transfected cells by two-way ANOVA followed by the Bonferroni post test. C, Melanoma cells transfected with the indicated siRNAs were subjected to Western blotting. The band intensities were measured by ImageJ, normalized to that of each Histone H3. The relative expression values were normalized to that of siCNTL-transfected cells, and shown below each panel. D, UACC257 cells transfected with siCNTL or siSOX10 (#9 or #10) were subjected to flow cytometry after staining PD-L2 or HLA-A/B/C. Representative flow cytometry graphs were shown. The mean fluorescent intensities are presented as the mean ± SD of at least three independent experiments. *p <0.01 vs. mean fluorescent intensity in each siCNTL-transfected cells by one-way ANOVA followed by the Bonferroni post test. E, UACC257 cells transfected with siCNTL, siSOX10 #10, or siIRF1 #3 were subjected to flow cytometry and Western blotting. Representative flow cytometry graphs were shown. The mean fluorescent intensities are presented as the mean ± SD of at least three independent experiments. *p <0.01 vs. mean fluorescent intensity in siSOX10-transfected UACC257 cells compared with siSOX10/siIRF1-transfected UACC257 cells by two-way ANOVA followed by the Bonferroni post test. Other conditions were similar to those in Fig. 3D.
SOX10 represses IRF1 through direct binding to the IRF4 enhancer region
Considering that IRF4 is a major pigmentation-associated gene (25) and known to repress IRF1 (26), we subsequently investigated the role of IRF4 in the SOX10-dependent regulation of PD-L1 expression in melanoma cells. Similar to MITF, which is a direct target of SOX10, the expression of IRF4 in four different melanoma cell lines was significantly decreased by knocking down SOX10 (Fig. 4A). Such IRF4 down-regulation by SOX10 knockdown was likely due to the reduction of IRF4 transcription, as seen in the decrease of pol-II occupancy in the PD-L1 gene (Fig. 4B). To further determine whether SOX10 directly regulates IRF4 expression, binding of SOX10 to intron 4 of the IRF4 gene, which contains a pigmentation-associated enhancer region (25), was tested using chromatin immunoprecipitation. As shown in Figure 4C, the IRF4 region was immunoprecipitated using anti-SOX10 antibody similar to the MIA region, which is a direct SOX10 target gene (27), suggesting the direct binding of SOX10 to the IRF4 enhancer region. Consistently, IRF4 knockdown significantly enhanced IFN-γ-induced PD-L1 expression, whereas either IRF1 knockdown or IRF1/IRF4 double knockdown reduced such an effect of IFN-γ (Fig. 4D). Collectively, these results suggest that SOX10 negatively regulates PD-L1 expression by directly binding to the IRF4 enhancer region to repress IRF1.
Figure 4. SOX10 represses IRF1 through direct binding to the IRF4 enhancer region.

A, Melanoma cells transfected with indicated siRNAs were subjected to Western blotting. The same image of Histone H3 was used as in Fig. 3C. The band intensities were measured by ImageJ, normalized to that of each Histone H3. The relative expression values were normalized to that of siCNTL-transfected cells, and shown below each panel. B, The chromatin immunoprecipitation assay was performed using antibody against Pol-II S2. Immunoprecipitated DNA was quantified using the specific primers for IRF4 gene region. Results are normalized to the input DNA in each siRNA-transfected cells. Relative pol-II occupancies are presented as the mean ± SD of three independent experiments. *p <0.01 vs. pol-II occupancy in siCNTL-transfected cells by one-way ANOVA followed by the Bonferroni post test. Other conditions were similar to those in Fig. 2A. C, The chromatin immunoprecipitation assay was performed using antibody against SOX10 (α-SOX10). Immunoprecipitated DNA was quantified by real-time PCR using primers specific to the enhancer region of IRF1 and MIA, known as a SOX10 binding site. Results are normalized to the input DNA in each region. Data are presented as the mean ± SD of three independent experiments. *p <0.01 vs. α-SOX10-precipitated DNA in the ACTB region by two-way ANOVA followed by the Bonferroni post test. D, UACC257 cells transfected with the indicated siRNAs were treated with IFN-γ for 24 hours. Total RNA was subjected to qRT-PCR. Results are normalized to PD-L1 expression in siCNTL-transfected cells without IFN-γ. Data are presented as the mean ± SD of three independent experiments. *p <0.01 vs. siCNTL-transfected cells with IFN-γ by two-way ANOVA followed by the Bonferroni post test.
Involvement of HDAC1/3 in controlling PD-L1 expression through SOX10
Because SOX10 expression is reportedly suppressed by histone deacetylase inhibitors (HDACi) (14,28), we examined the effects of a clinically available pan-HDACi vorinostat (suberoylanilide hydroxamic acid) on the expression of PD-L1 in melanoma. As shown in Figure 5A, cell-surface PD-L1 expression was induced by vorinostat treatment in all four human melanoma cell lines tested. Importantly, the vorinostat treatment reduced IRF4 expression and thereby induced IRF1 expression along with suppressing SOX10 expression in those melanoma cell lines. Similar with that after SOX10 knockdown, PD-L1 induction after vorinostat treatment could not be impaired by JAK inhibitor (Supplementary Fig. S3A). Furthermore, the overexpression of SOX10 in A375 cells significantly impaired the effect of HDACi to induce PD-L1 expression (Fig. 5B), suggesting that SOX10 can be a major target of HDACi to induce PD-L1 expression through the IRF4-IRF1 axis in melanoma.
Figure 5. Involvement of HDAC1/3 in controlling PD-L1 expression through SOX10.

A, Melanoma cells were treated with 2 μM vorinostat for 24 hours, and then subjected to flow cytometry or Western blotting. Representative flow cytometry graphs were shown. The mean fluorescent intensities are presented as the mean ± SD of at least three independent experiments. *p <0.01 vs. mean fluorescent intensity in DMSO-treated cells by student t-test. The band intensities were measured by ImageJ, normalized to that of each Histone H3. The relative expression values were normalized to that of DMSO-treated cells, and shown below each panel. B, A375 and A375/SOX10 cells were treated with 2 μM vorinostat for 24 hours, and then subjected to flow cytometry. Results are normalized to PD-L1 expression in non-treated A375 (–) cells. Representative flow cytometry graphs were shown. The mean fluorescent intensities are presented as the mean ± SD of at least three independent experiments. *p <0.01 vs. mean fluorescent intensity in DMSO-treated cells by two-way ANOVA followed by the Bonferroni post test. Right panels shows the overexpression of SOX10 determined by Western blotting.
To determine the specific subtype of HDACs involved in SOX10 suppression, we tested the effect of HDACi with different specificities on SOX10 expression. ACY-1215 (inhibiting HDAC1, 2, 3, 6, and 8) and RGFP109 (inhibiting HDAC1 and 2) significantly suppressed SOX10 expression in UACC257 cells, whereas TMP269 (inhibiting HDAC4, 5, 7, and 9), CAY10683 (inhibiting HDAC2), and BRD73954 (inhibiting HDAC6 and 9) did not show any effects on SOX10 expression (Supplementary Fig. S3B); therefore, HDAC1/3 can be potential subtypes of HDAC involved in SOX10 suppression. Importantly, treatment with ACY-1215 or RGFP109 significantly up-regulated PD-L1 expression of UACC257 cells (Supplementary Fig. S3C), supporting the involvement of HDAC1/3 in controlling PD-L1 expression through SOX10.
SOX10 suppression underlies the synergistic effect of HDAC inhibitor and PD-1 blockade
Both tumor immunogenicity and the presence of effector T cells are key for successful immunotherapy against cancer. In this regard, it has been reported that HDAC inhibition potentiates the efficacy of immune checkpoint blockade to enhance T-cell infiltration into the tumor site by upregulating chemokines (29), although HDACi showed limited clinical efficacy as a single agent in a phase I trial involving melanoma patients (30). To test the involvement of SOX10 suppression in the efficacy of such combination therapy with HDACi and immune checkpoint blockade, we used the D4M melanoma model. D4M is a mouse melanoma cell line derived from BRAFV600E/Pten−/− mice (15) with a low mutation burden (16); therefore, it is known to show the lower-level responsiveness to PD-1 blockade (16). As seen in human melanoma cell lines (Fig. 5), the expression of PD-L1 in D4M cells was increased on vorinostat treatment in vitro (Fig. 6A). In order to test the effect of combination therapy with HDACi and PD-1 blockade in vivo, we used the subcutaneous implantation model of D4M melanoma cells. Although neither HDACi (vorinostat) nor anti-PD-1 antibody treatment was solely effective, their combination significantly suppressed D4M melanoma growth (Fig. 6B) and showed a beneficial effect on the survival of tumor-bearing mice (Fig. 6C). Consistent with a previous report (30), vorinostat treatment increased the frequency of tumor-infiltrating CD3+ T cells compared with control mice (Fig. 6D); however, it was not effective on its own to control D4M tumor growth (Fig. 6B). The reduction of SOX10 mRNA (Fig. 6E) and, conversely, the upregulation of PD-L1 (Fig. 6F) were observed in D4M tumors treated with HDACi in vivo. Importantly, combination therapy with HDACi and anti-PD-1 antibody induced the activation of tumor-infiltrating CD8+ T cells, as seen in the expression of 4–1BB (Fig. 6G). Finally, to determine the involvement of SOX10 in the efficacy of combination therapy with HDACi and anti-PD-1 antibody, we used D4M cells overexpressing SOX10 (D4M/SOX10). As shown in Figure 6H, the effects of combination therapy with HDACi and anti-PD-1 antibody to control D4M/SOX10 tumor growth were completely blocked, suggesting that SOX10 suppression is an underlying mechanism explaining the efficacy of the combination of HDAC inhibitor with PD-1 blockade therapy.
Figure 6. SOX10 suppression underlies the synergistic effect of HDAC inhibitor and PD-1 blockade.

A, D4M melanoma cells were treated with 2 μM vorinostat for 24 hours, and then subjected to flow cytometry. Representative flow cytometry graphs were shown. The mean fluorescent intensities are presented as the mean ± SD of three independent experiments. Other conditions were similar to those in Fig. 5A. B, D4M melanoma cells were engrafted subcutaneously in C57BL/6J mice. Mice were randomly divided into 4 groups (n=6 mice/group), and treated with vehicle (–) as a control, vorinostat, anti-PD-1 antibody (αPD-1), or a combination of vorinostat and αPD-1 (vorinostat +αPD-1). Tumor volumes were measured three times per week by Vernier calipers and the values were plotted as means ± SEM. Mice were sacrificed if the tumor was > 1,000 mm3. *P <0.01 by two-way ANOVA with Bonferroni correction compared with the vehicle-treated group. C, Kaplan-Meier survival curve displaying percent survival among treatment groups after treatment (n = 6 mice/group). Significance was determined by the Log-rank (Mantel-Cox) test. D, Percent of CD3+ T cells infiltrating melanoma tissues was measured on Day 7. E, SOX10 mRNA expression on tumors at an endopoint was determined by qRT-PCR. F, PD-L1 expression on tumor cells on Day 7 are shown. Results are normalized to the average of PD-L1 expression in tumor cells prepared from melanoma tissues with non-treated mice on Day 7. Data are presented as the mean ± SEM of 8 mice. G, Median fluorescent intensity of 4–1BB on CD8+ T cells is shown on Day 11. H, D4M cells overexpressing SOX10 (D4M/SOX10) were engrafted subcutaneously in C57BL/6J mice. Mice were randomly divided into 2 groups (n=6 mice/group), and treated with vehicle (–) as a control or a combination of vorinostat and αPD-1 (vorinostat +αPD-1). Other conditions are similar to those in Fig. 5B. Right panels shows the overexpression of SOX10 determined by Western blotting.
Discussion
In the present study, we identified the regulatory role of the SOX10-IRF4-IRF1 axis in melanoma immunogenicity independent of JAK-dependent IFN signaling. Regarding the clinical relevance of our findings, we demonstrated that HDACi can improve the efficacy of anti-PD-1 therapy through a SOX10-dependent mechanism, possibly by enhancing the immunogenicity of melanoma cells.
SOX10 is known to be an indispensable gene for development of melanocytes and peripheral glial cells, derived from neural crest lineages; therefore, loss of function via SOX10 mutation causes Waardenburg Syndrome type 4 in humans, which is an auditory-pigmentary syndrome associated with a megacolon (31). MITF is a direct SOX10 target molecule (21–24) and master regulator of melanocyte development, function, and survival, and is a genomically amplified melanoma-specific oncogene in some cases (32–34). In addition, some direct target proteins of SOX10 have been reported, such as myelin protein zero (35), myelin basic protein (36), connexin 32 (36), involved in the differentiation of peripheral glial cells. Contrary to its important role in developmental processes, the biological role of SOX10 in melanoma cells is less understood. In this regard, we showed that SOX10 regulates PD-L1 expression in melanoma through the IRF4-IRF1 axis along with other IRF1-target genes, such as PD-L2 and HLA-A/B/C independently of the JAK-STAT IFN signaling pathway (Fig. 3D). These results strongly support the suggestion that SOX10 functions as a cell-intrinsic regulator of immunogenicity through IRF1 regulation in melanoma cells.
Such SOX10-dependent suppression of melanoma immunogenicity is supported by the negative correlation between SOX10 mRNA and PD-L1 mRNA in mRNA expression data from melanoma cell lines (Fig. 1A) and also CCLE from melanoma patients (Supplementary Fig. S1). In addition, the correlation values of IRF4 (−0.239 vs. PD-L1) and IRF1 (0.547 vs. PD-L1) in the GSE7127 melanoma dataset also support the importance of the IRF4-IRF1 axis. Contrary to melanoma, there was no significant correlation between SOX10 and PD-L1 expression in breast cancer, which expresses SOX10 (37) (Pearson correlation value of −0.042, 9996 of 18988 genes in CCLE). Although there is a report that IRF1 inhibits anti-tumor immune responses through the up-regulation of PD-L1 in several different types of mouse tumor models (38), no relevance of SOX10 and IRF4 to control IRF1 expression is known elsewhere. Considering that SOX10 directly regulates IRF4 through binding of a pigmentation-associated enhancer region (Fig. 4C), SOX10 regulates IRF1 expression specifically in melanoma cells.
Regarding the clinical relevance of our findings, it is known that a tumor in an immunologically “cold” state corresponds to low PD-L1 expression and is correlated with a poor prognosis of cancer patients including melanoma patients receiving PD-1/PD-L1 blockade therapy. Considering the present results (Fig. 6), SOX10 suppression by HDACi treatment may change such an immunologically “cold” tumor state into a “hot” state by activating IRF1 as seen by increasing CD8+ T-cell infiltration. However, those tumor-infiltrating CD8+ T cells were not fully activated because SOX10 suppression by HDACi treatment also induced PD-L1 expression on melanoma cells through an IRF1-dependent mechanism. Such SOX10-dependent PD-L1 induction may correspond to the lack of beneficial effects in a clinical trial of HDACi in melanoma patients (30). In this context, it is clinically important to classify the SOX10high melanoma patients, because SOX10 suppression in their patients can improve or enhance the efficacy of PD-1/PD-L1 blockade therapy. Moreover, the defect of IFN-γ signaling in cancers bearing JAK1/2 mutation is also involved in primary and acquired resistance to anti-PD-1 therapy (5,6). Importantly, we found that HDACi could also induce PD-L1 independent of the JAK-STAT pathway (Supplementary Fig. S3A); therefore, HDACi may show “warm-up” effects in immunologically “cold” tumors with JAK1/2 mutation through the SOX10-IRF4-IRF1 axis.
Although we clearly demonstrated that HDACi can increase immunogenicity in melanoma cells through the SOX10-IRF4-IRF1 axis, the exact subtype of HDAC that specifically controls SOX10 expression remains unknown. The chemical inhibition of HDAC1 and HDAC3 by ACY-1215 and RGFP109 antagonized SOX10 expression in melanoma (Supplementary Fig. S3B), suggesting the involvement of those two HDACs. Using genetic inhibition by siRNA, the triple knockdown of HDAC1, 2, and 3, instead of the double knockdown of HDAC1 and 3, strongly suppressed SOX10 expression in melanoma (Supplementary Fig. S3D). Considering that HDAC1 and 2 are functionally redundant HDACs (39,40) that co-localize in super enhancer regions together with HDAC3 (40), and SOX10 expression is predominantly regulated by super enhancers in melanoma (41,42), we speculate that HDAC1, 2, and 3 predominantly control SOX10 expression among other subtypes of HDACs. Although there was a discrepancy in the response between SOX10 knockdown and HDACi treatment to induce PD-L1 expression in SK-MEL-28 and Malme-3M cells (Fig. 2A), such a discrepancy can be explained by the different efficiency of siRNA knockdown and pharmacological inhibition of SOX10. Alternatively, HDACi may also induce IRF1 expression in those melanoma cells through mechanism other than the SOX10-IRF4 axis, considering that there is a report that HDACi treatment induces PD-L1 and IRF1 expression in myeloid cells (43).
In summary, we identified SOX10 as a regulator of the immunogenicity of melanoma through an IRF4-IRF1-dependent transcriptional mechanism. Regarding the clinical relevance of our findings, treatment with HDACi, such as clinically available vorinostat, reinvigorates the immunogenicity of melanoma cells and enhances the efficacy of anti-PD-1 therapy through a SOX10-dependent mechanism. Thus, we strongly consider the SOX10-IRF4-IRF1 axis to be a promising target to immunologically warm up melanoma patients showing a “cold” state in their tumor microenvironment.
Supplementary Material
Significance.
This study identifies a novel SOX10/IRF4 pathway that regulates non-canonical induction of IRF1 independent of the JAK-STAT pathway and can be targeted to improve the efficacy of anti-PD-1 therapy in melanoma.
Acknowledgments
We thank members of the Hayakawa laboratory and Sakurai laboratory for discussions and suggestions.
Financial support:
This study was supported in part by Grant-in-Aid for Young Scientists (B) (No.24700971) (S.Y.) from the Ministry of Education, Culture, Sports, Science, and Technology (Japan), Takeda Science Foundation (S.Y.), and by JST Moonshot R&D Grant Number JPMJMS2021 (H.S. and S.Y.). J.S.S. gratefully acknowledges grant support from NIH (R01CA163336). D.E.F. gratefully acknowledges grant support from NIH (NIH P01CA163222 and NIAMS R01AR043369) and the Dr. Miriam and Sheldon G. Adelson Medical Research Foundation.
Footnotes
Disclosure of Potential Conflicts of Interest: D.E.F. has a financial interest in Soltego, a company developing salt-inducible kinase inhibitors for topical skin-darkening treatments that might be used for a broad set of human applications. The interests of D.E.F. were reviewed and are managed by Massachusetts General Hospital and Partners HealthCare in accordance with their conflict of interest policies. Other authors declare that they have no competing financial interests.
References
- 1.Sharma P, Hu-Lieskovan S, Wargo JA, Ribas A. Primary, Adaptive, and Acquired Resistance to Cancer Immunotherapy. Cell 2017;168:707–23. [DOI] [PMC free article] [PubMed] [Google Scholar]
- 2.Teng MW, Ngiow SF, Ribas A, Smyth MJ. Classifying Cancers Based on T-cell Infiltration and PD-L1. Cancer Res 2015;75:2139–45. [DOI] [PMC free article] [PubMed] [Google Scholar]
- 3.Hellmann MD, Nathanson T, Rizvi H, Creelan BC, Sanchez-Vega F, Ahuja A, et al. Genomic Features of Response to Combination Immunotherapy in Patients with Advanced Non-Small-Cell Lung Cancer. Cancer Cell 2018;33:843–52 e4. [DOI] [PMC free article] [PubMed] [Google Scholar]
- 4.Gao J, Shi LZ, Zhao H, Chen J, Xiong L, He Q, et al. Loss of IFN-gamma Pathway Genes in Tumor Cells as a Mechanism of Resistance to Anti-CTLA-4 Therapy. Cell 2016;167:397–404 e9. [DOI] [PMC free article] [PubMed] [Google Scholar]
- 5.Zaretsky JM, Garcia-Diaz A, Shin DS, Escuin-Ordinas H, Hugo W, Hu-Lieskovan S, et al. Mutations Associated with Acquired Resistance to PD-1 Blockade in Melanoma. N Engl J Med 2016;375:819–29. [DOI] [PMC free article] [PubMed] [Google Scholar]
- 6.Shin DS, Zaretsky JM, Escuin-Ordinas H, Garcia-Diaz A, Hu-Lieskovan S, Kalbasi A, et al. Primary Resistance to PD-1 Blockade Mediated by JAK1/2 Mutations. Cancer Discov 2017;7:188–201. [DOI] [PMC free article] [PubMed] [Google Scholar]
- 7.Girdlestone J, Isamat M, Gewert D, Milstein C. Transcriptional regulation of HLA-A and -B: differential binding of members of the Rel and IRF families of transcription factors. Proc Natl Acad Sci U S A 1993;90:11568–72. [DOI] [PMC free article] [PubMed] [Google Scholar]
- 8.Garcia-Diaz A, Shin DS, Moreno BH, Saco J, Escuin-Ordinas H, Rodriguez GA, et al. Interferon Receptor Signaling Pathways Regulating PD-L1 and PD-L2 Expression. Cell Rep 2017;19:1189–201. [DOI] [PMC free article] [PubMed] [Google Scholar]
- 9.Ohigashi Y, Sho M, Yamada Y, Tsurui Y, Hamada K, Ikeda N, et al. Clinical significance of programmed death-1 ligand-1 and programmed death-1 ligand-2 expression in human esophageal cancer. Clin Cancer Res 2005;11:2947–53. [DOI] [PubMed] [Google Scholar]
- 10.Thompson RH, Kuntz SM, Leibovich BC, Dong H, Lohse CM, Webster WS, et al. Tumor B7-H1 is associated with poor prognosis in renal cell carcinoma patients with long-term follow-up. Cancer Res 2006;66:3381–5. [DOI] [PubMed] [Google Scholar]
- 11.Topalian SL, Hodi FS, Brahmer JR, Gettinger SN, Smith DC, McDermott DF, et al. Safety, activity, and immune correlates of anti-PD-1 antibody in cancer. N Engl J Med 2012;366:2443–54. [DOI] [PMC free article] [PubMed] [Google Scholar]
- 12.Taube JM, Klein A, Brahmer JR, Xu H, Pan X, Kim JH, et al. Association of PD-1, PD-1 ligands, and other features of the tumor immune microenvironment with response to anti-PD-1 therapy. Clin Cancer Res 2014;20:5064–74. [DOI] [PMC free article] [PubMed] [Google Scholar]
- 13.Campeau E, Ruhl VE, Rodier F, Smith CL, Rahmberg BL, Fuss JO, et al. A versatile viral system for expression and depletion of proteins in mammalian cells. PLoS One 2009;4:e6529. [DOI] [PMC free article] [PubMed] [Google Scholar]
- 14.Yokoyama S, Feige E, Poling LL, Levy C, Widlund HR, Khaled M, et al. Pharmacologic suppression of MITF expression via HDAC inhibitors in the melanocyte lineage. Pigment Cell Melanoma Res 2008;21:457–63. [DOI] [PMC free article] [PubMed] [Google Scholar]
- 15.Jenkins MH, Steinberg SM, Alexander MP, Fisher JL, Ernstoff MS, Turk MJ, et al. Multiple murine BRaf(V600E) melanoma cell lines with sensitivity to PLX4032. Pigment Cell Melanoma Res 2014;27:495–501. [DOI] [PMC free article] [PubMed] [Google Scholar]
- 16.Lo JA, Kawakubo M, Juneja VR, Su MY, Erlich TH, LaFleur MW, et al. Epitope spreading toward wild-type melanocyte-lineage antigens rescues suboptimal immune checkpoint blockade responses. Sci Transl Med 2021;13: eabd8636. [DOI] [PMC free article] [PubMed] [Google Scholar]
- 17.Johansson P, Pavey S, Hayward N. Confirmation of a BRAF mutation-associated gene expression signature in melanoma. Pigment Cell Res 2007;20:216–21. [DOI] [PubMed] [Google Scholar]
- 18.Barretina J, Caponigro G, Stransky N, Venkatesan K, Margolin AA, Kim S, et al. The Cancer Cell Line Encyclopedia enables predictive modelling of anticancer drug sensitivity. Nature 2012;483:603–7. [DOI] [PMC free article] [PubMed] [Google Scholar]
- 19.Schreiber E, Matthias P, Muller MM, Schaffner W. Rapid detection of octamer binding proteins with ‘mini-extracts’, prepared from a small number of cells. Nucleic Acids Res 1989;17:6419. [DOI] [PMC free article] [PubMed] [Google Scholar]
- 20.Haq R, Yokoyama S, Hawryluk EB, Jonsson GB, Frederick DT, McHenry K, et al. BCL2A1 is a lineage-specific antiapoptotic melanoma oncogene that confers resistance to BRAF inhibition. Proc Natl Acad Sci U S A 2013;110:4321–6. [DOI] [PMC free article] [PubMed] [Google Scholar]
- 21.Potterf SB, Furumura M, Dunn KJ, Arnheiter H, Pavan WJ. Transcription factor hierarchy in Waardenburg syndrome: regulation of MITF expression by SOX10 and PAX3. Hum Genet 2000;107:1–6. [DOI] [PubMed] [Google Scholar]
- 22.Bondurand N, Pingault V, Goerich DE, Lemort N, Sock E, Le Caignec C, et al. Interaction among SOX10, PAX3 and MITF, three genes altered in Waardenburg syndrome. Hum Mol Genet 2000;9:1907–17. [DOI] [PubMed] [Google Scholar]
- 23.Lee M, Goodall J, Verastegui C, Ballotti R, Goding CR. Direct regulation of the Microphthalmia promoter by Sox10 links Waardenburg-Shah syndrome (WS4)-associated hypopigmentation and deafness to WS2. J Biol Chem 2000;275:37978–83. [DOI] [PubMed] [Google Scholar]
- 24.Watanabe K, Takeda K, Yasumoto K, Udono T, Saito H, Ikeda K, et al. Identification of a distal enhancer for the melanocyte-specific promoter of the MITF gene. Pigment Cell Res 2002;15:201–11. [DOI] [PubMed] [Google Scholar]
- 25.Praetorius C, Grill C, Stacey SN, Metcalf AM, Gorkin DU, Robinson KC, et al. A polymorphism in IRF4 affects human pigmentation through a tyrosinase-dependent MITF/TFAP2A pathway. Cell 2013;155:1022–33. [DOI] [PMC free article] [PubMed] [Google Scholar]
- 26.Yoshida K, Yamamoto K, Kohno T, Hironaka N, Yasui K, Kojima C, et al. Active repression of IFN regulatory factor-1-mediated transactivation by IFN regulatory factor-4. Int Immunol 2005;17:1463–71. [DOI] [PubMed] [Google Scholar]
- 27.Graf SA, Busch C, Bosserhoff AK, Besch R, Berking C. SOX10 promotes melanoma cell invasion by regulating melanoma inhibitory activity. J Invest Dermatol 2014;134:2212–20. [DOI] [PubMed] [Google Scholar]
- 28.Johannessen CM, Johnson LA, Piccioni F, Townes A, Frederick DT, Donahue MK, et al. A melanocyte lineage program confers resistance to MAP kinase pathway inhibition. Nature 2013;504:138–42. [DOI] [PMC free article] [PubMed] [Google Scholar]
- 29.Zheng H, Zhao W, Yan C, Watson CC, Massengill M, Xie M, et al. HDAC Inhibitors Enhance T-Cell Chemokine Expression and Augment Response to PD-1 Immunotherapy in Lung Adenocarcinoma. Clin Cancer Res 2016;22:4119–32. [DOI] [PMC free article] [PubMed] [Google Scholar]
- 30.Ibrahim N, Buchbinder EI, Granter SR, Rodig SJ, Giobbie-Hurder A, Becerra C, et al. A phase I trial of panobinostat (LBH589) in patients with metastatic melanoma. Cancer Med 2016;5:3041–50. [DOI] [PMC free article] [PubMed] [Google Scholar]
- 31.Pingault V, Bondurand N, Kuhlbrodt K, Goerich DE, Prehu MO, Puliti A, et al. SOX10 mutations in patients with Waardenburg-Hirschsprung disease. Nat Genet 1998;18:171–3. [DOI] [PubMed] [Google Scholar]
- 32.Bertolotto C, Lesueur F, Giuliano S, Strub T, de Lichy M, Bille K, et al. A SUMOylation-defective MITF germline mutation predisposes to melanoma and renal carcinoma. Nature 2011;480:94–8. [DOI] [PubMed] [Google Scholar]
- 33.Garraway LA, Widlund HR, Rubin MA, Getz G, Berger AJ, Ramaswamy S, et al. Integrative genomic analyses identify MITF as a lineage survival oncogene amplified in malignant melanoma. Nature 2005;436:117–22. [DOI] [PubMed] [Google Scholar]
- 34.Yokoyama S, Woods SL, Boyle GM, Aoude LG, MacGregor S, Zismann V, et al. A novel recurrent mutation in MITF predisposes to familial and sporadic melanoma. Nature 2011;480:99–103. [DOI] [PMC free article] [PubMed] [Google Scholar]
- 35.Peirano RI, Goerich DE, Riethmacher D, Wegner M. Protein zero gene expression is regulated by the glial transcription factor Sox10. Mol Cell Biol 2000;20:3198–209. [DOI] [PMC free article] [PubMed] [Google Scholar]
- 36.Bondurand N, Girard M, Pingault V, Lemort N, Dubourg O, Goossens M. Human Connexin 32, a gap junction protein altered in the X-linked form of Charcot-Marie-Tooth disease, is directly regulated by the transcription factor SOX10. Hum Mol Genet 2001;10:2783–95. [DOI] [PubMed] [Google Scholar]
- 37.Cimino-Mathews A, Subhawong AP, Elwood H, Warzecha HN, Sharma R, Park BH, et al. Neural crest transcription factor Sox10 is preferentially expressed in triple-negative and metaplastic breast carcinomas. Hum Pathol 2013;44:959–65. [DOI] [PMC free article] [PubMed] [Google Scholar]
- 38.Shao L, Hou W, Scharping NE, Vendetti FP, Srivastava R, Roy CN, et al. IRF1 Inhibits Antitumor Immunity through the Upregulation of PD-L1 in the Tumor Cell. Cancer Immunol Res 2019;7:1258–66. [DOI] [PMC free article] [PubMed] [Google Scholar]
- 39.Montgomery RL, Davis CA, Potthoff MJ, Haberland M, Fielitz J, Qi X, et al. Histone deacetylases 1 and 2 redundantly regulate cardiac morphogenesis, growth, and contractility. Genes Dev 2007;21:1790–802. [DOI] [PMC free article] [PubMed] [Google Scholar]
- 40.Gryder BE, Wu L, Woldemichael GM, Pomella S, Quinn TR, Park PMC, et al. Chemical genomics reveals histone deacetylases are required for core regulatory transcription. Nat Commun 2019;10:3004. [DOI] [PMC free article] [PubMed] [Google Scholar]
- 41.Eliades P, Abraham BJ, Ji Z, Miller DM, Christensen CL, Kwiatkowski N, et al. High MITF Expression Is Associated with Super-Enhancers and Suppressed by CDK7 Inhibition in Melanoma. J Invest Dermatol 2018;138:1582–90. [DOI] [PMC free article] [PubMed] [Google Scholar]
- 42.Fufa TD, Baxter LL, Wedel JC, Gildea DE, Program NCS, Loftus SK, et al. MEK inhibition remodels the active chromatin landscape and induces SOX10 genomic recruitment in BRAF(V600E) mutant melanoma cells. Epigenetics Chromatin 2019;12:50. [DOI] [PMC free article] [PubMed] [Google Scholar]
- 43.Adeshakin AO, Yan D, Zhang M, Wang L, Adeshakin FO, Liu W, et al. Blockade of myeloid-derived suppressor cell function by valproic acid enhanced anti-PD-L1 tumor immunotherapy. Biochem Biophys Res Commun 2020;522:604–11. [DOI] [PubMed] [Google Scholar]
Associated Data
This section collects any data citations, data availability statements, or supplementary materials included in this article.