Abstract
Background:
Noninfectious complications are the greatest cause of morbidity and mortality in common variable immunodeficiency (CVID), but their pathogenesis remains poorly defined.
Objective:
Using high-throughput approaches, we aimed to identify, correlate, and determine the significance of immunologic features of CVID with noninfectious complications (CVIDc).
Methods:
We simultaneously applied proteomics, RNA sequencing, and mass cytometry to a large cohort with primary antibody deficiency.
Results:
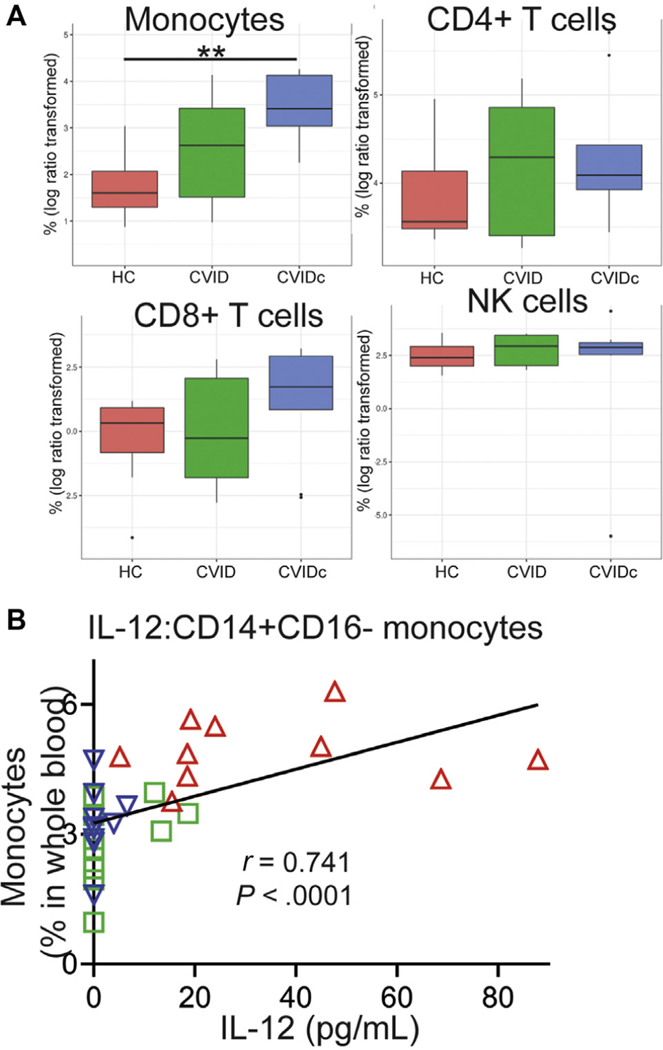
CVIDc is differentiated from uncomplicated CVID, other forms of primary antibody deficiency, and healthy controls by a distinct plasma proteomic profile. In addition to confirming previously reported elevations of 4–1BB, IL-6, IL-18, and IFN-γ, we found elevations of colony-stimulating factor 1, IL-12p40, IL-18R, oncostatin M, TNF, and vascular endothelial growth factor A to differentiate CVIDc. This cytokine dysregulation correlated with deficiency of LPS-specific antibodies and increased soluble CD14, suggesting microbial translocation. Indicating potential significance of reduced LPS-specific antibodies and resultant microbial-induced inflammation, CVIDc had altered LPS-induced gene expression matching plasma proteomics and corresponding with increased CD14+CD16− monocytes, memory T cells, and tissue inflammation ameliorated by T-cell–targeted therapy. Unsupervised machine learning accurately differentiated subjects with CVIDc and supported cytokine dysregulation, antibody deficit, and T-cell activation as defining and convergent features.
Conclusions:
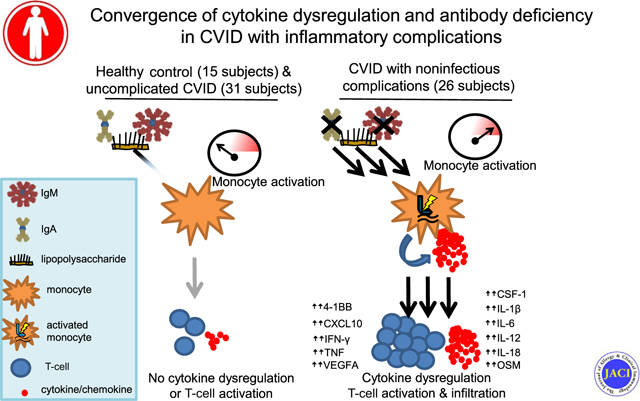
Our data expand understanding of CVIDc proteomics, establish its link with deficiency of IgA and LPS-specific antibodies, and implicate altered LPS-induced gene expression and elevated monocytes and T cells in this cytokine dysregulation. This work indicates that CVIDc results when insufficient antibody neutralization of pathogen-associated molecular patterns, like LPS, occurs in those with a heightened response to these inflammatory mediators, suggesting a 2-hit model of pathogenesis requiring further exploration.
Keywords: Common variable immunodeficiency, CVID, lipopolysaccharide, LPS, noninfectious complications, IL-12, IFN-γ, TNF, monocytes, T cells
Graphical abstract
Common variable immunodeficiency (CVID) is the most prevalent symptomatic primary immunodeficiency and defined by profoundly impaired antibody production.1,2 About half of those with CVID develop chronic complications such as autoimmunity and inflammation of the gastrointestinal tract, lungs, or other tissues.3 Genetic etiologies have been identified in about 25% cases of CVID, but the mechanisms underlying the inflammatory disease manifestations remain unclear.4,5 Because they are the major source of morbidity and mortality in CVID, understanding the pathogenic basis of noninfectious complications is imperative.6,7
Elevated type 1, or TH1, cytokines have been associated with CVID with noninfectious complications (CVIDc). This includes increased IL-12 and IFN-γ–producing cells, increased IL-12 and IFN-γ in blood, and greater expression and phosphorylation of signal transducer and activator of transcription 1 by monocytes, the key transcription factor activated by IFN-γ.8–15 Yet, the reason for elevated type 1 cytokines in CVIDc is unknown. Endotoxemia due to deficiency of mucosal antibodies may drive this cytokine response.16,17 Nevertheless, noninfectious complications occur less frequently in those with selective IgA deficiency and X-linked agammaglobulinemia despite having similar (or more severe) mucosal antibody loss, indicating that undefined factors beyond immunoglobulin deficiency contribute.18,19
Nuclear factor kappa B signaling induced by pathogen-associated molecular patterns (PAMPs), most prominently LPS, is fundamental for the induction of IL-12, a major driver of the type 1 cytokine response.20,21 Altered function of Toll-like receptors, which recognize PAMPs, has been reported in CVID, but the significance is unclear.22,23 Furthermore, an association with reduced isotype-switched memory B cells and the presence of noninfectious complications of CVID has long been established, but the reason for this link is unknown.24 Leveraging a large primary antibody deficiency (PAD) cohort and using high-throughput approaches as well as machine learning, we aimed to reconcile the numerous immunologic observations of CVID into a unified model of pathogenesis.
METHODS
Subjects
All subjects were patients at Boston Medical Center and/or Mount Sinai. Diagnosis of CVID was defined as markedly low serum IgG and IgA and/or IgM (IgG < 400 mg/dL, IgA < 45 mg/dL, or IgM < 35 mg/dL), poor response to at least 1 vaccine, and exclusion of other causes of hypogammaglobulinemia.2 CVIDc required a history of autoimmunity, inflammatory bowel disease, interstitial lung disease, and/or chronic liver disease. Antibodies used for immunohistochemistry are listed in Table E1 in this article’s Online Repository at www.jacionline.org. This study was approved by the institutional review boards of the Boston University School of Medicine and the Icahn School of Medicine at Mount Sinai. Research was carried out in accordance with the Code of Ethics of the World Medical Association (Declaration of Helsinki). Written informed consent was received from participants before inclusion.
TABLE E1.
Antibodies used for immunohistochemistry
| Marker | Clone | Company |
|---|---|---|
|
| ||
| CD3 | LN10 | Leica |
| CD4 | 4B12 | Leica |
| CD8 | 4B11 | Leica |
| CD20 | L26 | Leica |
Cell culture
PBMCs were purified from fresh venous blood using Ficoll density gradient centrifugation. Cells were resuspended in culture media (RPMI/10% HI FBS [Gibco, Grand Island, NY]/0.1% Antibiotic-Antimycotic [Gibco]) to a final concentration of 1 to 5 × 10⁵ cells/100 μL and then added to a sterile, 96-well, flat-bottom cell culture plate (Corning, Corning, NY). LPS or TNF was added at 20 ng/μL for 18 hours where indicated.
Cytokine, chemokine, soluble CD14, and antibody measurement
The Olink Target 96 Inflammation panel was used to provide qualitative measurement of 92 analytes in subject plasma before any immunomodulatory therapy other than immunoglobulin replacement (https://www.olink.com/products/inflammation/). Plasma CXCL10, IFN-γ, IL-12p40, and TNF were also measured by multiplex assay on the Luminex 200 system. Soluble CD14 (sCD14), IL-6, IL-10, and TNF in plasma or cell supernatants were also measured by ELISA (R&D Systems, Minneapolis, Minn). Plasma LPS-specific antibodies were measured as previously.25
RNA sequencing
Total RNA was extracted from cultured PBMCs using RNeasy Mini kits (Qiagen, Germantown, Md). One microgram of RNA was used for preparing RNA sequencing library with the TruSeq stranded mRNA kit (Illumina, San Diego, Calif) following manufacturer’s protocol. The xGene dual index UMI adaptors (Integrated DNA Technology, Coralville, Iowa) were used for barcoding samples. Sequencing was done on the Illumina NextSeq 550 system. Data underwent demultiplexing, followed by transcript alignment (STAR) and sequence deduplication (UMI-tools).26,27 Final transcript counts of each sample were obtained using HTSeq.28 Statistical analysis of gene counts data was carried out using DESeq2 in R software.29 A 2-factor linear model with interaction effects was constructed to test the hypothesis that cultured PBMCs from subjects with different disease phenotypes show distinct gene expression profiles in response to LPS. Generalized linear regressions with the negative binomial residual model were performed on gene count data. We also carried out the likelihood ratio test using the same model to confirm the results. Significant genes were selected for those that showed differential expressions in response to LPS among different disease groups (with false discovery rate-adjusted P value <.1 and difference larger than 2-folder). Gene set enrichment analysis was performed to identify impacted pathways.30
Mass cytometry
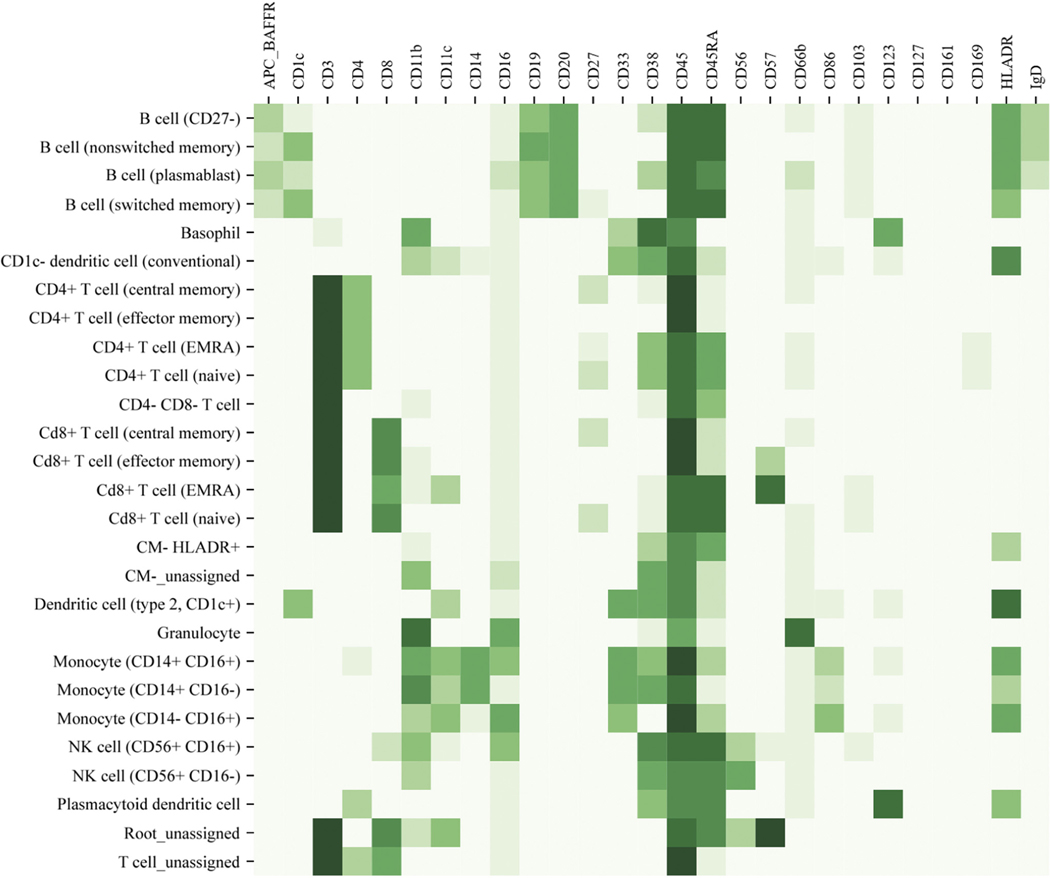
Whole blood samples from 10 patients with CVIDc, 10 patients with CVID without complications, and 10 healthy controls (HCs) selected at random were analyzed as previously; antibodies are listed in Table E2 in this article’s Online Repository at www.jacionline.org.13 Differential abundance analysis and cell subset definitions were done as previously.31–35 Cluster labeling, method implementation, and visualization were done using a computational approach through the Astrolabe Platform (https://astrolabediagnostics.com/). Marker expression assigned to each leukocyte subset is summarized in Fig E1 in this article’s Online Repository at www.jacionline.org.
TABLE E2.
Antibodies used for mass cytometry
| Metal | Marker | Clone | Manufacturer |
|---|---|---|---|
|
| |||
| 89Y | CD45 | HI30 | Fluidigm |
| 113In | CD57 | HCD57 | Biolegend |
| 115In | CD11c | Bu15 | Biolegend |
| 141Pr | IgD | IA6-02 | Biolegend |
| 142Nd | CD19 | HIB19 | Biolegend |
| 143Nd | CD45RA | HI100 | Biolegend |
| 144Nd | CD103 | Ber-Act8 | Biolegend |
| 145Nd | CD4 | RPA-T4 | Biolegend |
| 146Nd | CD8 | RPA-T8 | Biolegend |
| 148Nd | CD16 | 3G8 | Biolegend |
| 149Sm | CD127 | REA614 | Miltenyi |
| 150Nd | CD1c | L161 | Biolegend |
| 151Eu | CD123 | 6H6 | Biolegend |
| 152Sm | CD66b | G10F5 | Biolegend |
| 154Sm | CD86 | IT2.2 | Biolegend |
| 155Gd | CD27 | O323 | Biolegend |
| 158Gd | CD33 | WM53 | Biolegend |
| 160Gd | CD14 | M5E2 | Biolegend |
| 161Dy | CD56 | B159 | BD Biosciences |
| 162Dy | CD20 | 2H7 | Biolegend |
| 163Dy | Anti-APC / APC BAFFR | APC003 / 8A7 | Biolegend / Biolegend |
| 166Er | CD169 | 7–239 | Biolegend |
| 168Er | CD3 | UCHT1 | Biolegend |
| 170Er | CD38 | HB-7 | Biolegend |
| 171Yb | CD161 | HP-3G10 | Biolegend |
| 174Yb | HLADR | L243 | Biolegend |
| 209Bi | CD11b | ICRF44 | Fluidigm |
FIG E2.
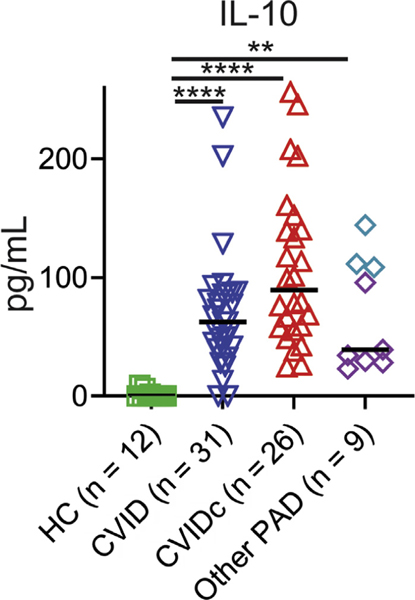
Plasma IL-10 is increased in CVIDc, uncomplicated CVID, and other PAD compared with HCs. HIgM, Hyper-IgM syndrome. Plasma IL-10 measured by ELISA. Purple diamonds denote subjects with XLA, and teal diamonds denote subjects with HIgM. P value calculated by Kruskal-Wallis test. XLA, X-linked agammaglobulinemia. **P < .01, ****P < .0001.
Unsupervised machine learning
We applied a partition around mediods clustering algorithm and multiple factor analysis (MFA) to our data from subjects with CVID (complicated and uncomplicated) and HC subjects, consisting of plasma cytokines and chemokines, total and LPS-specific antibody responses, and peripheral blood leukocyte immunophenotyping. Partition around medoids and MFA were done in R using the cluster and FactoMineR packages. To visualize the cluster results, Rtsne was used to map high-dimension data into 2-dimension coordinates.
Statistics
Categorical values were compared using the Fisher exact test. Continuous values were compared using Mann-Whitney test for 2 groups. For multiple group comparison, Kruskal-Wallis test was used for 1-way ANOVA comparisons and Sidak or Tukey multiple comparison’s test was applied when 2-way ANOVA was used. Correlation was defined via Spearman rank coefficient.
RESULTS
Elevation of cytokines and molecules involved in T-cell function in CVIDc
We used the Olink Target 96 Inflammation panel to measure plasma proteins from 79 subjects, including 26 subjects with CVIDc with no known genetic etiology after evaluation by whole-exome sequencing (in 19 subjects) and the 207 gene primary immunodeficiency panel (Invitae) (in 4 subjects)36 and 31 subjects with uncomplicated CVID (Table I), as well as 12 age- and sex-matched HCs and 10 subjects with other forms of PAD (3 with hyper-IgM syndrome, 3 with selective IgA deficiency, and 4 with X-linked agammaglobulinemia; Table II). We found elevation of IL-12p40, IL-6, IL-18, IL-18 receptor, colony-stimulating factor 1, lymphotoxin alpha, the TNF superfamily member LIGHT, oncostatin M, and vascular endothelial growth factor A in CVIDc compared with uncomplicated CVID, HC, and the other forms of PAD tested (Fig 1, A). Numerous proteins involved in T-cell function were also higher in CVIDc including 4–1BB, CD40, CD5, CD6, and FMS-like tyrosine kinase 3 ligand. We were unable to measure IFN-γ or TNF by Olink. Using multiplex cytokine measurement by Luminex (Invitrogen, Waltham, Mass) and ELISA, we found elevation of IFN-γ and TNF as well as confirmed elevations of IL-12p40 and IL-6 in CVIDc relative to uncomplicated CVID, other PAD, and HC (Fig 1, B). In contrast to the elevations of proinflammatory cytokines distinguishing CVIDc, IL-10 was similarly elevated in all forms of PAD relative to HC (see Fig E2 in this article’s Online Repository at www.jacionline.org).
TABLE I.
Clinical and laboratory characteristics of subjects with CVID
| Characteristic | CVIDc | CVID | P value* |
|---|---|---|---|
|
| |||
| No. of subjects | 26 | 31 | |
| Sex: female (%) | 15 (58) | 18 (58) | >.999 |
| Median age (y) (95% CI) | 45.5 (39–52) | 48 (38–54) | .636 |
| Subjects (%) with history of: | |||
| Sinusitis | 14 (54) | 24 (77) | .091 |
| Pneumonia | 14 (54) | 19 (61) | .601 |
| Bronchiectasis | 6 (23) | 4 (13) | .486 |
| Median lab value (95% CI) | |||
| Diagnostic IgG (mg/dL) | 226 (100–345) | 233 (89–366) | .922 |
| Diagnostic IgA (mg/dL) | 7 (0–13) | 25 (7–49) | .045 |
| Diagnostic IgM (mg/dL) | 13.5 (0–40) | 20.5 (6–33) | .595 |
| Neutrophils (103/μL) | 3.1 (2.6–4.4) | 3.3 (2.8–4.1) | .846 |
| Lymphocytes (103/μL) | 1.0 (0.8–1.2) | 1.5 (1.2–1.8) | .004 |
| CD4+ T cells (/μL) | 472 (333–781) | 679 (504–857) | .058 |
| CD8+ T cells (/μL) | 224 (138–291) | 428 (321–627) | .0004 |
| CD16+CD56+ (/μL) | 69.5 (48–135) | 109 (78–222) | .127 |
| CD19+ B cells (/μL) | 65 (25–139) | 190 (138–328) | <.0001 |
Categorical values were compared using Fisher exact test. Continuous values were compared using Kruskal-Wallis test. Values below the level of detection of the laboratory assay were recorded as 0. Significant P values are in boldface.
TABLE II.
Clinical and laboratory characteristics of subjects with other PAD
| Characteristic | HIgM | IgAD | XLA | |||||||
|---|---|---|---|---|---|---|---|---|---|---|
|
| ||||||||||
| Gene | CD40LG | CD40LG | AICDA | NA | BTK | |||||
| Mutation (cDNA location) | 580delG | 632C>A | * | NA | † | † | 138C>T | † | ||
| Sex | M | M | F | M | M | F | M | M | M | M |
| Age (y) | 19 | 40 | 41 | 73 | 35 | 15 | 41 | 37 | 11 | 19 |
| History of: | ||||||||||
| Sinusitis | X | X | X | X | X | X | X | X | ||
| Pneumonia | X | ‡ | X | X | X | |||||
| Bronchiectasis | X | |||||||||
| ILD | ||||||||||
| IBD | X | X | ||||||||
| Liver disease | X | |||||||||
| Autoimmunity | X | |||||||||
| Lab values | ||||||||||
| Diagnostic IgG (mg/dL) | 374 | NA | <51 | 779 | 871 | 621 | 272 | NA | 410 | NA |
| Diagnostic IgA (mg/dL) | 23 | <5 | 5 | <5 | <7 | <5 | <7 | <5 | <7 | <5 |
| Diagnostic IgM (mg/dL) | 707 | 1543 | 1367 | 45 | 60 | 15 | <5 | <5 | <4 | <5 |
| Neutrophils (103/μL) | 2 | 5.2 | 3.5 | 5.2 | 4.6 | 3.9 | 0.8 | 4.5 | 3.0 | 2.9 |
| Monocytes (103/μL) | 0.4 | 0.8 | 0.3 | 0.7 | 0.5 | 0.6 | 0.2 | 1.3 | 0.7 | 0.7 |
| Lymphocytes (103/μL) | 1.6 | 1.5 | 1.5 | 1.3 | 1.6 | 2.7 | 1 | 1.3 | 1.9 | 0.9 |
| CD4+ T cells (/μL) | 850 | NA | NA | 726 | 818 | NA | NA | 710 | 1103 | NA |
| CD8+ T cells (/μL) | 332 | NA | NA | 1462 | 838 | NA | NA | 475 | 442 | NA |
| CD16+CD56+ NK cells (/μL) | 166 | NA | NA | 190 | 229 | NA | NA | 55 | 62 | NA |
| CD19+ B cells (/μL) | 351 | NA | NA | 64 | 240 | NA | NA | 0 | 3 | NA |
F, Female; HIgM, hyper-IgM syndrome; IgAD, selective IgA deficiency; ILD, interstitial lung disease; M, male; NA, not available; NK, natural killer; SARS-CoV-2, severe acute respiratory syndrome coronavirus 2; XLA, X-linked agammaglobulinemia.
Genetic analysis failed to amplify exon 1 of AICDA.
Diagnosis confirmed by flow cytometry.
No previous history of pneumonia at the time of study participation, but patient died because of respiratory failure in the context of SARS-CoV-2 pneumonia.
FIG 1.
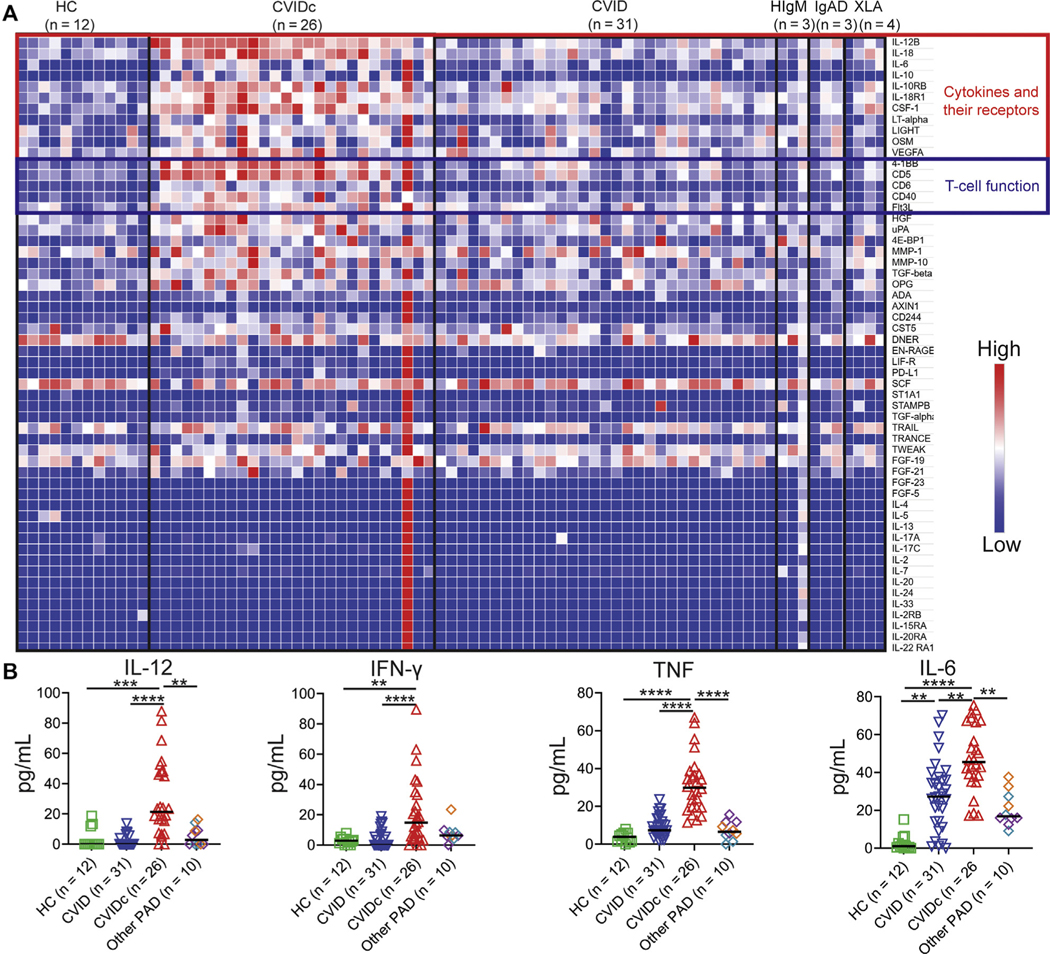
Elevation of cytokines and molecules involved in T-cell function in CVIDc. A, Plasma cytokines by Olink in uncomplicated CVID, CVIDc, XLA, HIgM, IgAD, and HCs. B, Plasma IL-12, IFN-γ, and TNF by Luminex, IL-6 by ELISA. XLA (purple diamonds), HIgM (teal diamonds), IgAD (orange diamonds). HIgM, Hyper-IgM syndrome; IgAD, selective IgA deficiency; XLA, X-linked agammaglobulinemia. **P < .01, ***P < .001, **** P < .0001.
Cytokine and sCD14 elevation corresponds with greater antibody defect in CVID
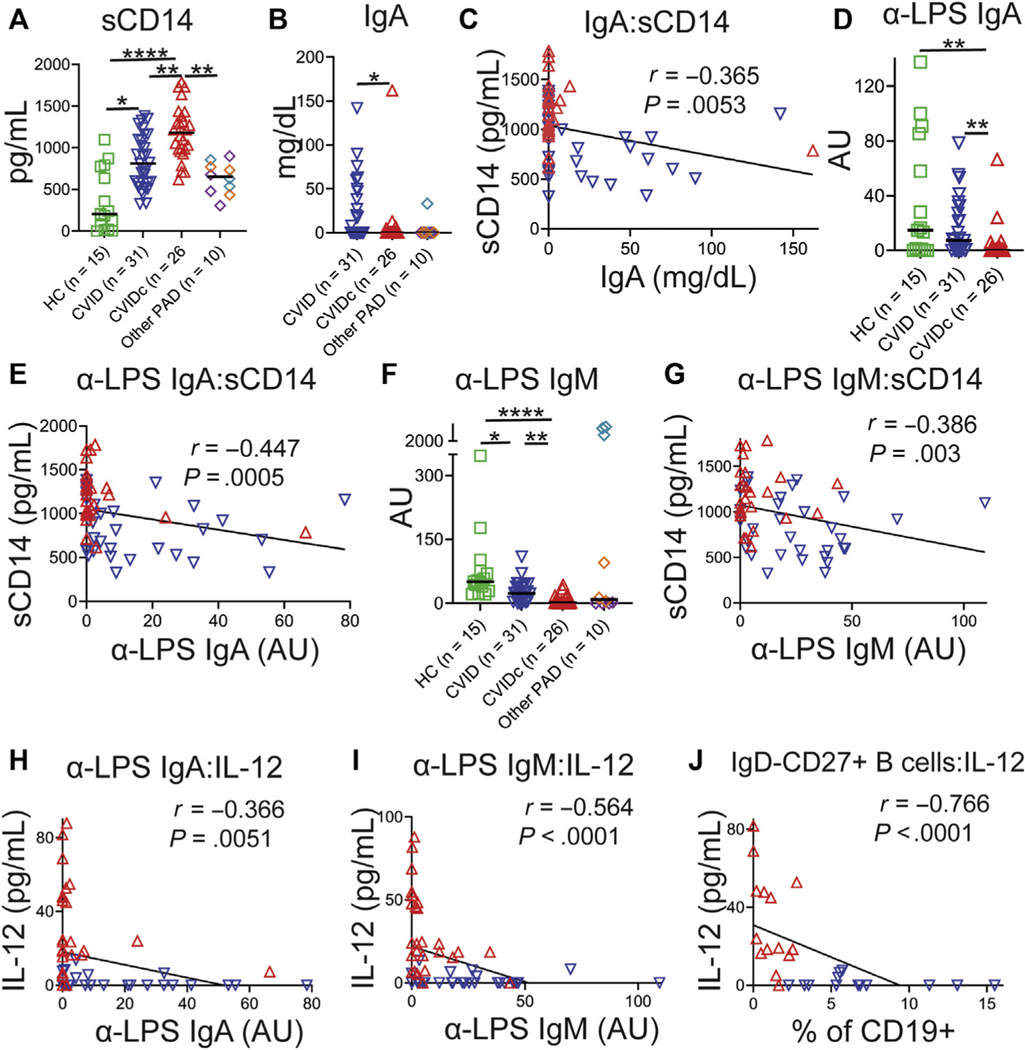
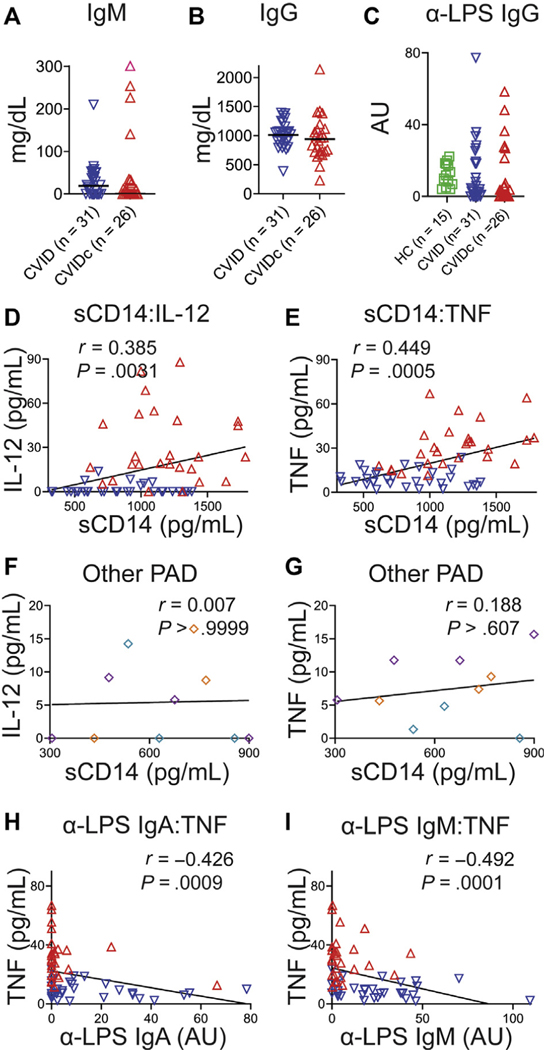
Elevation of sCD14 marks microbial translocation, a process facilitated by immune deficiency that may drive inflammation via endotoxemia in HIV and other diseases.37 Plasma sCD14 was elevated in CVIDc relative to uncomplicated CVID, other forms of PAD, and HCs as well as higher in uncomplicated CVID relative to HCs (Fig 2, A). We were unable to demonstrate differences in plasma LPS, consistent with previous reports (data not shown).38,39 IgA is the prominent isotype at mucosal surfaces and may prevent translocation of microbial products into circulation.40 We found serum IgA to be significantly reduced in CVIDc (Fig 2, B) and to have modest negative correlation with sCD14 (r = −0.365; P = .0053; Fig 2, C). Correspondingly, LPS-specific IgA was significantly reduced in CVIDc (Fig 2, D) and more strongly correlated with sCD14 (r = −0.447; P = .0005; Fig 2, E). Although there were no differences in total serum IgM (see Fig E3, A, in this article’s Online Repository at www.jacionline.org) or IgG while patients were on IgG replacement therapy (Fig E3, B), we found that LPS-specific IgM was significantly reduced in CVIDc relative to uncomplicated CVID and HCs (Fig 2, F), in correlation with sCD14 (r = −0.386; P = .003; Fig 2, G). There was no difference in LPS-specific IgG detected between groups (Fig E3, C). Plasma sCD14 correlated with IL-12 and TNF levels in CVID (Fig E3, D and E), but not in other PAD (Fig E3, F and G). Thus, we saw decreased levels of total IgA and LPS-specific IgA and IgM correlating with levels of sCD14 in CVIDc, with sCD14 correlating with plasma IL-12 and TNF levels in CVID. Notably, these cytokines did not correlate with sCD14 in other forms of PAD, indicating that this relationship was a distinguishing feature of CVID.
FIG 2.
Cytokine and sCD14 elevation corresponds with greater antibody defect in CVID. A, Plasma sCD14. XLA (purple diamonds), HIgM (teal diamonds), IgAD (orange diamonds). B, Serum IgA. C, IgA and sCD14 correlation. D, Plasma LPS-specific IgA. E, LPS-specific IgA and sCD14 correlation. F, Plasma LPS-specific IgM. G, LPS-specific IgM and sCD14 correlation. H, LPS-specific IgA and IL-12 correlation. I, LPS-specific IgM and IL-12 correlation. J, Isotype-switched memory B cells and IL-12 correlation. HIgM, Hyper-IgM syndrome; IgAD, selective IgA deficiency; XLA, X-linked agammaglobulinemia. Red triangles denote CVIDc, and blue triangles denote uncomplicated CVID. *P < .05, **P < .01, ***P < .001, ****P < .0001.
FIG E3.
Relationship of plasma antibodies and cytokine levels. (A) Plasma IgM and (B) IgG. C, Plasma levels of LPS-specific IgG. (D) Correlation of sCD14 with IL-12 and (E) TNF. Plasma TNF levels were higher in those with lower LPS-specific IgM. Red dots denote subjects with CVIDc, and blue dots denote subjects with uncomplicated CVID. (F) No correlation between plasma sCD14 and IL-12 and (G) TNF in other PAD (purple denotes XLA, teal denotes HIgM, orange denotes IgAD). H, Correlation of plasma LPS-specific IgA with TNF. I, Correlation of plasma LPS-specific IgM with TNF. HIgM, Hyper-IgM syndrome; IgAD, selective IgA deficiency; r, Spearman rank correlation coefficient; XLA, X-linked agammaglobulinemia.
We next examined whether there was correlation between the extent of antibody deficiency and cytokine dysregulation in CVID. LPS-specific IgA showed negative correlation with IL-12 (r = −0.366; P =.0051; Fig 2, H) and TNF (r = −0.426; P = .0009; Fig E3, H). LPS-specific IgM also negatively correlated with IL-12 (r = −0.564; P < .0001; Fig 2, I) and TNF (r = −0.491; P = .0001; Fig E3, I). Isotype-switched memory B cells (IgD−CD27+CD19+) are known to be reduced in CVIDc relative to uncomplicated CVID.24 We found strong negative correlation between isotype-switched memory B cells and plasma IL-12 (r = −0.742; P < .0001; Fig 2, K) and TNF (r = −0.766; P < .0001; data not shown). Our results demonstrate that cytokine and sCD14 elevation corresponds with greater antibody defect in CVID, including deficiency of antibodies that may neutralize endotoxemia, such as IgA, LPS-specific IgA, and LPS-specific IgM.
Altered LPS-driven leukocyte gene expression mirrors plasma cytokine dysregulation in CVIDc
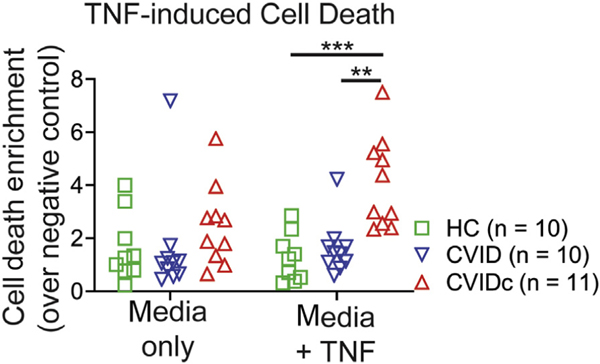
Correlation of CVIDc cytokine dysregulation with loss of LPS-specific antibodies led us to test LPS-induced gene expression. We performed RNAseq on unstimulated and LPS-stimulated PBMCs and found gene expression of CVIDc to have a pattern distinct from that of uncomplicated CVID and HCs, whereas uncomplicated CVID and HCs had similar patterns (Fig 3, A). Gene set enrichment analysis revealed that type 1 cytokine and inflammatory pathways were among the most elevated in CVIDc, including pathways related to IFN-γ, IL-6, and TNF (Fig 3, B) along with IL1A, IL1B, IL6, IL23A (IL-23 shares the IL-12p40 subunit with IL-12), oncostatin M, and vascular endothelial growth factor A (Fig 2, C). RNAseq results were confirmed using NanoString nCounter analysis.41 Because apoptosis and TNF signaling were highly elevated gene sets (Fig 3, B), we measured TNF-driven apoptosis of PBMCs and found it to be increased in CVIDc (see Fig E4 in this article’s Online Repository at www.jacionline.org), validating another RNAseq finding. In summary, altered LPS-driven gene expression in CVIDc matched plasma proteomics, illustrating the potential significance of reduced LPS-specific antibodies we found in these patients.
FIG 3.
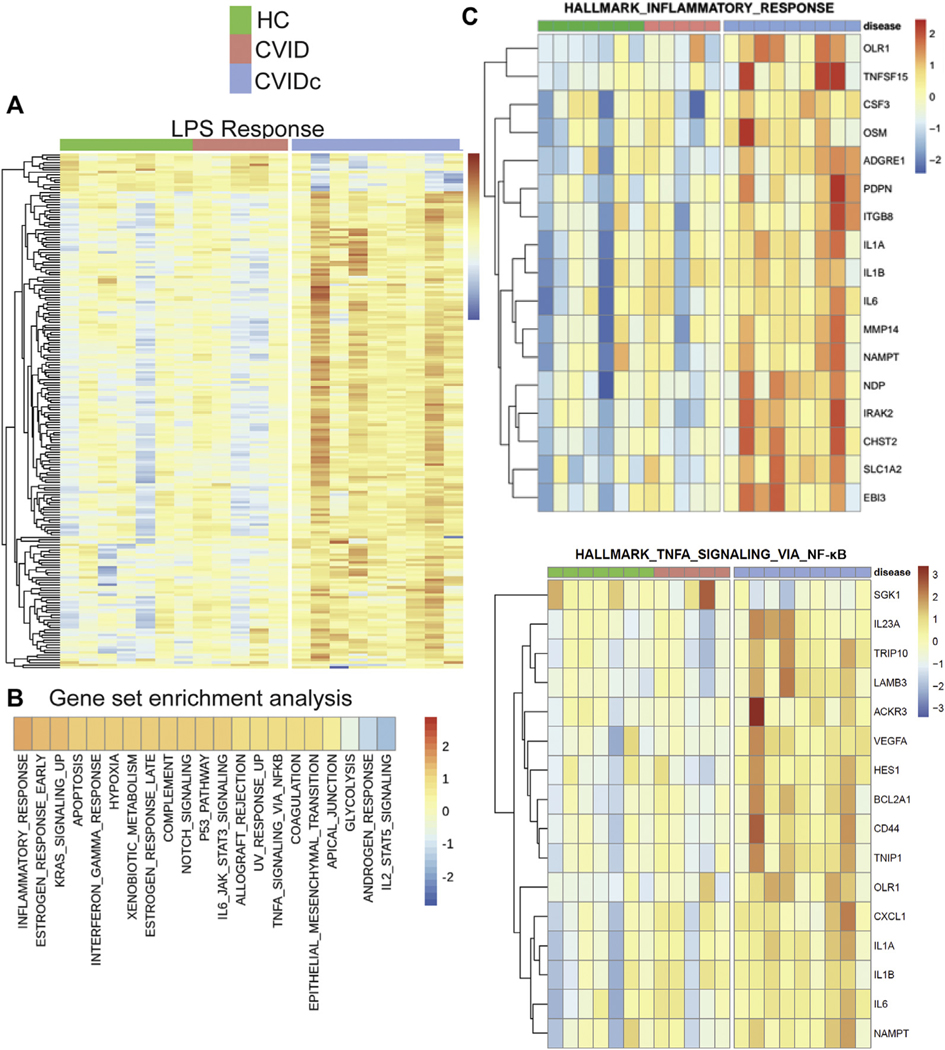
Altered LPS-driven leukocyte gene expression mirrors plasma cytokine dysregulation in CVIDc. A, Global gene expression effect of LPS stimulation on PBMCs, showing CVIDc differs from the pattern shared between uncomplicated CVID and HCs. B, Gene set enrichment analysis comparing CVIDc against uncomplicated CVID and HCs grouped together. C, Heat maps of the hallmark inflammatory response and TNF signaling via NF-kB gene sets. *P < .05, **P < .01, ***P < .001.
FIG E4.
TNF-induced cell death of PBMCs. Cell death measured by Cell Death Detection ELISAPLUS (Roche, Basel, Switzerland) photometric detection of mono- and oligonucleosome fragments indicative of apoptosis after 18 hours of culture with 20 ng/mL TNF. P value calculated by Tukey multiple comparisons test. **P < .01, ***P < .001.
Cytokine dysregulation of CVIDc corresponds with expansion and activation of circulating monocytes
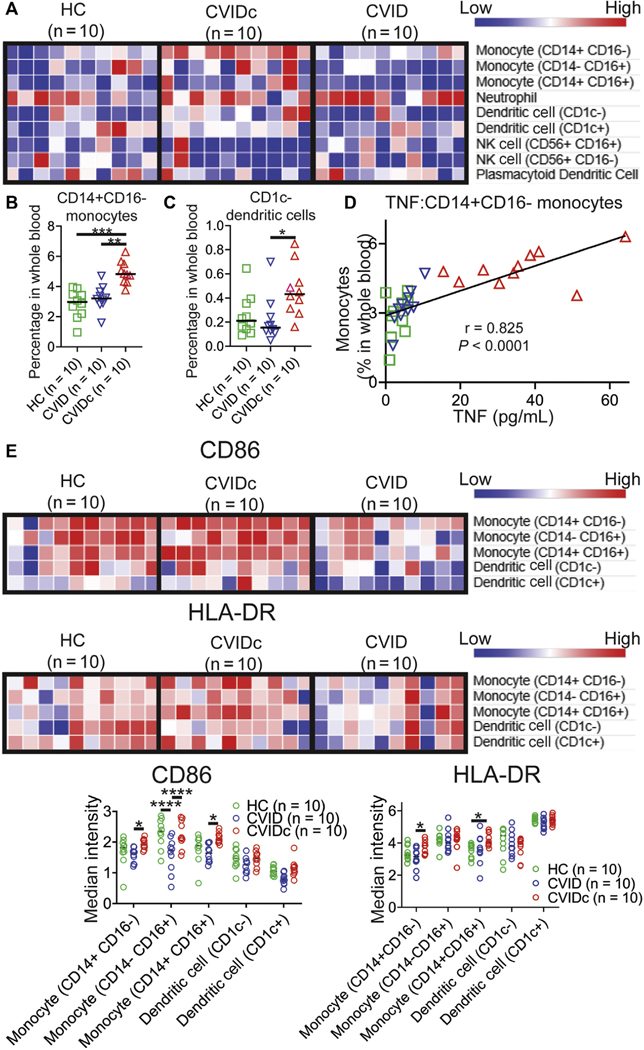
Cell-type deconvolution of our RNAseq data suggested that the findings corresponded with an increase in monocytes in CVIDc (see Fig E5, A, in this article’s Online Repository at www.jacionline.org).42 Using mass cytometry to more definitively measure leukocyte populations in whole blood, we found the proportion of CD14+CD16− (classical) monocytes to be significantly elevated in CVIDc compared with either HCs or uncomplicated CVID (Fig 4, A and B). We also found CD1c− (conventional) dendritic cells to be increased in CVIDc compared with uncomplicated CVID (Fig 4, A and C). We did not find differences in other dendritic cell or monocyte subsets or neutrophils, natural killer cells, and plasmacytoid dendritic cells. Proportion of CD14+CD16− monocytes in the blood strongly correlated with plasma TNF (Fig 4, D; r = 0.907; P < .0001) and plasma IL-12 (Fig E5, B; r = 0.803; P < .0001). Demonstrating greater monocyte activation, we found expression of the costimulatory molecule CD86 to be significantly higher on all monocyte subsets in CVIDc compared with uncomplicated CVID (Fig 4, D and E). HLA-DR was also significantly higher on CD14+CD16− monocytes from CVIDc compared with uncomplicated CVID. Thus, the cytokine dysregulation of CVIDc corresponds with expansion and activation of monocytes.
FIG E5.
Additional data supporting relationship of monocyte expansion and activation with cytokine dysregulation in CVIDc. A, Leukocyte subsets by cell-type deconvolution of RNAseq. **P < .01. B, Correlation of plasma IL-12 with circulating CD14+CD16− monocytes. Red triangles denote subjects with CVIDc, blue triangles denote subjects with uncomplicated CVID, and green triangles denote HCs.
FIG 4.
Cytokine dysregulation of CVIDc corresponds with expansion and activation of circulating monocytes. A, Innate immune-cell subsets in whole blood by mass cytometry. (B) CD14+CD16− monocytes and (C) CD1c− dendritic cells as percentages of whole blood. D, Plasma TNF and CD14+CD16− monocyte correlation. E, CD86 and HLA-DR median intensity. *P < .05, **P < .01, ***P < .001, ****P < .0001.
CVIDc cytokine dysregulation cytokine dysregulation corresponds with T-cell activation and infiltration of tissues
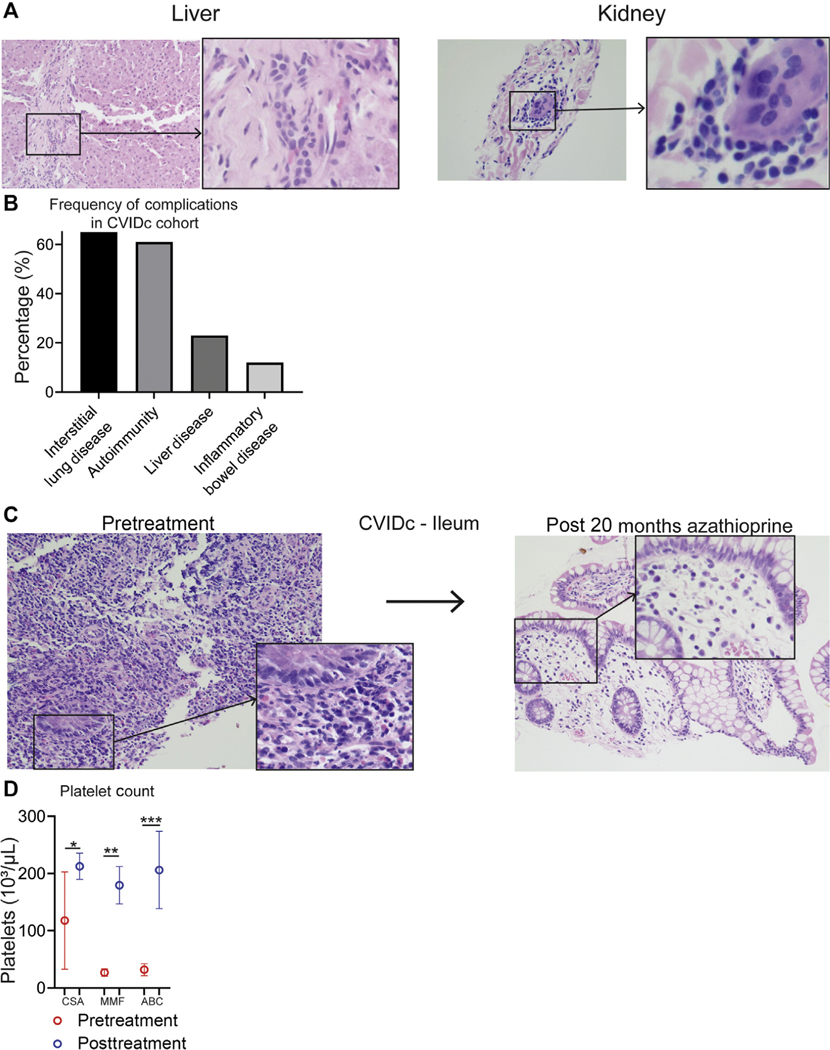
Given the importance of inflammatory cytokines and expression of CD86 and HLA-DR by antigen-presenting cells for T-cell activation, we measured CD4+ and CD8+ T central memory (TCM) (CD45RAlo, CD27+), effector memory (CD45RAlo, CD27−), effector memory that reexpress CD45RA (CD45RAhi, CD27−), and naive (CD45RAhi, CD27+) cells in whole blood by mass cytometry.43 We found the proportion of CD4+ TCM cells to be elevated in CVIDc compared with HCs and uncomplicated CVID (Fig 5, A and B). We also found circulating CD4+ effector memory cells increased in CVIDc compared with HCs. Proportion of CD4+ TCM cells strongly correlated with plasma IL-12 (Fig 5, C; r = 0.742; P < .0001). There was no difference in the proportions of CD8+ TCM, CD8+ T effector memory, CD8+ effector memory that reexpress CD45RA, or naive CD8+ T cells between CVIDc, uncomplicated CVID, and controls. Because total CD8+ T-cell counts were significantly lower (P = .0004; Table I) and approached significance for reduction of CD4+ T cells (P = .058), overall numbers of naive CD4+ T cells and CD8+ T-cell subsets were reduced in CVIDc. Corresponding with the increase in circulating CD4+ memory T-cell subsets, T-cell–predominant lymphocytic infiltration was observed in the gastrointestinal tract, salivary gland, and lung (Fig 5, D) as well as liver and kidney of subjects with CVIDc (see Fig E6, A, in this article’s Online Repository at www.jacionline.org).
FIG 5.
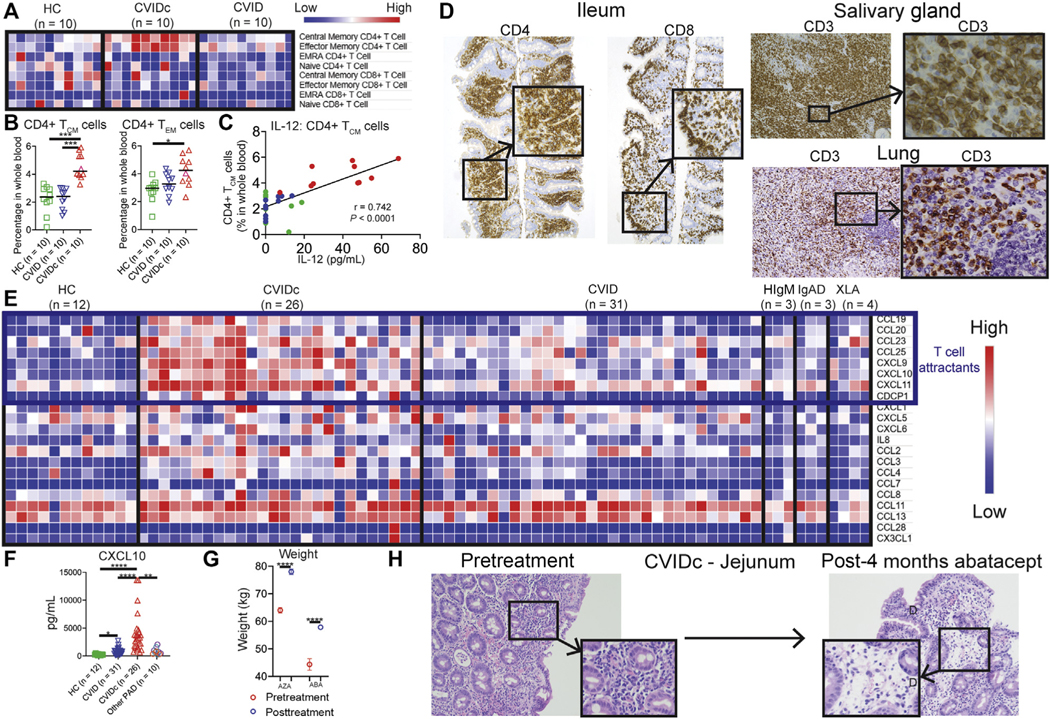
CVIDc cytokine dysregulation corresponds with T-cell activation and infiltration of tissues. A and B, CD4+ and CD8+ T-cell subsets as percentages of whole blood. C, Plasma IL-12 correlation with CD4+ TCM cells. D, Representative CVIDc biopsies illustrating T-cell infiltration. E, Olink measurement of plasma chemokines. F, Luminex measurement of plasma CXCL10. G, Weight before and after immunomodulatory therapy (AZA 5 azathioprine, ABC 5 abatacept) in subjects with CVIDc. Data points are means with SD 3 weights measured before and after treatment. G, Ileum biopsies before and after abatacept in subject P22 with CVIDc. **P < .01, ***P < .001, ****P < .0001.
FIG E6.
Additional evidence of T-cell–mediated pathology in CVIDc. A, Hematoxylin and eosin stains of liver and kidney biopsies from patients with CVIDc. B, Percentage of subjects with CVIDc with interstitial lung disease, autoimmunity, liver disease, and inflammatory bowel disease. C, Jejunum biopsies before and after azathioprine in CVIDc. D, Platelet counts before and after immunomodulatory therapy (CSA 5 cyclosporine, MMF 5 mycophenolate, ABC 5 abatacept) in CVIDc. Data points are means with SD of 3 to 5 platelet count measurements before and after treatment. **P < .01, ***P < .001, ****P < .0001.
Corresponding with increased lymphocytic tissue infiltration, we found elevations of numerous T-cell chemoattractants in CVIDc plasma (Fig 5, E), including CCL19, CCL20, CCL23, CCL25, CXCL9, CXCL10, and CXCL11 via Olink. Profound elevation of plasma CXCL10, a potent T-cell chemoattractant induced by IFN-γ, was confirmed by Luminex (Fig 5, F). Most subjects with CVIDc had interstitial lung disease (65%) or autoimmunity (61%), whereas 23% had chronic liver disease and 12% had inflammatory bowel disease (Fig E6, B). Two subjects with CVIDc received T-cell–targeted therapy for T-cell–predominant inflammatory bowel disease: One subject with CVIDc received the purine synthesis inhibitor azathioprine, and another received abatacept. Abatacept restrains T cells by provision of the checkpoint inhibitor cytotoxic T-lymphocyte–associated protein 4. In both cases, weight (Fig 5, G) and inflammation (Fig 5, H, and Fig E6, C) improved after 4 months of therapy. Three subjects with CVIDc received treatment that modulates T cells for recurrent immune thrombocytopenia: 1 received cyclosporine, 1 received mycophenolate mofetil, and 1 received abatacept. Cyclosporine inhibits the calcineurin pathway, vital to lymphocyte function, and mycophenolate mofetil selectively targets lymphocytes by inhibiting the de novo purine synthesis these leukocytes uniquely rely on. These therapies significantly increased platelet counts in the 3 subjects (Fig E6, D). Together, these results demonstrated that CVIDc cytokine and chemokine dysregulation corresponds with marked activation and tissue infiltration of T cells that may be pathogenic, because complications can be ameliorated by T-cell–targeted therapy.
FIG 6.
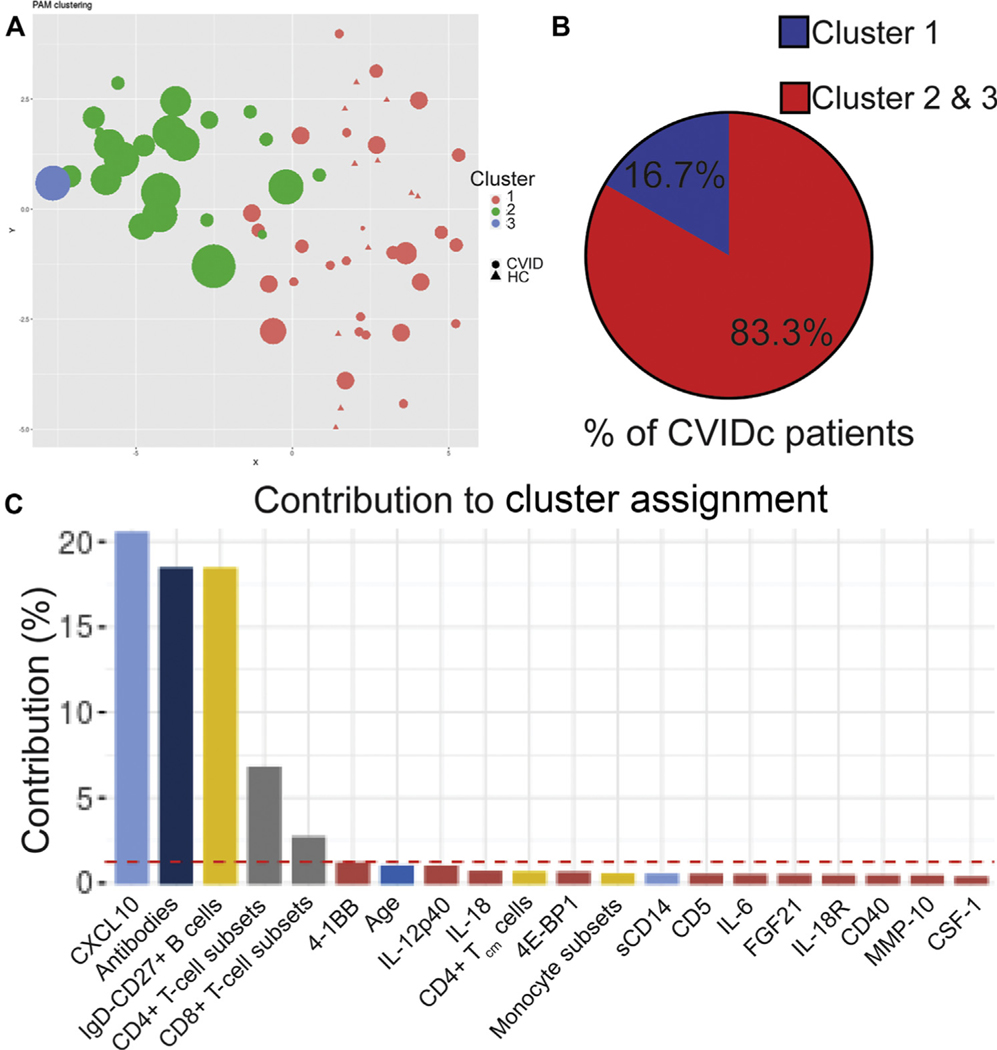
Unsupervised machine learning reinforces link between cytokines, antibodies, and T cells in CVIDc. A, Partition around medoids (PAM) clustering of subjects with CVID and HC subjects. Subjects with CVID denoted by circles, HCs by triangles. Cluster x and y coordinates were determined by the Rtsne algorithm. Each dot is for 1 human subject, and its size indicates the number of subject’s noninfectious complications. B, Percentage of subjects with CVIDc assigned to cluster 1 and clusters 2 and 3. C, Percent contribution of parameters to the largest principle components (PC1) in which there is significant separation between subjects with CVID and HCs. Red dashed line indicates threshold of significant contribution.
Unsupervised machine learning reinforces link between cytokines, antibodies, and T cells in CVIDc
We next applied a partition around medoids algorithm incorporating all the data we collected from our subjects, including plasma cytokines and chemokines, total and LPS-specific antibodies, peripheral leukocyte immunophenotyping, and laboratory results from the electronic medical record. This unbiased analysis identified 3 clusters of subjects. All HCs segregated to cluster 1, whereas subjects with CVID were assigned to clusters 1 and 2 (1 subject with very high plasma cytokines formed its own third cluster) (Fig 6, A). About 16.7% of patients with CVIDc were assigned to cluster 1, whereas 83.3% were assigned to cluster 2 or 3 (Fig 6, B). Conversely, 88.9% of patients with uncomplicated CVID were assigned to cluster 1 and 11.1% to cluster 2. Applying principal-component MFA to our clustering algorithm showed that it was most significantly driven by measurements of CXCL10, antibodies (total immunoglobulin isotype levels and LPS-specific antibodies), isotype-switched memory B cells, and CD4+ and CD8+ T-cell subset measurement (Fig 6, C). All variables, including CVID complications, were included in this MFA to confirm correlation and demonstrate that inclusion of more variables does not bias analysis (see Fig E7 in this article’s Online Repository at www.jacionline.org). Thus, unsupervised learning validated the association of elevated plasma cytokines with greater antibody defect and skewed T-cell immunophenotype, demonstrating that convergence of these traits is a distinguishing feature of CVIDc.
FIG E7.
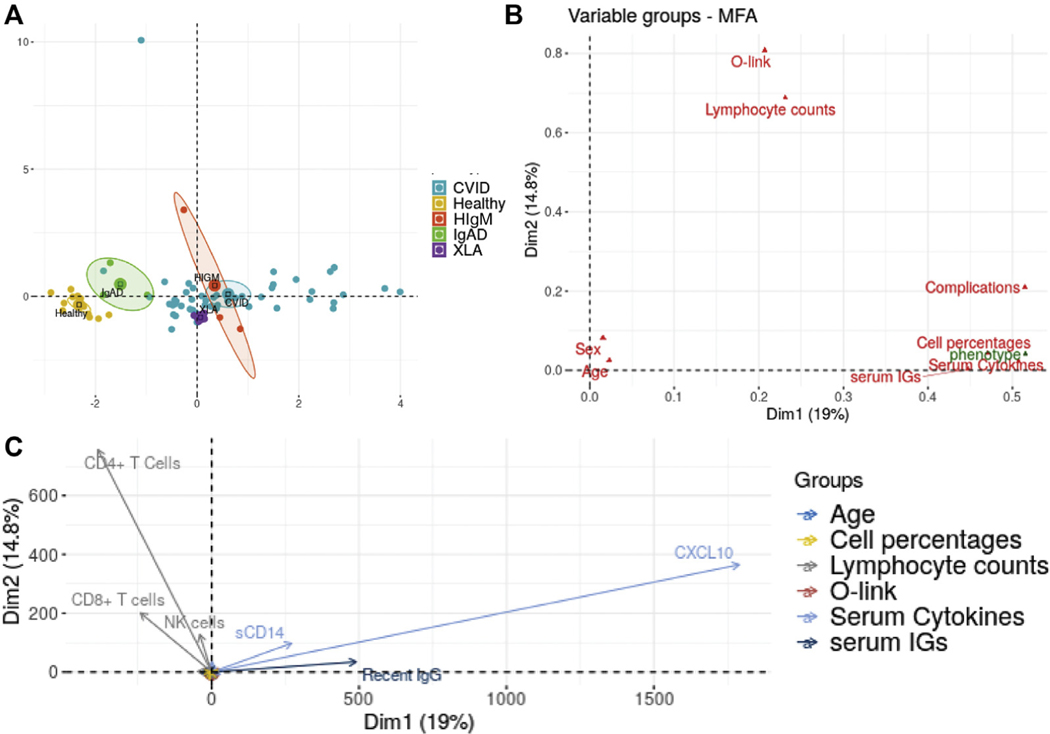
MFA of data from subjects with CVID and HC subjects. The data consist of plasma cytokines and chemokines, total and LPS-specific antibody responses, peripheral blood leukocyte immunophenotyping, and medical complications. A, Projection of individual subjects on the first 2 principal components (Dim1 and Dim2) showing clear separation of subject groups. B, Projection of variable groups on the first 2 principal components, with antibodies, lymphocyte subset percentages, and cytokines in blood correlating closely with the disease phenotype. C, Projection of individual quantitative variables on the first 2 principal components. Plasma sCD14, antibodies, and CXCL10 contribute largely to PC1 (Dim1), and CD4+ and CD8+ T-cell subsets providing the major contribution to PC2 (Dim2). All other quantitative variables are also shown on the figure; however, they contribute very little to either PC1 or PC2 and are therefore located very closely around the origin.
DISCUSSION
We found plasma proteomics distinguishing CVIDc with prominent elevation of IL-12p40 and TNF, cytokines that correlated with high sCD14 and deficiency of IgA and anti-LPS IgM and IgA. LPS-induced leukocyte gene expression mirrored the proteomics and also corresponded with monocyte and T-cell expansion and activation in CVIDc, with T-cell–targeted therapy having demonstrable efficacy in these patients. Unbiased computational analysis further emphasized an interrelationship of cytokine dysregulation, antibody dysfunction, and T-cell activation in CVIDc.
We found elevation of plasma proteins to distinguish CVIDc relative to uncomplicated CVID, other PAD, and HCs. This included corroborating previous reports of elevated IL-6, IL-18, and IFN-γ in CVIDc,9,14 as well as novel findings of increased soluble IL-18 receptor, colony-stimulating factor 1, lymphotoxin alpha, LIGHT, oncostatin M, TNF, and vascular endothelial growth factor A. We also found elevation of IL-12p40, the common subunit of IL-12 and IL-23, in CVIDc, previously reported elevated in CVID but not CVIDc specifically.44 Further efforts are needed to elucidate why these specific cytokines are elevated in CVIDc and their significance to therapy. Elevations of 4–1BB, CD40, and T-cell chemoattractants in CVIDc are consistent with a previous report,14 and, along with concurrently observed increases of CD5, CD6, and FMS-like tyrosine kinase 3 ligand, correspond with activation, expansion, and tissue infiltration of T cells in CVIDc, because these are all proteins involved in T-cell function. CXCL10 measurement was among the strongest differentiating factors by machine learning, and, because it is strongly induced by IFN-γ, provides a noted connection between the cytokine dysregulation and T-cell inflammation.45 Continued research is needed to understand how features of cytokine and T-cell dysregulation can be used to improve diagnosis, prognosis, and treatment of CVIDc.
We found plasma sCD14, a marker of bacterial translocation as well as systemic inflammation, elevated in CVIDc relative to uncomplicated CVID, other forms of PAD, and HCs. Although others have previously reported sCD14 elevation in CVID, ours is the first to demonstrate the highest levels in CVIDc.38,39 Concurrently, we found reduced levels of IgA as well as LPS-specific IgA and IgM in CVIDc, and levels of these antibodies inversely correlated with sCD14 as well as IL-12 and TNF. These data suggest that antibodies reduced in CVIDc may play a role in neutralizing PAMPs, such as LPS, that drive inflammation. Moreover, it provides an explanation of why CVID complications occur despite IgG replacement therapy, because specific IgA and IgM responses may be important in limiting microbial-induced inflammation. However, there are likely nuances to this conclusion because we found no correlation between sCD14 and IL-12 or TNF in other PAD. Notably, sCD14 helps induce IL-1β, IL-6, and TNF,46 all cytokines we found elevated in CVIDc. Additional exploration of microbial influence and sCD14 levels on CVID phenotype could help further clarify their role in promoting noninfectious complications.
LPS stimulation of PBMCs demonstrated gene expression matching plasma proteomics. RNAseq analysis also revealed that altered LPS-induced gene expression was shaped by the increased proportion and activation of monocytes in CVIDc. Elevation of peripheral monocytes was revealed to be predominantly the CD14+CD16− classical monocyte, a subset previously found elevated in patients with CVID with progressive interstitial lung disease.13 An increase in CD14bright monocytes was previously reported in CVID in association with levels of sCD14 and T-cell activation, though information regarding noninfectious complications is not included.38 Increased CD14+CD16++ nonclassical monocytes are also reported in CVID, but levels may be altered by IgG replacement therapy and we did not find elevation of this subset in our cohort.17,47
We found expression of CD86 and HLA-DR, proteins involved in activation of T cells, increased on CD14+CD16− classical monocytes in CVIDc, corresponding with elevated proportion of memory CD4+ T cells, particularly TCM, higher levels of T-cell attractant chemokines in the blood, and lymphocyte infiltration of tissues. Providing evidence for significance of the T-cell activation and expansion in CVIDc, we found improvement in gastrointestinal disease and autoimmune thrombocytopenia with therapies that suppress T cells in a small group of patients.
Our study is limited by small numbers of subjects, requiring us to combine patients with CVIDc with different complications as well as multiple diagnoses into our other PAD cohort. Studies specifically assessing one type of CVID complication may reveal distinct features of that condition, such as dysregulation of B-cell–activating factor and B-cell hyperplasia in patients with CVID with interstitial lung disease.13,48 Despite these limitations, our data support a model that should be further studied in which deficiency of antibody neutralization of PAMPs, such as LPS, couples with heightened PAMP-induced inflammation to promote CVIDc.
FIG E1.
Definition of immune-cell subsets by mass cytometry. Figure displays the markers (top axis) and expression levels (darker green indicates higher expression) used to define leukocyte subsets (left axis) in mass cytometry analysis.
Key messages.
Patients with CVIDc have a distinct cytokine and chemokine profile coinciding with deficiency of LPS-specific antibodies, together corresponding with expansion and activation of monocytes and T cells.
The mélange of immunologic observations of CVIDc can be simplified into a model characterized by convergence of the loss of antibodies against microbial stimuli with heightened microbial-induced inflammatory response.
Acknowledgments
This work was funded by the National Institutes of Health (grant nos. AI137183 and AI151486), an AAAAI Foundation Faculty Development Award, investigator-initiated grants from Horizon Pharma and Takeda, and a Career Investment Award from Boston University (all to P.J.M.). The funding sources were not involved in the collection, analysis, interpretation of data, preparation of the manuscript, or the decision to submit this report for publication.
We thank the patients and their families for their participation in this research as well as the nursing staff for sharing in the care of these patients. We appreciate helpful discussion with Tom Kepler and Jay Mizgerd regarding experimental design. We thank Ernest Dimbo for assistance in receiving and storing samples at Boston University. RNA sequencing was done at the Genomics Core of Tufts University. Mass cytometry was done at the Human Immune Monitoring Center of the Icahn School of Medicine at Mount Sinai using mass cytometry instrumentation supported by instrumentation grant (grant no. S10OD023547). This work is dedicated to the memory of coauthor Kayla Anne Bell.
Abbreviations used
- CVID
Common variable immnodeficiency
- CVIDc
CVID with noninfectious complications
- HC
Healthy control
- MFA
Multiple factor analysis
- PAD
Primary antibody deficiency
- PAMP
Pathogen-associated molecular pattern
- sCD14
Soluble CD14
- TCM
T central memory
Footnotes
Disclosure of potential conflict of interest: The authors declare that they have no relevant conflicts of interest.
REFERENCES
- 1.Lee TK, Gereige JD, Maglione PJ. State-of-the-art diagnostic evaluation of common variable immunodeficiency [published online ahead of print March 11, 2021]. Ann Allergy Asthma Immunol. 10.1016/j.anai.2021.03.005. [DOI] [PMC free article] [PubMed] [Google Scholar]
- 2.Cunningham-Rundles C, Maglione PJ. Common variable immunodeficiency. J Allergy Clin Immunol 2012;129:1425–6.e3. [DOI] [PubMed] [Google Scholar]
- 3.Cunningham-Rundles C. The many faces of common variable immunodeficiency. Hematology Am Soc Hematol Educ Program 2012;2012:301–5. [DOI] [PMC free article] [PubMed] [Google Scholar]
- 4.Romberg N, Lawrence MG. Birds of a feather: common variable immune deficiencies. Ann Allergy Asthma Immunol 2019;123:461–7. [DOI] [PubMed] [Google Scholar]
- 5.Maglione PJ. Autoimmune and lymphoproliferative complications of common variable immunodeficiency. Curr Allergy Asthma Rep 2016;16:19. [DOI] [PubMed] [Google Scholar]
- 6.Chapel H, Lucas M, Lee M, Bjorkander J, Webster D, Grimbacher B, et al. Common variable immunodeficiency disorders: division into distinct clinical phenotypes. Blood 2008;112:277–86. [DOI] [PubMed] [Google Scholar]
- 7.Resnick ES, Moshier EL, Godbold JH, Cunningham-Rundles C. Morbidity and mortality in common variable immune deficiency over 4 decades. Blood 2012; 119:1650–7. [DOI] [PMC free article] [PubMed] [Google Scholar]
- 8.Cambronero R, Sewell WA, North ME, Webster AD, Farrant J. Up-regulation of IL-12 in monocytes: a fundamental defect in common variable immunodeficiency. J Immunol 2000;164:488–94. [DOI] [PubMed] [Google Scholar]
- 9.Cols M, Rahman A, Maglione PJ, Garcia-Carmona Y, Simchoni N, Ko HM, et al. Expansion of inflammatory innate lymphoid cells in patients with common variable immune deficiency. J Allergy Clin Immunol 2016;137:1206–15.e6. [DOI] [PMC free article] [PubMed] [Google Scholar]
- 10.Cunill V, Clemente A, Lanio N, Barceló C, Andreu V, Pons J, et al. Follicular T cells from smB(−) common variable immunodeficiency patients are skewed toward a Th1 phenotype. Front Immunol 2017;8:174. [DOI] [PMC free article] [PubMed] [Google Scholar]
- 11.Unger S, Seidl M, van Schouwenburg P, Rakhmanov M, Bulashevska A, Frede N, et al. The T(H)1 phenotype of follicular helper T cells indicates an IFN-γ-associated immune dysregulation in patients with CD21low common variable immunodeficiency. J Allergy Clin Immunol 2018;141:730–40. [DOI] [PubMed] [Google Scholar]
- 12.Turpin D, Furudoi A, Parrens M, Blanco P, Viallard JF, Duluc D. Increase of follicular helper T cells skewed toward a Th1 profile in CVID patients with noninfectious clinical complications. Clin Immunol 2018;197:130–8. [DOI] [PubMed] [Google Scholar]
- 13.Maglione PJ, Gyimesi G, Cols M, Radigan L, Ko HM, Weinberger T, et al. BAFF-driven B cell hyperplasia underlies lung disease in common variable immunodeficiency. JCI Insight 2019;4:e122728. [DOI] [PMC free article] [PubMed] [Google Scholar]
- 14.Hultberg J, Ernerudh J, Larsson M, Nilsdotter-Augustinsson Å, Nyström S. Plasma protein profiling reflects T(H)1-driven immune dysregulation in common variable immunodeficiency. J Allergy Clin Immunol 2020;146:417–28. [DOI] [PubMed] [Google Scholar]
- 15.Mannon PJ, Fuss IJ, Dill S, Friend J, Groden C, Hornung R, et al. Excess IL-12 but not IL-23 accompanies the inflammatory bowel disease associated with common variable immunodeficiency. Gastroenterology 2006;131:748–56. [DOI] [PubMed] [Google Scholar]
- 16.Perreau M, Vigano S, Bellanger F, Pellaton C, Buss G, Comte D, et al. Exhaustion of bacteria-specific CD4 T cells and microbial translocation in common variable immunodeficiency disorders. J Exp Med 2014;211:2033–45. [DOI] [PMC free article] [PubMed] [Google Scholar]
- 17.Le Coz C, Bengsch B, Khanna C, Trofa M, Ohtani T, Nolan BE, et al. Common variable immunodeficiency-associated endotoxemia promotes early commitment to the T follicular lineage. J Allergy Clin Immunol 2019;144:1660–73. [DOI] [PMC free article] [PubMed] [Google Scholar]
- 18.Weinberger T, Fuleihan R, Cunningham-Rundles C, Maglione PJ. Factors beyond lack of antibody govern pulmonary complications in primary antibody deficiency. J Clin Immunol 2019;39:440–7. [DOI] [PMC free article] [PubMed] [Google Scholar]
- 19.Swain S, Selmi C, Gershwin ME, Teuber SS. The clinical implications of selective IgA deficiency. J Transl Autoimmun 2019;2:100025. [DOI] [PMC free article] [PubMed] [Google Scholar]
- 20.Brightbill HD, Libraty DH, Krutzik SR, Yang RB, Belisle JT, Bleharski JR, et al. Host defense mechanisms triggered by microbial lipoproteins through toll-like receptors. Science 1999;285:732–6. [DOI] [PubMed] [Google Scholar]
- 21.Adelaja A, Hoffmann A. Signaling crosstalk mechanisms that may fine-tune pathogen-responsive NFκB. Front Immunol 2019;10:433. [DOI] [PMC free article] [PubMed] [Google Scholar]
- 22.Yu JE, Knight AK, Radigan L, Marron TU, Zhang L, Sanchez-Ramón S, et al. Toll-like receptor 7 and 9 defects in common variable immunodeficiency. J Allergy Clin Immunol 2009;124:349–56.e1–3. [DOI] [PMC free article] [PubMed] [Google Scholar]
- 23.Lollo C, de Moraes Vasconcelos D, Oliveira L, Domingues R, Carvalho GC, Duarte A, et al. Chemokine, cytokine and type I interferon production induced by Toll-like receptor activation in common variable immune deficiency. Clin Immunol 2016;169:121–7. [DOI] [PubMed] [Google Scholar]
- 24.Wehr C, Kivioja T, Schmitt C, Ferry B, Witte T, Eren E, et al. The EUROclass trial: defining subgroups in common variable immunodeficiency. Blood 2008; 111:77–85. [DOI] [PubMed] [Google Scholar]
- 25.Maglione PJ, Simchoni N, Black S, Radigan L, Overbey JR, Bagiella E, et al. IRAK-4 and MyD88 deficiencies impair IgM responses against T-independent bacterial antigens. Blood 2014;124:3561–71. [DOI] [PMC free article] [PubMed] [Google Scholar]
- 26.Dobin A, Davis CA, Schlesinger F, Drenkow J, Zaleski C, Jha S, et al. STAR: ultrafast universal RNA-seq aligner. Bioinformatics 2013;29:15–21. [DOI] [PMC free article] [PubMed] [Google Scholar]
- 27.Smith T, Heger A, Sudbery I. UMI-tools: modeling sequencing errors in Unique Molecular Identifiers to improve quantification accuracy. Genome Res 2017;27:491–9. [DOI] [PMC free article] [PubMed] [Google Scholar]
- 28.Anders S, Pyl PT, Huber W. HTSeq–a Python framework to work with high-throughput sequencing data. Bioinformatics 2015;31:166–9. [DOI] [PMC free article] [PubMed] [Google Scholar]
- 29.Love MI, Huber W, Anders S. Moderated estimation of fold change and dispersion for RNA-seq data with DESeq2. Genome Biol 2014;15:550. [DOI] [PMC free article] [PubMed] [Google Scholar]
- 30.Subramanian A, Tamayo P, Mootha VK, Mukherjee S, Ebert BL, Gillette MA, et al. Gene set enrichment analysis: a knowledge-based approach for interpreting genome-wide expression profiles. Proc Natl Acad Sci U S A 2005;102: 15545–50. [DOI] [PMC free article] [PubMed] [Google Scholar]
- 31.Robinson MD, McCarthy DJ, Smyth GK. edgeR: a Bioconductor package for differential expression analysis of digital gene expression data. Bioinformatics 2010; 26:139–40. [DOI] [PMC free article] [PubMed] [Google Scholar]
- 32.McCarthy DJ, Chen Y, Smyth GK. Differential expression analysis of multifactor RNA-Seq experiments with respect to biological variation. Nucleic Acids Res 2012;40:4288–97. [DOI] [PMC free article] [PubMed] [Google Scholar]
- 33.Lun ATL, Richard AC, Marioni JC. Testing for differential abundance in mass cytometry data. Nat Methods 2017;14:707–9. [DOI] [PMC free article] [PubMed] [Google Scholar]
- 34.Maecker HT, McCoy JP, Nussenblatt R. Standardizing immunophenotyping for the Human Immunology Project. Nat Rev Immunol 2012;12:191–200. [DOI] [PMC free article] [PubMed] [Google Scholar]
- 35.Finak G, Langweiler M, Jaimes M, Malek M, Taghiyar J, Korin Y, et al. Standardizing flow cytometry immunophenotyping analysis from the Human ImmunoPhenotyping Consortium. Sci Rep 2016;6:20686. [DOI] [PMC free article] [PubMed] [Google Scholar]
- 36.Bousfiha A, Jeddane L, Picard C, Al-Herz W, Ailal F, Chatila T, et al. Human inborn errors of immunity: 2019 Update of the IUIS Phenotypical Classification. J Clin Immunol 2020;40:66–81. [DOI] [PMC free article] [PubMed] [Google Scholar]
- 37.Marchetti G, Tincati C, Silvestri G. Microbial translocation in the pathogenesis of HIV infection and AIDS. Clin Microbiol Rev 2013;26:2–18. [DOI] [PMC free article] [PubMed] [Google Scholar]
- 38.Barbosa RR, Silva SP, Silva SL, Tendeiro R, Melo AC, Pedro E, et al. Monocyte activation is a feature of common variable immunodeficiency irrespective of plasma lipopolysaccharide levels. Clin Exp Immunol 2012;169:263–72. [DOI] [PMC free article] [PubMed] [Google Scholar]
- 39.Litzman J, Nechvatalova J, Xu J, Ticha O, Vlkova M, Hel Z. Chronic immune activation in common variable immunodeficiency (CVID) is associated with elevated serum levels of soluble CD14 and CD25 but not endotoxaemia. Clin Exp Immunol 2012;170:321–32. [DOI] [PMC free article] [PubMed] [Google Scholar]
- 40.Bunker JJ, Bendelac A. IgA responses to microbiota. Immunity 2018;49:211–24. [DOI] [PMC free article] [PubMed] [Google Scholar]
- 41.Pescarmona R, Belot A, Villard M, Besson L, Lopez J, Mosnier I, et al. Comparison of RT-qPCR and Nanostring in the measurement of blood interferon response for the diagnosis of type I interferonopathies. Cytokine 2019;113: 446–52. [DOI] [PubMed] [Google Scholar]
- 42.Newman AM, Liu CL, Green MR, Gentles AJ, Feng W, Xu Y, et al. Robust enumeration of cell subsets from tissue expression profiles. Nat Methods 2015; 12:453–7. [DOI] [PMC free article] [PubMed] [Google Scholar]
- 43.Mahnke YD, Brodie TM, Sallusto F, Roederer M, Lugli E. The who’s who of T-cell differentiation: human memory T-cell subsets. Eur J Immunol 2013;43: 2797–809. [DOI] [PubMed] [Google Scholar]
- 44.Martinez-Pomar N, Raga S, Ferrer J, Pons J, Munoz-Saa I, Julia MR, et al. Elevated serum interleukin (IL)-12p40 levels in common variable immunodeficiency disease and decreased peripheral blood dendritic cells: analysis of IL-12p40 and interferon-gamma gene. Clin Exp Immunol 2006;144: 233–8. [DOI] [PMC free article] [PubMed] [Google Scholar]
- 45.Liu M, Guo S, Hibbert JM, Jain V, Singh N, Wilson NO, et al. CXCL10/IP-10 in infectious diseases pathogenesis and potential therapeutic implications. Cytokine Growth Factor Rev 2011;22:121–30. [DOI] [PMC free article] [PubMed] [Google Scholar]
- 46.Miller SI, Ernst RK, Bader MW. LPS, TLR4 and infectious disease diversity. Nat Rev Microbiol 2005;3:36–46. [DOI] [PubMed] [Google Scholar]
- 47.Siedlar M, Strach M, Bukowska-Strakova K, Lenart M, Szaflarska A, Węglarczyk K, et al. Preparations of intravenous immunoglobulins diminish the number and proinflammatory response of CD14+CD16++ monocytes in common variable immunodeficiency (CVID) patients. Clin Immunol 2011; 139:122–32. [DOI] [PubMed] [Google Scholar]
- 48.Matson EM, Abyazi ΜL, Bell KA, Hayes KM, Maglione PJ. B cell dysregulation in common variable immunodeficiency interstitial lung disease. Front Immunol 2020;11:622114. [DOI] [PMC free article] [PubMed] [Google Scholar]


