

Abstract
Data suggest that renal denervation (RDN) in treatment‐resistant hypertension (TRHT) is safe in terms of renal function. However, most studies report kidney function as creatinine‐based estimated glomerular filtration rate (eGFR), which may be biased by non‐renal factors. Damage markers other than albuminuria have never been evaluated after RDN. In this non‐randomized RDN trial, we studied changes in kidney function, assessed as measured GFR (mGFR) and various GFR estimates, six months and two years after RDN. We also examined changes in albuminuria and a biomarker of tubular dysfunction. Adult non‐diabetic patients with TRHT and eGFR ≥45 ml/min/1.73 m2 were recruited from hypertension clinics. Before bilateral RDN, mGFR was measured by iohexol clearance. We estimated eGFR from serum creatinine and cystatin C (eGFRcrea, eGFRcys, and eGFRcreacys), and albumin‐creatinine ratio (ACR) and N‐acetyl‐β‐D‐glucosaminidase (NAG)‐creatinine ratio (NAG‐CR) were measured in spot urines. All measurements were repeated after six and twenty‐four months.
Twenty patients, mean age 54 (±9) years and baseline mGFR 83 (±20) ml/min/1.73 m2 underwent RDN. After six months, mGFR fell, eGFRcrea remained unchanged, whereas eGFRcys and eGFRcreacys increased. At 2 years’ follow‐up, eGFRcreacys was significantly lower than at baseline. mGFR was 78 (±28) ml/min/1.73 m2. Change in ambulatory systolic BP predicted change in eGFRcrea. Urinary NAG‐CR, but not ACR, increased during follow‐up.
Different GFR assessments gave diverging results after RDN. Therefore, care should be taken to method when evaluating kidney function after RDN. Increases in a tubular dysfunction biomarker suggest that kidney damage may occur. Long‐term renal follow‐up is needed after RDN.
Keywords: glomerular filtration rate, renal denervation, urinary biomarkers
1. INTRODUCTION
According to the World Health Organization, hypertension (HT) is the largest single contributor to overall morbidity and mortality. 1 HT affects approximately 40% of the adult population and is the most important modifiable risk factor for cardiovascular disease (CVD), chronic kidney disease (CKD), and dementia. 1 , 2 Treatment‐resistant hypertension (TRHT) is defined as blood pressure (BP) levels remaining above the treatment goal despite the use of three antihypertensive drugs, including a diuretic, at optimal doses, and with confirmed adherence. 3 The prevalence of TRHT is believed to be about 10% of treated hypertensive patients, and TRHT infers higher risk of CKD and premature CVD compared to controlled HT. 4
TRHT is associated with increased sympathetic nervous system activity, 5 especially in patients with obesity and the metabolic syndrome. 6 The kidney is one of the main targets of increased sympathetic activity, with both afferent and efferent renal sympathetic nerve fiber traffic being involved in the generation of systemic vasoconstriction and sodium retention, resulting in HT and not infrequently TRHT. 7 These mechanisms constitute the rationale for renal sympathetic denervation (RDN) as a treatment mode for TRHT. 8 The first blinded, sham‐controlled randomized controlled trial of RDN showed no significant benefit on 24‐hour ambulatory systolic BP (SYMPLICITY HTN‐3), 9 and consequentially, the enthusiasm for this interventional procedure fell abruptly. However, recent renewed interest has risen for various invasive techniques, including RDN with new devices and new procedures, to modulate sympathetic nervous system activity in patients with TRHT. 5 , 10 , 11 , 12
Intensive BP lowering has been demonstrated to slow the rate of disease progression in patients with CKD, 13 possibly also implying that BP lowering may prevent the development of CKD in the first place. 3 However, all procedures directly affecting the renal arteries confer some risk of direct damage, 14 , 15 , 16 potentially leading to reduced kidney function or increased levels of renal damage biomarkers in the short or long term. Moreover, hemodynamic changes due to rapid BP lowering may result in a temporary decrease in the glomerular filtration rate (GFR). So far, studies have not revealed an accelerated kidney function decline rate after RDN, 16 , 17 , 18 , 19 and urinary albumin excretion (UAE) has been demonstrated to improve. 20 , 21 , 22 However, most studies have reported kidney function as estimated GFR (eGFR) calculated from serum creatinine, cystatin C, or both, 23 which may be biased by non‐GFR factors such as body composition and inflammation. 24 This bias may be avoided using GFR measured by gold‐standard methods, for example, iohexol clearance (mGFR). 24 We are aware of only one study using mGFR to assess kidney function in an RDN setting. 25 Changes in urinary biomarkers reflecting renal tubular dysfunction have to our knowledge never been studied in TRHT patients treated with RDN.
In the present non‐randomized study of patients with TRHT, we assessed various markers of kidney dysfunction, including mGFR, eGFR, UAE, and N‐acetyl‐β‐D‐glucosaminidase (NAG), a urinary biomarker of proximal tubular dysfunction, before RDN and six months and two years after the treatment. We hypothesized a gradual improvement in all variables.
2. MATERIALS AND METHODS
2.1. Study population
The study design has been published in detail previously. 26 In short, patients aged 18 to 68 years with TRHT were recruited from HT specialist clinics in Norway. TRHT was defined as office systolic BP > 140 mm Hg despite regular intake of maximally tolerated doses of at least four antihypertensive drugs, including a diuretic. No changes in medication were allowed the last two weeks before enrollment. In addition, daytime systolic BP > 135 mm Hg by ambulatory BP monitoring (ABPM), after investigator‐witnessed intake of prescribed antihypertensive drugs from original packaging, was required for inclusion. Patients with eGFR ≤ 45 ml/min/1.73 m2 were excluded. The study was originally designed to assess changes in glucose metabolism assessed by gold‐standard method, that is, a hyperinsulinaemic‐euglycaemic clamp with glucose tracer and labeled glucose infusion, and therefore, patients with diabetes at baseline were excluded. The protocol has the following ClinicalTrials.gov identifier: NCT01630928. The study was conducted in accordance with the protocol, as well as with applicable regulatory requirements and the ethical principles of the Declaration of Helsinki. All included patients gave their written, informed consent, and The Regional Committee for Medical and Health Research Ethics and the Data Protection Officer at University Hospital of North Norway gave their approval (2011/1296/REK Nord).
2.2. Procedures
A detailed description of the procedures has been published. 26 Baseline data were collected between March 2013 and February 2014. Procedures were repeated by the same research team, using identical procedures, at six months and two years after RDN.
After investigator‐witnessed pill intake, patients were under observation by the nurse until a 24‐hours ambulatory BP measurement device (Schiller BR‐102 plus; SCHILLER‐Reomed AG, Dietikon, Switzerland) had been connected and tested. BP readings were taken every 20 min during daytime (0700 hours to 2200 hours), and every 30 min during nighttime (2200 hours to 0700 hours).
With the patient in a seated position, and after 5 minutes’ rest, office BP was measured at one‐minute intervals with an automatic oscillometric device (Casmed 740; Infiniti Medical, Menlo Park, CA, USA). At baseline, BP was measured on both arms, and the arm with the higher BP was used for all subsequent readings. We used the mean of the second and third readings in the analyses. Controlled BP at follow‐up was defined as office systolic BP < 140 mm Hg and diastolic BP < 90 mm Hg.
Within four weeks after the baseline measurements, bilateral RDN was performed using the SymplicityTM Catheter System (Medtronic, Mountain View, CA, USA) by one experienced interventional cardiologist trained for the procedure (TKS). 26 , 27 On average, each patient had 12 ablations of 2‐minute duration carried out, and the minimum number of complete ablations per side was ≥ 4, as recommended. Patients were hospitalized overnight and followed with self‐administered BP measurements at home according to written instructions.
2.3. Measurements
Fasting blood samples were drawn at each visit. Serum creatinine was measured with enzymatic method that has been standardized against isotope dilution mass spectroscopy (CREA Plus, Roche Diagnostics, GmbH, Mannheim, Germany), and we calculated the eGFR based on creatinine (eGFRcrea) using the Chronic Kidney Disease Epidemiology Collaboration (CKD‐EPI) Equation 28 Cystatin C was measured with standardized particle enhanced turbidimetric immunoassay from Gentian (Moss, Norway) at baseline and after six months, whereas a corresponding assay from Roche (Basel, Switzerland) was used at the same Cobas 8000‐system at the 2 years’ follow‐up. Both methods were traceable to certified reference material, and agreement between the methods was good. Cystatin C based eGFR (eGFRcys), and eGFR calculated using a combination of creatinine and cystatin C (eGFRcreacys), were calculated according to the respective CKD‐EPI Equation 23
On a separate day, iohexol clearance was measured as previously described. 24 After an overnight fast, but with instructions not to restrict water intake, the patients had five milliliters of iohexol (Omnipaque 300 mg I/ml) administered through a peripheral venous catheter placed in an antecubital vein. The syringe was weighed before and after administration, and the catheter was flushed with 30 ml of isotonic saline. The blood sample for iohexol concentration measurement was drawn through the same catheter. After injection of iohexol, the participants were given a light breakfast. The optimal time for sampling was calculated by Jacobsson's method, using creatinine‐based eGFR. 29 The exact time in minutes from injection to sampling was measured with a separate stopwatch for each person. Serum iohexol concentration was measured by HPLC, as described. 30 mGFR was calculated using the equation described by Jacobsson 29 and normalized to the surface area 1.73 m2. 31
At baseline and after six months, each participant delivered two separate morning urine samples, whereas only one morning urine specimen was requested at the visit two years after RDN. Albumin and creatinine concentrations were analyzed in fresh urine samples. A sample from each specimen was frozen and stored at −20°C until 2016, when all samples were analyzed for the tubular damage biomarker NAG. Urine albumin‐creatinine ratio (ACR; in mg/mmol) and NAG‐creatinine ratio (NAG‐CR; in IU/g) were calculated for all specimens.
The study nurses measured height and weight, and body mass index (BMI) was calculated. Information about lifestyle was assessed by a self‐administered questionnaire. Medical history was taken by one of the study physicians (AM, JVN).
2.4. Statistical analyses
Data are given as mean (±SD), median (interquartile range [IQR]), or number (percentage) as appropriate. Within‐subject changes in normally distributed continuous variables from baseline to follow‐up after six months and two years were checked with one‐way repeated‐measures ANOVA. The p‐value for within‐subject simple contrasts between baseline and 2 years’ follow‐up was assessed. To evaluate predictors of 2‐year change in kidney function by various methods of measurement, as well as 2‐year change in the urinary biomarkers, we used multivariable linear regression models. Independent variables were baseline age, simultaneous change in ambulatory systolic BP, baseline urinary ACR and/or NAG‐CR, and baseline kidney function and/or urinary biomarker assessed in the same way as the dependent variable in the same model. Related samples Friedman's two‐way analysis of variance by ranks with Bonferroni correction for multiple tests were done to test for change over time in urinary ACR and NAG‐CR, which were not normally distributed. A two‐sided p‐value of < .05 was considered statistically significant. Analyses were done using IBM SPSS Statistics software version 24 and 25 (IBM Corporation, Armonk, New York).
3. RESULTS
3.1. Cohort characteristics
Within four weeks after a baseline visit, bilateral RDN was accomplished in 23 patients (4 women, 19 men; mean (SD) age 54 (±9) years), with no periprocedural complications, as described. 26 All patients underwent the 6 months’ follow‐up visit, whereas one woman and two men did not attend the final visit after two years. Patient characteristics at baseline and after six months and two years for the 20 patients who completed the study are displayed in Table 1. Two patients reported current smoking, and seven were previous smokers. Mean BMI was in the obesity range. From baseline to the 2 years’ follow‐up, visit, mean ambulatory diastolic BP fell significantly, the corresponding systolic BP showed an insignificant trend toward a decrease, and the median number of BP‐lowering drugs decreased slightly. However, a rising trend in all BP measurements was observed between the visits at 6 months and 2 years. Controlled BP was observed in eight patients at the 6 months’ and only two patients at the 2 years’ follow‐up. At least one renin‐angiotensin‐aldosterone system inhibitor (RAASi) was prescribed to all participants at all visits, apart from one participant, who had discontinued this drug before the 2 years’ follow‐up.
TABLE 1.
Characteristics at baseline and follow‐up (n = 20). The ReShape CV‐Risk Study
| Baseline | 6 months' follow‐up | 2 years' follow‐up | P for within‐subject contrasts between baseline and 2 years | P for repeated measures | ||||
|---|---|---|---|---|---|---|---|---|
| Female sex, n (%) | 3 | (15) | ||||||
| Age, years | 54 | (±9) | ||||||
| Body mass index, kg/m2 | 31.9 | (±4.8) | 32.0 | (±5.1) | 32.0 | (±5.1) | .08 | .07 |
| Glycosylated hemoglobin, % | 5.6 | (±0.3) | 5.6 | (±0.3) | 5.6 | (±0.4) | .7 | .3 |
| Total cholesterol, mmol/l | 5.1 | (±1.2) | 5.0 | (±0.9) | 5.0 | (±1.0) | .8 | .9 |
| LDL cholesterol, mmol/l | 3.6 | (±1.1) | 3.4 | (±1.0) | 3.4 | (±1.0) | .1 | .2 |
| Office SBP, mm Hg | 164 | (±21) | 139 | (±19) | 151 | (±18) | .1 | .006 |
| Office DBP, mm Hg | 108 | (±20) | 89 | (±13) | 97 | (±13) | .06 | .005 |
| Mean ambulatory SBP, mm Hg | 156 | (±21) | 145 | (±14) | 147 | (±14) | .09 | .06 |
| Mean ambulatory DBP, mm Hg | 97 | (±14) | 89 | (±11) | 90 | (±11) | .04 | .007 |
| No. of BP lowering drugs | 4.5 | (4‐8) | 4.0 | (2‐6) | 4.0 | (0‐7) | .07 | .07 |
| Type of BP lowering drug, n (%) | ||||||||
| Calcium channel blocker | 17 | (85) | 17 | (85) | 17 | (85) | ||
| ACE inhibitor or ARB | 20 | (100) | 20 | (100) | 19 | (95) | ||
| Thiazide diuretic | 8 | (40) | 8 | (40) | 8 | (40) | ||
| Loop diuretc | 14 | (70) | 13 | (65) | 11 | (55) | ||
| Beta blocker | 15 | (75) | 15 | (75) | 15 | (75) | ||
| Mineralcorticoid receptor blocker | 10 | (50) | 6 | (30) | 8 | (40) | ||
| Other | 10 | (50) | 7 | (35) | 8 | (40) | ||
Data are mean (±SD), apart from No. of BP lowering drugs, which are median (min‐max).
Abbreviations: ACE, angiotensin converting enzyme; ARB, angiotensin II receptor blocker; DBP, diastolic blood pressure; LDL, low density lipoprotein; SBP, systolic blood pressure.
3.2. Measurements of kidney function
Creatinine values were stable, whereas cystatin C increased significantly from baseline to the 2 years’ follow‐up visit (Table 2). At baseline, kidney function assessment with mGFR and eGFRcrea gave similar values, whereas the mean estimate based on cystatin C numerically was lower. However, after six months mGFR tended to decrease (P =.07), whereas both GFR estimates that included cystatin C increased significantly (P =.03 for both). eGFRcrea remained practically unchanged (P =.28). After two years, only eGFRcrecys was significantly different from the baseline value (80.1 (±19.7) ml/min/1.73 m2 vs. 76.4 ± 21.5 ml/min/1.73 m2; P =.04), whereas the other GFR measures were non‐significantly lower than their baseline value (Table 2 and Figure 1). One‐way repeated‐measures ANOVA revealed overall significant changes in all estimates of GFR, but not mGFR (Table 2).
TABLE 2.
Measurements of kidney function at baseline and follow‐up (n = 20). The ReShape CV‐Risk Study
| Baseline | 6 months' follow‐up | 2 years' follow‐up | P for within‐subject contrasts between baseline and 2 years | P for repeated measures | ||||
|---|---|---|---|---|---|---|---|---|
| Creatinine, µmol/L | 90.1 | (±23.6) | 85.0 | (±23.5) | 91.3 | (±26.1) | .62 | .025 |
| Cystatin C, mg/L | 01.jun | (±0.23) | 1.00 | (±0.25) | 01.des | (±0.24) | .04 | <.001 |
| Measured GFR, ml/min/1.73 m2 | 83.0 | (±20.1) | 75.6 | (±21.6) | 78.2 | (±27.6) | .38 | .24 |
| Estimated GFRcrea, ml/min/1.73 m2 | 84.4 | (±19.1) | 86.7 | (±20.2) | 81.2 | (±21.9) | .09 | .026 |
| Estimated GFRcys, ml/min/1.73 m2 | 76.4 | (±21.5) | 83.1 | (±22.7) | 71.9 | (±20.3) | .09 | <.001 |
| Estimated GFRcreacys, ml/min/1.73 m2 | 80.1 | (±20.0) | 85.5 | (±22.0) | 76.4 | (±21.2) | .04 | <.001 |
Data are mean (±SD). GFR: Glomerular filtration rate. Estimated GFRcrea, GFRcys and GFRcreacys refer to GFR estimates calculated with the CKD‐EPI equations based on creatinine, cystatin C and creatinine + cystatin C, respectively.
FIGURE 1.

Mean glomerular filtration rate (GFR) by exact measurement (mGFR) and three different estimates (eGFRcre, eGFRcys, and eGFRcrecys) at baseline, and at six months and two years after renal denervation
3.3. Predictors of change in kidney function
In multivariable linear regression models, we examined predictors of change in measured and estimated GFR; the results are given in Table 3. We found that higher baseline age predicted a larger decrease in mGFR, whereas age was not associated with change in creatinine or cystatin C based eGFR. However, change in ambulatory systolic BP was positively associated with a change in eGFRcrea. Higher urinary ACR was a borderline significant predictor of eGFR decrease in estimates based on cystatin C only. NAG‐CR did not significantly predict GFR change, neither in models where NAG‐CR was the only urinary biomarker (Table 3), nor in models which also included ACR (data not shown).
TABLE 3.
Multivariable linear regression models for change in kidney function by various methods of measurement (n = 20). The ReShape CV‐Risk Study
| Dependent variable | ||||||||
|---|---|---|---|---|---|---|---|---|
| Change in measured GFR | Change in estimated GFRcrea | Change in estimated GFRcys | Change in estimated GFRcreacys | |||||
| Independent variables in the multivariable model | Standardized regression coefficient | P value | Standardized regression coefficient | P value | Standardized regression coefficient | P value | Standardized regression coefficient | P value |
| Baseline age, per year | −0.57 | .029 | 0.25 | .28 | −0.03 | .89 | 0.17 | .50 |
| Change in ambulatory systolic BP, per mm Hg | 0.26 | .30 | 0.61 | .011 | 0.40 | .11 | 0.50 | .051 |
| Baseline GFR (same method), per ml/min/1.73 m2 | −0.32 | .26 | 0.09 | .73 | −0.64 | .026 | −0.30 | .29 |
| Baseline urinary albumin‐creatinine ratio, per mg/mmol | −0.22 | .42 | −0.21 | .40 | −0.48 | .055 | −0.50 | .060 |
| Baseline urinary NAG‐creatinine ratio, per U/g | −0.36 | .14 | −0.21 | .37 | −0.26 | .34 | −0.27 | .33 |
Abbreviations: BP, Blood pressure; GFR, Glomerular filtration rate; NAG, N‐acetyl‐β‐D‐glucosaminidase.
Estimated GFRcrea, GFRcys,and GFRcreacys refer to GFR estimates calculated with the CKD‐EPI equations based on creatinine, cystatin C and creatinine + cystatin C, respectively.
3.4. Urinary biomarkers of kidney damage
During the first six months after RDN, median (IQR) urinary ACR decreased slightly, but not significantly (from 0.73 (0.11–4.15) mg/mmol to 0.64 (0.02–1.48) mg/mmol; P =.3). The ACR value had increased significantly at the 2 years’ follow‐up, when median (IQR) was 2.40 (0.48–5.56) mg/mmol (P =.014 for difference between six months and two years). However, when comparing the baseline ACR with the value after two years, no significant change was found (P =.7) (Figure 2).
FIGURE 2.
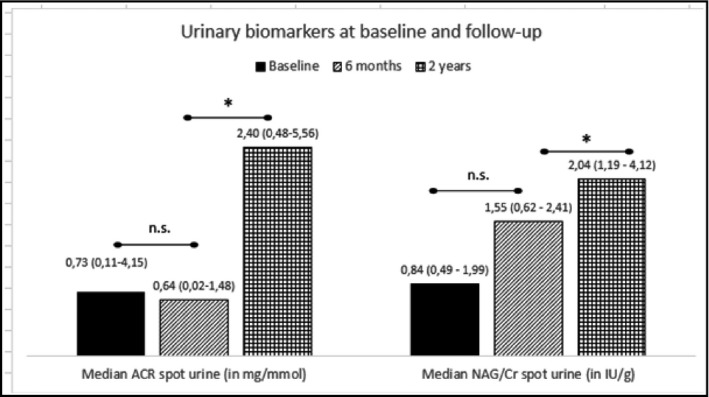
Two urinary biomarkers, albumin‐creatinine ratio (ACR) and N‐acetyl‐β‐D‐glucosaminidase (NAG)‐creatinine ratio (NAG‐CR), at baseline, and at six months and two years after renal denervation. Values are displayed as median and interquartile range, and significant differences (P <.05) indicated by*
NAG‐CR, a biomarker of tubular dysfunction and damage, increased from baseline (0.84 (0.49–1.99) IU/g) to the 2 years’ follow‐up (2.04 (1.19–4.12) IU/g). At 6 months’ follow‐up, the median (IQR) value was (1.55 (0.62–2.41) IU/g). A non‐parametric repeated‐measures test with Bonferroni correction for multiple comparisons yielded a significant overall change with a P‐value of .047, whereas pairwise comparisons only showed a significant change between six months and two years (P =.049) (Figure 2).
In multivariable linear regression models similar to those used for 2‐year change in GFR, we could not identify any significant predictor for 2‐year change in ACR or NAG‐CR.
4. DISCUSSION
In a non‐randomized study involving 20 non‐diabetic patients with TRHT, undergoing bilateral RDN, we studied changes in kidney function over two years assessed by different methods. We found a discrepancy in the trajectories of measured and various estimates of GFR after RDN, especially after six months, with the mean values shifting into opposite directions. Also, whereas mGFR and creatinine‐based estimates of GFR were stable, eGFR based upon the combination of creatinine and cystatin C decreased significantly over the 2‐year observational period. Predictors of GFR change varied with the method used for GFR assessment. Moreover, we found that whereas albuminuria measured as morning spot urine ACR was relatively unchanged, a biomarker of tubular dysfunction, NAG‐CR, increased to a statistically significantly higher value after two years of follow‐up.
Previously published studies in humans have concluded that RDN is generally safe in terms of kidney structure and function assessed as eGFR, both in the short and long term. 12 , 16 , 19 , 32 However, our study on patients with TRHT and relatively well‐preserved kidney function at baseline suggests that a clinically significant GFR decline may occur. This is in line with the results of a recently published Swiss study, where an even more pronounced mGFR decline was found one year after RDN in 13 patients with age and BMI comparable to those of the present study, but with slightly lower baseline mGFR. 25 In general middle‐aged populations, mean annual GFR decline is typically around 1 ml/min/1.73 m2, 33 whereas our study and the Swiss study denote a 2.5 and 12 times more rapid decline rate, respectively, in patients with TRHT undergoing RDN. Whether GFR change rate after RDN is associated with baseline GFR may be a clinically relevant question that remains to be answered in controlled studies.
In the so far largest meta‐analysis studying kidney function after RDN, including 2550 patients from 56 cohorts, with a mean follow‐up of 9 months, a funnel plot of eGFR change after RDN showed a significant asymmetry. In a few small studies, eGFR fell significantly; the opposite was found in a comparable number of studies, whereas kidney function displayed no significant change in the majority of studies. 32 Although the conclusion that RDN generally does not infer damage to the kidney function is the most important result of this meta‐analysis, the asymmetry may serve as a reminder that kidney function should be evaluated carefully in each clinical setting. Most patients treated with RDN have had TRHT for years, and other risk factors such as obesity and the metabolic syndrome, as well as early end‐organ damage, are prevalent. Therefore, their age‐related GFR decline rate is expected to be elevated compared to normotensive persons. 34 , 35 Their autoregulation is often blunted, and these patients are vulnerable to changes in GFR related to alteration in BP and antihypertensive medication. This should all be taken into account when evaluating GFR change after RDN and similar invasive procedures, both in research and in clinical settings. The present study adds further knowledge to this obstacle by showing that different measurements to evaluate GFR, taken at the same time point, may show diverging result, supporting the need for repeated measurements and careful evaluation of the situation before a conclusion can be made.
Several articles including a recent meta‐analysis have reported a significant or near‐significant increase in serum cystatin C levels the first year after RDN, 32 , 36 , 37 in spite of stable creatinine values and eGFRcrea. Cystatin C is less influenced by non‐renal factors than creatinine, and eGFRcys is suggested to serve as a confirmatory test when eGFRcre is presumed to deviate from true GFR due to abnormally high or low muscle mass. 38 However, although cystatin C is not affected by muscle mass, levels are increased with inflammation, glucocorticoid use, hyperthyroidism, and obesity. 24 , 38 Possibly, cystatin C may reflect chronic inflammation in TRHT patients, who, similar to the participants of the present study, frequently are overweight or obese.
GFR measured with iohexol clearance or other gold‐standard methods are cumbersome and not feasible in regular clinical practice. However, since the reason for the apparent discrepant GFR estimates found in our study is unknown, and since long‐term renal consequences of RDN have not been studied using gold‐standard methods, larger randomized controlled studies of RDN applying mGFR as well as various eGFR equations over time should be accomplished. Thus, clinicians may be advised how to interpret various eGFR values over the time course after RDN.
We tested potential predictors for change in GFR measured by the various methods. High age was associated with decrease in mGFR, but not eGFR, whereas change in systolic BP was positively associated with change in eGFRcrea. These results should be interpreted with caution, particularly due to the small number of individuals in our study. That baseline eGFRcys predicted decrease in the same variable may suggest that our findings to some extent have been influenced by regression toward the mean.
Several studies have shown a decrease in albuminuria after RDN, 20 , 32 , 39 probably mainly related to a fall in BP and an attenuated renin‐angiotensin‐aldosterone system (RAAS) activity secondary to blunted sympathetic nerve system activity. Possibly related to diabetes being an exclusion criterion in our study, median baseline ACR was low. Also, all participants were treated with a RAASi, which effectively lowers urinary albumin excretion. Numerically, median ACR was higher after two years, but the difference from baseline was not significant, and the value was still below the lower limit for the albuminuria range previously classified as microalbuminuria. A concurrent trend toward a slightly higher BP was also observed, making the cause and effect of these minor changes difficult to interpret. However, the slight, but statistically significant increase in NAG‐CR, a biomarker of tubular damage, is of interest. We have previously published that NAG‐CR was an independent predictor of myocardial infarction in the general population, 40 but so far, data confirming an independent association between NAG‐CR and kidney function decline are lacking. 41 Tubular biomarkers have, to our knowledge, never previously been studied in RDN treated patients. Renal tubular cells have obvious important functions in BP regulation, as they execute renal salt handling and are essential in tubuloglomerular feedback loops. Thus, the close interplay between the sympathetic nerve system and the RAAS also involves tubular cell functions. Similar to our study, an increase in NAG excretion was found six months after RDN in a sham‐controlled experimental study in dogs. 42 Also, less tubular damage, but more interstitial edema in inflammatory infiltrate, was seen in renal biopsies in RDN treated dogs compared to the sham‐treated animals, suggesting that long‐term renal effects of RDN should be studied further. In this regard, urinary tubular biomarkers may be of interest. In a large cohort of patients with hypertension and CKD, different markers of tubular cell health independently predicted cardiovascular outcome. 43 In the present study, the lack of control group prevented us from comparing increases in NAG‐CR due to disease to changes inferred by the treatment method.
The small study size and lack of control group are obvious limitations that apply to our study. However, the careful selection of patients and stringent criteria to enter the study, including the investigator‐observed drug intake and use of 24‐hour ambulatory BP measurements, as well as gold‐standard measurements of GFR, are important strengths.
In summary, in a small study of patients treated for true TRHT by complete bilateral RDN, we found that various measurements and estimates of GFR after six months and two years showed diverging results, suggesting that evaluation of kidney function after this procedure should be done with care. Our findings denote that a clinically significant GFR decline after RDN cannot be precluded, and future studies applying gold‐standard GFR measurements in RDN patients and controls are needed. Moreover, the finding of significantly increasing values of urinary NAG‐CR, a biomarker of renal tubular function, suggests that long‐term follow‐up of kidney function should be done, to investigate whether early structural damage eventually may have clinical consequences.
CONFLICT OF INTEREST
The authors has no conflicts of interest to declare.
AUTHOR CONTRIBUTIONS
TKS was the project manager and performed the denervation procedures. MDS, AM, JVN, and TKS participated in data collection. BOE was responsible for the iohexol clearance measurements and calculated the mGFR values. MDS performed the statistical analyses and drafted the manuscript. All authors participated in critical revision of the manuscript and also read and approved the final version.
ACKNOWLEDGEMENTS
Laboratory services were provided by the Division of Diagnostic Services at the University Hospital of North Norway. Nurses at the Dialysis department, University Hospital of North Norway, administered the iohexol clearance measurements. All participating patients and study staff are warmly thanked.
Solbu MD, Miroslawska A, Norvik JV, Eriksen BO, Steigen TK. Kidney function and markers of renal damage after renal denervation. Does method of measurement matter? The Reshape CV‐Risk Study. J Clin Hypertens. 2021;23:954–962. 10.1111/jch.14214
Funding information
All authors are funded by Governmental Non‐Profit Organizations in Norway, including The North Norwegian Regional Health Authorities, the University Hospital of North Norway and UiT The Arctic University of Norway. We also received an unrestricted grant from the Medtronic Company.
REFERENCES
- 1. Collaborators GBDRF, Forouzanfar MH, Alexander L, et al. Global, regional, and national comparative risk assessment of 79 behavioural, environmental and occupational, and metabolic risks or clusters of risks in 188 countries, 1990–2013: A systematic analysis for the global burden of disease study. Lancet. 2015;386:2287‐2323. [DOI] [PMC free article] [PubMed] [Google Scholar]
- 2. Mancia G, Fagard R, Narkiewicz K, et al. 2013 esh/esc guidelines for the management of arterial hypertension: The task force for the management of arterial hypertension of the European Society of Hypertension (esh) and of the European Society of Cardiology (esc). Eur Heart J. 2013;34:2159‐2219. [DOI] [PubMed] [Google Scholar]
- 3. Williams B, Mancia G, Spiering W, et al. Group ESCSD: 2018 esc/esh guidelines for the management of arterial hypertension. Eur Heart J. 2018;39:3021‐3104. [DOI] [PubMed] [Google Scholar]
- 4. Daugherty SL, Powers JD, Magid DJ, et al. Incidence and prognosis of resistant hypertension in hypertensive patients. Circulation. 2012;125:1635‐1642. [DOI] [PMC free article] [PubMed] [Google Scholar]
- 5. Voora R, Hinderliter AL. Modulation of sympathetic overactivity to treat resistant hypertension. Curr Hypertens Rep. 2018;20:92. [DOI] [PubMed] [Google Scholar]
- 6. Grassi G, Mark A, Esler M. The sympathetic nervous system alterations in human hypertension. Circ Res. 2015;116:976‐990. [DOI] [PMC free article] [PubMed] [Google Scholar]
- 7. Morganti A, Mancia G. Resistant hypertension: Renal denervation or intensified medical treatment? Eur J Intern Med. 2018;50:6‐11. [DOI] [PubMed] [Google Scholar]
- 8. Esler M. Renal denervation for treatment of drug‐resistant hypertension. Trends Cardiovasc Med. 2015;25:107‐115. [DOI] [PubMed] [Google Scholar]
- 9. Bhatt DL, Kandzari DE, O'Neill WW, et al. A controlled trial of renal denervation for resistant hypertension. N Engl J Med. 2014;370:1393‐1401. [DOI] [PubMed] [Google Scholar]
- 10. Papademetriou V, Stavropoulos K, Doumas M, Tsioufis K. Now that renal denervation works, how do we proceed? Circ Res. 2019;124:693‐695. [DOI] [PubMed] [Google Scholar]
- 11. Kandzari DE, Böhm M, Mahfoud F, et al. Effect of renal denervation on blood pressure in the presence of antihypertensive drugs: 6‐month efficacy and safety results from the spyral htn‐on med proof‐of‐concept randomised trial. The Lancet. 2018;391:2346‐2355. [DOI] [PubMed] [Google Scholar]
- 12. Stavropoulos K, Patoulias D, Imprialos K, et al. Efficacy and safety of renal denervation for the management of arterial hypertension: A systematic review and meta‐analysis of randomized, sham‐controlled, catheter‐based trials. J Clin Hypertens. 2020;22:572‐584. [DOI] [PMC free article] [PubMed] [Google Scholar]
- 13. Lv J, Ehteshami P, Sarnak MJ, et al. Effects of intensive blood pressure lowering on the progression of chronic kidney disease: A systematic review and meta‐analysis. CMAJ. 2013;185:949‐957. [DOI] [PMC free article] [PubMed] [Google Scholar]
- 14. Templin C, Jaguszewski M, Ghadri JR, et al. Vascular lesions induced by renal nerve ablation as assessed by optical coherence tomography: Pre‐ and post‐procedural comparison with the Simplicity® catheter system and the Enlightn™ multi‐electrode renal denervation catheter. Eur Heart J. 2013;34:2141‐2148. [DOI] [PMC free article] [PubMed] [Google Scholar]
- 15. Roleder T, Skowerski M, Wiecek A, et al. Long‐term follow‐up of renal arteries after radio‐frequency catheter‐based denervation using optical coherence tomography and angiography. Int J Cardiovasc Imaging. 2016;32:855‐862. [DOI] [PubMed] [Google Scholar]
- 16. Sanders MF, van Doormaal PJ, Beeftink MMA, et al. On behalf of the European Network CroRDC: Renal artery and parenchymal changes after renal denervation: Assessment by magnetic resonance angiography. Eur Radiol. 2017;27:3934‐3941. [DOI] [PMC free article] [PubMed] [Google Scholar]
- 17. Volz S, Spaak J, Elf J, et al. Renal sympathetic denervation in sweden: A report from the swedish registry for renal denervation. J Hypertens. 2018;36:151‐158. [DOI] [PubMed] [Google Scholar]
- 18. Worthley SG, Wilkins GT, Webster MW, et al. Safety and performance of the second generation enlightn™ renal denervation system in patients with drug‐resistant, uncontrolled hypertension. Atherosclerosis. 2017;262:94‐100. [DOI] [PubMed] [Google Scholar]
- 19. Mahfoud F, Böhm M, Schmieder R, et al. Effects of renal denervation on kidney function and long‐term outcomes: 3‐year follow‐up from the global symplicity registry. Eur Heart J. 2019;40:3474‐3482. [DOI] [PMC free article] [PubMed] [Google Scholar]
- 20. Ott C, Mahfoud F, Schmid A, et al. Improvement of albuminuria after renal denervation. Int J Cardiol. 2014;173:311‐315. [DOI] [PubMed] [Google Scholar]
- 21. Oliveras A, Armario P, Sans L, et al. Organ damage changes in patients with resistant hypertension randomized to renal denervation or spironolactone: The denervhta (denervación en hipertensión arterial) study. J Clin Hypertens. 2018;20:69‐75. [DOI] [PMC free article] [PubMed] [Google Scholar]
- 22. Sousa H, Branco P, de Sousa AM, et al. Changes in albumin‐to‐creatinine ratio at 12‐month follow‐up in patients undergoing renal denervation. Rev Port Cardiol. 2017;36:343‐351. [DOI] [PubMed] [Google Scholar]
- 23. Inker LA, Schmid CH, Tighiouart H, et al. Estimating glomerular filtration rate from serum creatinine and cystatin c. N Engl J Med. 2012;367:20‐29. [DOI] [PMC free article] [PubMed] [Google Scholar]
- 24. Mathisen UD, Melsom T, Ingebretsen OC, et al. Estimated GFR associates with cardiovascular risk factors independently of measured GFR. J Am Soc Nephrol. 2011;22:927‐937. [DOI] [PMC free article] [PubMed] [Google Scholar]
- 25. Vuignier Y, Grouzmann E, Muller O, et al. Blood pressure and renal responses to orthostatic stress before and after radiofrequency renal denervation in patients with resistant hypertension. Front Cardiovasc Med. 2018;5:42‐42. [DOI] [PMC free article] [PubMed] [Google Scholar]
- 26. Miroslawska A, Solbu M, Skjolsvik E, Toft I, Steigen TK. Renal sympathetic denervation: Effect on ambulatory blood pressure and blood pressure variability in patients with treatment‐resistant hypertension. The reshape cv‐risk study. J Hum Hypertens. 2016;30:153‐157. [DOI] [PubMed] [Google Scholar]
- 27. Symplicity HTNI, Esler MD, Krum H, et al. Renal sympathetic denervation in patients with treatment‐resistant hypertension (the symplicity htn‐2 trial): a randomised controlled trial. Lancet. 2010;376:1903‐1909. [DOI] [PubMed] [Google Scholar]
- 28. Levey AS, Stevens LA, Schmid CH, et al. A new equation to estimate glomerular filtration rate. Ann Intern Med. 2009;150:604‐612. [DOI] [PMC free article] [PubMed] [Google Scholar]
- 29. Jacobsson L. A method for the calculation of renal clearance based on a single plasma sample. Clin Physiol. 1983;3:297‐305. [DOI] [PubMed] [Google Scholar]
- 30. Nilsson‐Ehle P. Iohexol clearance for the determination of glomerular filtration rate: 15 years´ experience in clinical practice. J Int Fed Clin Chem Lab Med. 2006;13:48‐52. [PMC free article] [PubMed] [Google Scholar]
- 31. Du Bois D, Du Bois EF. A formula to estimate the approximate surface area if height and weight be known 1916. Nutrition. 1989;5:303‐311. [PubMed] [Google Scholar]
- 32. Sanders MF, Reitsma JB, Morpey M, et al. Renal safety of catheter‐based renal denervation: systematic review and meta‐analysis. Nephrol Dial Transplant. 2017;32:1440‐1447. [DOI] [PubMed] [Google Scholar]
- 33. Eriksen BO, Stefansson VTN, Jenssen TG, et al. Blood pressure and age‐related gfr decline in the general population. BMC Nephrol. 2017;18:77. [DOI] [PMC free article] [PubMed] [Google Scholar]
- 34. Stefansson VTN, Schei J, Solbu MD, Jenssen TG, Melsom T, Eriksen BO. Metabolic syndrome but not obesity measures are risk factors for accelerated age‐related glomerular filtration rate decline in the general population. Kidney Int. 2018;93:1183‐1190. [DOI] [PubMed] [Google Scholar]
- 35. Garofalo C, Borrelli S, Minutolo R, Chiodini P, De Nicola L, Conte G. A systematic review and meta‐analysis suggests obesity predicts onset of chronic kidney disease in the general population. Kidney Int. 2017;91:1224‐1235. [DOI] [PubMed] [Google Scholar]
- 36. Pöss J, Ewen S, Schmieder RE, et al. Effects of renal sympathetic denervation on urinary sodium excretion in patients with resistant hypertension. Clin Res Cardiol. 2015;104:672‐678. [DOI] [PubMed] [Google Scholar]
- 37. Lang D, Nahler A, Lambert T, et al. Anti‐inflammatory effects and prediction of blood pressure response by baseline inflammatory state in catheter‐based renal denervation. J Clin Hypertens. 2016;18:1173‐1179. [DOI] [PMC free article] [PubMed] [Google Scholar]
- 38. Levey AS, Becker C, Inker LA. Glomerular filtration rate and albuminuria for detection and staging of acute and chronic kidney disease in adults: A systematic review. JAMA. 2015;313:837‐846. [DOI] [PMC free article] [PubMed] [Google Scholar]
- 39. Kiuchi MG, Graciano ML, Carreira MA, Kiuchi T, Chen S, Lugon JR. Long‐term effects of renal sympathetic denervation on hypertensive patients with mild to moderate chronic kidney disease. J Clin Hypertens. 2016;18:190‐196. [DOI] [PMC free article] [PubMed] [Google Scholar]
- 40. Solbu MD, Toft I, Lochen ML, et al. N‐acetyl‐beta‐d‐glucosaminidase does not enhance prediction of cardiovascular or all‐cause mortality by albuminuria in a low‐risk population. J Am Soc Nephrol. 2016;27:533‐542. [DOI] [PMC free article] [PubMed] [Google Scholar]
- 41. Zhou L‐T, Lv L‐L, Pan M‐M, et al. Are urinary tubular injury markers useful in chronic kidney disease? A systematic review and meta analysis. PLoS One. 2016;11:e0167334. [DOI] [PMC free article] [PubMed] [Google Scholar]
- 42. Zhang Z, Yang K, Zeng L, et al. Renal simplicity denervation reduces blood pressure and renal injuries in an obesity‐induced hypertension dog model. Clin Exp Pharmacol Physiol. 2017;44:1213‐1223. [DOI] [PubMed] [Google Scholar]
- 43. Lee Alexandra K, Katz R, Jotwani V, et al. Distinct dimensions of kidney health and risk of cardiovascular disease, heart failure, and mortality. Hypertension. 2019;74:872‐879. [DOI] [PMC free article] [PubMed] [Google Scholar]