Abstract
Infrared (IR) spectroscopy is a powerful tool used to infer detailed structural information on molecules, often in conjunction with quantum-chemical calculations. When applied to cryogenically cooled ions, IR spectra provide unique fingerprints that can be used for biomolecular identification. This is particularly important in the analysis of isomeric biopolymers, which are difficult to distinguish using mass spectrometry. However, IR spectroscopy typically requires laser systems that need substantial user attention and measurement times of tens of minutes, which limits its analytical utility. We report here the development of a new high-throughput instrument that combines ultrahigh-resolution ion-mobility spectrometry with cryogenic IR spectroscopy and mass spectrometry, and we apply it to the analysis of isomeric glycans. The ion mobility step, which is based on structures for lossless ion manipulations (SLIM), separates glycan isomers, and an IR fingerprint spectrum identifies them. An innovative cryogenic ion trap allows multiplexing the acquisition of analyte IR fingerprints following mobility separation, and using a turn-key IR laser, we can obtain spectra and identify isomeric species in less than a minute. This work demonstrates the potential of IR fingerprinting methods to impact the analysis of isomeric biomolecules and more specifically glycans.
Keywords: cryogenic IR spectroscopy, glycans, glycan analysis, glycomics, high throughput, ion mobility spectrometry
Introduction
Glycans are the most abundant class of biopolymers, being present either as free species or as glycoconjugates such as glycoproteins, glycolipids, and other glycosides. It is thus unsurprising that glycobiology has become a key frontier in biomedical science. For example, understanding the involvement of glycans in viral pathogenesis1 is important for analyzing the mechanism by which a virus shields itself from vaccines.2 The observation of disease-specific alteration of protein and lipid glycosylation on the surface of cells has led to the use of glycans as biomarkers in various types of cancer,3−6 inflammatory diseases,7,8 and liver disease.9,10 The glycosylation pattern of biotherapeutics, such as monoclonal antibodies (mAbs), which are used to treat a wide range of pathologies,11 directly affects their effectiveness, toxicity, and long-term stability12 and thus plays an important role in quality control as well as in the regulatory approval of biosimilars.13
Unfortunately, glycans are significantly more difficult to analyze than other classes of biopolymers, which is a result of their complex stereochemistry and possibility to form branched structures. Consequently, no single analytical tool can currently resolve all forms of glycan isomerism.14 While NMR has the potential to yield glycan sequence as well as stereochemical details,15 it requires relatively large amounts of the purified analyte, which is challenging to obtain from biological samples. Liquid chromatography based methods,16,17 although significantly more sensitive, often require sample derivatization and analysis times ranging from tens of minutes to hours for a single separation. Moreover, certain positional isomers pose a particular problem for LC separation.18 Ion mobility spectrometry (IMS) has made important inroads as a fast separation technique that can differentiate between certain kinds of glycan isomers;19−23 however, it still has difficulty resolving the most subtly different isomeric species. Several groups have recently employed vibrational spectroscopy to distinguish isomeric glycan ions, either at room temperature24−31 or when cooled to cryogenic temperatures using collisions with cold buffer gas32 or embedded in liquid helium nanodroplets.33−36 While room-temperature IRMPD studies have clearly demonstrated the ability to distinguish small isomeric glycans, they have difficulties resolving larger species. Cooling glycans to cryogenic temperatures extends the size limit of species that can be distinguished, although resolving isomeric mixtures of large species still presents a formidable challenge. Moreover, cooling ions in liquid-helium droplets is not particularly well suited for incorporation into routine analytical instruments.
Our group has previously demonstrated that high-resolution IMS combined with cryogenic infrared (IR) spectroscopy can unambiguously distinguish between structurally related glycan isomers,37−39 and we have recently reported structure-specific IR fingerprints for glycans consisting of up to 10 monosaccharides.40 The robustness and accuracy of this technique is based on the fact that an IR spectrum is an intrinsic property of the analyte molecule and requires neither continuous calibration of the instrument nor internal standards. Once recorded and stored in a database, an IR fingerprint serves as a unique identifier that can be reproduced across laboratories. The structural specificity of this technique is demonstrated, for example, by its ability to distinguish between α and β reducing-end anomers,41 which differ in the orientation of only a single OH group. Confident identification based on an IR fingerprint can be achieved as long as the signal-to-noise ratio of a spectrum is sufficiently high. This has previously been accomplished by extensive signal averaging, typically over tens of minutes, making the approach impractical for high-throughput applications or those where small amounts of sample do not permit long analysis times.
To overcome this drawback, we present here a new multiplexing approach that enables acquiring IR fingerprints of multiple mobility-separated species simultaneously. We describe our instrument in which we combine ultrahigh-resolution IMS using structures for lossless ion manipulation (SLIM) with a state-of-the-art, segmented, cryogenic ion trap, where multiple ensembles of ions can be held spatially separated while being spectroscopically investigated. The increased acquisition speed and repeatability of IR fingerprint spectra available using this approach opens the door for the use of cryogenic IR spectroscopy as a broadly applicable analytical tool for glycans as well as other classes of isomeric biomolecules.
Experimental Approach
Materials
Methylated disaccharides and milk oligosaccharides (LNT and LNnT) were purchased from Carbosynth Ltd. (GBR) and Dextra (GBR), respectively, and used without further purification. For nanoelectrospray ionization (nESI), 10 μM solutions of the analytes were prepared in 50/50 MeOH/H2O, and approximately 1 equiv of sodium acetate was added to aid in the formation of sodiated species. In-house prepared borosilicate glass emitters were used to inject samples into the instrument. All gases were of 99.9999% purity.
Instrument Overview
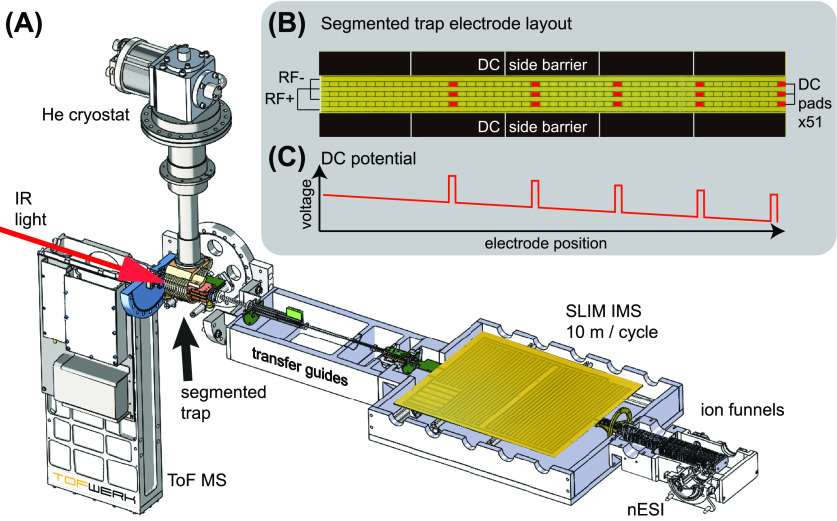
The instrument, shown schematically in Figure 1A, was designed for the acquisition of high-resolution IR fingerprint spectra of mobility separated ions in a high-throughput approach. Ions are generated in a nESI source and transported toward the ion-mobility region (described below) through a dual ion funnel assembly (MassTech, USA). An 80 mm long ring-electrode funnel guides ions onto the SLIM printed circuit board (PCB) assembly, where trapping and mobility separation is carried out. Subsequently, a second ring-electrode funnel transfers ions through a conductance limit and a series of multipole guides, which take them through three differentially pumped regions (10–2, 10–4, and 10–7 mbar). Ions then enter the trap region, held at approximately 10–6 mbar, where a short octupole guide and an einzel lens assembly directs them into the cryogenic, planar multipole trap described below. Depending on the mode of operation, an ion ensemble can be trapped and spectroscopically interrogated or simply guided through to be analyzed by a reflectron time-of-flight mass spectrometer (ToF-MS) (TofWerk, CHE). All DC, radiofrequency, and traveling-wave electrical potentials applied from the ion source to the cryogenic ion trap are generated by five MIPS-series power supplies from GAA Custom Electronics, LLC (USA).
Figure 1.
(A) Cut-away schematic of the newly developed instrument utilized for this work. (B) Schematic representation of the cryogenic, segmented trap electrodes, where those used to apply trapping DC potentials are highlighted in red. (C) Schematic representation of the DC potentials applied when trapping in five separate segments. The trap is loaded from the left side of (B), and thus, the rightmost trap is loaded and unloaded first.
Ion Mobility Module
Mobility separation is performed using structures for lossless ion manipulation (SLIM), originally developed by Smith and co-workers.42−44 Using traveling-wave electrical potentials applied to electrodes on a PCB “sandwich” structure, SLIM offers superior IMS resolving power43 and peak capacity for its size and cost. The ability of SLIM to guide ions through corners and turns as well as the possibility of cycling them through the separation region as many times as necessary in a nearly lossless manner enable extremely long drift lengths, and hence high resolution, on a relatively small device. The SLIM module we designed for our instrument features a 2 m accumulation region that is constantly filled from the ion source, and a separation region with a 10 m single-cycle path length. As demonstrated by Li et al.,45 the high-volume accumulation region allows for an increased ion utilization efficiency compared to previous implementations using ion funnel traps for ion storage prior to ion-mobility separation. Although not used for the study presented here, our SLIM module also features five on-board trapping regions that can be used for intermediate ion storage, enrichment of low-abundance analyte ions, and CID of mobility-separated species.46 Typical operating parameters for the results presented here were: N2 drift gas pressure, 2 mbar; traveling wave (TW) height, 30 V; TW speed, 160 m/s; RF amplitude, 120 Vpp; and RF frequency, 800 kHz.
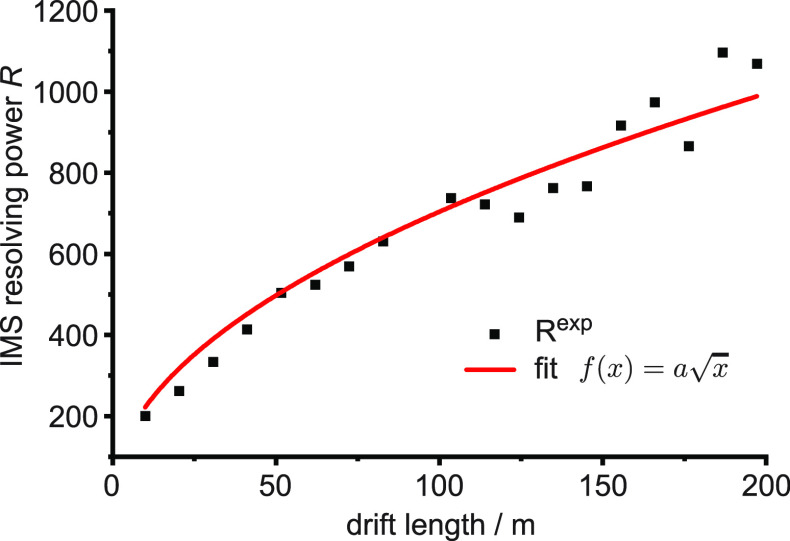
We demonstrate the separation power of our new instrument using the reverse-sequence pair of peptides GRGDS/SDGRG, which differ by 1.5% in collisional cross section in their singly sodiated form.47 The separation in time and the peak widths of these ions were used to calculate the resolving power as a function of the number of separation cycles, shown in Figure 2. The resolving power in a TW ion mobility instrument scales with the square-root of the number of TW segments,48 which is proportional to the drift length or the number of separation cycles. The solid line in Figure 2 represents a fit according to the relationship f(x) = a√x, where x corresponds to the drift length. A single separation cycle yields a resolving power of approximately 200 and reaches almost 1000 after 200 m or 20 separation cycles.
Figure 2.
Ion-mobility resolving power of the 10 m cyclic SLIM IMS module as a function of drift length, determined using the singly charged ion-mobility standard peptides GRGDS and SDGRG.
Cryogenic Multitrap
Our new cryogenic trap, which is based on our previous design,49 was conceived to accommodate a variable number of simultaneous trapping regions. It is similar to a SLIM device in that the electric fields used for trapping and guiding ions are created by electrodes on two mirrored PCBs in a sandwich assembly. The 110 mm long electrode configuration found on each PCB, displayed in Figure 1B, consists of four RF electrodes for confinement as well as 3 rows of 51 individually controlled DC electrodes that define the electric field gradient that pushes ions toward the exit of the trap (right side). Individual DC electrodes can also be used to block and trap mobility-separated ion distributions in predefined segments. A typical DC potential gradient applied to form five individual trapping segments is displayed schematically in Figure 1C, where the five potential spikes represent the blocking voltage used to separate one trap compartment from the next. Typical DC gradients across the entire trap are 10–20 V, with blocking potentials approximately 20 V above those of neighboring electrodes. Solid copper electrodes placed on either side of the trap fill the 5 mm space between the two PCBs and represent a physical as well as a potential barrier for the ions. To confine ions in the horizonal direction, we apply to these “side-barrier” electrodes a DC potential of 5–10 V higher than that of the on-track DC electrodes. The trap assembly is attached to a closed-cycle He cryostat (Sumitomo, JPN) and typically held at a temperature of 45 K. It is worth noting that the number of trapping regions can be reconfigured simply by changing which DC electrodes are used for blocking, and this is done external to the machine.
Modes of Operation
(1) In MS mode, ions are continuously introduced from the source into the IMS region and transmitted without separation. The cryogenic multitrap region is held at a constant He pressure of 10–6 mbar to enable collisional damping,50 thereby homogenizing the kinetic energy of the ions before they enter the ToF MS. This mode is used to acquire mass spectra of an unknown sample rapidly. (2) In IMS mode (Figure S1A in the Supporting Information), a pulse of ions is released by an ion gate into the SLIM separation region from the accumulation region, and this represents the start of an instrument cycle. Ions of different mobilities are separated with as many cycles as necessary before being guided toward the ToF MS. During one instrument cycle, mass spectra are acquired at 10 kHz repetition rate, thus creating nested IMS-MS data51 with 100 μs time resolution. The length of an instrument cycle depends on the IMS separation/cycling requirements and can range from 50 ms to more than 1 s. (3) In spectroscopy mode (Figure S1B), after determination of the drift times of mobility-separated ions, DC blocking voltages in the cryogenic multitrap are switched in an accurately timed sequence to ensure trapping of each ion ensemble of the same mobility in a separate compartment. We then perform messenger-tagging infrared spectroscopy52 of the trapped ions, as follows. First, we introduce an intense gas pulse of an 80/20 He/N2 mixture through a solenoid-actuated pulsed valve (Parker) a few ms before arrival of the first ions to ensure collisional damping of excess kinetic energy and cooling of internal degrees of freedom until the ion energies are in equilibrium with the surrounding buffer gas, which is then pumped out for the remainder of the instrument cycle. Three-body collisions involving N2 molecules lead to the formation of ion-N2 clusters, which can be observed as a +28 Da mass shift for ions in each compartment of the multitrap. A continuous-wave (cw) fiber-pumped IR laser (CLT series, IPG, USA) with a tuning range of 3250–4000 cm–1 operating at a constant power of 1 W and a resolution of ∼1 cm–1 irradiates ions in all trap compartments simultaneously for the entirety of the trapping time (approximately 50 ms), before the content of individual trap compartments are successively analyzed in the ToF over the last 5 ms of an instrument cycle. Mass spectra of each compartment are therefore recorded separately. The absorption of a single photon by a messenger-tagged ion leads to loss of the weakly bound N2 tag molecule and is observed in the MS data as a decrease in intensity of the tagged ions and an increase in the intensity of the untagged ions. Figure S2 shows an example of the tagged and untagged ion signals obtained with the laser on and off an absorption band. By plotting the ratio of tagged vs the sum of tagged and untagged ion signal for each individual trap compartment as a function of the laser wavelength, the IR spectra of each separated species can be reconstituted in real time by the data acquisition program. Spectra presented here were recorded two to three times and averaged. With 1 W power and an unfocused laser beam, we avoid multiple-photon absorption that might distort the spectrum. The use of a cw laser system also allows one to freely choose the length of an instrument cycle as required for ion separation in the IMS module. This flexibility was not previously available with the pulsed OPO laser systems often used in messenger-tagging spectroscopic studies.37,53
Results and Discussion
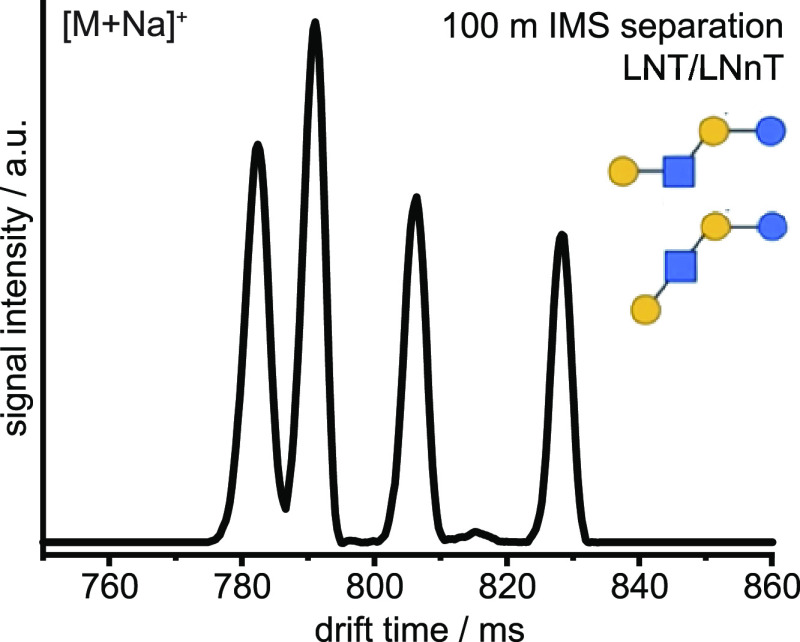
The performance of our new apparatus was first tested with a mixture of the structurally related human milk oligosaccharide isomers lacto-N-traose (LNT) and lacto-N-neotetraose (LNnT). The difficulty to resolve these isomers as sodium adduct species54 represents a formidable challenge. Both glycans have been reported to exhibit two distinct gas-phase isomers,37 which have not been previously resolved using IMS. An arrival time distribution (ATD) obtained on our apparatus from a mixture of LNT/LNnT after 100 m separation (10 cycles) is displayed in Figure 3. The IMS resolving power under these conditions is approximately 700 (see Figure 2), which indicates that the nearly baseline-separated species at 780 to 790 ms drift times differ by only approximately 0.1% in their CCS. Accurately determining CCSs under these high-resolution conditions remains extremely challenging,55,56 and thus identifying such closely related isomers based a CCS value alone would be tenuous.
Figure 3.
IMS arrival time distribution of a singly sodiated mixture of LNT and LNnT after 100 m mobility separation (10 cycles).
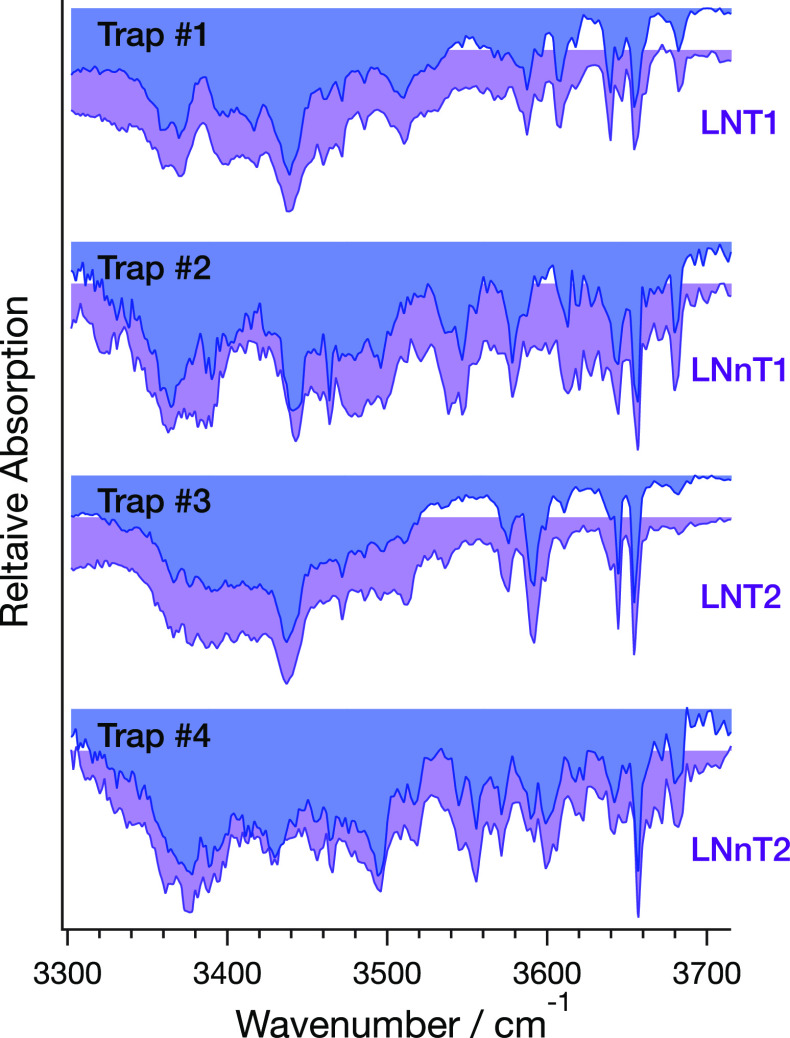
To assign the drift peaks in Figure 3 to particular isomers, we recorded cryogenic IR fingerprint spectra of all four species simultaneously by making use of the new segmented ion trap, where mobility-separated species are confined in their respective compartments while being interrogated by the IR laser. The spectra from this measurement are shown in Figure 4 (blue), each of which display a series of absorption bands originating from relatively free OH oscillators (3580–3680 cm–1) and more strongly hydrogen-bonded OH and NH oscillators (below 3550 cm–1). Each spectrum is clearly unique over a broad spectral range, even though their underlying structures are so closely related. This observation is typical for cryogenic IR spectra and is what enables their use as an identifying fingerprint for any compound with structure-sensitive IR active vibrational transitions, such as glycans. The spectra from the individual trap compartments were then compared to previously recorded reference spectra of LNT and LNnT, shown in purple in Figure 4. A simple visual comparison allows us to assign the first and third ATD features as conformers of LNT and the second and fourth features as conformers of LNnT. Based on previous work,39 we suggest that each pair of peaks likely corresponds to the α and β anomers at the C1 carbon of the reducing end.
Figure 4.
Cryogenic IR fingerprint spectra of the four IMS-separated species from the ATD (Figure 3) of an LNT/LNnT mixture recorded simultaneously using the segmented cryogenic ion trap (blue spectra). Spectra are matched to reference spectra (purple) of previously individually recorded IR spectra for identification of individual IMS drift peaks. The spectra are normalized between 0 and 1, and the maximum depletion of tagged species is typically 80–90%.
Separation of the four LNT/LNnT species required ultrahigh mobility resolution, which resulted in an instrument cycle of almost one second (see drift times in Figure 3). Spectra were acquired with 220 points across the entire wavenumber range with only one acquisition (i.e., one instrument cycle) per point, resulting in a total acquisition time of 3 min for the four spectra together.
Figure 5A shows examples of arrival time profiles of ions ejected from the four adjacent ion trap compartments during acquisition of the spectra of Figure 4. Each ion distribution arrives in the ToF extraction region several tens of microseconds after their release and is few tens of microseconds wide. The exact time of their ejection from the trap is arbitrary but needs to occur in order of their arrival. The fast ToF analysis (10 kHz) allows us to acquire a mass spectrum of each ion distribution (Figure 5B) within each instrument cycle. The relative number of tagged and untagged ions after IR irradiation is directly determined from these data and plotted as an absorption yield versus the laser wavenumber as shown in Figure 4. It is noteworthy that the simultaneous acquisition of multiple spectra does not increase the total measurement time compared to interrogation of a single mobility-selected species. This is because IR irradiation and ToF analysis can occur during the mobility separation step of the next instrument cycle. The use of our segmented cryogenic ion trap therefore decreases the total measurement time by a factor equivalent to the number of trap compartments, which can be dynamically adapted depending on the analytical requirements. It is ultimately limited by the total length of the trap and the number of electrodes used to define the electric fields. For the electrode geometry chosen here, the minimum segment length will be approximately 1 cm.
Figure 5.
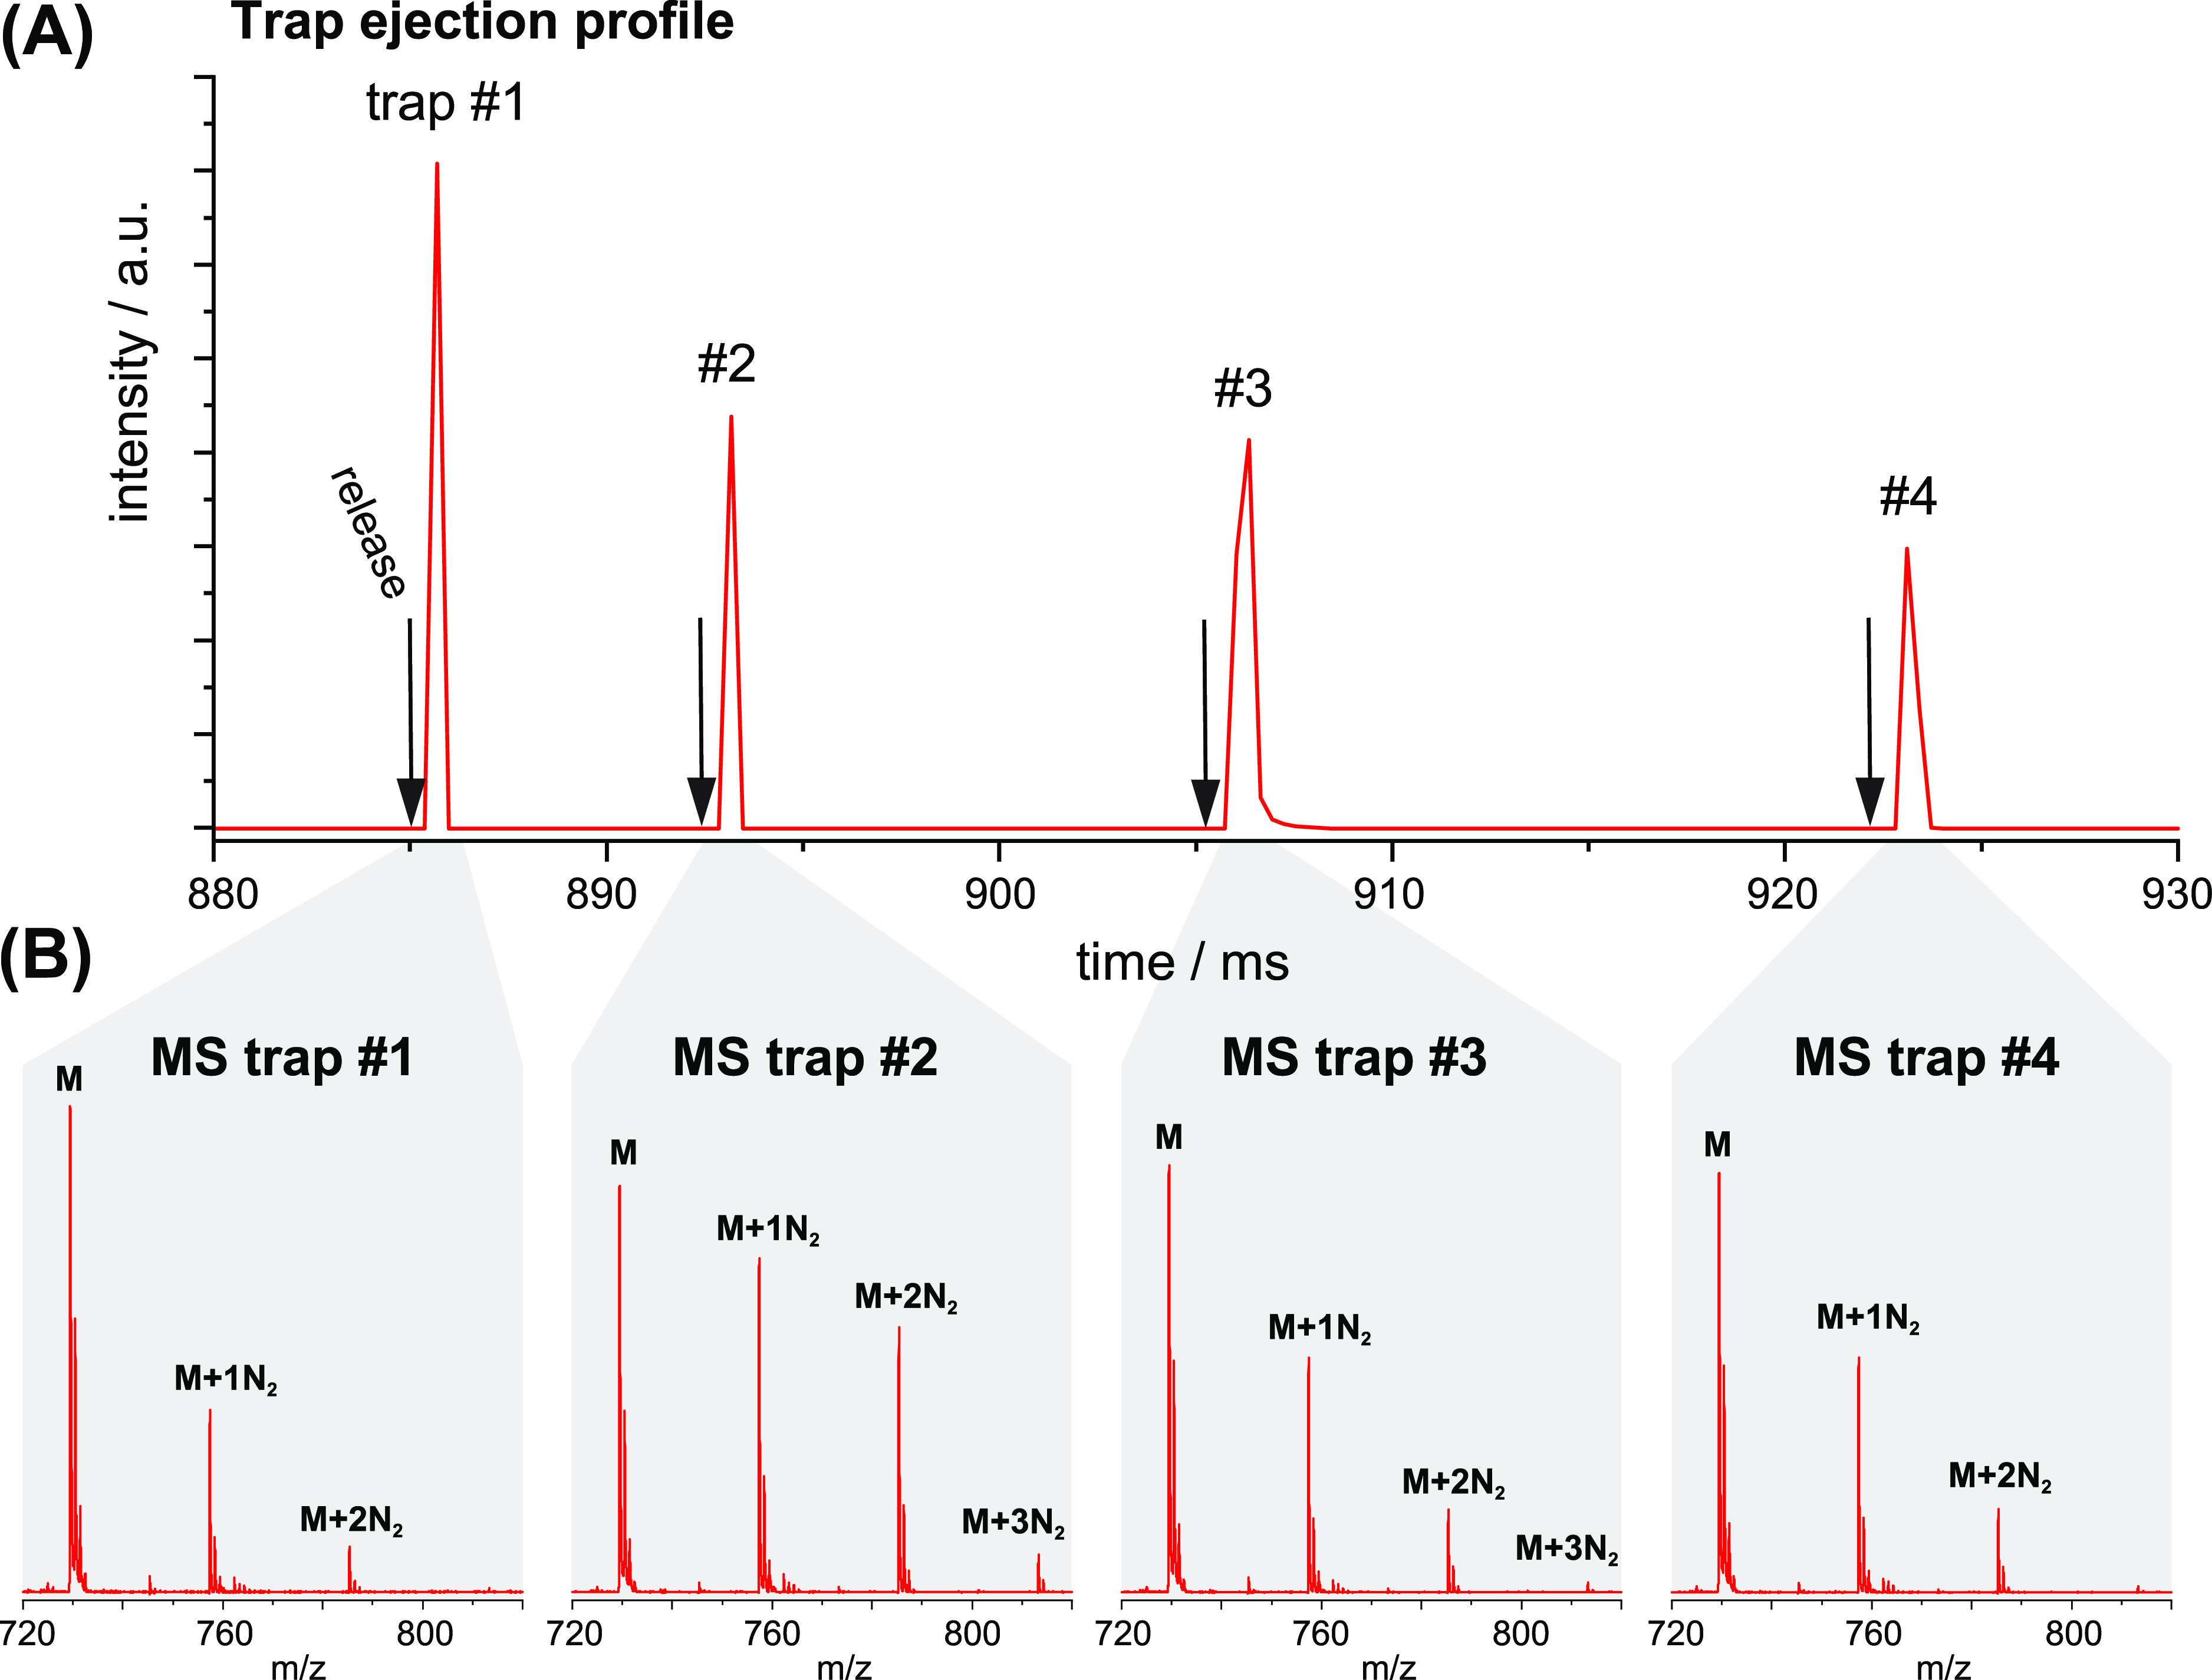
(A) Arrival time profile of the ion distributions ejected from the four different trap compartments within one instrument cycle. (B) Exemplary ToF MS spectra of the IR irradiated ions extracted from each trap compartment, indicating different amounts of remaining N2 tagging.
IR Spectral Comparison Using Principal Component Analysis (PCA)
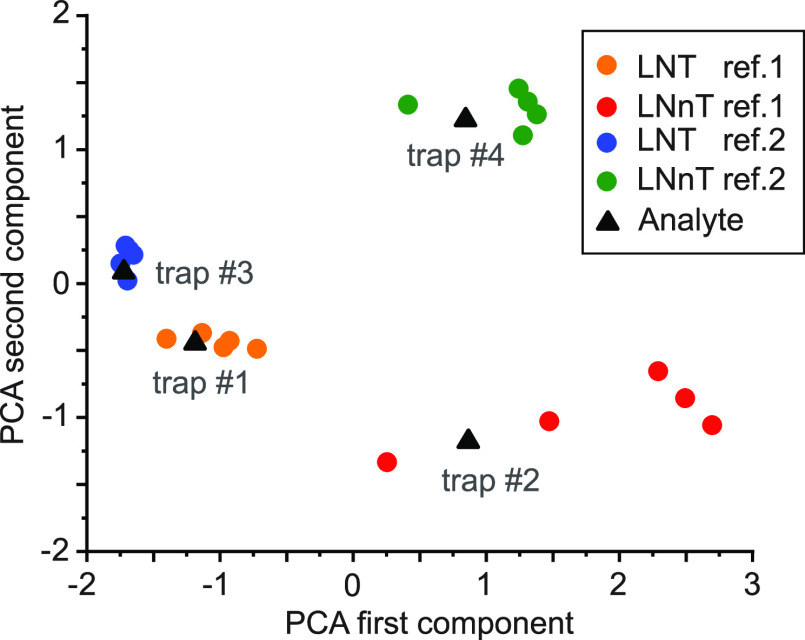
The spectral identification of the LNT and LNnT ions contained in each peak of the ATD in Figure 3 was based on visual comparison to reference spectra. As a more rigorous approach for spectral comparison and compound identification for a routine analysis workflow, we used PCA together with a machine-learning algorithm to assign the spectra of analyte ions to a number of replicate reference spectra automatically. PCA is frequently applied in different areas of analytical chemistry57 to reduce the dimensionality of large data sets, that is, identify a smaller number of variables (the principal components) that still sufficiently describes the original set. The “scikit-learn” software machine-learning python library58 was then applied for an automatic clustering of corresponding reference and analyte spectra in principal-component space to identify the analyte. The result of this method, applied to six reference spectra for each component of LNT and LNnT, respectively, and the spectra of the analyte ions from the different trap compartments (blue spectra in Figure 4), is displayed in Figure 6. It is important to note that this approach requires no user interpretation of the data; the analyte spectra are automatically assigned to their reference compounds.
Figure 6.
First and second component of a PCA of the reference spectra (colored dots) and spectra of the analyte ions from the four trap segments (black triangles).
In addition, PCA allows us to evaluate the uniqueness of different wavenumber regions of reference spectra. In practice, this can be implemented in an algorithm that selects a wavenumber region of reference spectra where the difference in the first PCA component is maximized. As a result, the spectra of the analyte ions only need to be recorded over a reduced wavenumber range (i.e., where spectra exhibit the greatest differences), thereby saving analysis time. To illustrate this, we performed the PCA and clustering analysis on the data from the LNT/LNnT mixture over the reduced wavenumber range of 3600–3700 cm–1, which represents less that one-fourth of the original scan length. The algorithm is still able to assign the different components of LNT/LNnT to their respective reference compounds unambiguously, as shown in Figure S3.
Decreasing Acquisition Time
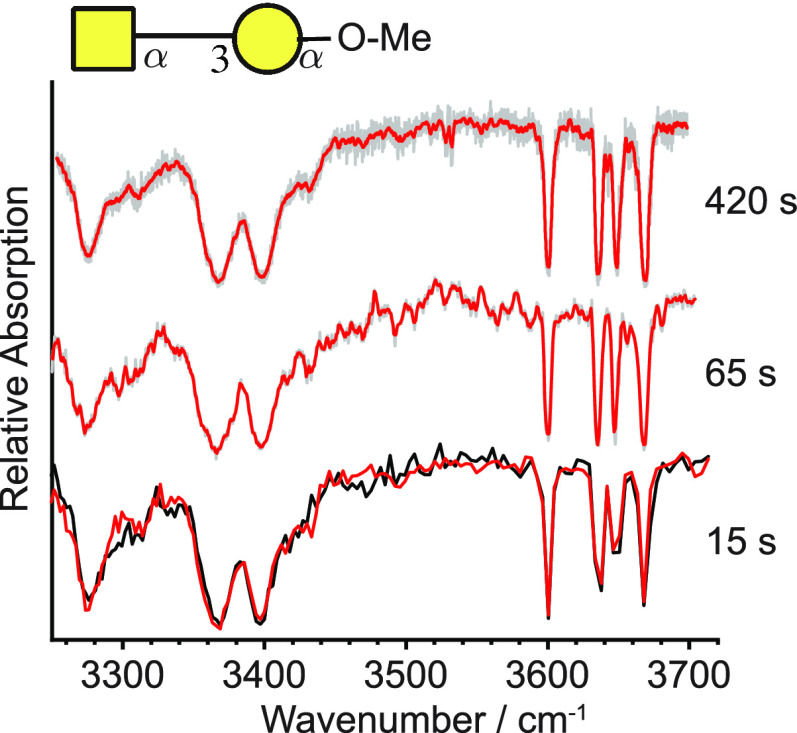
Previous instrumentation, such as that developed in our laboratory,37,49,59 allowed for the acquisition of cryogenic IR spectra over a spectral range of 450 cm–1 (i.e., the same as that shown in Figure 4) on a time scale of tens of minutes. Such time scales are not practical for a routine analytical workflow, especially when sample analysis involves LC-MS, where analyte molecules typically elute over a period of a few seconds to tens of seconds. A range of instrument improvements affecting the overall signal stability as well as the use of a continuous-wave laser, which by definition does not exhibit inherent shot-to-shot intensity variations like pulsed OPO systems, has helped to increase considerably the signal-to-noise (S/N) ratio during spectral acquisition. This eases the need for extensive signal averaging and hence shortens the data acquisition time. To demonstrate this, we measured IR spectra of a previously studied41 disaccharide GalNAc-α(1-3)-Gal-OMe under a range of averaging conditions (Figure 7). In a first experiment, the 450 cm–1 range was oversampled in a 7 min scan, allowing us to average 18 successive data points without losing spectral resolution. The averaged signal is displayed in red in Figure 7 (top), and the individual data points are displayed in gray. A second scan of roughly 1 min (Figure 7, middle) exhibits virtually identical spectral features, albeit with slightly decreased S/N. Finally, two replicates of a 15 s scan are displayed at the bottom of Figure 7. It is striking to observe that all characteristic absorption bands can be reproduced in a measurement in a fraction of the time that was previously necessary, and that a second replicate measurement shows little deviation from the first, indicating excellent repeatability of the measurements (compare the red and black traces in Figure 7, bottom). It is important to note that in comparison to the measurements shown in Figure 4, a shorter instrument cycle of 0.2 s was applied here, which is a result of the lower ion mobility resolution necessary for these experiments. Nonetheless, at these single separation-cycle conditions the instrument exhibits an IMS resolving power of approximately 200.
Figure 7.
Comparison of cryogenic IR spectra of O-methylated GalNAc-α(1-3)-Gal acquired at different scan speeds, ranging from 7 min (top) to 15 s (bottom). The data points for the top two spectra are displayed in gray, while the red curves represent averaged data points (adjacent averaging) of the oversampled spectral features. No data averaging was applied for the 15 s scans, where the two curves represent two replicate measurements.
Furthermore, most diagnostic features in glycan IR spectra from our laboratory37,40,41,46,60 are observed in a wavenumber range from 3580 to 3680 cm–1, which is also supported by the success of the PCA and clustering method applied to a reduced wavenumber range as described above. An identifying fingerprint of the GalNAc-α(1-3)-Gal-OMe ions can thus be recorded in as little as 5 s without losing its most unique identifying features.
What are the implications of these results for the use of cryogenic IR spectroscopy in an analytical environment? The unprecedentedly short acquisition times alone represent a milestone toward a broader application of IR fingerprints for the identification of compounds in mass spectrometry. At a typical nanospray flow rate and sub-micromolar concentrations that are compatible with the sensitivity of our ion detection, these acquisition times imply consumption of femtomole quantities of the analyte in a 1 min identification procedure. In the future, analysis time will be further reduced when only a few discrete isomer-specific wavenumbers will be probed spectroscopically instead of a continuous wavenumber range. The frequencies and number of points necessary for identification will then be determined by an algorithm based on the database spectra of candidate compounds. In cases where isomers cannot be completely resolved prior spectroscopic fingerprinting, the spectra can be deconvoluted using isomer-specific database entries to identify the components of the mixture. When unknown analytes are encountered in a sample, on-board IMS2 (or IMSn) methods can be applied, where IR fingerprints of CID-generated fragments can be used for identification and subsequent reconstruction of the unknown compound.46 Further development of such methods will greatly benefit from the fast multiplexing approach described here, which represents an important step toward the widespread use of IR fingerprinting as an analytical tool in high-throughput applications.
Conclusions
While a cryogenic IR fingerprint serves as an unmistakable molecular identifier able to distinguish between minute structural differences in glycans or other isomeric species, the use of IR spectroscopy for analysis has up to now been hindered by relatively low throughput and long measurement times. To compensate the drawbacks of adding a spectroscopic dimension, we have demonstrated a new multiplexing approach, which along with general improvements in the cryogenic IR fingerprinting technology, increases both the spectral acquisition speed and its robustness. In combination with a fast isomer-separation technique such as ultrahigh-resolution ion mobility spectrometry using SLIM, our approach allows one to acquire IR fingerprints of multiple isomeric species simultaneously. Depending on the time requirements of the IMS separation step, we can record IR fingerprints over a range of 450 cm–1 within a few seconds to minutes. However, recording a spectrum at a few structurally characteristic wavenumbers may already suffice for a confident identification. This will be implemented in the future with the help of an algorithm to determine the reduced wavenumber range from the candidate fingerprint database and could be done without the need for user input. The resulting shortened analysis time will ultimately allow for direct combination of the cryogenic IR fingerprinting technique with, for example, established LC workflows at existing flow rates. Eluting analytes could then be identified in a high-throughput manner with the benefit of the exceptional confidence that cryogenic IR fingerprinting provides. Once incorporated with user-friendly software, this approach not only will have the potential to profoundly impact the field of glycomics but can in principle help resolve any analytical challenge where isomeric, IR-absorbing molecules need to be analyzed.
Acknowledgments
The authors thank the European Research Council (Grant 788697-GLYCANAL) and the Swiss National Science Foundation (Grants 200020_184838 and 206021_177004) for their generous support of this work.
Supporting Information Available
The Supporting Information is available free of charge at https://pubs.acs.org/doi/10.1021/acsmeasuresciau.1c00018.
Timing sequence diagram for the different modes of operation; examples of mass spectra with and without the laser on an absorption peak; and data from PCA analysis of the four LNT/LNnT IR fingerprint spectra over a reduced wavenumber range of 100 cm–1 (PDF)
The authors declare no competing financial interest.
Supplementary Material
References
- Reily C.; Stewart T. J.; Renfrow M. B.; Novak J. Glycosylation in health and disease. Nat. Rev. Nephrol. 2019, 15 (6), 346–366. 10.1038/s41581-019-0129-4. [DOI] [PMC free article] [PubMed] [Google Scholar]
- Chang D.; Zaia J. Why Glycosylation Matters in Building a Better Flu Vaccine. Mol. Cell. Proteomics 2019, 18 (12), 2348–2358. 10.1074/mcp.R119.001491. [DOI] [PMC free article] [PubMed] [Google Scholar]
- Kailemia M. J.; Park D.; Lebrilla C. B. Glycans and glycoproteins as specific biomarkers for cancer. Anal. Bioanal. Chem. 2017, 409 (2), 395–410. 10.1007/s00216-016-9880-6. [DOI] [PMC free article] [PubMed] [Google Scholar]
- Adamczyk B.; Tharmalingam T.; Rudd P. M. Glycans as cancer biomarkers. Biochim. Biophys. Acta, Gen. Subj. 2012, 1820 (9), 1347–53. 10.1016/j.bbagen.2011.12.001. [DOI] [PubMed] [Google Scholar]
- Mittal P.; Briggs M.; Klingler-Hoffmann M.; Kaur G.; Packer N. H.; Oehler M. K.; Hoffmann P. Altered N-linked glycosylation in endometrial cancer. Anal. Bioanal. Chem. 2021, 413 (10), 2721–2733. 10.1007/s00216-020-03039-z. [DOI] [PubMed] [Google Scholar]
- Sethi M. K.; Thaysen-Andersen M.; Smith J. T.; Baker M. S.; Packer N. H.; Hancock W. S.; Fanayan S. Comparative N-glycan profiling of colorectal cancer cell lines reveals unique bisecting GlcNAc and alpha-2,3-linked sialic acid determinants are associated with membrane proteins of the more metastatic/aggressive cell lines. J. Proteome. Res. 2014, 13 (1), 277–88. 10.1021/pr400861m. [DOI] [PubMed] [Google Scholar]
- Verhelst X.; Dias A. M.; Colombel J. F.; Vermeire S.; Van Vlierberghe H.; Callewaert N.; Pinho S. S. Protein Glycosylation as a Diagnostic and Prognostic Marker of Chronic Inflammatory Gastrointestinal and Liver Diseases. Gastroenterology 2020, 158 (1), 95–110. 10.1053/j.gastro.2019.08.060. [DOI] [PubMed] [Google Scholar]
- Lawler P. R.; Mora S. Glycosylation Signatures of Inflammation Identify Cardiovascular Risk: Some Glyc It Hot. Circ. Res. 2016, 119 (11), 1154–1156. 10.1161/CIRCRESAHA.116.310005. [DOI] [PMC free article] [PubMed] [Google Scholar]
- Vanderschaeghe D.; Szekrenyes A.; Wenz C.; Gassmann M.; Naik N.; Bynum M.; Yin H.; Delanghe J.; Guttman A.; Callewaert N. High-throughput profiling of the serum N-glycome on capillary electrophoresis microfluidics systems: toward clinical implementation of GlycoHepatoTest. Anal. Chem. 2010, 82 (17), 7408–15. 10.1021/ac101560a. [DOI] [PubMed] [Google Scholar]
- Post M. A.; Lefeber D. J. Clinical glycomics in the diagnostic laboratory. Ann. Transl. Med. 2019, 7, S220. 10.21037/atm.2019.08.74. [DOI] [PMC free article] [PubMed] [Google Scholar]
- Rajewsky K. The advent and rise of monoclonal antibodies. Nature 2019, 575 (7781), 47–49. 10.1038/d41586-019-02840-w. [DOI] [PubMed] [Google Scholar]
- Valverde P.; Arda A.; Reichardt N. C.; Jimenez-Barbero J.; Gimeno A. Glycans in drug discovery. MedChemComm 2019, 10 (10), 1678–1691. 10.1039/C9MD00292H. [DOI] [PMC free article] [PubMed] [Google Scholar]
- Lemery S. J.; Ricci M. S.; Keegan P.; McKee A. E.; Pazdur R. FDA’s Approach to Regulating Biosimilars. Clin. Cancer Res. 2017, 23 (8), 1882. 10.1158/1078-0432.CCR-16-1354. [DOI] [PubMed] [Google Scholar]
- Transforming Glycoscience: A Roadmap for the Future; The National Academies Press: Washington, DC, 2012. [PubMed] [Google Scholar]
- Lundborg M.; Fontana C.; Widmalm G. Automatic structure determination of regular polysaccharides based solely on NMR spectroscopy. Biomacromolecules 2011, 12 (11), 3851–5. 10.1021/bm201169y. [DOI] [PMC free article] [PubMed] [Google Scholar]
- Nagy G.; Peng T.; Pohl N. L. B. Recent Liquid Chromatographic Approaches and Developments for the Separation and Purification of Carbohydrates. Anal. Methods 2017, 9 (24), 3579–3593. 10.1039/C7AY01094J. [DOI] [PMC free article] [PubMed] [Google Scholar]
- Marino K.; Bones J.; Kattla J. J.; Rudd P. M. A systematic approach to protein glycosylation analysis: a path through the maze. Nat. Chem. Biol. 2010, 6 (10), 713–23. 10.1038/nchembio.437. [DOI] [PubMed] [Google Scholar]
- Vreeker G. C.; Wuhrer M. Reversed-phase separation methods for glycan analysis. Anal. Bioanal. Chem. 2017, 409 (2), 359–378. 10.1007/s00216-016-0073-0. [DOI] [PMC free article] [PubMed] [Google Scholar]
- Hofmann J.; Hahm H. S.; Seeberger P. H.; Pagel K. Identification of carbohydrate anomers using ion mobility-mass spectrometry. Nature 2015, 526 (7572), 241–4. 10.1038/nature15388. [DOI] [PubMed] [Google Scholar]
- Gray C. J.; Thomas B.; Upton R.; Migas L. G.; Eyers C. E.; Barran P. E.; Flitsch S. L. Applications of ion mobility mass spectrometry for high throughput, high resolution glycan analysis. Biochim. Biophys. Acta, Gen. Subj. 2016, 1860 (8), 1688–709. 10.1016/j.bbagen.2016.02.003. [DOI] [PubMed] [Google Scholar]
- Chen Z.; Glover M. S.; Li L. Recent advances in ion mobility-mass spectrometry for improved structural characterization of glycans and glycoconjugates. Curr. Opin. Chem. Biol. 2018, 42, 1–8. 10.1016/j.cbpa.2017.10.007. [DOI] [PMC free article] [PubMed] [Google Scholar]
- Peterson T. L.; Nagy G. Toward Sequencing the Human Milk Glycome: High-Resolution Cyclic Ion Mobility Separations of Core Human Milk Oligosaccharide Building Blocks. Anal. Chem. 2021, 93 (27), 9397–9407. 10.1021/acs.analchem.1c00942. [DOI] [PubMed] [Google Scholar]
- Nagy G.; Attah I. K.; Garimella S. V. B.; Tang K.; Ibrahim Y. M.; Baker E. S.; Smith R. D. Unraveling the isomeric heterogeneity of glycans: ion mobility separations in structures for lossless ion manipulations. Chem. Commun. 2018, 54 (83), 11701–11704. 10.1039/C8CC06966B. [DOI] [PMC free article] [PubMed] [Google Scholar]
- Depraz Depland A.; Renois-Predelus G.; Schindler B.; Compagnon I. Identification of sialic acid linkage isomers in glycans using coupled InfraRed Multiple Photon Dissociation (IRMPD) spectroscopy and mass spectrometry. Int. J. Mass Spectrom. 2018, 434, 65–69. 10.1016/j.ijms.2018.09.005. [DOI] [Google Scholar]
- Gray C. J.; Compagnon I.; Flitsch S. L. Mass spectrometry hybridized with gas-phase InfraRed spectroscopy for glycan sequencing. Curr. Opin. Struct. Biol. 2020, 62, 121–131. 10.1016/j.sbi.2019.12.014. [DOI] [PubMed] [Google Scholar]
- Hernandez O.; Isenberg S.; Steinmetz V.; Glish G. L.; Maitre P. Probing Mobility-Selected Saccharide Isomers: Selective Ion–Molecule Reactions and Wavelength-Specific IR Activation. J. Phys. Chem. A 2015, 119 (23), 6057–64. 10.1021/jp511975f. [DOI] [PubMed] [Google Scholar]
- Schindler B.; Laloy-Borgna G.; Barnes L.; Allouche A. R.; Bouju E.; Dugas V.; Demesmay C.; Compagnon I. Online Separation and Identification of Isomers Using Infrared Multiple Photon Dissociation Ion Spectroscopy Coupled to Liquid Chromatography: Application to the Analysis of Disaccharides Regio-Isomers and Monosaccharide Anomers. Anal. Chem. 2018, 90 (20), 11741–11745. 10.1021/acs.analchem.8b02801. [DOI] [PubMed] [Google Scholar]
- Ho J. S.; Gharbi A.; Schindler B.; Yeni O.; Bredy R.; Legentil L.; Ferrieres V.; Kiessling L. L.; Compagnon I. Distinguishing Galactoside Isomers with Mass Spectrometry and Gas-Phase Infrared Spectroscopy. J. Am. Chem. Soc. 2021, 143 (28), 10509–10513. 10.1021/jacs.0c11919. [DOI] [PMC free article] [PubMed] [Google Scholar]
- Schindler B.; Barnes L.; Gray C. J.; Chambert S.; Flitsch S. L.; Oomens J.; Daniel R.; Allouche A. R.; Compagnon I. IRMPD Spectroscopy Sheds New (Infrared) Light on the Sulfate Pattern of Carbohydrates. J. Phys. Chem. A 2017, 121 (10), 2114–2120. 10.1021/acs.jpca.6b11642. [DOI] [PubMed] [Google Scholar]
- Schindler B.; Barnes L.; Renois G.; Gray C.; Chambert S.; Fort S.; Flitsch S.; Loison C.; Allouche A.-R.; Compagnon I. Anomeric memory of the glycosidic bond upon fragmentation and its consequences for carbohydrate sequencing. Nat. Commun. 2017, 8, 973. 10.1038/s41467-017-01179-y. [DOI] [PMC free article] [PubMed] [Google Scholar]
- Tan Y.; Zhao N.; Liu J.; Li P.; Stedwell C. N.; Yu L.; Polfer N. C. Vibrational Signatures of Isomeric Lithiated N-acetyl-D-hexosamines by Gas-Phase Infrared Multiple-Photon Dissociation (IRMPD) Spectroscopy. J. Am. Soc. Mass Spectrom. 2017, 28 (3), 539–550. 10.1007/s13361-016-1575-x. [DOI] [PubMed] [Google Scholar]
- Voss J. M.; Kregel S. J.; Fischer K. C.; Garand E. IR-IR Conformation Specific Spectroscopy of Na(+)(Glucose) Adducts. J. Am. Soc. Mass Spectrom. 2018, 29 (1), 42–50. 10.1007/s13361-017-1813-x. [DOI] [PubMed] [Google Scholar]
- Lettow M.; Grabarics M.; Greis K.; Mucha E.; Thomas D. A.; Chopra P.; Boons G.-J.; Karlsson R.; Turnbull J. E.; Meijer G.; Miller R. L.; von Helden G.; Pagel K. Cryogenic Infrared Spectroscopy Reveals Structural Modularity in the Vibrational Fingerprints of Heparan Sulfate Diastereomers. Anal. Chem. 2020, 92 (15), 10228–10232. 10.1021/acs.analchem.0c02048. [DOI] [PubMed] [Google Scholar]
- Lettow M.; Grabarics M.; Mucha E.; Thomas D. A.; Polewski L.; Freyse J.; Rademann J.; Meijer G.; von Helden G.; Pagel K. IR action spectroscopy of glycosaminoglycan oligosaccharides. Anal. Bioanal. Chem. 2020, 412 (3), 533–537. 10.1007/s00216-019-02327-7. [DOI] [PMC free article] [PubMed] [Google Scholar]
- Lettow M.; Greis K.; Grabarics M.; Horlebein J.; Miller R. L.; Meijer G.; von Helden G.; Pagel K. Chondroitin Sulfate Disaccharides in the Gas Phase: Differentiation and Conformational Constraints. J. Phys. Chem. A 2021, 125, 4373. 10.1021/acs.jpca.1c02463. [DOI] [PMC free article] [PubMed] [Google Scholar]
- Mucha E.; González Flórez A. I.; Marianski M.; Thomas D. A.; Hoffmann W.; Struwe W. B.; Hahm H. S.; Gewinner S.; Schöllkopf W.; Seeberger P. H.; von Helden G.; Pagel K. Glycan Fingerprinting using Cold-Ion Infrared Spectroscopy. Angew. Chem., Int. Ed. 2017, 56, 11248–11251. 10.1002/anie.201702896. [DOI] [PubMed] [Google Scholar]
- Ben Faleh A.; Warnke S.; Rizzo T. R. Combining Ultrahigh-Resolution Ion-Mobility Spectrometry with Cryogenic Infrared Spectroscopy for the Analysis of Glycan Mixtures. Anal. Chem. 2019, 91 (7), 4876–4882. 10.1021/acs.analchem.9b00659. [DOI] [PubMed] [Google Scholar]
- Dyukova I.; Ben Faleh A.; Warnke S.; Yalovenko N.; Yatsyna V.; Bansal P.; Rizzo T. R. A new approach for identifying positional isomers of glycans cleaved from monoclonal antibodies. Analyst 2021, 146 (15), 4789–4795. 10.1039/D1AN00780G. [DOI] [PMC free article] [PubMed] [Google Scholar]
- Warnke S.; Ben Faleh A.; Scutelnic V.; Rizzo T. R. Separation and Identification of Glycan Anomers Using Ultrahigh-Resolution Ion-Mobility Spectrometry and Cryogenic Ion Spectroscopy. J. Am. Soc. Mass Spectrom. 2019, 30 (11), 2204–2211. 10.1007/s13361-019-02333-0. [DOI] [PubMed] [Google Scholar]
- Yalovenko N.; Yatsyna V.; Bansal P.; AbiKhodr A. H.; Rizzo T. R. Analyzing glycans cleaved from a biotherapeutic protein using ultrahigh-resolution ion mobility spectrometry together with cryogenic ion spectroscopy. Analyst 2020, 145 (20), 6493–6499. 10.1039/D0AN01206H. [DOI] [PubMed] [Google Scholar]
- Warnke S.; Ben Faleh A.; Pellegrinelli R. P.; Yalovenko N.; Rizzo T. R. Combining ultra-high resolution ion mobility spectrometry with cryogenic IR spectroscopy for the study of biomolecular ions. Faraday Discuss. 2019, 217 (0), 114–125. 10.1039/C8FD00180D. [DOI] [PMC free article] [PubMed] [Google Scholar]
- Deng L.; Ibrahim Y. M.; Hamid A. M.; Garimella S. V.; Webb I. K.; Zheng X.; Prost S. A.; Sandoval J. A.; Norheim R. V.; Anderson G. A.; Tolmachev A. V.; Baker E. S.; Smith R. D. Ultra-High Resolution Ion Mobility Separations Utilizing Traveling Waves in a 13 m Serpentine Path Length Structures for Lossless Ion Manipulations Module. Anal. Chem. 2016, 88 (18), 8957–64. 10.1021/acs.analchem.6b01915. [DOI] [PMC free article] [PubMed] [Google Scholar]
- Deng L.; Webb I. K.; Garimella S. V. B.; Hamid A. M.; Zheng X.; Norheim R. V.; Prost S. A.; Anderson G. A.; Sandoval J. A.; Baker E. S.; Ibrahim Y. M.; Smith R. D. Serpentine Ultralong Path with Extended Routing (SUPER) High Resolution Traveling Wave Ion Mobility-MS using Structures for Lossless Ion Manipulations. Anal. Chem. 2017, 89 (8), 4628–4634. 10.1021/acs.analchem.7b00185. [DOI] [PMC free article] [PubMed] [Google Scholar]
- Hamid A. M.; Garimella S. V. B.; Ibrahim Y. M.; Deng L.; Zheng X.; Webb I. K.; Anderson G. A.; Prost S. A.; Norheim R. V.; Tolmachev A. V.; Baker E. S.; Smith R. D. Achieving High Resolution Ion Mobility Separations Using Traveling Waves in Compact Multiturn Structures for Lossless Ion Manipulations. Anal. Chem. 2016, 88 (18), 8949–8956. 10.1021/acs.analchem.6b01914. [DOI] [PMC free article] [PubMed] [Google Scholar]
- Li A.; Nagy G.; Conant C. R.; Norheim R. V.; Lee J. Y.; Giberson C.; Hollerbach A. L.; Prabhakaran V.; Attah I. K.; Chouinard C. D.; Prabhakaran A.; Smith R. D.; Ibrahim Y. M.; Garimella S. V. B. Ion Mobility Spectrometry with High Ion Utilization Efficiency Using Traveling Wave-Based Structures for Lossless Ion Manipulations. Anal. Chem. 2020, 92 (22), 14930–14938. 10.1021/acs.analchem.0c02100. [DOI] [PMC free article] [PubMed] [Google Scholar]
- Bansal P.; Yatsyna V.; AbiKhodr A. H.; Warnke S.; Ben Faleh A.; Yalovenko N.; Wysocki V. H.; Rizzo T. R. Using SLIM-Based IMS-IMS Together with Cryogenic Infrared Spectroscopy for Glycan Analysis. Anal. Chem. 2020, 92 (13), 9079–9085. 10.1021/acs.analchem.0c01265. [DOI] [PMC free article] [PubMed] [Google Scholar]
- Kemper P. R.; Dupuis N. F.; Bowers M. T. A new, higher resolution, ion mobility mass spectrometer. Int. J. Mass Spectrom. 2009, 287 (1), 46–57. 10.1016/j.ijms.2009.01.012. [DOI] [Google Scholar]
- Shvartsburg A. A.; Smith R. D. Fundamentals of traveling wave ion mobility spectrometry. Anal. Chem. 2008, 80 (24), 9689–99. 10.1021/ac8016295. [DOI] [PMC free article] [PubMed] [Google Scholar]
- Masson A.; Kamrath M. Z.; Perez M. A. S.; Glover M. S.; Rothlisberger U.; Clemmer D. E.; Rizzo T. R. Infrared Spectroscopy of Mobility-Selected H+-Gly-Pro-Gly-Gly (GPGG). J. Am. Soc. Mass Spectrom. 2015, 26 (9), 1444–1454. 10.1007/s13361-015-1172-4. [DOI] [PubMed] [Google Scholar]
- Hashimoto Y.; Waki I.; Yoshinari K.; Shishika T.; Terui Y. Orthogonal trap time-of-flight mass spectrometer using a collisional damping chamber. Rapid Commun. Mass Spectrom. 2005, 19 (2), 221–6. 10.1002/rcm.1781. [DOI] [PubMed] [Google Scholar]
- Hoaglund C. S.; Valentine S. J.; Sporleder C. R.; Reilly J. P.; Clemmer D. E. Three-dimensional ion mobility/TOFMS analysis of electrosprayed biomolecules. Anal. Chem. 1998, 70 (11), 2236–42. 10.1021/ac980059c. [DOI] [PubMed] [Google Scholar]
- Goebbert D. J.; Wende T.; Bergmann R.; Meijer G.; Asmis K. R. Messenger-Tagging Electrosprayed Ions: Vibrational Spectroscopy of Suberate Dianions. J. Phys. Chem. A 2009, 113 (20), 5874–5880. 10.1021/jp809390x. [DOI] [PubMed] [Google Scholar]
- Masellis C.; Khanal N.; Kamrath M. Z.; Clemmer D. E.; Rizzo T. R. Cryogenic Vibrational Spectroscopy Provides Unique Fingerprints for Glycan Identification. J. Am. Soc. Mass Spectrom. 2017, 28 (10), 2217–2222. 10.1007/s13361-017-1728-6. [DOI] [PMC free article] [PubMed] [Google Scholar]
- Struwe W. B.; Baldauf C.; Hofmann J.; Rudd P. M.; Pagel K. Ion mobility separation of deprotonated oligosaccharide isomers – evidence for gas-phase charge migration. Chem. Commun. 2016, 52 (83), 12353–12356. 10.1039/C6CC06247D. [DOI] [PubMed] [Google Scholar]
- Stow S. M.; Causon T. J.; Zheng X.; Kurulugama R. T.; Mairinger T.; May J. C.; Rennie E. E.; Baker E. S.; Smith R. D.; McLean J. A.; Hann S.; Fjeldsted J. C. An Interlaboratory Evaluation of Drift Tube Ion Mobility–Mass Spectrometry Collision Cross Section Measurements. Anal. Chem. 2017, 89 (17), 9048–9055. 10.1021/acs.analchem.7b01729. [DOI] [PMC free article] [PubMed] [Google Scholar]
- Causon T. J.; Hann S. Uncertainty Estimations for Collision Cross Section Determination via Uniform Field Drift Tube-Ion Mobility-Mass Spectrometry. J. Am. Soc. Mass Spectrom. 2020, 31 (10), 2102–2110. 10.1021/jasms.0c00233. [DOI] [PubMed] [Google Scholar]
- Cordella C. B. Y.PCA: The Basic Building Block of Chemometrics. In Analytical Chemistry; Krull I. S., Ed.; IntechOpen: London, 2012. [Google Scholar]
- Pedregosa F.; Varoquaux G.; Gramfort A.; Michel V.; Thirion B.; Grisel O.; Blondel M.; Prettenhofer P.; Weiss R.; Dubourg V.; Vanderplas J.; Passos A.; Cournapeau D.; Brucher M.; Perrot M.; Duchesnay E. Scikit-learn: Machine Learning in Python. J. Mach. Learn. Res. 2011, 12, 2825–2830. [Google Scholar]
- Lorenz U. J.; Rizzo T. R. Planar multipole ion trap/time-of-flight mass spectrometer. Anal. Chem. 2011, 83 (20), 7895–901. 10.1021/ac201790d. [DOI] [PubMed] [Google Scholar]
- Dyukova I.; Carrascosa E.; Pellegrinelli R. P.; Rizzo T. R. Combining Cryogenic Infrared Spectroscopy with Selective Enzymatic Cleavage for Determining Glycan Primary Structure. Anal. Chem. 2020, 92 (2), 1658–1662. 10.1021/acs.analchem.9b04776. [DOI] [PubMed] [Google Scholar]
Associated Data
This section collects any data citations, data availability statements, or supplementary materials included in this article.


