

Abstract
The BRCA1–BARD1 tumour suppressor is an E3 ubiquitin ligase necessary for the repair of DNA double-strand breaks by homologous recombination1–10. The BRCA1–BARD1 complex localizes to damaged chromatin after DNA replication and catalyses the ubiquitylation of histone H2A and other cellular targets11–14. The molecular bases for the recruitment to double-strand breaks and target recognition of BRCA1–BARD1 remain unknown. Here we use cryo-electron microscopy to show that the ankyrin repeat and tandem BRCT domains in BARD1 adopt a compact fold and bind to nucleosomal histones, DNA and monoubiquitin attached to H2A amino-terminal K13 or K15, two signals known to be specific for double-strand breaks15,16. We further show that RING domains17 in BRCA1–BARD1 orient an E2 ubiquitin-conjugating enzyme atop the nucleosome in a dynamic conformation, primed for ubiquitin transfer to the flexible carboxy-terminal tails of H2A and variant H2AX. Our work reveals a regulatory crosstalk in which recognition of monoubiquitin by BRCA1–BARD1 at the N terminus of H2A blocks the formation of polyubiquitin chains and cooperatively promotes ubiquitylation at the C terminus of H2A. These findings elucidate the mechanisms of BRCA1–BARD1 chromatin recruitment and ubiquitylation specificity, highlight key functions of BARD1 in both processes and explain how BRCA1-BARD1 promotes homologous recombination by opposing the DNA repair protein 53BP1 in post-replicative chromatin18–22. These data provide a structural framework to evaluate BARD1 variants and help to identify mutations that drive the development of cancer.
Missense mutations in breast cancer susceptibility protein 1 (BRCA1) and its obligate binding partner BRCA1-associated RING domain protein (BARD1) have been linked to familial breast and ovarian cancers and to sporadic cancers of various origins1–5. BRCA1 and BARD1 heterodimerize through their N-terminal RING domains17,23, conferring E3 ubiquitin ligase activity24–26. The BRCA1–BARD1 complex has several known cellular targets10, but the structural bases for substrate recognition and ubiquitylation specificity are unknown. This lack of mechanistic insight has hampered our understanding of the molecular functions of BRCA1–BARD1 and of how mutations in BRCA1 and BARD1 relate to cancer susceptibility. However, there is compelling evidence that the antitumorigenic properties of BRCA1–BARD1 mainly stem from the involvement of the complex in the repair of DNA double-strand breaks (DSBs) and in the maintenance of the replication fork6–10. During chromosome replication, BRCA1–BARD1 promotes homologous recombination by opposing the homologous recombination inhibitor p53-binding protein 1 (53BP1)18–22. 53BP1 is recruited to DSBs by binding to the DNA damage-dependent ubiquitylated K15 of histone H2A (H2AK15ub)27,28 and dimethylated K20 of histone H4 (H4K20me2)29. The E3 ligase RNF168 ubiquitylates H2A on both K13 and K15 (refs.15,16). The recruitment of BRCA1–BARD1 to DSBs also depends on the ubiquitin ligase activity of RNF168 (refs. 30,31) by an unknown mechanism and on the recognition of newly synthesized unmodified histone H4K20 (H4K20me0) incorporated into chromatin during DNA replication11,12,32.
Specific ubiquitylation of nucleosomal H2A
BRCA1–BARD1 catalyses ubiquitin transfer from the E2 ubiquitin-conjugating enzyme UbcH5c (also known as UBE2D3) to three lysine residues (K125, K127 and K129) in the C-terminal tail of H2A in the nucleosome core particle (NCP)13,14. These modifications are associated with the eviction of 53BP1 from chromatin14. The RING domains of BRCA1 (residues 1–100) and BARD1 (residues 26–122) are sufficient for E3 ligase activity13, so we used these domains (referred to as BRCA1R and BARD1R) to investigate the ubiquitylation of nucleosomal H2A.
We used nuclear magnetic resonance (NMR) spectroscopy to monitor in real time the ubiquitylation by BRCA1R–BARD1R, UbcH5c and the E1 ubiquitin-activating enzyme, UBA1, of the NCP assembled with 15N-labelled H2A–H2B. The 1H–15N heteronuclear single quantum coherence NMR spectra displayed progressive disappearance of signals assigned to H2A K125, K127 and K129, or nearby residues, indicating that the lysines were being ubiquitylated (Extended Data Fig. 1a). There was no marked decrease in signal intensities for other amino acids in the H2A tail, defined as amino acids 118–129 for which, owing to conformational disorder, signals are detectable in the NMR spectra. Lack of signal for a given residue implies that it belongs to the slow-tumbling, folded region of the more than 200 kDa NCP. Using mutagenesis, we confirmed that BRCA1R–BARD1R catalyses the specific monoubiquitylation of H2A K125, K127 and K129 in vitro (Extended Data Fig. 1b).
Structure of BRCA1R–BARD1R–UbcH5c–NCP
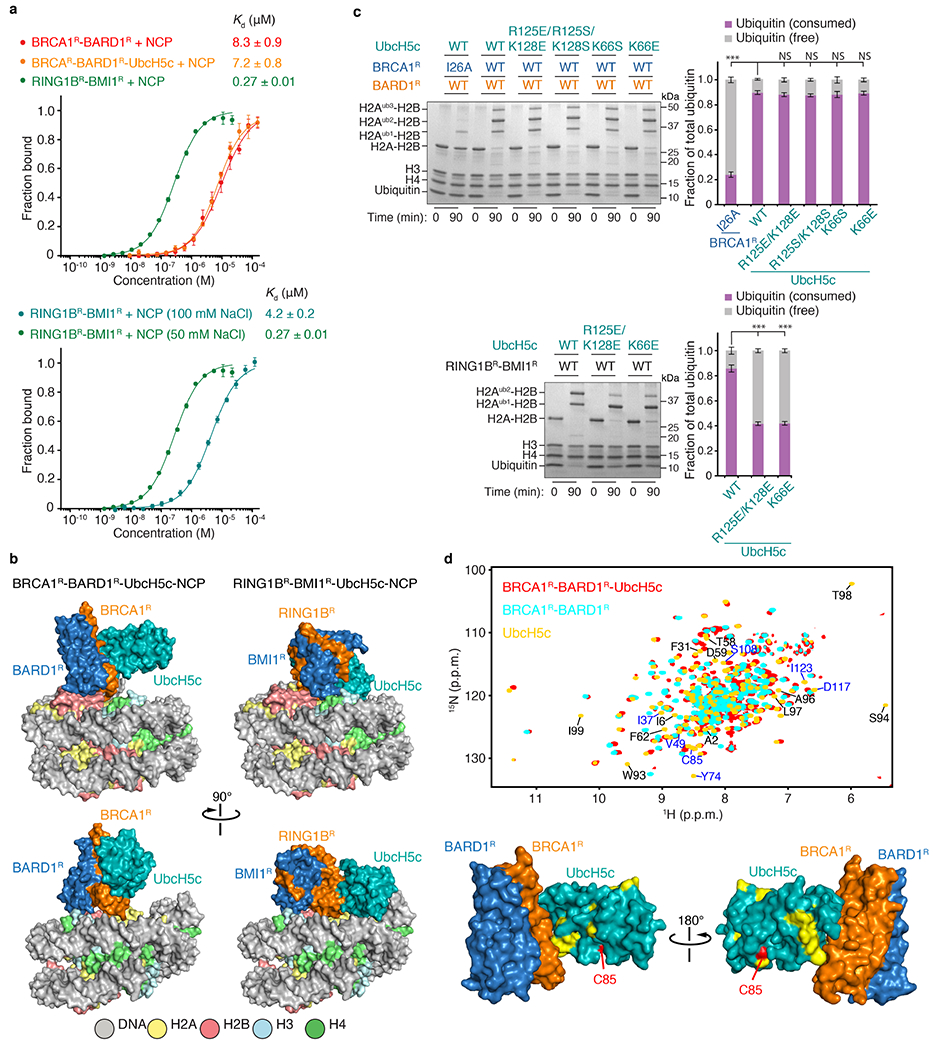
The binding of BRCA1R–BARD1R to the NCP is weak, with a dissociation constant (Kd) of approximately 8 μM (Fig. 1a). To enhance the productive encounter of enzyme and substrate and thereby facilitate structural studies, we assembled a complex in which BRCA1R–BARD1R–UbcH5c is flexibly tethered to the NCP. This complex was functional for site-specific NCP ubiquitylation (Fig.1b) and could be characterized using single-particle cryo-electron microscopy (cryo-EM) (Fig. 1c, Extended Data Fig. 2a). We determined the 3D structure from a 3.28 Å resolution density map (Extended Data Fig. 3a–e, Extended Data Table 1). The BRCA1R, BARD1R, UbcH5c and NCP components were readily seen: BRCA1R and BARD1R form a heterodimer that interacts with the NCP, and UbcH5c interacts with BRCA1R (Fig. 1c, Extended Data Fig. 3f–h). Complex formation does not alter the conformation of the NCP, the apo cryo-EM structure of which we determined to a resolution of 2.91 Å (Extended Data Fig. 2a, Extended Data Table 1).
Fig. 1 |. Cryo-EM structure of the BRCA1R–BARD1R–UbcH5c–nucleosome complex.
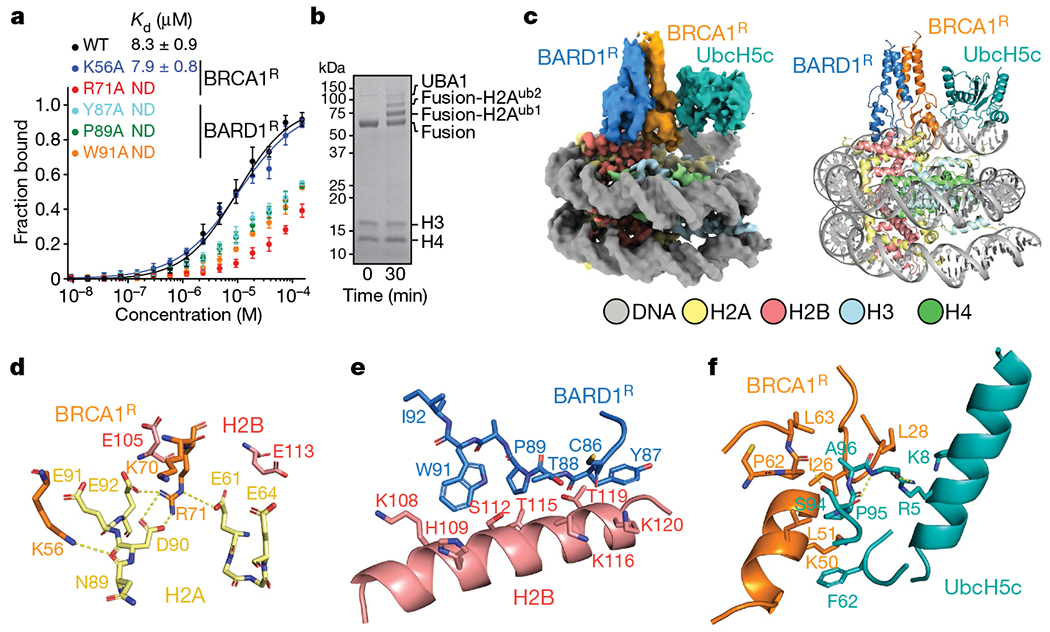
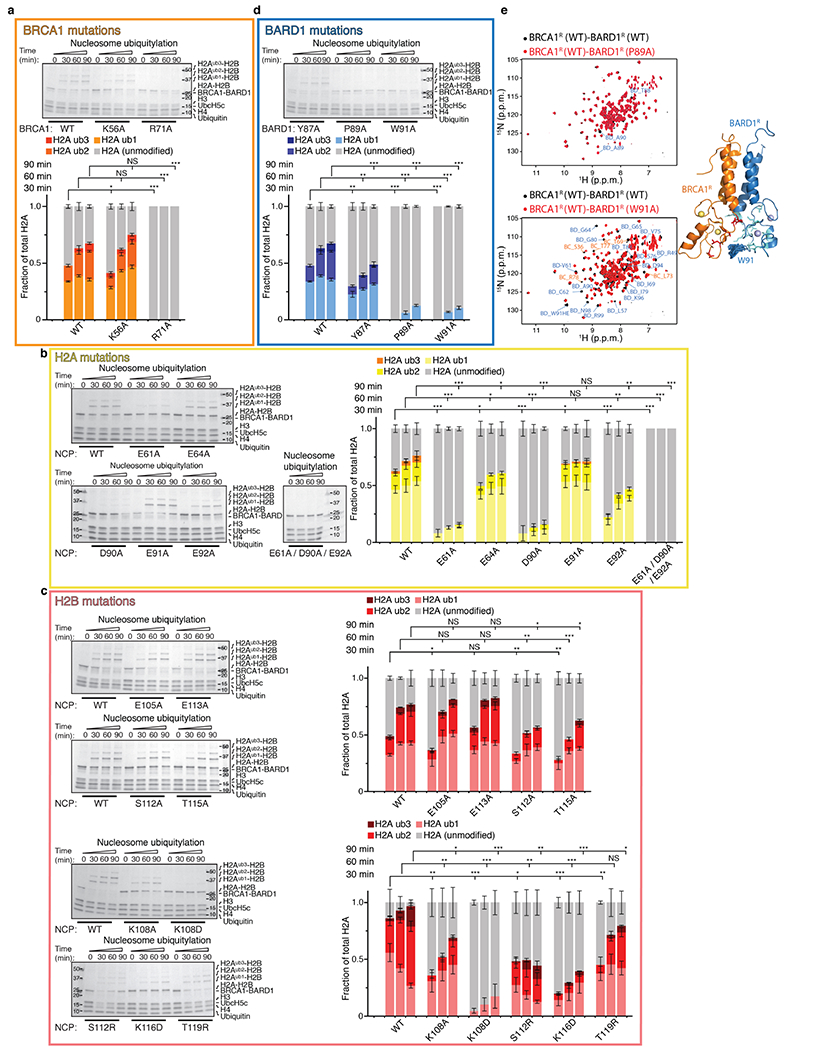
a, Fluorescence polarization binding curves for BRCA1R–BARD1R, wild type (WT) and with the indicated mutations in BRCA1R or BARD1R, added to fluorescently labelled NCP. Data are mean ± s.d. for each data point (n = 3 independent experiments). Kd values are indicated. ND, not determined. b, Representative Coomassie-stained gel readout of n = 2 independent ubiquitylation reactions carried out with UBA1 and the BRCA1R–BARD1R–UbcH5c–NCP complex (labelled as Fusion) used for 3D structure determination. For gel source data, see Supplementary Fig. 1. c, Cryo-EM density map (left) and structure (right) of the BRCA1R–BARD1R–UbcH5c–NCP complex. d-f, Close-up views of the contacts between BRCA1R and the H2A–H2B acidic patch in the NCP (d); BARD1R and histone H2B (e); and BRCA1R and UbcH5c (f). Relevant side chains and polar contacts identified using PyMol (yellow dashes) are highlighted.
The BRCA1R–BARD1R conformation modelled in the cryo-EM density is similar to the previously determined BRCA1R–BARD1R NMR structure17, with an average root-mean-square deviation (r.m.s.d.) of 2.0 Å over all backbone atoms of the NMR conformers. BRCA1R and BARD1R bind to each other through the hydrophobic core of a four-helix bundle formed from two α-helices in both BRCA1R (residues 8–22 and 81–96) and BARD1R (residues 36–48 and 101–116) (Extended Data Fig. 3g). The Zn2+-binding regions of BRCA1R (residues 23–76) and BARD1R (residues 49–100) flank the helical bundle and point towards the surface of the NCP.
Both BRCA1R and BARD1R contact the NCP, burying 291 Å2 and 324 Å2 of solvent-accessible surfaces, respectively (Fig. 1c). BRCA1R binds to the NCP mainly through R71, which is surrounded by H2A E61, E64, D90, E91 and E92, and H2B E105 and E113, seven of the residues in the NCP acidic patch33 (Fig. 1d, Extended Data Fig. 3h). The guanidium group of R71 forms salt bridges with the carboxylate groups of H2A E61, D90 and E92 (Fig. 1d). As expected, the BRCA1R R71A mutation inhibited the interaction of BRCA1R–BARD1R with the NCP (Fig. 1a) and abolished ubiquitylation of H2A (Extended Data Fig. 4a). Likewise, the single-point H2A E61A, D90A and E92A NCP mutants exhibited reduced H2A ubiquitylation, whereas the triple-mutant E61A/D90A/E92A was not ubiquitylated (Extended Data Fig. 4b). The H2A E64A and E91A NCP mutants retained significant ubiquitylation (Extended Data Fig. 4b), which was expected as the carboxylate group of E64 is distal and the carboxylate group of E91 points away from R71 (Fig. 1d). The H2B E105A and E113A NCP mutants behaved almost like the wild-type NCP for ubiquitylation (Extended Data Fig. 4c). This was also expected as the side chain of E105 faces away from R71 and the side chain of E113 is farther from R71 than any of the other acidic patch residues (Fig. 1d). The BRCA1R K56 ε-ammonium group forms a putative hydrogen bond to the carbonyl of H2A N89, but the K56A mutant retained wild-type affinity and only slightly diminished the ubiquitylation activity (Fig. 1a, Extended Data Fig. 4a).
BARD1R contributes to the orientation of BRCA1R–BARD1R–UbcH5c relative to the NCP via an extended segment (residues 87–91) that interacts with the last α-helix of H2B (residues 104–123) (Fig. 1e, Extended Data Fig. 3h). There are van der Waals contacts between paired BARD1R–H2B residues Y87–T119/K120, T88–K116, P89–T115 and W91–K108/S112, which explains the decreased affinities (Fig. 1a) and H2A ubiquitylation activities (Extended Data Fig. 4d) of the Y87A, P89A and W91A BARD1R mutants. The P89A and W91A mutations do not affect the BRCA1R–BARD1R fold (Extended Data Fig. 4e). Similarly, H2A ubiquitylation was diminished when the NCP had the H2B mutations K108A, K108D, S112A, S112R, T115A, K116D or T119R (Extended Data Fig. 4c).
In the BRCA1R–BARD1R–UbcH5c–NCP structure, UbcH5c interacts only with BRCA1R and not with the NCP core (Fig. 1c). In agreement, BRCA1R–BARD1R and BRCA1R–BARD1R–UbcH5c have similar affinities for the NCP (Extended Data Fig. 5a). The BRCA1R–UbcH5c binding interface is canonical and centred on the UbcH5c S94-P95-A96 motif34. P95 contacts BRCA1R I26 in the first Zn2+-binding loop and L51 in the RING motif central helix, and A96 is close to P62 and L63 in the second Zn2+-binding loop (Fig. 1f).
A comparison of the BRCA1R–BARD1R–UbcH5c–NCP and RING1BR–BMI1R–UbcH5c–NCP34 complexes (Extended Data Fig. 5a–c) highlights how their markedly different NCP-binding modes determine distinct ubiquitylation specificities, as discussed in the Supplementary Text.
Molecular flexibility drives ubiquitylation
Owing to conformational flexibility, UbcH5c has the least defined cryo-EM density in the BRCA1R–BARD1R–UbcH5c–NCP complex (Extended Data Fig. 3a). UbcH5c undergoes large-amplitude hinge motions around its interface with BRCA1R, with approximately 10 Å deviations for active site C85, perpendicular and parallel to the NCP circular surface as shown by 3D variability analysis35 (Supplementary Video 1) and multibody refinement with principal component analysis36 (Extended Data Fig. 2b, Supplementary Video 2) of the cryo-EM data. Further evidence of flexibility at the BRCA1R–UbcH5c interface comes from NMR data indicative of microsecond-to-millisecond timescale motion (Extended Data Fig. 5d). BRCA1R–BARD1R also undergoes rigid-body motions with respect to the NCP surface, amplifying the conformational space accessible to UbcH5c (Extended Data Fig. 2b, Supplementary Video 2). We note that the conformational flexibility of BRCA1R–BARD1R–UbcH5c–NCP highlighted in our work is consistent with a recent publication80, giving us confidence that the structures and interactions revealed in the two studies are relevant.
The dynamic fluctuations of UbcH5c and substrate NCP probably contribute to the ubiquitylation mechanism. The C-terminal H2A tail is disordered (Extended Data Fig. 1a), and together with highly mobile UbcH5c define a ubiquitylation-proficient volume within which ubiquitin-loaded C85 of UbcH5c can transiently encounter and transfer ubiquitin to an acceptor lysine in the NCP. Simulation of this conformational flexibility (Extended Data Fig. 1c) predicted that only H2A K125, K127 and K129 could be ubiquitylated. These were the residues modified by UbcH5c and BRCA1R–BARD1R13 (Extended Data Fig. 1a, b).
If correct, the ubiquitylation mechanism described above for nucleosomal H2A should also apply to H2AX. In response to DSBs, phosphorylation of H2AX at S139 (γH2AX) and ubiquitylation at K13 and K15 determine the chromatin recruitment of several DNA damage response proteins, including 53BP1. H2A and H2AX mainly differ in their C-terminal tails, which, when aligned, showed only four conserved residues that included H2AX K118, K119 and K127 (Extended Data Fig. 1d). Our simulations predicted that only H2AX K127, K133 and K134 would be modified by UbcH5c and BRCA1R–BARD1R (Extended Data Fig. 1c). Using NMR spectroscopy and mutagenesis, we confirmed that these three lysines were selectively ubiquitylated in vitro (Extended Data Fig. 1d, e). We determined that an NCP reconstituted with γH2AX was likewise efficiently ubiquitylated (data not shown).
BRCA1 and γH2AX colocalize in cells after introduction of DSBs and γH2AX is ubiquitylated, but at an unknown site (or sites)25,37. That BRCA1-BARD1 can catalyse ubiquitin conjugation to H2AX at one site (K127) coincidental in H2A, and two sites (K133 and K134) different from those in H2A, alludes that, as for H2A K127, ubiquitylation may contribute to the displacement of 53BP1 from γH2AX-containing chromatin to promote homologous recombination DNA repair14.
BARD1 recognizes H2AK13ubK15ub in the NCP
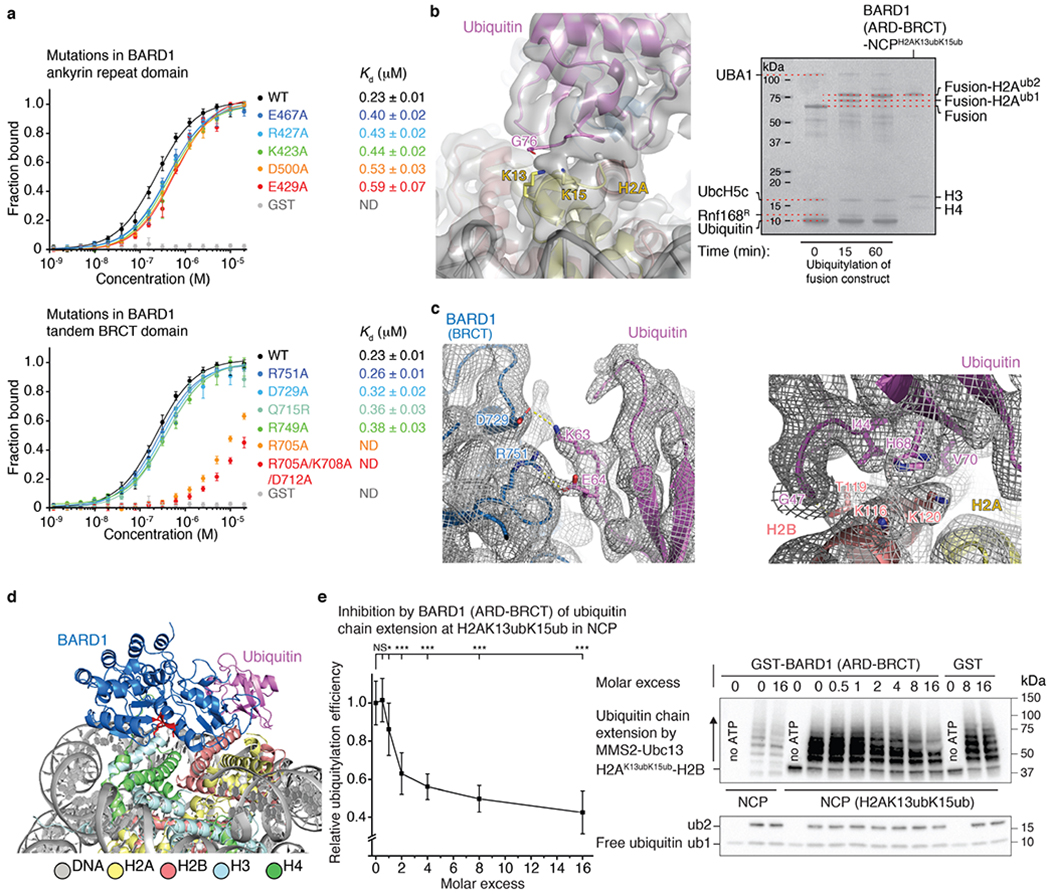
The ubiquitylation of nucleosomal H2A by BRCA1–BARD1 is dependent on DNA damage, but the molecular underpinning of BRCA1–BARD1 chromatin recruitment, which requires the E3 ligase activity of RNF168, is not known. As BARD1 is essential for the chromatin localization of BRCA1–BARD1 (ref. 11), and as the only other folded regions of BARD1 downstream of the RING domain are an ankyrin repeat domain (ARD) and a tandem BRCT domain, we used single-particle cryo-EM to probe the interaction of BARD1 (residues 415–777) encompassing the ARD and tandem BRCT domain (BARD1AB) with the NCP ubiquitylated at H2A K13 and K15 by RNF168 (Extended Data Fig. 6). The structure, with a resolution of 2.94 Å (Fig. 2, Extended Data Figs. 6–8, Extended Data Table 1), revealed several unexpected features for BARD1AB, which binds to the H2AK13ubK15ub-bearing NCP (NCPH2AK13ubK15ub) with a Kd of approximately 0.2 μM (Extended Data Fig. 9a).
Fig. 2 |. Cryo-EM structure of BARD1 (ARD-BRCT) in complex with the nucleosome ubiquitylated at H2A K13 and K15.

a, Cryo-EM reconstruction of BARD1 (ARD–BRCT) in complex with the NCP bearing H2AK13ubK15ub presented in two orientations. A linked construct was used for structure determination as detailed in the Methods. b, Structure of the complex in a.
In solution, the BARD1 ARD and tandem BRCT domain, which are flexibly connected, behave independently38, but in the NCP, they interact in a V-shape conformation (Figs. 2, 3a). The ARD binds to the second BRCT domain through van der Waals or polar interactions via paired residues K457–L667, L486–Q666, T489–L667, T490–L668, T490–P669, N494–D673, N494–P669, I525–V720 and F526–N718 (Fig. 3b). The second BRCT domain also contacts the only ubiquitin molecule detected in the cryo-EM density (Figs. 2, 3a). The density is compatible with both K13-linked or K15-linked ubiquitin, suggesting binding exchange involving the two ubiquitin molecules (Extended Data Fig. 9b).
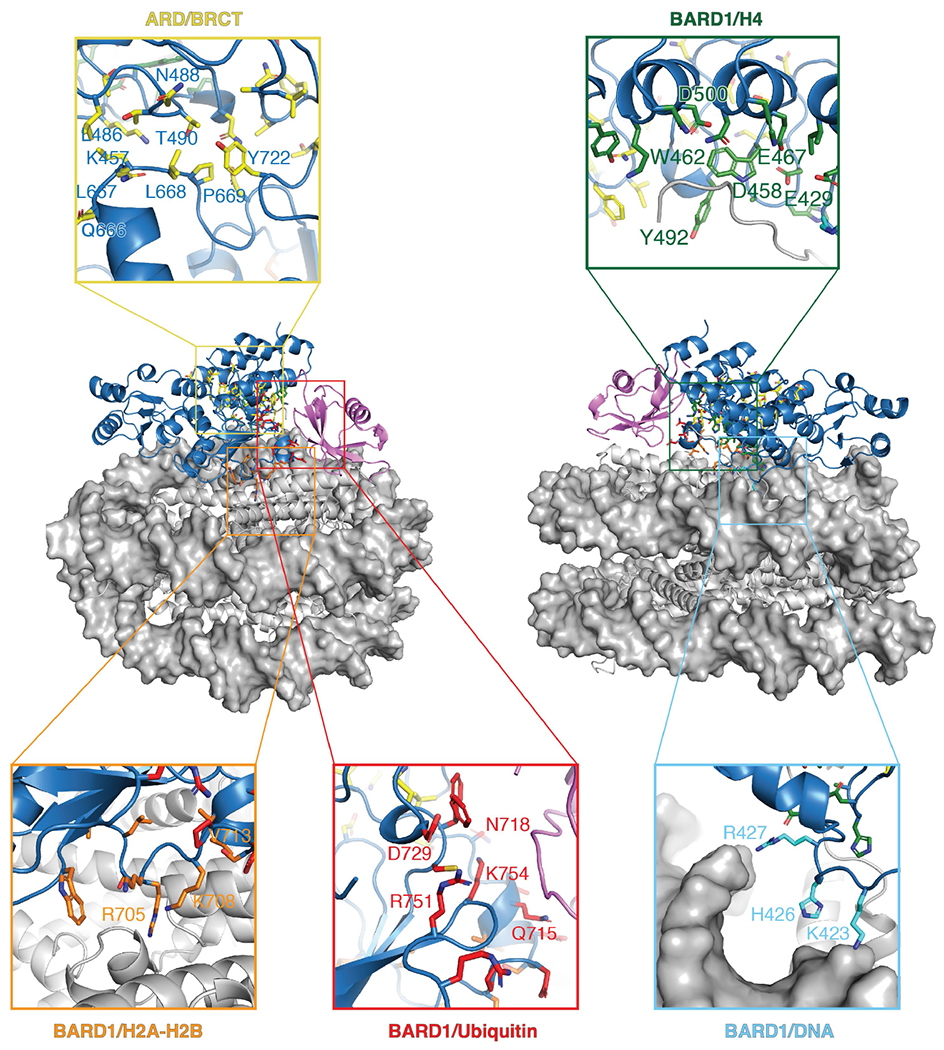
Fig. 3 |. Intramolecular and intermolecular interfaces in the cryo-EM structure of BARD1 bound to the nucleosome ubiquitylated at H2A K13 and K15.
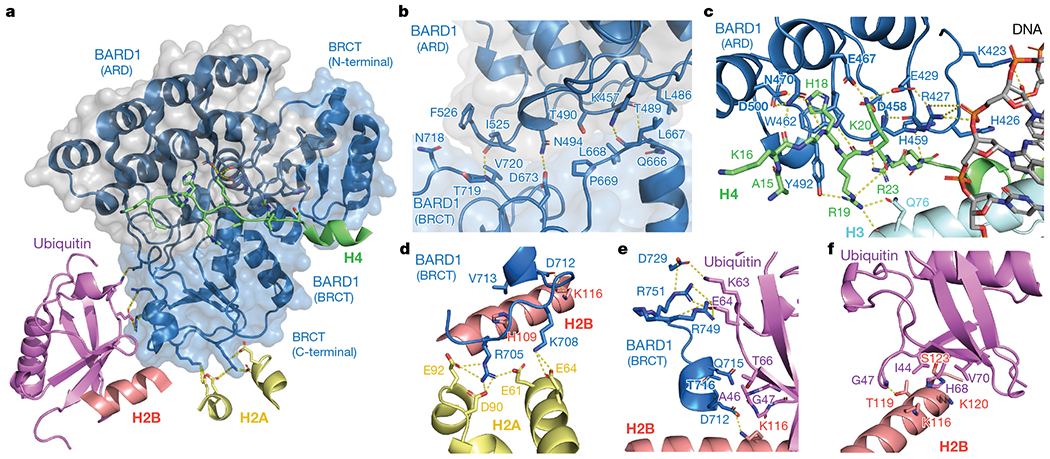
a, Overview of the interactions of BARD1 with histone proteins and ubiquitin in the NCP context. BARD1 ARD and tandem BRCT domain are differentiated by grey and blue surfaces, respectively. b–f, Close-up views of the contacts between BARD1 (BRCT) and BARD1 (ARD) (b); BARD1 (ARD) and H4/DNA (c); BARD1 (BRCT) and the H2A–H2B acidic patch (d); BARD1 (BRCT) and ubiquitin/H2B (e); and ubiquitin and H2B (f). Relevant side chains and polar contacts identified using PyMol (yellow dashes) are highlighted.
As predicted11, ARD interacts with the N-terminal tail of H4, which is well ordered from A15 to R23 (Fig. 3c). The most extensive interaction is with H4K20me0, which sits in an acidic cavity formed by the carboxylate groups of ARD E429, D458 and E467, which all form salt bridges with the ε-ammonium group of H4 K20. The side chain of H4 K20 also contacts ARD W462. Other key interface residues are H4 H18, R19 and R23. The side chain of H4 H18 contacts the indole of ARD W462 and forms hydrogen bonds with the carboxylate groups of ARD E467 and E500. The guanidinium groups of H4 R19 and R23 are hydrogen-bonded to the hydroxyl and carbonyl groups of ARD Y492 and H459, respectively. Moreover, there are stabilizing interactions between the guanidinium group of H4 R19 and the carbonyl and amide groups of H3 Q76 (Fig. 3c). Finally, the side chains of BARD1 ARD K423, H426 and R427 are in close vicinity to DNA (Fig. 3c). The increase in Kd was approximately twofold for mutations in the ARD targeting H4-binding residues (E429A, D500A or E467A) or DNA-binding residues (K423A or R427A) (Extended Data Fig. 9a).
The second BRCT domain of BARD1 binds to the NCP surface (Fig. 3a, d, e). BRCT R705 forms salt bridges with the carboxylate groups of H2A E61, D90 and E92 in the NCP acidic patch (Fig. 3d). BRCT K708 is hydrogen-bonded to the carboxylate group of H2A E64 (Fig. 3d). In a 310 helix (residues 712–716) of the BARD1 BRCT domain, the carboxylate of D712 forms an electrostatic interaction with H2B K116, and V713 interacts with H109 in the last α-helix of H2B (Fig. 3d, e). The acidic patch-binding residues contribute the most to the affinity of ARD–BRCT for NCPH2AK13ubK15ub. The R705A mutation resulted in at least 40-fold increase in Kd and even higher for the triple mutant R705A/K708A/D712A (Extended Data Fig. 9a). Mutating R705 and D712 was recently shown to sensitize cells to inhibition of poly(ADP-ribose) polymerase, implying that these residues are critical for homologous recombination DNA repair32.
One face of the 310 helix in BARD1AB is also close in space to ubiquitin, with BRCT Q715 and T716 contacting ubiquitin T66 and A46, respectively (Fig. 3a, e). There are also salt bridges involving BRCT R749 and R751 guanidinium groups and the carboxylate of ubiquitin E64, and BRCT D729 and the ammonium group of ubiquitin K63 (Fig. 3e, Extended Data Fig. 9c). Mutations (Q715R, R749A or D729A) in BARD1AB that were expected to affect ubiquitin recognition in NCPH2AK13ubK15ub increased the Kd by approximately 1.5-fold (Extended Data Fig. 9a).
Recognition of the ubiquitylated NCP represents a new function for tandem BRCT domains, which are known to bind to phosphopeptide motifs. BARD1 has putative phosphate-binding residues that are solvent accessible in the NCP complex (Extended Data Fig. 9d) and could therefore be of functional importance. It was suggested that BARD1 might bind to poly(ADP-ribose) in chromatin39, but the role of such an interaction remains unclear11,40.
BARD1 blocks ubiquitin chain extension
In the structure of NCPH2AK13ubK15ub bound to BARD1AB, the ubiquitin conformation is stabilized by direct interaction with the NCP (Fig. 3a, f, Extended Data Fig. 9c). The surface centred on ubiquitin I44 and which includes G47, H68 and V70 contacts the last helix of H2B, with I44 interacting with H2B T119, H68 with H2B K116 and K120, V70 with H2B S123, and the carbonyl of G47 forming a hydrogen bond with the hydroxyl of H2B T119 (Fig. 3f). This arrangement is surprising as I44 and the surrounding ubiquitin residues constitute the primary binding site for many ubiquitin-binding proteins including 53BP1 (ref. 28) and the enzyme MMS2–Ubc13 that catalyses polyubiquitin chain extension via K63 (Ub(K63))41.
Such an unusual ubiquitin-binding mode offers a clue to a possible regulatory mechanism for homologous recombination. With BARD1 and the NCP blocking ubiquitin K63 and I44, respectively, chain formation of Ub(K63) could be restricted. An important BRCA1-containing complex involved in the regulation of DNA repair, ARISC, is recruited to DNA damage sites in an RNF168-dependent manner through the RAP80 subunit, which specifically binds to di-ubiquitin in Ub(K63)30,31,42–44. Among other functions, ARISC limits DNA repair by homologous recombination45,46. Sequestration of monoubiquitin in the NCP by BARD1 may therefore reinforce homologous recombination during DNA replication. We verified in vitro that BARD1AB inhibited Ub(K63) polyubiquitin chain extension by MMS2–Ubc13 on NCPH2AK13ubK15ub (Extended Data Fig. 9e).
H2AK13ubK15ub promotes distal NCP ubiquitylation
We have shown that BRCA1R–BARD1R and BARD1AB independently bind to the NCP with low affinity (Fig. 4a). However, these domains in complete proteins may function cooperatively. The 292-residue linker in BARD1 that tethers the RING and ARD–BRCT domains is long enough to position these domains on opposite sides of the NCP (Fig. 4b). On one side, ARD–BRCT would recognize newly synthesized H4K20me0, the H2A–H2B acidic patch and DNA damage-dependent H2AK13ub or H2AK15ub marks. On the other side, BRCA1–BARD1 RING domains would efficiently catalyse the ubiquitylation of lysine residues in the C-terminal tails of H2A and H2AX. Supporting such a multivalent NCP recognition model, a BRCA1R–BARD1Long construct encompassing almost full-length BARD1 (residues 26–777) displayed significantly increased affinity for the NCP and NCPH2AK13ubK15ub with a Kd of approximately 60 nM and approximately 20 nM, respectively (Fig. 4a). BRCA1R–BARD1Long was also more efficient in ubiquitylating the NCP at the three C-terminal lysine residues, and even more when the NCP was already ubiquitylated at H2A K13 and K15 (Fig. 4c). The combinatorial binding mode demonstrated here at the level of a single NCP may also apply to adjacent NCPs in chromatin with ARD–BRCT and BRCA1R–BARD1R binding different NCP units. Even if parental and newly synthesized H3–H4 tetramers are not combined within the same NCP after replication47, docking of BARD1 ARD–BRCT on a new, H4K20me0-bearing NCP would still allow efficient ubiquitylation of the C-terminal tail of H2A of an adjacent H4K20me2-bearing NCP.
Fig. 4 |. BRCA1–BARD1 multivalent recognition of the NCP ubiquitylated at the H2A N terminus promotes NCP ubiquitylation at the H2A C terminus.
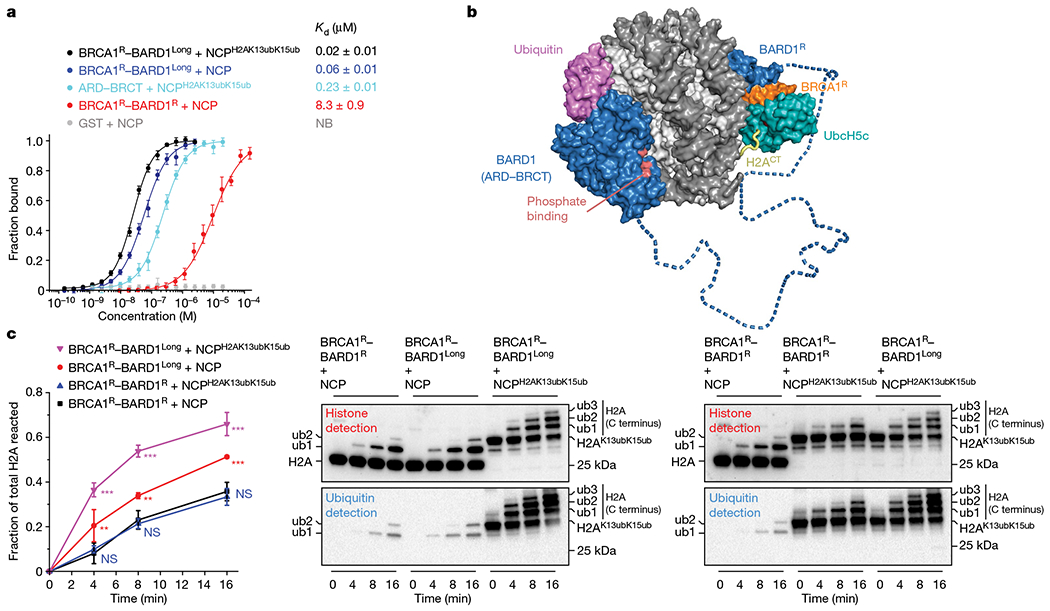
a, Affinities of the indicated BRCA1–BARD1 constructs, GST-tagged BARD1 (ARD–BRCT) and GST for fluorescently labelled NCPs, non-ubiquitylated and ubiquitylated at H2A K13 and K15 (NCPH2AK13ubK15ub), determined by fluorescence polarization. Data are mean ± s.d. for each data point (n = 3 independent experiments). Kd values are indicated. NB, no binding. b, Structural model assembled from the cryo-EM structures of the BRCA1R–BARD1R–UbcH5c–NCP complex and BARD1 (ARD–BRCT) bound to NCPH2AK13ubK15ub. The model illustrates a multivalent binding mechanism in which BRCA1R–BARD1R and BARD1 (ARD–BRCT) bind to opposite sides of NCPH2AK13ubK15ub. The BARD1 segment (blue dashed tube) connecting the ARD–BRCT and RING domains is predicted to be disordered. The disordered C-terminal tail of histone H2A (H2ACT; yellow tube) that is ubiquitylated by BRCA1R–BARD1R–UbcH5c and the putative phosphate-binding site (pink) in BARD1 (BRCT) are shown. c, Left, comparison of NCP and NCPH2AK13ubK15ub ubiquitylation by BRCA1R–BARD1R and BRCA1R–BARD1Long. Fractions of total H2A ubiquitylated (at the C terminus) were quantified from band intensities of fused H2A–H2B (non-ubiquitylated and ubiquitylated) in an anti-H2A western blot. Quantification using anti-H2B antibody produced similar results. Data are mean ± s.d. for each point (n = 3 independent experiments). P values were calculated in reference to BRCA1R–BARD1R + NCP ubiquitylation using a two-sample, two-tailed Student t-test; *P < 0.05, **P < 0.01, ***P < 0.001 and not significant (NS). Exact P values are provided in Supplementary Table 1. Right, representative western blot images for the ubiquitylation reactions. Histone and ubiquitin antibodies were used to show starting substrates and ubiquitylated products. For gel source data, see Supplementary Fig. 2.
Discussion
Our results reconcile two seemingly unrelated aspects of BRCA1–BARD1–NCP recognition by linking H2A N-terminal and C-terminal ubiquitylation to provide an explanation for how BRCA1–BARD1 facilitates homologous recombination by antagonizing 53BP1. Post-replicative DNA damage triggers ubiquitylation at the H2A N terminus, which, on the one hand, tightens BRCA1–BARD1 chromatin association and, on the other hand, promotes ubiquitylation at the H2A C terminus. BRCA1–BARD1 interaction with H2AK13ubK15ub and H4K20me0 may prevent chromatin association of 53BP1 by blocking the methylation of H4K20. Ubiquitylation at the H2A C-terminal tail has been shown to recruit the chromatin remodeller SMARCAD1, which opposes the positioning of 53BP1 on NCPs bearing parental histone H4K20me2 and DNA damage-triggered H2AK15ub14. Finally, by precluding the formation of polyubiquitin chains at H2AK13ubK15ub, BRCA1–BARD1 may also oppose the homologous recombination-limiting function of ARISC.
The intramolecular (ARD–BRCT) and intermolecular interfaces revealed in the 3D structure of BARD1AB bound to the ubiquitylated NCP will be of value to assess the possible oncogenicity of BARD1 missense mutations identified in patients with cancer, the vast majority of which are classified as ‘variants of unknown significance’. A non-exhaustive survey of the ClinVar database reporting variants in patients with cancer shows that there are mutations in all of the interfacial regions, including ARD–BRCT, ARD–H4, ARD–DNA, BRCT–H2A, BRCT–H2B and BRCT–ubiquitin (Extended Data Fig. 10). It is possible that several of the mutations that map to the interfaces highlighted in our study perturb the modes of action of BRCA1–BARD1 and contribute to cancer phenotypes.
Online content
Any methods, additional references, Nature Research reporting summaries, source data, extended data, supplementary information, acknowledgements, peer review information; details of author contributions and competing interests; and statements of data and code availability are available at https://doi.org/10.1038/s41586-021-03716-8.
Methods
Cloning
All proteins produced in this study have the human sequences. These proteins include histones H2A and H2B prepared as a fusion of H2A to the C terminus of H2B as previously reported (H2A–H2B)48 and a similar fusion in which H2A is replaced by histone variant H2AX (H2AX–H2B); histone H3; histone H4; UbcH5c; a fusion of BRCA1 (residues 1–100)–BARD1 (residues 26–122) or BRCA1R–BARD1R; and a fusion of BRCA1R–BARD1R and UbcH5c with a 24-residue linker ((GGS)8) between UbcH5c and BRCA1R (BRCA1R–BARD1R–UbcH5c). These proteins all have an N-terminal His6 tag cleavable by human rhinovirus 3C (HRV3C) protease. A fused construct of H2B–H2A–(GGS)6–UbcH5c–(GGS)8–BRCA1R–BARD1R (referred to as BRCA1R–BARD1R–UbcH5c–H2A–H2B) consisting of covalently linked H2B, H2A, UbcH5c and BRCA1R–BARD1R was cloned with an N-terminal His6-maltose-binding protein (His6–MBP) tag that can be cleaved by the tobacco etch virus (TEV) protease. A construct containing the ARD and tandem BRCT domain (residues 415–777) of BARD1 (referred to as BARD1 (ARD–BRCT) or BARD1AB) was cloned with an HRV3C-cleavable N-terminal GST tag and a non-cleavable C-terminal His6 tag. A fused construct of H2B–H2A–(GSGGSGGSGS)–BARD1(residues 415–777) (referred to as BARD1AB–H2A–H2B) was cloned with an N-terminal His6–MBP tag cleavable by the TEV protease. BRCA1 (residues 1–100)–BARD1 (residues 26–777) (referred to as BRCA1R–BARD1Long) was also cloned with an N-terminal His6–MBP tag cleavable by the TEV protease and a non-cleavable C-terminal His6 tag. Other proteins used were ubiquitin (with no tag or with a non-cleavable N-terminal His6 tag), UBA1, R1NG1BR–BMI1R and MMS2–Ubc13, and were cloned as previously reported41,49–52. Mutations to the various constructs were introduced by standard site-directed mutagenesis.
Protein expression and purification
All proteins were expressed in BL21(DE3) Escherichia coli cells. Cells transformed with histones H2A–H2B, H2AX–H2B, H3, H4 or ubiquitin were grown at 37°C in LB or isotope-enriched M9 medium to an OD600 of approximately 0.6 and then induced with 0.5 mM isopropyl β-d-1-thiogalactopyranoside for 3 h. Cells transformed with the other plasmids were grown similarly but induced at 15 °C for approximately 16 h.
Collected cells were lysed using an Emulsiflex C5 homogenizer (Avestin). The H2A–H2B dimer, UBA1, UbcH5c, ubiquitin, RING1BR–BMI1R, MMS2–Ubc13 and the H3–H4 tetramer proteins were purified using published protocols41,48,50–55. Purifications of H2AX–H2B and BRCA1R–BARD1R followed those of H2A–H2B48 and UbcH5c53, respectively.
Both BRCA1R–BARD1R–UbcH5c–H2A–H2B and BARD1AB–H2A–H2B were initially purified by Ni+2-NTA agarose chelation chromatography (Qiagen) using solutions of 50 mM sodium phosphate (NaPi), 1 M NaCl, 5% (v/v) glycerol, pH 7.5, with 5 mM (bind buffer), 20 mM (wash buffer) and 200 mM imidazole (elution buffer). Their His6–MBP tags were cleaved by addition of TEV protease overnight at 4 °C. To separate BRCA1R–BARD1R–UbcH5c–H2A–H2B or BARD1AB–H2A–H2B from His6–MBP, the samples were loaded into a 5 ml HisTrap HP column (GE Healthcare) equilibrated with the bind buffer and then eluted using a gradient of the bind and elution buffers. Proteins of interest eluted at around 20 mM imidazole and were subsequently buffer-exchanged: BRCA1R–BARD1R–UbcH5c–H2A–H2B in 20 mM Tris-HCl, 2 M NaCl, 1 mM dithiothreitol, pH 7.5 (octamer buffer), and BARD1AB–H2A–H2B in 50 mM NaPi, 300 mM NaCl, pH 7.5 (SEC buffer), using centrifugal concentrators (MilliporeSigma). The latter was ubiquitylated at H2A K13 and K15 with UBA1, RNF168 and UbcH5c following a published method48 and then purified by size-exclusion chromatography using a Superdex 200 16/60 column (GE Healthcare) and octamer buffer.
Purification of BRCA1R–BARD1Long was similar to that of BRCA1R–BARD1R–UbcH5c–H2A–H2B and BARD1AB–H2A–H2B, but included an MBPTrap (GE Healthcare) purification before cleavage of the His6–MBP tag, and two passages through a Superose 6 Increase 10/300 GL (GE Healthcare) in SEC buffer before and after the HisTrap HP step. Bind and elution buffers for MBPTrap were 20 mM Tris-HCl, 200 mM NaCl, 1 mM dithiothreitol, pH 7.4, without and with 10 mM maltose, respectively.
GST-tagged BARD1AB was purified through several chromatographic steps: GSTPrep FF 16/10 (GE Healthcare) in 1 × PBS, pH 7.3, without and with 10 mM reduced glutathione; Superdex 200 16/60, 5 ml HisTrap HP, and final Superdex 200. Superdex 200 was run with SEC buffer, while buffers for HisTrap HP are described above.
Nucleosome preparation
To form histone octamers, equimolar amounts of H3–H4 and H2A–H2B or H2AX–H2B or BRCA1R–BARD1R–UbcH5c–H2A–H2B or ubiquity-lated BARD1AB–H2A–H2B were mixed in the octamer buffer and purified using a Superose 6 Increase 10/300 GL column (GE Healthcare) equilibrated with the octamer buffer. To make the NCP complexes, the purified octamers and the 147 bp Widom 601 DNA were combined at equimolar ratios and reconstituted by following a salt gradient dialysis protocol56. The DNA was prepared as previously described57. Nucleosomes reconstituted from H2A–H2B or H2AX–H2B (both referred to as NCP) were then purified using a Superose 6 Increase 10/300 GL column equilibrated with 20 mM Tris-HCl, 1 mM dithiothreitol, pH 7.5 buffer for subsequent ubiquitylation assays. The nucleosomes reconstituted with BRCA1R–BARD1R–UbcH5c–H2A–H2B (referred to as BRCA1R–BARD1R–UbcH5c–NCP) or ubiquitylated BARD1AB–H2A–H2B (referred to as BARD1AB–NCPub) were purified similarly but using 10 mM HEPES, 100 mM NaCl, 1 mM dithiothreitol, pH 7.5 (cryo-EM buffer) for subsequent structural characterization.
Ubiquitylation assays
In a typical ubiquitylation assay, a 50 μl reaction mixture containing 50 mM Tris-HCl, 100 mM NaCl, pH 7.5, 10 mM MgCl2, 1μM ZnCl2, 1 mM TCEP, 1.6–2 μM UBA1, 2 μM UbcH5c, 2 μM BRCA1R–BARD1R, 18 μM ubiquitin and 3 μM H2A–H2B-containing NCP was prepared. Aliquots were taken at t = 0 (before addition of 3 mM ATP) and at t = 30, 60 and 90 min after ATP addition and incubation at 32 °C. For ubiquitylating H2AX–H2B-containing NCPs, time points were t = 0, 5, 10 and 20 min. Aliquots were then mixed with equal volumes of 2 × Laemmli dye. Samples were run on SDS–PAGE gels (4–15% TGX; Bio-Rad) at 200 V for approximately 25 min. Gels were then either immunoblotted or Coomassie-stained and imaged using Alphalmager 2200 with AlphaEaserFC software 3.1.2 (Alpha Innotech).
For comparing the ubiquitylation efficiencies of BRCA1R–BARD1R versus BRCA1R–BARD1Long, 1.6 μM UBA1, 20 μM of ubiquitin and 3 μM of non-ubiquitylated and H2AK13ubK15ub-bearing NCPs were used. Moreover, aliquots were taken at t = 0, 4, 8 and 16 min.
For comparing the ubiquitylation efficiencies of BRCA1R–BARD1R versus RING1BR–BMI1R, using wild type and mutants of UbcH5c and BRCA1R, the following modifications were used: 1.8 μM UBA1, 18 μM ubiquitin and 3.4 μM NCP, and t = 0 and 90 min.
Each time the enzymatic assay was performed on a set of NCP complexes, wild-type NCP was included to serve as a control or reference for comparing ubiquitylation efficiencies. Similarly, in carrying out the assay with the different mutants of BRCA1R–BARD1R or UbcH5c, wild-type counterparts were also included as references. All reactions were done in triplicates.
Inhibition of polyubiquitylation
From a reaction mixture containing 50 mM Tris-HCl, 100 mM NaCl, pH 7.5, 10 mM MgCl2, 1 μM ZnCl2, 1 mM TCEP, 1.6 μM UBA1, 2 μM UbcH5c, 2 μM MMS2–Ubc13, 20 μM ubiquitin and 1 μM non-ubiquitylated and H2AK13ubK15ub-bearing NCPs, several aliquots were taken. One aliquot did not have ATP added, while the others had 2.5 mM ATP and no or increasing concentrations of GST or BARD1AB added. Final buffer conditions were made identical in all aliquots before incubation at 32 °C. After 2 h, the reactions were quenched by adding equal volumes of 2 × Laemmli dye. Samples were run on SDS–PAGE gels (4–15% TGX; Bio-Rad) at 200 V for approximately 25 min. The above reactions were repeated three times.
Western blots
After samples were electrophoresed on an SDS–PAGE gel (4–15% TGX; Bio-Rad), protein bands were transferred onto a nitrocellulose membrane (Trans-Blot Turbo System, Bio-Rad) for western blot analysis. The membrane was blocked with 5% (w/v) non-fat milk in TBST (50 mM Tris-HCl, 150 mM NaCl, pH 7.6, and 0.1% (v/v) Tween 20 for 1 h at room temperature), incubated with primary antibody (1:1,000 dilution in TBST with 1% (w/v) BSA, overnight at 4 °C), washed 5 × 5 min with TBST, incubated with HRP-conjugated secondary antibody (1:5,000 dilution in TBST with 1% (w/v) non-fat milk for 1 h at room temperature), washed 5 × 5 min with TBST, and developed with an ECL reagent for chemiluminescent imaging using a ChemiDoc MP system with Image Lab software 6.0.1 (Bio-Rad). A colorimetric image of pre-stained molecular weight standards (Precision Plus Protein Dual Colour Standards, 161037, Bio-Rad) was also taken and merged with the chemiluminescent image of the same blot for the purpose of estimating the molecular weight of sample protein bands. The following antibodies were used: histone H2B rabbit monoclonal (8135, Cell Signaling Technology), histone H2A rabbit polyclonal (07-146, MilliporeSigma), ubiquitin mouse monoclonal (3936, Cell Signaling Technology), phospho-histone H2AX (Ser139) mouse monoclonal (80312, Cell Signaling Technology), anti-rabbit IgG HRP-linked (172-1019, Bio-Rad) and anti-mouse IgG HRP-linked (7076, Cell Signaling Technology).
Quantification of protein bands
Quantification of bands in Coomassie-stained gels and unmerged chemiluminescent images were performed using ImageJ v.1.53e (NIH). The bands for ubiquitin (single and multiple) and the different species of H2A–H2B or H2AX–H2B, including non-ubiquitylated, mono-ubiquitylated and multi-ubiquitylated, were used for quantification. Initially, rectangles were first placed around these bands. After subtracting background noise, corresponding intensities were then extracted. To determine the total amount of H2A–H2B in each lane, the intensities of the different H2A–H2B species in that lane were added. To calculate the fraction of a particular H2A–H2B species in each lane, its intensity was divided by the summed intensities in that lane. Similarly, the total amount of ubiquitin was calculated from its intensity at t = 0; the fraction of consumed ubiquitin was the ratio of ubiquitin intensities at a certain time over t = 0. For the statistical analysis of the above quantifications, P values were calculated using the two-sample, two-tailed Student t-test in OriginPro 9 (OriginLab). The following designations were used in the figures: *P < 0.05, **P < 0.01, ***P < 0.001 and NS for not significant. Exact P values are reported in Supplementary Table 1.
Fluorescent labelling of the nucleosomes
Two millilitres of a 50 μM purified histone H2A–H2B (unmodified and ubiquitylated at H2A K13 and K15) containing the H2B D51C mutation in SEC buffer was incubated with 0.5 mg (dissolved in 100 μl DMSO) Oregon Green 488 C85 maleimide (Thermo Fisher Scientific) for 2 h at room temperature and then for 1 h at 4 °C. The reaction was stopped by addition of β-mercaptoethanol to a final concentration of 150 mM. Fluorescently labelled H2A–H2B was separated from unreacted dye by size-exclusion chromatography using a Superdex 200 10/300 column (GE Healthcare) and was subsequently used for octamer and NCP reconstitution as described above. Labelling efficiencies for H2A–H2B (or NCPs) were estimated from the absorbances at 280 (or 260) and 498 nm, using an extinction coefficient of 80,000 M−1cm−1 at 498 nm and appropriate correction factors for Oregon Green. A labelling yield of 70–90% was typically obtained for the histone and NCP samples.
Nucleosome-binding assays
For the fluorescence polarization binding assays, wild-type and mutant samples of BRCA1R–BARD1R (0.009–150 μM final concentration range), BRCA1R–BARD1R–UbcH5c (0.009–150 μM final concentration range), BRCA1R–BARD1Long (0.00015–2.5 μM final concentration range), GST-tagged BARD1AB (0.0012–20 μM final concentration range) or GST (0.0012–20 μM final concentration range) were mixed with labelled NCPs (non-ubiquitylated and ubiquitylated at H2A K13 and K15; 5 nM final concentration) in 384-well microplates (Corning). The final mixture had a volume of 20 μl in the fluorescence polarization buffer (20 mM Tris-HCl, pH 7.4, 0.01% (v/v) NP-40 and 0.1 mg/ml BSA) with 50 mM NaCl. Probing the interaction of RING1BR–BMI1R with the NCP was done similarly but using 0.001–22 μM and 0.003–109 μM RING1BR–BMI1R final concentration ranges and fluorescence polarization buffers containing 50 and 100 mM NaCl, respectively. The fluorescence polarization measurements were carried out using a CLARIOstar Plus microplate reader (BMG Labtech) after incubating each microplate at 22 °C for 5 min. Polarization data were converted to fraction bound as previously described58,59. The data were fitted using the quadratic equation:
in which S is the fluorescence polarization signal, Smax and Smin correspond to the maximum and minimum plateaus of the binding curve, Rtot and Ltot correspond to the total concentrations of the nucleosome and binding protein, respectively, and Kd is the dissociation constant. Data processing and Kd determination were done using OriginPro 9 (OriginLab). Each binding curve was obtained using three sets of samples, with each sample set read three times.
As a means of further validation, all the curves were also fitted with the Hill equation:
| (2) |
in which h is the Hill coefficient and L is the total concentration of the binding protein, with all other parameters defined as in the previous equation. All fitted Kd values are very close to those obtained from the quadratic equation, with h values close to 1.
Cryo-EM sample preparation and data collection
Many different conditions were tested to produce optimal cryo-EM samples. The best-quality data were obtained with mild glutaraldehyde crosslinking performed on-column60 at 4 °C. A Superdex 200 Increase 10/300 GL column (GE Healthcare) was first equilibrated with the cryo-EM buffer, and then 500 μl of 0.2–0.5% (v/v) glutaraldehyde (MilliporeSigma) was injected into the column. After passing 6 ml of the cryo-EM buffer at a rate of 0.3 ml/min during which glutaraldehyde gets diluted, the run was stopped. The injection loop was flushed with cryo-EM buffer, and 500 μl of approximately 1 mg/ml BRCA1R–BARD1R–UbcH5c–NCP was injected. The cryo-EM buffer was passed through the column at a flow rate of 0.25 ml/min, and fractions of interest were collected and concentrated to approximately 0.3 mg/ml. Sample quality was assessed on 12% SDS–PAGE and 5% native PAGE. This mild on-column crosslinking was essential for obtaining high-quality cryo-EM data. For BRCA1R–BARD1R–UbcH5c–NCP, we had initially used off-column crosslinking with 0.1% (v/v) glutaraldehyde for 5–15 min at 4 °C, but this led to much poorer-quality cryo-EM density and lower resolution, with repositioning of BRCA1R–BARD1R towards histones H3 and H4. Such structure may represent a low-population conformation trapped by crosslinking of the flexible complex (Supplementary Fig. 7, Supplementary Table 2). These data were not retained for further analysis.
Four microlitres of freshly prepared BRCA1R–BARD1R–UbcH5c–NCP sample was next applied to glow-discharged Holey Cu grids (Quantifoil R 1.2/1.3, 300 mesh; Electron Microscopy Sciences) mounted in the chamber of a Thermo Fisher Scientific FEI Vitrobot Mark IV maintained at 4 °C and 100% humidity. The grids were blotted for 4 s at a blotting force of 0 before freezing in liquid ethane. Cryo-EM data were collected at the Pacific Northwest Cryo-EM Center (PNCC) using a Thermo Fisher Scientific FEI Titan Krios electron microscope operated at 300 kV with a Gatan K3 direct electron detector in super-resolution mode, at a nominal magnification of 22,500 and a pixel size of 0.5155 Å. Data were collected at a nominal dose of 50 e−/Å2 over 50 frames per movie and 1.0 e−/Å2 per frame. In total, 5,490 super-resolution movies were collected. All images were recorded with a defocus in the range of −0.5 and −3.5 μm.
The BARD1AB–NCPub sample was prepared using the same protocol as above. Cryo-EM data of BARD1AB–NCPub were also collected at PNCC using a Thermo Fisher Scientific FEI Titan Krios electron microscope operated at 300 kV with a K3 direct electron detector in super-resolution mode. Data were acquired at a nominal magnification of 22,500, pixel size of 0.51375 Å and nominal dose of 51 e−/Å2 over 59 frames per movie and 0.87 e−/Å2 per frame. A total of 5,051 super-resolution movies were collected. All images were recorded with a defocus in the range of −0.5 and −3.5 μm.
Cryo-EM data processing
Cryo-EM data for BRCA1R–BARD1R–UbcH5c–NCP were processed with cryoSPARC (v2.14)61 and RELION 3.062,63. The movies were first motion-corrected, dose-weighted and binned using the RELION 3.0 implementation of MotionCorr264. The resulting images, with a pixel size of 1.031 Å, were exported to cryoSPARC where a patch-based contrast transfer function (CTF) estimation was then performed. After evaluating the images, 5,245 images were retained for the next steps. From 100 of these images, 53,130 particles were selected and cleaned using blob particle picking, generating 2D references that were used for further template-based particle picking. Using all 5,245 images, a total of 6,380,972 particles were picked, which after clean-up and 2D classification, resulted in a new dataset of 1,185,069 particles. This new dataset was then used for 3D ab initio reconstruction and initial classification. The class with clearly defined nucleosome densities was used for the next round of 3D classification.
The dataset was further cleaned up to exclude those particles with distorted nucleosome densities, generating the next dataset of 383,298 particles with well-defined nucleosome density. Additional rounds of 3D classification generated a clean class of 74,575 particles with well-defined density for BRCA1R, BARD1R and UbcH5c. This latest class was exported to RELION 3.0 where CTF refinement, beamtilt estimation and Bayesian polishing were performed. The class of 74,575 particles was refined to a resolution of 3.28 Å as given by the Fourier shell correlation criterion (FSC 0.143) using non-uniform refinement in cryoSPARC. The shiny particles from RELION 3.0 were used for focused classification without alignment using a mask encompassing BRCA1R, BARD1R and UbcH5c, further reducing the dataset to 30,234 particles. This class of 30,234 particles was refined to 3.4 Å (FSC 0.143). The shiny particles were also exported back to cryoSPARC for further 3D classification, where the best-resolved reconstruction was refined to 3.4 Å (FSC 0.143). The local resolution of the reconstructed map was assessed in RELION 3.0.
Cryo-EM data for BARD1AB–NCPub was processed using cryoSPARC (v2.15). All movies were motion-corrected, dose-weighted and binned using patch-motion correction, to a final pixel size of 1.0276 Å. CTF estimation was also performed. At the outset, 51 images were selected to pick 72,219 particles using blob picker. Initial class averages were calculated for these particles and then used for template-based particle picking on the entire dataset. A total of 6,518,285 particles were picked. After performing 2D classification, 1,399,200 particles were retained. These particles were used to generate three initial reconstructions, the best resolved of which, with 764,879 particles, was next used as a template for 3D classification using heterogeneous refinement. After two rounds of 3D classification, two well-resolved classes of 173,398 and 131,853 particles were produced. Using particles from one (173,398) and both classes (305,251) for further refinement, final resolutions of 3.05 Å and 3.01 Å were achieved (FSC 0.143 criterion). In a parallel processing, the 764,879 particles were further 3D classified yielding 243,883 cleaned particles. This set of particles was used for CTF refinement, beamtilt correction and local refinement, resulting in a final resolution of 2.94 Å. The local resolution of the reconstructed map was assessed in cryoSPARC (v.2.15).
For both datasets, directional Fourier shell correlation curves and density map anisotropy were quantitatively assessed using 3DFSC65.
Model building and validation
To build an initial model of BRCA1R, BARD1R and UbcH5c bound to the NCP, the crystal structure of the human NCP reconstituted with fused H2A–H2B and Widom DNA sequence (G.M., unpublished data), the NMR structure of BRCA1–BARD1 RING domains17 (PDB: 1JM7) and the crystal structure of UbcH5c (PDB: 5EGG) were first rigid-body fitted in the reconstructed density map of BRCA1R–BARD1R–UbcH5c–NCP using PHENIX (v.1.18.2-3874)66. Using COOT (v.0.8.9.2)67, DNA and histone structures were extended in the regions where cryo-EM density allowed. This fitted model was then subjected to iterative local and global real-space refinement in COOT and PHENIX. Restraints were imposed during the refinement to keep the model close to the reference structures. Model-map Fourier shell correlation was calculated using the criterion of 0.5.
The initial model of BARD1AB–NCPub was generated similarly using the crystal structure of the NCP reconstituted with fused H2A–H2B and the crystal structures of the BARD1 tandem BRCT domain68,69 (PDB: 2NTE), the BARD1 ARD domain38 (PDB: 3C5R) and ubiquitin70 (PDB: 1UBQ) by rigid-body docking against the reconstructed density map of BARD1AB–NCPub in PHENIX. The H4 N-terminal tail, which was invisible in the NCP crystal structure, was added in COOT. Iterative real-space refinement was performed in PHENIX and COOT. Isopeptide bond restraints were applied for the isopeptide bond between G76 of ubiquitin and K13 or K15 of H2A. Since both K13 and K15 of H2A were ubiquitylated but only one ubiquitin molecule was visible in the density map, and the density for the isopeptide bond region was relatively weak, we speculated that ubiquitin on K13 and K15 was present as a mixture. Thus, in the final refinement, the isopeptide bond was left unrestrained.
For all cryo-EM structures, cross-validation was performed by refining the final model against one of the half-maps (Mapwork) and Fourier shell correlation curves were calculated between the refined model and each half-map (Mapwork and Mapfree) and full map (Mapfull). Model resolution was determined using the Fourier shell correlation calculated between the model and the full map at 0.5 criterion. The final structures of BRCA1R–BARD1R–UbcH5c–NCP and BARD1AB–NCPub display excellent stereochemistry, as assessed by MolProbity71. Figures of the cryo-EM density maps and models were prepared using Chimera (v.1.13.1)72, ChimeraX (v.0.91)73, COOT and PyMol (v.2.3.2) (Schrödinger).
Conformational flexibility analysis
The molecular flexibility of BRCA1R–BARD1R–UbcH5c–NCP was assessed using 3D variability analysis with cryoSPARC (v,2.15)35 and RELION 3.1-based multibody refinement with principal component analysis36. For multibody refinement, the system was split into three bodies using masks corresponding to BRCA1R–BARD1R, UbcH5c and the NCP. For the principal component analysis, six eigenvectors were used to identify motions involving the three bodies.
NMR spectroscopy
All NMR experiments were performed on a Bruker Avance III 700 MHz spectrometer, equipped with a triple-resonance cryoprobe. NMR spectra were processed with NMRPipe/NMRDraw74 and analysed using Sparky 3.115 (T. D. Goddard and D. G. Kneller, University of California) and NMRFAM-Sparky 1.41475. NCP samples reconstituted with 15N/13C-labelled H2A–H2B or 15N/13C-labelled H2AX–H2B in 50 mM NaPi, 100 mM NaCl, 5 mM TCEP, pH 7.0, and 90% H2O/10% D2O (NMR buffer) were prepared for backbone resonance assignments. Standard triple-resonance experiments were collected on these samples at 25 °C. NCP samples reconstituted with 15N-labelled H2A–H2B or H2AX–H2B were prepared for monitoring ubiquitylation reactions at 25 °C.
To monitor ubiquitylation, an initial SOFAST-HMQC76 spectrum was acquired on 40 μM of 15N-labelled NCP with added non-labelled 0.2 μM UBA1, 5 μM BRCA1R–BARD1R–UbcH5c and 240 μM ubiquitin. Immediately after the addition of 7 mM ATP to the sample, a series of approximately 100 SOFAST-HMQC spectra were collected. Intensities of a subset of the NCP signals (those without any overlap) were extracted and plotted as a function of time. The attachment of ubiquitin on the NCP caused changes in the electronic environment of some amino acids in the NCP, resulting in changes in signal intensities. By tracking these changes, we were able to locate ubiquitylation sites on the NCP.
Accessibility of H2A and H2AX residues for ubiquitylation
To assess the accessibility of H2A or H2AX C-terminal tail residues to UbcH5c catalytic cysteine C85, the conformational space sampled by the C-terminal tails of H2A (residues 118–129) and H2AX (residues 118–142) was simulated using GROMACS77. For these simulations, the C-terminal tail residues of H2A and H2AX were free to sample any chemically allowed conformations while the NCP core was fixed. From 500 simulated structures, the distances between the α-carbon of each C-terminal tail residue of H2A or H2AX and that of H2A or H2AX P117 were measured and the maximum distance for each residue was then subtracted from the distance separating the sulfur atom of C85 in UbcH5c and the α-carbon of P117. P117 is the last H2A or H2AX residue within the folded NCP core. To account for the motion of UbcH5c in the BRCA1R–BARD1R–UbcH5c–NCP cryo-EM structure, the closest possible distance between the C85 sulfur atom and the P117 α-carbon was estimated from the 3D variability analysis done with cryoSPARC (v2.15). The distance between the lysine ε-amino group and its α-carbon, estimated to be 5.5 ± 0.6 Å by statistical averaging, was taken into account in our analysis.
Reporting summary
Further information on research design is available in the Nature Research Reporting Summary linked to this paper.
Extended Data
Extended Data Fig. 1 |. Site-specific ubiquitylation of nucleosomal histones H2A and H2AX by BRCA1R-BARD1R and UbcH5c.
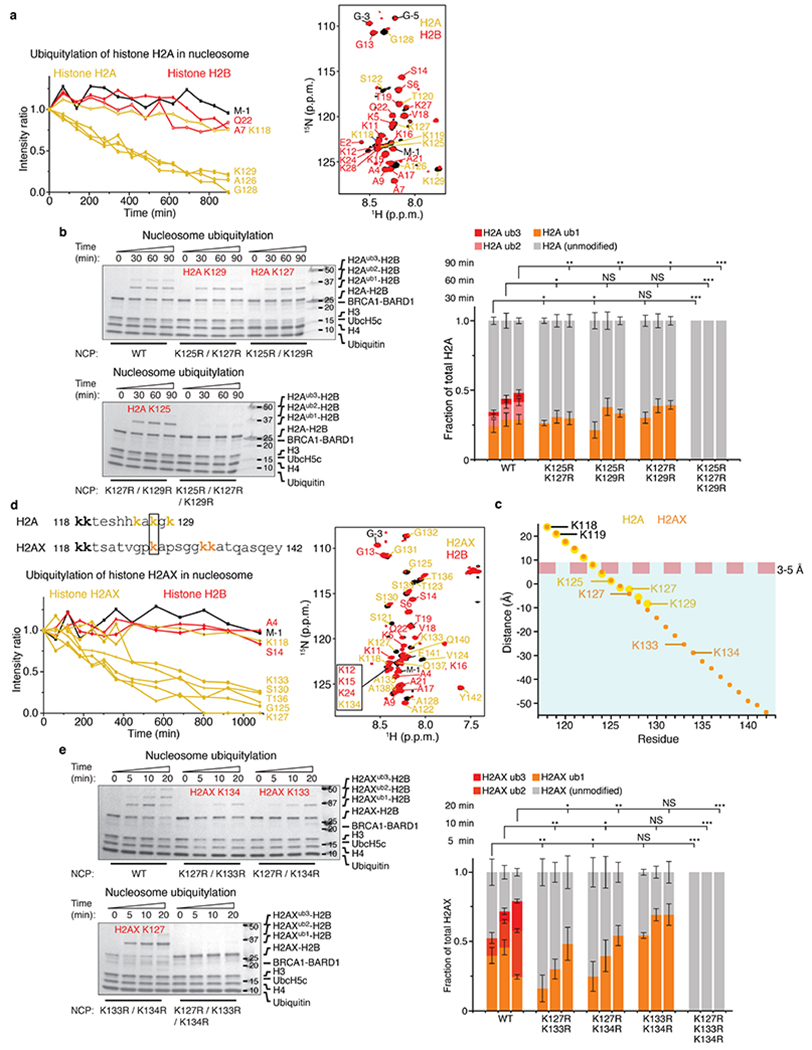
a, Left: time-course ubiquitylation of nucleosomal H2A catalysed by BRCA1R-BARD1R-UbcH5c probed using NMR spectroscopy at 25 °C. Changes in signal intensities in the 1H-15N heteronuclear single quantum coherence (HSQC) spectra of the NCP harbouring 15N-labelled H2A-H2B were monitored. Right: overlay of the 1H-15N HSQC spectra before and 1,000 min after the start of the ubiquitylation reaction. Signals from remnant tag residues are labelled in black. b, Left: Coomassie-stained gels as readout of the ubiquitylation of wild-type (WT) NCP and NCPs harbouring double-point and triple-point mutations in H2A as indicated, using BRCA1R-BARD1R and UbcH5c. The lysine residues being monoubiquitylated are indicated in red. Right: quantification of the NCP ubiquitylation from n = 3 independent experiments. Bar graphs show the mean and s.d. for each data point. P values were calculated using a two-sample, two-tailed Student t-test; *P < 0.05, **P < 0.01, ***P < 0.001, NS means not significant. Exact P values are provided in Supplementary Table 1. For gel source data, see Supplementary Fig. 3. c, Estimation by simulation of the conformational space sampled by fluctuating conformations of H2A, H2AX and UbcH5c in BRCA1R-BARD1R-UbcH5c-bound NCP (see Methods). The graph shows the ubiquitylation space accessible to the C-terminal tails of H2A (residues 118–129) and H2AX (residues 118–142). The red dashed line indicates a 3–5 Å distance between the thiol group of the active site cysteine C85 of UbcH5c and an acceptor lysine ε-amino group that allows ubiquitin transfer. The cyan shaded area below this line shows the histone residues accessible for ubiquitylation. A negative distance indicates that the distance between the sulfur atom of C85 and an α-carbon of H2A or H2AX can be short enough to permit ubiquitylation if the corresponding acceptor residue is a lysine. Only H2A and H2AX residues 123–129 and 123–142, respectively, satisfy this condition. Three of these residues are lysines in H2A (K125, K127 and K129) and H2AX (K127, K133 and K134). The conformational variability of UbcH5c was accounted for in these calculations. d, Left: amino acid sequence alignment of H2A and H2AX C-terminal tails and time-course ubiquitylation of nucleosomal H2AX catalysed by BRCA1R-BARD1R-UbcH5c probed using NMR spectroscopy at 25 °C. Changes in signal intensities in the 1H-15N HSQC spectra of the NCP harbouring 15N-labelled H2AX-H2B were monitored. Right: overlay of the 1H-15N HSQC spectra before and 1,000 min after the start of the ubiquitylation reaction. Signals from remnant tag residues are labelled in black. e, Left: Coomassie-stained gels as readout of the ubiquitylation of the NCPs harbouring WT and double-point and triple-point mutations in H2AX as indicated, using BRCA1R-BARD1R and UbcH5c. The lysine residues being monoubiquitylated are indicated in red. Right: quantification of the NCP ubiquitylation from n = 3 independent experiments. Bar graphs show the mean and s.d. for each data point. P values were calculated using a two-sample, two-tailed Student t-test; *P < 0.05, **P < 0.01, ***P < 0.001, NS means not significant. Exact P values are provided in Supplementary Table 1. For gel source data, see Supplementary Fig. 3.
Extended Data Fig. 2 |. Processing of cryo-EM data for the BRCA1R-BARD1R-UbcH5c-nucleosome complex.
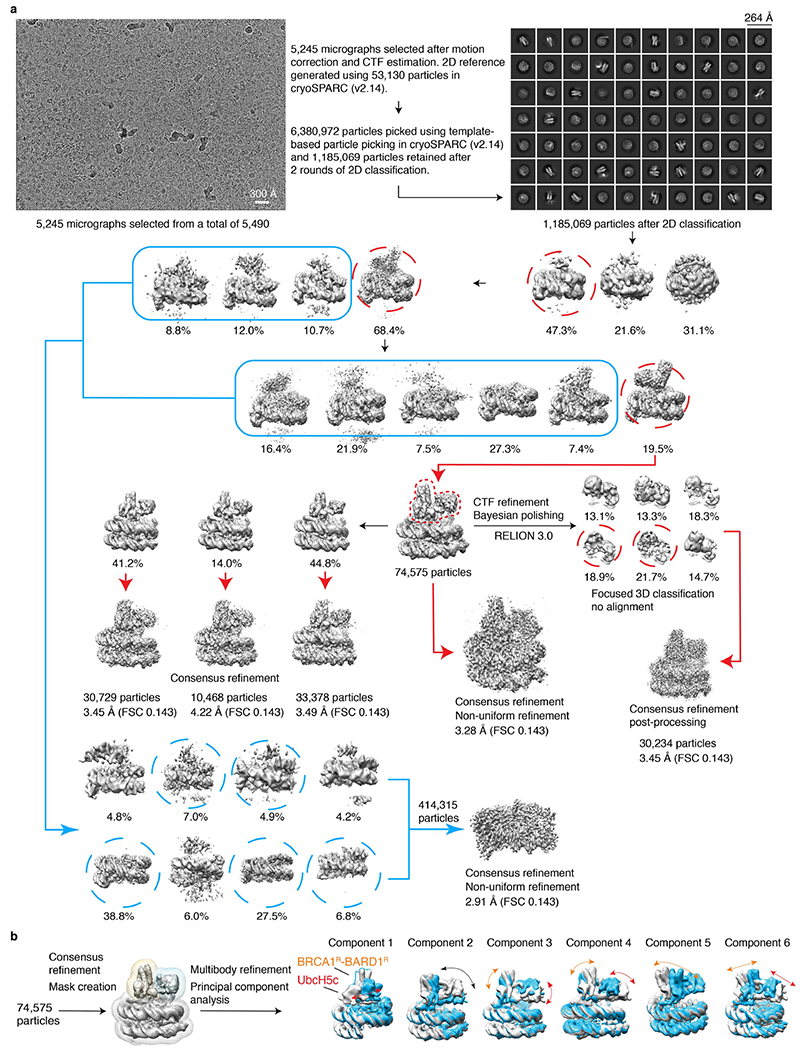
a, Flow chart showing the stages of cryo-EM image processing. A total of 5,490 micrographs was collected on a Titan Krios 300 kV microscope and subjected to beam-induced motion correction. Data processing was done using cryoSPARC (v2.14) and RELION 3.0. The reconstruction of BRCA1R-BARD1R-UbcH5c-NCP with the highest resolution was selected for building an atomic model. Cryo-EM density reconstruction for the apo NCP (particles with no detectable density for BRCA1R-BARD1R-UbcH5c) was also carried out and is schematized by blue arrows. After 3D models were built, the r.m.s.d. over all NCP backbone atoms between the apo and complex states is 0.29 Å, not including the histone tails, which are not detected in the two densities. b, Multibody refinement and conformational dynamics analysis of BRCA1R-BARD1R-UbcH5c-NCP using RELION 3.1. Six principal components were used to describe motions among three rigid bodies corresponding to BRCA1R-BARD1R, UbcH5c and the NCP, with the two extreme conformations for each rigid body displayed in grey and blue. Rigid body movements of BRCA1R-BARD1R, UbcH5c and BRCA1R-BARD1R-UbcH5c as a whole are indicated by orange, red and black curved arrows, respectively.
Extended Data Fig. 3 |. Validation of EM data and sample cryo-EM density for the BRCA1R-BARD1R-UbcH5c-nucleosome complex.
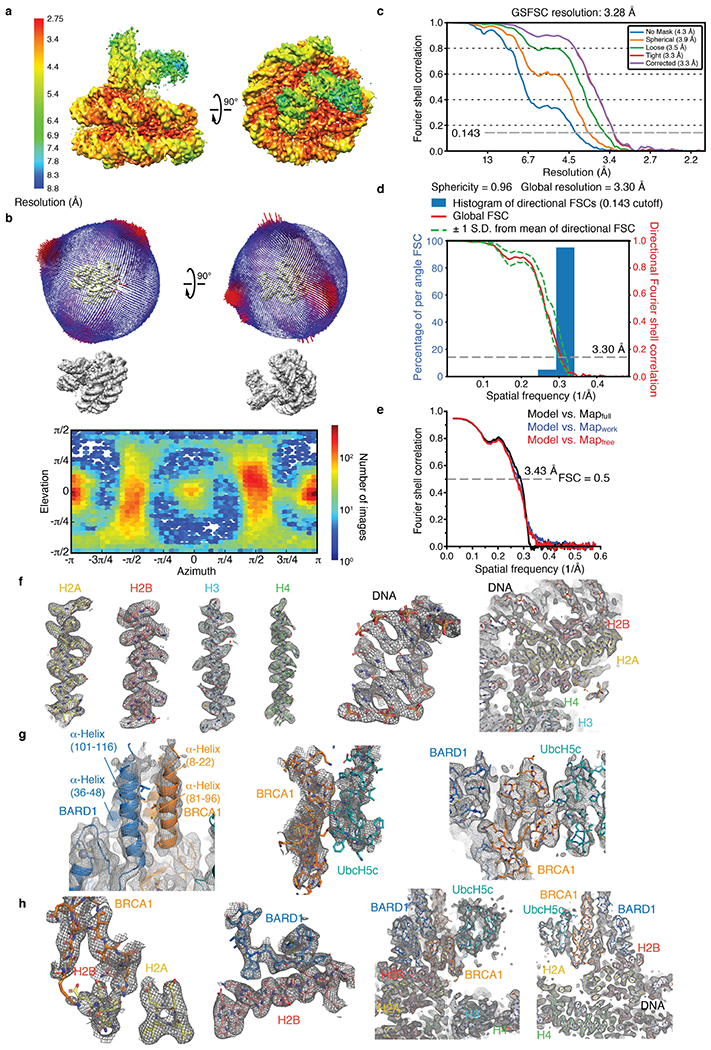
a, Local resolution distribution displayed on the reconstructed cryo-EM density map of the BRCA1R-BARD1R-UbcH5c-nucleosome complex. b, Top: Euler angle distribution generated using RELION 3.0 for the particles used in the final reconstruction. Each bar has a height and colour indicative of the number of particles (increasing from blue to red) in a defined orientation. Bottom: particle angular distribution heatmap generated using cryoSPARC (v2.14). c, Gold-standard Fourier shell correlation (GSFSC) curves for the final refinement in cryoSPARC (v2.14). Non-uniform refinement led to a 3.28 Å resolution map. d, Quantification of directional resolution anisotropy using a 3D Fourier shell correlation (3DFSC) algorithm in the 3DFSC server65. e, Fourier shell correlation (FSC) curves between model-calculated density and the final cryo-EM density map generated using PHENIX. Resolution at FSC 0.5 is indicated. f, Representative regions of the cryo-EM density map for the nucleosome components (histones and DNA) of the complex. g, Representative regions of the cryo-EM density map for the BRCA1R, BARD1R and UbcH5c interfaces. The four-helix bundle of BRCA1R-BARD1R is highlighted on the left. h, Representative regions of the cryo-EM density map for the interfaces involving BRCA1R and BARD1R interactions with the nucleosome. The first and second representations from the left highlight BRCA1R interaction with the nucleosome acidic patch and BARD1R interaction with H2B, respectively.
Extended Data Fig. 4 |. Effects of structure-based mutations in BRCA1R, BARD1R and nucleosomal histone proteins H2A and H2B on ubiquitin conjugation to H2A.
a, Top: representative Coomassie-stained gel of time-course ubiquitylation assays of the NCP using UbcH5c and BRCA1R-BARD1R, wild type (WT) and with indicated mutations in BRCA1R. Bottom: quantification of the NCP ubiquitylation from n = 3 independent experiments. Bar graphs show the mean and s.d. for each data point. P values were calculated using a two-sample, two-tailed Student t-test; *P < 0.05, **P < 0.01, ***P < 0.001, NS means not significant. Exact P values are provided in Supplementary Table 1. For gel source data, see Supplementary Fig. 4. b, Left: representative Coomassie-stained gels of time-course ubiquitylation assays of WT and indicated H2A mutant NCPs by WT BRCA1R-BARD1R and UbcH5c. Right: quantification of the NCP ubiquitylation from n = 3 independent experiments. Bar graphs show the mean and s.d. for each data point. P values were calculated using a two-sample, two-tailed Student t-test; *P < 0.05, **P < 0.01, ***P < 0.001, NS means not significant. Exact P values are provided in Supplementary Table 1. For gel source data, see Supplementary Fig. 4. c, Similar to b but using WT and indicated H2B mutations in the NCP. Exact P values are provided in Supplementary Table 1. For gel source data, see Supplementary Fig. 4. d, Top: representative Coomassie-stained gel of time-course ubiquitylation assays of the NCP using UbcH5c and BRCA1R-BARD1R, with the indicated mutations in BARD1R. The ubiquitylation assay carried out with WT BRCA1R-BARD1R is shown in a. Bottom: quantification of the NCP ubiquitylation from n = 3 independent experiments. Bar graphs show the mean and s.d. for each data point. P values were calculated using a two-sample, two-tailed Student t-test; *P < 0.05, **P < 0.01, ***P < 0.001, NS means not significant. Exact P values are provided in Supplementary Table 1. For gel source data, see Supplementary Fig. 4. e, Overlays of 1H-15N HSQC NMR spectra of WT BRCA1R-BARD1R versus BRCA1R-BARD1R harbouring the BARD1R P89A or W91A mutation. BRCA1R and BARD1R signals for which there was a change in chemical shift are labelled with BC and BD prefixes, respectively. The spectra demonstrate that the mutant proteins are well folded. The changes in chemical shifts for the W91A mutant map to residues close in space to the mutation site and can be attributed to altered ring current effect. These affected residues are coloured red and cyan on the NMR structure of BRCA1R-BARD1R. The multiple side-chain conformations of W91 in the NMR ensemble are displayed.
Extended Data Fig. 5 |. Structural and functional comparison of BRCA1R-BARD1R-UbcH5c and RING1BR-BMI1R-UbcH5c in association with the nucleosome and dynamics of the BRCA1R-UbcH5c interaction.
a, Top: fluorescence polarization nucleosome-binding curves showing that BRCA1R-BARD1R and BRCA1R-BARD1R-UbcH5c bind to the NCP with similar affinities, lower than the affinity of RING1BR-BMI1R for the NCP. Data are mean and s.d. for each data point (n = 3 independent experiments). Kd values are indicated. Bottom: control binding curves for the RING1BR-BMI1R-NCP interaction at two salt concentrations. While our experiments were done with 50 mM NaCl, previously published experiments probing the RING1BR-BMI1R-NCP interaction were done with 100 mM NaCl. The higher RING1BR-BMI1R-NCP Kd that we obtained at 100 mM NaCl is similar to published data34. b, Surface representations of the 3D structures of BRCA1R-BARD1R-UbcH5c-NCP and RING1BR-BMI1R-UbcH5c-NCP shown side-by-side with identical orientations of the NCP to highlight the radically different positioning of UbcH5c relative to the NCP in the two complexes. c, Left: representative Coomassie-stained gels of ubiquitylation assays of the NCP by UbcH5c and BRCA1R-BARD1R or RING1BR-BMI1R using wild-type (WT) proteins and the indicated UbcH5c and BRCA1R mutants. Right: quantification of the NCP ubiquitylation from n = 3 independent experiments. Bar graphs show the mean and s.d. for each data point. P values were calculated using a two-sample, two-tailed Student t-test; *P < 0.05, **P < 0.01, ***P < 0.001, NS means not significant. Exact P values are provided in Supplementary Table 1. For gel source data, see Supplementary Fig. 5. d, Top: overlay of the 1H-15N NMR HSQC spectra of BRCA1R-BARD1R-UbcH5c (red), BRCA1R-BARD1R (cyan) and UbcH5c (gold) highlighting 12 residues (black labels) near the BRCA1R-UbcH5c interface for which NMR signals disappear or become very weak due to exchange broadening upon formation of the BRCA1R-BARD1R-UbcH5c complex, consistent with motions on the microsecond-to-millisecond timescale. The signals of seven other UbcH5c residues (blue labels), distant from the interface with BRCA1R, are also exchange broadened because of allosteric effects as previously noted for other UbcH5c and related complexes53,78. Bottom: surface representation of the BRCA1R-BARD1R-UbcH5c complex. The regions for which NMR signals disappear due to exchange broadening upon formation of the BRCA1R-BARD1R-UbcH5c complex are highlighted in yellow. The active site C85 of UbcH5c is shown in red.
Extended Data Fig. 6 |. Flow chart showing the stages of cryo-EM image processing for BARD1 (ARD-BRCT) in complex with the nucleosome ubiquitylated at H2A K13 and K15.
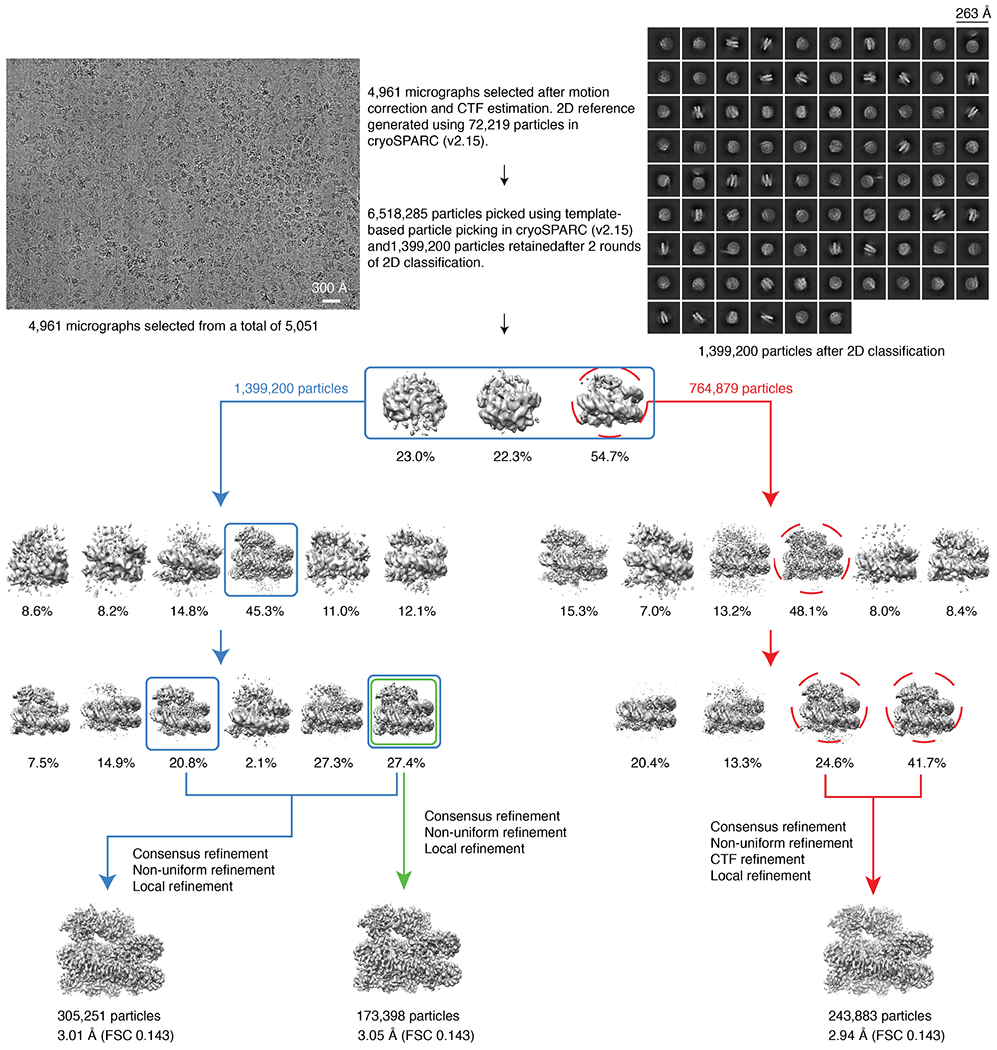
A total of 5,051 micrographs was collected on a Titan Krios 300 kV microscope and subjected to beam-induced motion correction. Data processing was done using cryoSPARC (v2.15). The reconstruction with the highest resolution was selected for building an atomic model.
Extended Data Fig. 7 |. Validation of EM data for BARD1 (ARD-BRCT) in complex with the nucleosome ubiquitylated at H2A K13 and K15.
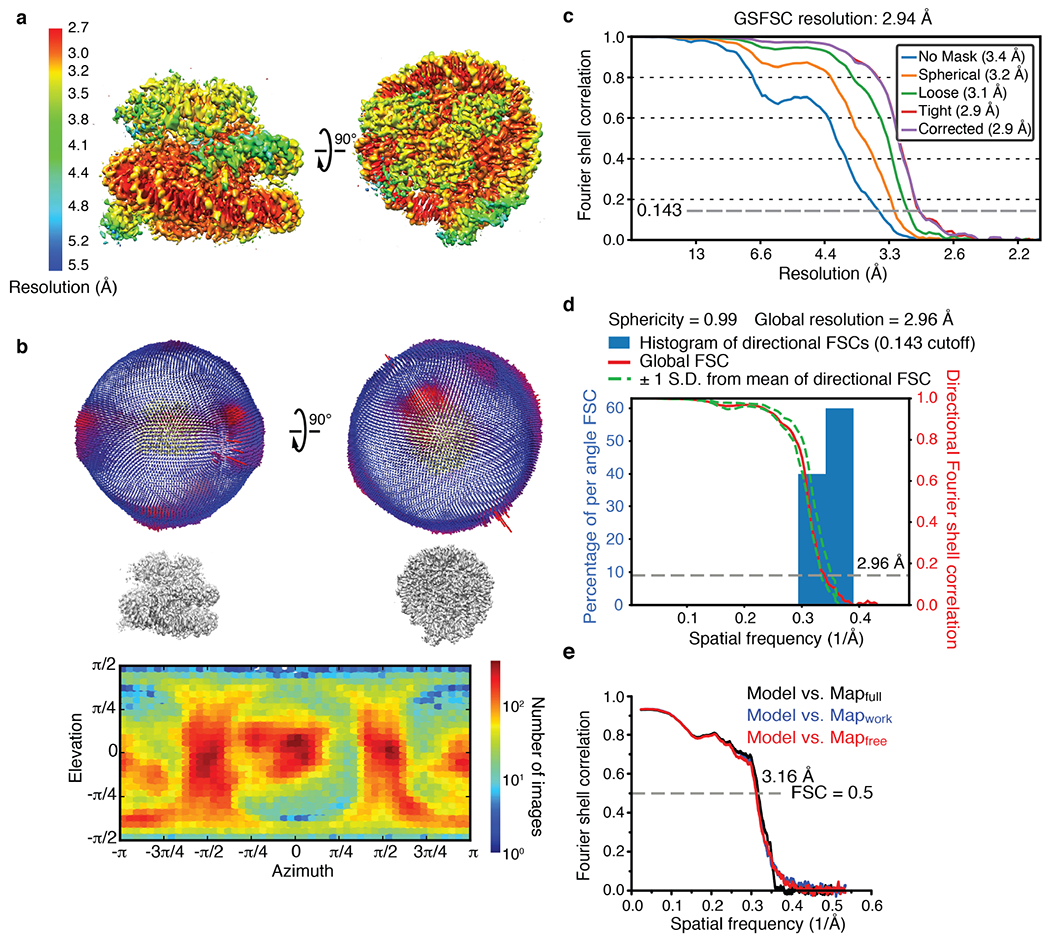
a, Local resolution distribution displayed on the reconstructed cryo-EM density map of BARD1 (ARD-BRCT) bound to the H2AK13ubK15ub-containing NCP. b, Top: Euler angle distribution generated using RELION 3.0 for the particles used in the final reconstruction. Each bar has a height and colour indicative of the number of particles (increasing from blue to red) in a defined orientation. Bottom: particle angular distribution heatmap generated using cryoSPARC (v2.15). c, Gold-standard Fourier shell correlation (GSFSC) curves for the final refinement in cryoSPARC (v2.14). Non-uniform refinement led to a 2.94 Å resolution map. d, Quantification of directional resolution anisotropy using a 3D Fourier shell correlation (3DFSC) algorithm in the 3DFSC server65. e, Fourier shell correlation (FSC) curves between model-calculated density and the final cryo-EM density map generated using PHENIX. Resolution at FSC 0.5 is indicated.
Extended Data Fig. 8 |. Sample cryo-EM density of the BARD1 (ARD-BRCT)-ubiquitylated nucleosome complex.
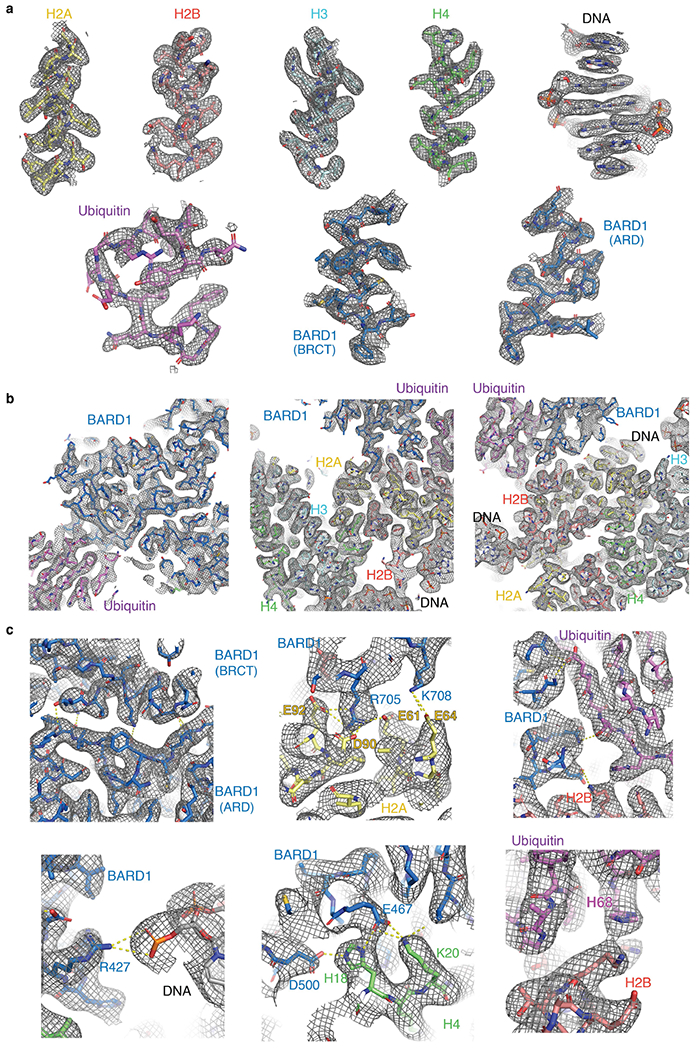
a, Representative regions of the cryo-EM density map for the different components (histones, DNA, BARD1-ARD, BARD1-BRCT and ubiquitin) of the complex. b, Representative regions of the cryo-EM density map highlighting global interfaces. c, Representative regions of the cryo-EM density map highlighting details of the various interfaces in the complex.
Extended Data Fig. 9 |. Ubiquitylated nucleosome-binding properties of BARD1 (ARD-BRCT) and associated inhibition of K63-mediated polyubiquitin chain formation.
a, Top: fluorescence polarization binding curves for BARD1 (ARD-BRCT), wild type (WT) and with the indicated mutations in the ARD domain, added to fluorescently labelled H2AK13ubK15ub-bearing NCP. GST was used as a control since BARD1 (ARD-BRCT) was GST-tagged. Data are mean and s.d. for each data point (n = 3 independent experiments). Kd values are indicated. ND, not determined. Bottom: similar to the top panel but with the indicated mutations in the tandem BRCT domain. b, Left: cryo-EM density near the ubiquitin isopeptide bond linkage in the structure of BARD1 (ARD-BRCT) in complex with H2AK13ubK15ub-bearing NCP. Only one ubiquitin molecule, interacting with BARD1 and NCP surfaces (that is, bound ubiquitin), is detected in the density. The weak and blurry density for the isopeptide bond region is compatible with the bound ubiquitin being linked to H2A K13 or H2A K15, suggesting binding exchange between H2AK13ub and H2AK15ub. Lack of density for a second ubiquitin molecule is probably due to flexibility in the unbound state. Right: ubiquitylation reaction of BARD1 (ARD-BRCT)-H2A-H2B fusion (labelled as Fusion) by RNF168, UbcH5c and UBA1 showing that there are two ubiquitin molecules attached to H2A (at K13 and K15) in the purified samples used for cryo-EM. Data shown are representative of n = 5 independent experiments. For gel source data, see Supplementary Fig. 6. c, Cryo-EM density at BARD1 BRCT-ubiquitin (left) and H2B-ubiquitin (right) interfaces in the structure of BARD1 (ARD-BRCT) bound to the NCP ubiquitylated at H2A K13 and K15. Ubiquitin K63 and E64 contact BARD1 while ubiquitin I44, G47, H68 and V70 contact H2B. d, Location of the putative phosphate-binding site in the BARD1 tandem BRCT domain. The predicted phosphate-binding residues S575, G576, L618 and K619 are highlighted in red. e, Left: MMS2-Ubc13-catalysed polyubiquitin chain elongation at H2AK13ubK15ub in the NCP was inhibited by adding increasing amounts of GST-tagged BARD1 (ARD-BRCT), up to 16 times molar excess. Ubiquitylation efficiency was calculated as a ratio of the total intensities of the ubiquitylated products in that particular western blot (WB) lane against the lane with uninhibited MMS2-Ubc13 activity. Data are mean and s.d. for each data point from n = 3 independent experiments. P values were calculated using a two-sample, two-tailed Student t-test; *P < 0.05, **P < 0.01, ***P < 0.001, NS means not significant. Exact P values are provided in Supplementary Table 1. Right: representative WB images depicting inhibition of the MMS2-Ubc13-catalysed polyubiquitin chain elongation at H2AK13ubK15ub in the NCP by GST-tagged BARD1 (ARD-BRCT) but not by GST. The non-ubiquitylated NCP, used as a control substrate, shows chain elongation of free ubiquitin only by MMS2-Ubc13, uninhibited by BARD1 (ARD-BRCT). All lanes with ATP show formation of di-ubiquitin with additional chain extension by MMS2-Ubc13, demonstrating that BARD1 or GST do not inhibit MMS2-Ubc13. For gel source data, see Supplementary Fig. 6.
Extended Data Fig. 10 |. BARD1 missense variants that map near the interdomain and intermolecular interfaces in the 3D structure of BARD1 (ARD-BRCT) in complex with the ubiquitylated nucleosome.
The side chains of BARD1 (ARD-BRCT) residues for which missense variants were identified in patients with cancer are highlighted on the 3D structure of BARD1 (ARD-BRCT)-ubiquitylated NCP. Only variants that are located near the interdomain and intermolecular interfaces are shown with a different colour for each interface. The amino acids are labelled when they are directly involved in interdomain or intermolecular interactions in the BARD1 (ARD-BRCT)-ubiquitylated NCP structure. The variants were obtained from the ClinVar database maintained at the US National Institutes of Health79.
Extended Data Table 1 |.
Cryo-EM data collection, refinement and validation statistics
| NCP (EMDB-23590) (PDB 7LYA) |
BRCA1R-BARD1R-UbcH5c-NCP (EMDB-23591) (PDB 7LYB) |
BARD1 (ARD-BRCT)-NCPH2AK13ubK15ub (EMDB-23592) (PDB 7LYC) |
|
|---|---|---|---|
| Data collection and processing | |||
| Magnification | 22,500 | 22,500 | 22,500 |
| Voltage (kV) | 300 | 300 | 300 |
| Electron exposure (e–/Å2) | 50 | 50 | 50 |
| Defocus range (μm) | −0.5 to −3.5 | −0.5 to −3.5 | −0.5 to −3.5 |
| Pixel size (Å) | 1.031 | 1.031 | 1.028 |
| Symmetry imposed | C2 | C1 | C1 |
| Initial particle images (no.) | 6,380,972 | 6,380,972 | 6,518,285 |
| Final particle images (no.) | 414,315 | 74,575 | 243,883 |
| Map resolution (Å) | 2.91 | 3.28 | 2.94 |
| FSC threshold | 0.143 | 0.143 | 0.143 |
| Refinement | |||
| Initial model used (PDB code) | NCP (X-ray) | NCP (X-ray), 1JM7, 5EGG | NCP (X-ray), 2NTE, 3C5R, 1UBQ |
| Model resolution (Å) | 3.20 | 3.43 | 3.16 |
| FSC threshold | 0.5 | 0.5 | 0.5 |
| Map sharpening B factor (Å2) | −64 | −78 | −98 |
| Model composition | |||
| Non-hydrogen atoms | 12,098 | 14,711 | 15,475 |
| Protein residues | 767 | 1,098 | 1,188 |
| DNA | 293 | 293 | 293 |
| Ligands | 0 | 4 | 0 |
| B factors (Å2) | |||
| Protein | 40.90 | 67.08 | 27.61 |
| DNA | 15.86 | 25.26 | 13.36 |
| Ligand | - | 147.15 | - |
| R.m.s. deviations | |||
| Bond lengths (Å) | 0.007 | 0.006 | 0.006 |
| Bond angles (°) | 0.64 | 0.75 | 0.62 |
| Validation | |||
| MolProbity score | 1.44 | 1.80 | 1.43 |
| Clashscore | 3.53 | 8.88 | 6.92 |
| Poor rotamers (%) | 0.00 | 0.00 | 0.00 |
| Ramachandran plot | |||
| Favored (%) | 95.76 | 95.34 | 97.77 |
| Allowed (%) | 4.24 | 4.66 | 2.23 |
| Disallowed (%) | 0 | 0 | 0 |
Supplementary Material
Acknowledgements
We are indebted to H. Scott, J. Myers and N. Meyer at the Pacific Northwest Cryo-EM Center (PNCC) for cryo-EM screenings and data collections, and to H. Scott for his invaluable advice throughout this project; we are grateful to A. Sundborger-Lunna, P.-L. Chiu and A. Alam for providing instrument access and for collaboration on other cryo-EM projects; and thank M. Schellenberg for generous instrument access and B. Bragantini for sharing unpublished findings. This research was supported by the US National Institutes of Health (NIH) grants R01 CA132878, R01 GM116829 and R35 GM136262 to G.M.; the Ovarian Cancer Research ALLiance Liz Tilberis Award to M.V.B.; an Edward C. Kendall Fellowship in Biochemistry to Q.H.; and a Mayo Clinic Cancer Center and Center for Biomedical Discovery Eagles Fellowship to D.Z. Cryo-EM screenings and data collections were supported by the NIH grant U24GM129547 and performed at the PNCC at Oregon Health & Science University (OHSU) and accessed through the EMSL (grid.436923.9), a DOE Office of Science User Facility sponsored by the Office of Biological and Environmental Research.
Footnotes
Competing interests The authors declare no competing interests.
Supplementary information The online version contains supplementary material available at https://doi.org/10.1038/s41586-021-03716-8.
Peer review information Nature thanks Daniel Durocher and the other, anonymous, reviewer(s) for their contribution to the peer review of this work. Peer reviewer reports are available.
Data availability
The atomic coordinates and EM maps have been deposited in the Protein Data Bank under accession codes 7LYA (NCP), 7LYB (BRCA1R–BARD1R–UbcH5c–NCP) and 7LYC (BARD1(ARD–BRCT)–NCPH2AK13ubK15ub), and in the Electron Microscopy Data Bank under corresponding accession codes EMD-23590, EMD-23591 and EMD-23592. Raw gels and blots are provided in Supplementary Figs. 1–6. Reagents from this study are available from the corresponding author on request.
References
- 1.Hall JM et al. Linkage of early-onset familial breast cancer to chromosome 17q21. Science 250, 1684–1689 (1990). [DOI] [PubMed] [Google Scholar]
- 2.Miki Y et al. A strong candidate for the breast and ovarian cancer susceptibility gene BRCA1. Science 266, 66–71 (1994). [DOI] [PubMed] [Google Scholar]
- 3.Futreal PA et al. BRCA1 mutations in primary breast and ovarian carcinomas. Science 266, 120–122 (1994). [DOI] [PubMed] [Google Scholar]
- 4.Friedman LS et al. Confirmation of BRCA1 by analysis of germline mutations linked to breast and ovarian cancer in ten families. Nat. Genet 8, 399–404 (1994). [DOI] [PubMed] [Google Scholar]
- 5.Wu LC et al. Identification of a RING protein that can interact in vivo with the BRCA1 gene product. Nat. Genet 14, 430–440 (1996). [DOI] [PubMed] [Google Scholar]
- 6.Scully R et al. Association of BRCA1 with Rad51 in mitotic and meiotic cells. Cell 88, 265–275 (1997). [DOI] [PubMed] [Google Scholar]
- 7.Zhao W et al. BRCA1–BARD1 promotes RAD51-mediated homologous DNA pairing. Nature 550, 360–365 (2017). [DOI] [PMC free article] [PubMed] [Google Scholar]
- 8.Moynahan ME, Chiu JW, Koller BH & Jasin M Brca1 controls homology-directed DNA repair. Mol. Cell 4, 511–518 (1999). [DOI] [PubMed] [Google Scholar]
- 9.Paull TT, Cortez D, Bowers B, Elledge SJ & Gellert M Direct DNA binding by Brca1. Proc. Natl Acad. Sci. USA 98, 6086–6091 (2001). [DOI] [PMC free article] [PubMed] [Google Scholar]
- 10.Tarsounas M & Sung P The antitumorigenic roles of BRCA1–BARD1 in DNA repair and replication. Nat. Rev. Mol. Cell Biol 21, 284–299 (2020). [DOI] [PMC free article] [PubMed] [Google Scholar]
- 11.Nakamura K et al. H4K20me0 recognition by BRCA1–BARD1 directs homologous recombination to sister chromatids. Nat. Cell Biol 21, 311–318 (2019). [DOI] [PMC free article] [PubMed] [Google Scholar]
- 12.Saredi G et al. H4K20me0 marks post-replicative chromatin and recruits the TONSL–MMS22L DNA repair complex. Nature 534, 714–718 (2016). [DOI] [PMC free article] [PubMed] [Google Scholar]
- 13.Kalb R, Mallery DL, Larkin C, Huang JT & Hiom K BRCA1 is a histone-H2A-specific ubiquitin ligase. Cell Rep. 8, 999–1005 (2014). [DOI] [PMC free article] [PubMed] [Google Scholar]
- 14.Densham RM et al. Human BRCA1–BARD1 ubiquitin ligase activity counteracts chromatin barriers to DNA resection. Nat. Struct. Mol. Biol 23, 647–655 (2016). [DOI] [PMC free article] [PubMed] [Google Scholar]
- 15.Mattiroli F et al. RNF168 ubiquitinates K13-15 on H2A/H2AX to drive DNA damage signaling. Cell 150, 1182–1195 (2012). [DOI] [PubMed] [Google Scholar]
- 16.Gatti M et al. A novel ubiquitin mark at the N-terminal tail of histone H2As targeted by RNF168 ubiquitin ligase. Cell Cycle 11, 2538–2544 (2012). [DOI] [PMC free article] [PubMed] [Google Scholar]
- 17.Brzovic PS, Rajagopal P, Hoyt DW, King MC & Klevit RE Structure of a BRCA1–BARD1 heterodimeric RING–RING complex. Nat. Struct. Biol 8, 833–837 (2001). [DOI] [PubMed] [Google Scholar]
- 18.Bunting SF et al. 53BP1 inhibits homologous recombination in Brca1-deficient cells by blocking resection of DNA breaks. Cell 141, 243–254 (2010). [DOI] [PMC free article] [PubMed] [Google Scholar]
- 19.Bouwman P et al. 53BP1 loss rescues BRCA1 deficiency and is associated with triple-negative and BRCA-mutated breast cancers. Nat. Struct. Mol. Biol 17, 688–695 (2010). [DOI] [PMC free article] [PubMed] [Google Scholar]
- 20.Chapman JR, Sossick AJ, Boulton SJ & Jackson SP BRCA1-associated exclusion of 53BP1 from DNA damage sites underlies temporal control of DNA repair. J. Cell Sci 125, 3529–3534 (2012). [DOI] [PMC free article] [PubMed] [Google Scholar]
- 21.Pellegrino S, Michelena J, Teloni F, Imhof R & Altmeyer M Replication-coupled dilution of H4K20me2 guides 53BP1 to pre-replicative chromatin. Cell Rep. 19, 1819–1831 (2017). [DOI] [PMC free article] [PubMed] [Google Scholar]
- 22.Greenberg RA Assembling a protective shield. Nat. Cell Biol 20, 862–863 (2018). [DOI] [PMC free article] [PubMed] [Google Scholar]
- 23.Liang Y et al. Structural analysis of BRCA1 reveals modification hotspot. Sci. Adv 3, e1701386 (2017). [DOI] [PMC free article] [PubMed] [Google Scholar] [Retracted]
- 24.Hashizume R et al. The RING heterodimer BRCA1–BARD1 is a ubiquitin ligase inactivated by a breast cancer-derived mutation. J. Biol. Chem 276, 14537–14540 (2001). [DOI] [PubMed] [Google Scholar]
- 25.Mallery DL, Vandenberg CJ & Hiom K Activation of the E3 ligase function of the BRCA1/BARD1 complex by polyubiquitin chains. EMBO J. 21, 6755–6762 (2002). [DOI] [PMC free article] [PubMed] [Google Scholar]
- 26.Stewart MD et al. BARD1 is necessary for ubiquitylation of nucleosomal histone H2A and for transcriptional regulation of estrogen metabolism genes. Proc. Natl Acad. Sci. USA 115, 1316–1321 (2018). [DOI] [PMC free article] [PubMed] [Google Scholar]
- 27.Fradet-Turcotte A et al. 53BP1 is a reader of the DNA-damage-induced H2A Lys 15 ubiquitin mark. Nature 499, 50–54 (2013). [DOI] [PMC free article] [PubMed] [Google Scholar]
- 28.Wilson MD et al. The structural basis of modified nucleosome recognition by 53BP1. Nature 536, 100–103 (2016). [DOI] [PubMed] [Google Scholar]
- 29.Botuyan MV et al. Structural basis for the methylation state-specific recognition of histone H4-K20 by 53BP1 and Crb2 in DNA repair. Cell 127, 1361–1373 (2006). [DOI] [PMC free article] [PubMed] [Google Scholar]
- 30.Stewart GS et al. The RIDDLE syndrome protein mediates a ubiquitin-dependent signaling cascade at sites of DNA damage. Cell 136, 420–434 (2009). [DOI] [PubMed] [Google Scholar]
- 31.Doil C et al. RNF168 binds and amplifies ubiquitin conjugates on damaged chromosomes to allow accumulation of repair proteins. Cell 136, 435–446 (2009). [DOI] [PubMed] [Google Scholar]
- 32.Becker JR et al. BARD1 links histone H2A lysine-15 ubiquitination to initiation of BRCA1-dependent homologous recombination. Preprint at 10.1101/2020.06.01.127951 (2020). [DOI] [Google Scholar]
- 33.Luger K, Mäder AW, Richmond RK, Sargent DF & Richmond TJ Crystal structure of the nucleosome core particle at 2.8 A resolution. Nature 389, 251–260 (1997). [DOI] [PubMed] [Google Scholar]
- 34.McGinty RK, Henrici RC & Tan S Crystal structure of the PRC1 ubiquitylation module bound to the nucleosome. Nature 514, 591–596 (2014). [DOI] [PMC free article] [PubMed] [Google Scholar]
- 35.Punjani A & Fleet DJ 3D variability analysis: resolving continuous flexibility and discrete heterogeneity from single particle cryo-EM. J. Struct. Biol 213, 107702 (2021). [DOI] [PubMed] [Google Scholar]
- 36.Nakane T, Kimanius D, Lindahl E & Scheres SH Characterisation of molecular motions in cryo-EM single-particle data by multi-body refinement in RELION. eLife 7, e36861 (2018). [DOI] [PMC free article] [PubMed] [Google Scholar]
- 37.Paull TT et al. A critical role for histone H2AX in recruitment of repair factors to nuclear foci after DNA damage. Curr. Biol 10, 886–895 (2000). [DOI] [PubMed] [Google Scholar]
- 38.Fox D III et al. Crystal structure of the BARD1 ankyrin repeat domain and its functional consequences. J. Biol. Chem 283, 21179–21186 (2008). [DOI] [PMC free article] [PubMed] [Google Scholar]
- 39.Li M & Yu X Function of BRCA1 in the DNA damage response is mediated by ADP-ribosylation. Cancer Cell 23, 693–704 (2013). [DOI] [PMC free article] [PubMed] [Google Scholar]
- 40.Billing D et al. The BRCT domains of the BRCA1 and BARD1 tumor suppressors differentially regulate homology-directed repair and stalled fork protection. Mol. Cell 72, 127–139.e8 (2018). [DOI] [PMC free article] [PubMed] [Google Scholar]
- 41.Eddins MJ, Carlile CM, Gomez KM, Pickart CM & Wolberger C Mms2–Ubc13 covalently bound to ubiquitin reveals the structural basis of linkage-specific polyubiquitin chain formation. Nat. Struct. Mol. Biol 13, 915–920 (2006). [DOI] [PubMed] [Google Scholar]
- 42.Sobhian B et al. RAP80 targets BRCA1 to specific ubiquitin structures at DNA damage sites. Science 316, 1198–1202 (2007). [DOI] [PMC free article] [PubMed] [Google Scholar]
- 43.Wang B et al. Abraxas and RAP80 form a BRCA1 protein complex required for the DNA damage response. Science 316, 1194–1198 (2007). [DOI] [PMC free article] [PubMed] [Google Scholar]
- 44.Kim H, Chen J & Yu X Ubiquitin-binding protein RAP80 mediates BRCA1-dependent DNA damage response. Science 316, 1202–1205 (2007). [DOI] [PubMed] [Google Scholar]
- 45.Coleman KA & Greenberg RA The BRCA1–RAP80 complex regulates DNA repair mechanism utilization by restricting end resection. J. Biol. Chem 286, 13669–13680 (2011). [DOI] [PMC free article] [PubMed] [Google Scholar]
- 46.Hu Y et al. RAP80-directed tuning of BRCA1 homologous recombination function at ionizing radiation-induced nuclear foci. Genes Dev. 25, 685–700 (2011). [DOI] [PMC free article] [PubMed] [Google Scholar]
- 47.Xu M et al. Partitioning of histone H3–H4 tetramers during DNA replication-dependent chromatin assembly. Science 328, 94–98 (2010). [DOI] [PubMed] [Google Scholar]
- 48.Hu Q, Botuyan MV, Cui G, Zhao D & Mer G Mechanisms of ubiquitin -nucleosome recognition and regulation of 53BP1 chromatin recruitment by RNF168/169 and RAD18. Mol. Cell 66, 473–487.e9 (2017). [DOI] [PMC free article] [PubMed] [Google Scholar]
- 49.Sundd M, Iverson N, Ibarra-Molero B, Sanchez-Ruiz JM & Robertson AD Electrostatic interactions in ubiquitin: stabilization of carboxyLates by Lysine amino groups. Biochemistry 41, 7586–7596 (2002). [DOI] [PubMed] [Google Scholar]
- 50.Cui G et al. StructuraL basis of ubiquitin recognition by transLesion synthesis DNA polymerase ı. Biochemistry 49, 10198–10207 (2010). [DOI] [PMC free article] [PubMed] [Google Scholar]
- 51.Berndsen CE & Wolberger C A spectrophotometric assay for conjugation of ubiquitin and ubiquitin-Like proteins. Anal. Biochem 418, 102–110 (2011). [DOI] [PMC free article] [PubMed] [Google Scholar]
- 52.Bentley ML et al. Recognition of UbcH5c and the nucLeosome by the Bmi1/Ring1b ubiquitin Ligase complex. EMBO J. 30, 3285–3297 (2011). [DOI] [PMC free article] [PubMed] [Google Scholar]
- 53.Benirschke RC et al. Molecular basis for the association of human E4B U box ubiquitin Ligase with E2-conjugating enzymes UbcH5c and Ubc4. Structure 18, 955–965 (2010). [DOI] [PMC free article] [PubMed] [Google Scholar]
- 54.Su D et al. Structure and histone binding properties of the Vps75–Rtt109 chaperone-lysine acetyltransferase complex. J. Biol. Chem 286, 15625–15629 (2011). [DOI] [PMC free article] [PubMed] [Google Scholar]
- 55.Su D et al. Structural basis for recognition of H3K56-acetylated histone H3–H4 by the chaperone Rtt106. Nature 483, 104–107 (2012). [DOI] [PMC free article] [PubMed] [Google Scholar]
- 56.Luger K, Rechsteiner TJ & Richmond TJ Preparation of nucleosome core particle from recombinant histones. Methods Enzymol. 304, 3–19 (1999). [DOI] [PubMed] [Google Scholar]
- 57.Makde RD, England JR, Yennawar HP & Tan S Structure of RCC1 chromatin factor bound to the nucleosome core particle. Nature 467, 562–566 (2010). [DOI] [PMC free article] [PubMed] [Google Scholar]
- 58.Matsumoto S et al. DNA damage detection in nucleosomes invoLves DNA register shifting. Nature 571, 79–84 (2019). [DOI] [PMC free article] [PubMed] [Google Scholar]
- 59.Marks BD et al. Multiparameter analysis of a screen for progesterone receptor ligands: comparing fluorescence lifetime and fluorescence polarization measurements. Assay Drug Dev. Technol 3, 613–622 (2005). [DOI] [PubMed] [Google Scholar]
- 60.Shukla AK et al. Visualization of arrestin recruitment by a G-protein-coupled receptor. Nature 512, 218–222 (2014). [DOI] [PMC free article] [PubMed] [Google Scholar]
- 61.Punjani A, Rubinstein JL, Fleet DJ & Brubaker MA cryoSPARC: algorithms for rapid unsupervised cryo-EM structure determination. Nat. Methods 14, 290–296 (2017). [DOI] [PubMed] [Google Scholar]
- 62.Scheres SH RELION: implementation of a Bayesian approach to cryo-EM structure determination. J. Struct. Biol 180, 519–530 (2012). [DOI] [PMC free article] [PubMed] [Google Scholar]
- 63.Zivanov J et al. New tooLs for automated high-resoLution cryo-EM structure determination in RELION-3. eLife 7, e42166 (2018). [DOI] [PMC free article] [PubMed] [Google Scholar]
- 64.Zheng SQ et al. MotionCor2: anisotropic correction of beam-induced motion for improved cryo-electron microscopy. Nat. Methods 14, 331–332 (2017). [DOI] [PMC free article] [PubMed] [Google Scholar]
- 65.Tan YZ et al. Addressing preferred specimen orientation in single-particLe cryo-EM through tilting. Nat. Methods 14, 793–796 (2017). [DOI] [PMC free article] [PubMed] [Google Scholar]
- 66.Liebschner D et al. Macromolecular structure determination using X-rays, neutrons and eLectrons: recent developments in Phenix. Acta Crystallogr. D 75, 861–877 (2019). [DOI] [PMC free article] [PubMed] [Google Scholar]
- 67.Emsley P & Cowtan K Coot: model-building tools for molecular graphics. Acta Crystallogr. D 60, 2126–2132 (2004). [DOI] [PubMed] [Google Scholar]
- 68.Birrane G, Varma AK, Soni A & Ladias JA Crystal structure of the BARD1 BRCT domains. Biochemistry 46, 7706–7712 (2007). [DOI] [PubMed] [Google Scholar]
- 69.Edwards RA et al. The BARD1 C-terminal domain structure and interactions with polyadenylation factor CstF-50. Biochemistry 47, 11446–11456 (2008). [DOI] [PMC free article] [PubMed] [Google Scholar]
- 70.Vijay-Kumar S, Bugg CE & Cook WJ Structure of ubiquitin refined at 1.8 A resolution. J. Mol. Biol 194, 531–544 (1987). [DOI] [PubMed] [Google Scholar]
- 71.Chen VB et al. MolProbity: all-atom structure vaLidation for macromolecular crystallography. Acta Crystallogr. D 66, 12–21 (2010). [DOI] [PMC free article] [PubMed] [Google Scholar]
- 72.Pettersen EF et al. UCSF Chimera—a visualization system for exploratory research and analysis. J. Comput. Chem 25, 1605–1612 (2004). [DOI] [PubMed] [Google Scholar]
- 73.Goddard TD et al. UCSF ChimeraX: meeting modern challenges in visualization and analysis. Protein Sci. 27, 14–25 (2018). [DOI] [PMC free article] [PubMed] [Google Scholar]
- 74.Delaglio F et al. NMRPipe: a multidimensional spectral processing system based on UNIX pipes. J. Biomol. NMR 6, 277–293 (1995). [DOI] [PubMed] [Google Scholar]
- 75.Lee W, Tonelli M & Markley JL NMRFAM-SPARKY: enhanced software for biomolecular NMR spectroscopy. Bioinformatics 31, 1325–1327 (2015). [DOI] [PMC free article] [PubMed] [Google Scholar]
- 76.Schanda P, Kupce E & Brutscher B SOFAST-HMQC experiments for recording two-dimensional heteronuclear correlation spectra of proteins within a few seconds. J. Biomol. NMR 33, 199–211 (2005). [DOI] [PubMed] [Google Scholar]
- 77.Berendsen HJC, van der Spoel D & van Drunen R GROMACS: a message-passing parallel molecular dynamics implementation. Comput. Phys. Commun 91, 43–56 (1995). [Google Scholar]
- 78.Mukherjee R et al. Calmodulin regulates MGRN1-GP78 interaction mediated ubiquitin proteasomal degradation system. FASEB J. 33, 1927–1945 (2019). [DOI] [PubMed] [Google Scholar]
- 79.Landrum MJ et al. ClinVar: improving access to variant interpretations and supporting evidence. Nucleic Acids Res. 46, D1062–D1067 (2018). [DOI] [PMC free article] [PubMed] [Google Scholar]
- 80.Witus SR et al. BRCA1/BARD1 site-specific ubiquitylation of nucleosomal H2A is directed by BARD1. Nat. Struct. Mol. Biol 28, 268–277 (2021). [DOI] [PMC free article] [PubMed] [Google Scholar]
Associated Data
This section collects any data citations, data availability statements, or supplementary materials included in this article.
Supplementary Materials
Data Availability Statement
The atomic coordinates and EM maps have been deposited in the Protein Data Bank under accession codes 7LYA (NCP), 7LYB (BRCA1R–BARD1R–UbcH5c–NCP) and 7LYC (BARD1(ARD–BRCT)–NCPH2AK13ubK15ub), and in the Electron Microscopy Data Bank under corresponding accession codes EMD-23590, EMD-23591 and EMD-23592. Raw gels and blots are provided in Supplementary Figs. 1–6. Reagents from this study are available from the corresponding author on request.