

Abstract
Background:
There is growing evidence that exposure to low-grade inflammation may be associated with adverse health outcomes.
Methods:
We conducted a cross-sectional study within the California Teachers Study prospective cohort, among female participants who had completed a questionnaire that asked about their health behaviors (e.g., diabetes, physical activity, body mass index, medication use) and who had donated blood within a year of their questionnaire. 822 women with stored serum were evaluated for 16 immune biomarkers. In addition, four immune pathways were constructed: Th1, pro-inflammatory/macrophage activation, B-cell activation, and T-cell activation. Odds ratios (ORs) and 95% confidence intervals (CI) for the association between host characteristics and immune biomarkers were assessed using logistic regression models.
Result:
Compared to women of a normal BMI, obese women (>30 kg/m2) were positively associated with sTNFR2, CD27, IL6, CXCL13, sIL-2Rα, and IL6Ra levels above the median, with odds ratios ranging from 1.5–6.0. The pro-inflammatory/macrophage activation pathway was positively associated with diabetes (OR=2.12, 95% CI=1.14–3.95), fueled by individual associations between diabetes and sTNF-R2, TNFα and sCD27. Physical activity was inversely associated with sTNF-R2, TNFα, CXCL13, IL6, IL10, and IFN-γ levels, particularly for the highest category of activity (5.88+ hours/week) (ORs=0.32–0.69). In pathway-based analyses, the Th1 pathway which includes decreased levels of IL4 and IL10 was positively associated with elevated physical activity (OR=1.5). In contrast, the pro-inflammatory, B- and T-cell activation pathways were positively associated with higher BMI (OR ranging from 1.6–3) and inversely associated with increasing levels of physical activity.
Conclusions:
Several host characteristics were associated with circulating levels of immune biomarkers, including markers of inflammation. Further understanding of associations between immune marker profiles with human disease are warranted.
Introduction
Immune dysregulation and chronic inflammation are recognized as key biological processes in the etiology of cancers, cardiovascular diseases, and diabetes. Inflammatory responses can involve the stimulation of macrophages and T cells, and are associated with the expression of pro-inflammatory cytokines (IL-1, IL-6, TNFα), chemokines (IL-8, CXCL13), and other immune biomarkers (CRP, sIL-6R, sGP130, sIL-2Rα, sTNF-R2) (1). In cancer, chronic inflammation is considered an “enabling characteristic” whereby it creates a tumor microenvironment that permits tumor survival and proliferation (2–6). There is evidence linking elevated levels of IL-10 and IL-6 associated with AIDS-related non-Hodgkin lymphoma (NHL) (7–9) and NHL (10, 11). In type 2 diabetes, it is hypothesized that insulin resistance is provoked by inflammatory macrophages (12). In population-based studies, increases in levels of specific inflammatory markers, including CRP and IL-6, have been linked to the development of diabetes (13–16). Similarly, elevated levels of IL-6 and TNFα and CRP have been shown to be prognostic markers of cardiovascular disease (CVD) outcomes (17–19) and all-cause mortality (20).
In addition to research that has been conducted linking immune markers to health outcomes and prognosis, there is a growing number of studies linking expression of these markers to host characteristics and risk factors, many of which are shared across health outcomes. A growing number of studies have linked expression of cytokine and other immune markers with various demographic and host characteristics. For example, a study of healthy women reported significantly elevated levels of TNFα, IL-1β, IL-2, sIL-2Rα, IL-10, and IL-12p40/70 associated with increased age and body mass index (21). McKay and colleagues reported significantly higher concentrations of specific individual biomarkers associated with hypertension, obesity, and diabetes among 250 HIV-uninfected men in the Multicenter AIDS Cohort Study (22). The assessment of cytokine production/levels can thus provide important insight into which host characteristics contribute towards immune responses or chronic inflammatory environment that may increase susceptibility to a multitude of health outcomes. Validated laboratory-based multiplex assays have now been established for measuring host immune markers in large-scale epidemiologic studies, enabling characterization of immune responses on a population level.
Here, we present immune marker measurements from 16 markers, among 822 women in the California Teachers Study prospective cohort for whom health and health behaviors were assessed within a year of their blood collection. Among this subset of study participants, we evaluated immune biomarker profiles with common host characteristics, including body mass index, diabetes, physical activity, and selected medication use.
Methods
Study Population
The California Teachers Study (CTS) is a large prospective cohort recruited from active or retired teachers and members of the California State Teachers Retirement System in 1995. Complete details of the cohort have been published previously (23). A total of 64,476 women responded to a follow-up questionnaire that was conducted in 2012–2015. A large biobanking effort was conducted concurrent to the follow-up questionnaire, from 2014–2016, which included a total of 13,930 blood samples. Among these samples, we evaluated serum from 822 unique participants that completed the 2012–2015 questionnaire, were cancer free, and had provided a blood sample within a year of completing their questionnaire.
Host characteristics
We evaluated host factors assessed by self-reported follow-up questionnaire which was administered concurrently to the biobanking effort: age, NSAID use (none, 1/week, >1/week), statin use (none, >1/week), hormone therapy use (never, ever), BMI (15–24; 25–29; 30+ kg/m2), moderate/strenuous physical activity (0–2.37; 2.38–5.88; 5.88+ hours/week), diabetes (no, yes). Host characteristics were compared between the population subset that had cytokine measurements, blood collected, and completed the follow-up questionnaire (Supplemental Table 1). We note that the 822 participants were originally selected as part of a larger study on sleep characteristics. Although this subpopulation thus possess a wide range of sleep distribution (e.g., hours/night), Supplemental Table 1 shows that their general demographic characteristics do not differ from that of the overall population of the population subset that donated biospecimens. We further note that hormone use was queried and thus evaluated for the subset of participants who were post-menopausal.
Immune marker determination
Serum aliquots (250 ul) which have never been thawed, were shipped overnight to the Martinez-Maza laboratory at the University of California at Los Angeles (UCLA) for immune marker testing. Serum aliquots were tested using multiplexed immunometric assays (Luminex platform) and a Bioplex 200 system (Bio-Rad). Specifically, testing was done using two Luminex panels (R&D Systems): a panel for human inflammatory cytokines (Human Biomarker A), which included IL-1β, IL-2, IL-4, IL-6, IL-8, IL-10, IFNγ & TNFα, and a panel for soluble receptors and chemokines (Soluble Receptor Human Panel), which included B-cell activating factor of the TNF family (BAFF, also known as B lymphocyte stimulator, BLyS, or TNFSF13B), CXCL13 (also known as B lymphocyte chemoattractant, BLC, or B cell-attracting chemokine 1, BCA-1), soluble CD14 (sCD14), soluble CD27 (sCD27, also known as TNFRSF7), soluble GP130 (sGP130), sIL-2Rα (also known as sCD25), soluble IL-6 receptor (sIL-6Rα), and soluble TNF-R2 (sTNFR2, also known as TNFRSF1B). Specimens were handled in the same batch, with pairs of quality control (QC) specimens interspersed randomly in each batch (approximately 10% of samples) to monitor assay performance. 10% of the participants (n=83) were tested in duplicates with a subset of those (n=19) tested in triplicates, permitting calculation of coefficient of variations (CVs) for a total of 926 samples tested. The lower limit of detection (LLD) for each biomarker was set either as the lowest value that could be calculated or the lowest value of the standard curve, whichever was smaller. All laboratory personnel were blinded to the status of the host characteristics of the samples. Additional assay details including the LLD and CVs are presented in Supplemental Tables 2 and 3.
Laboratory QC values along with respective inter and intra plate CV values were calculated (Supplemental Table 2). All samples were conducted in a single batch. Inter-plate coefficient of variance (CV, expressed in %s) are thus calculated to ensure that there are no significant variances between the different plates in which the assays were conducted and that independent values from all plates can be evaluated together. The overall CVs for the immune markers ranged from 5.18% (sTNFR2) to 27% (IL-6). For immune markers with overall CVs >10% (CXCL13, sCD14, IL-6, TNFα), within-batch CVs were all <10%. For each plate of samples tested for a given analyte, a biomarker- and plate-specific lower limit of detection (LLD) was defined (Supplemental Table 3). Observations below the lower limit of detection (LLD) were assigned a value of one-half the plate-specific LLD for that marker. In addition, extrapolated values <0.1pg/mL were considered unreliable and were similarly assigned a value of one-half the plate-specific LLD for that marker.
Statistical analysis
We created natural log-transformed values of each cytokine for continuous analyses. Logistic regression was conducted and odds ratio (OR) and 95% confidence intervals (95% CI) were calculated for the association for each log-unit increase of the cytokine with the host factors, adjusted for age. We then categorized participants on whether they had less than or greater than the median level of each individual cytokine (Supplemental Table 2). For cytokines with less than 50% detection levels, participants were classified on whether they had detectable levels of that cytokine (IL-2, IL-4, IFNγ). Logistic regression was conducted, OR and 95% CI calculated, to evaluate the association between the categorized cytokine and host characteristics, adjusted for age. Cochran-Armitage tests for trend were conducted for host characteristics with >2 categories in SAS. Summary figures showing ORs and 95% CIs for each immune marker by host characteristic were created in R 3.6.1 using the ggplot2 package. Specifically, risk associated with 1-unit increase in biomarkers on the natural log scale were constructed for: BMI, diabetes, and physical activity. For the purposes of the figure, BMI and physical activity were retained as ordinal variables, so that the ORs presented reflect the risk for each unit/category of BMI and physical activity with a 1-unit increase in biomarker (Figure 1).
Figure.
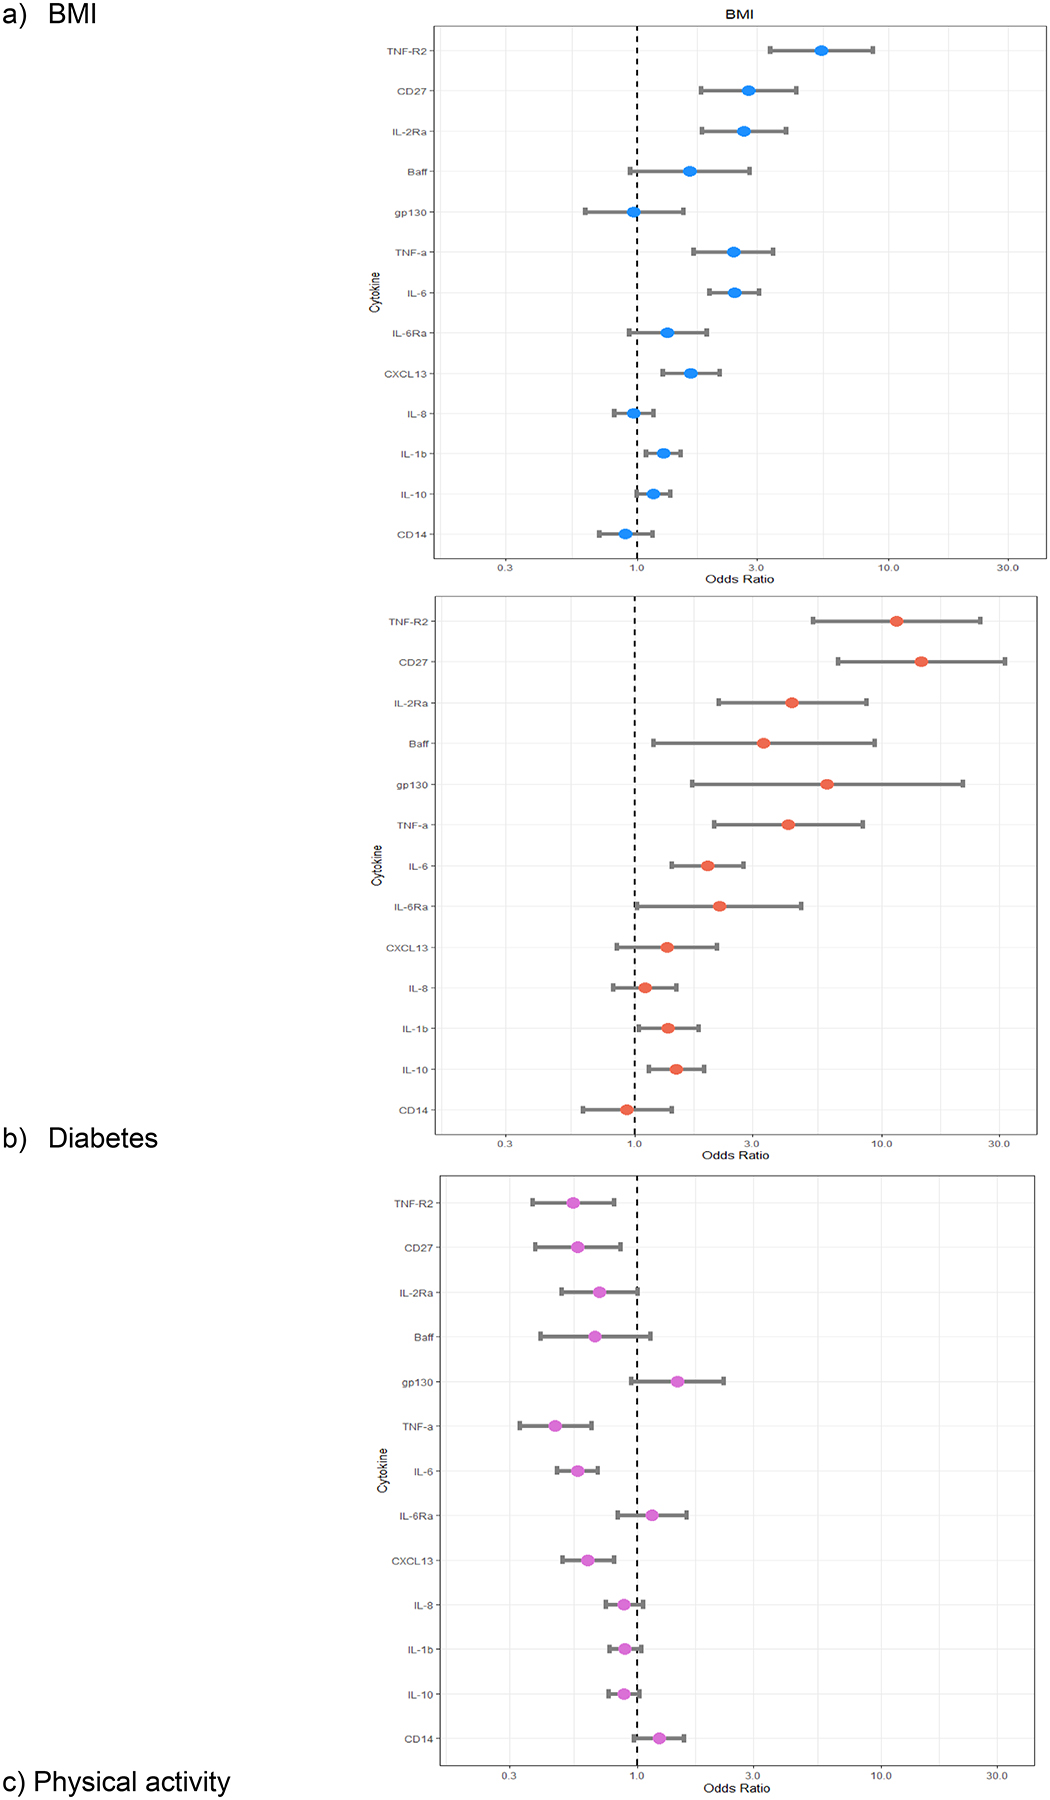
Risk associated with 1-unit increase in biomarkers on the natural log scale (OR=box, 95% CI=bar) for: BMI, diabetes, statin use, and physical activity.
We repeated these analyses based on immune pathways; Th1 (defined as elevated IFNγ and decreased levels of IL10 and IL14), pro-inflammatory/macrophage activation (defined as elevated levels of TNF, sTNFR2, IL-6, IL-1, IL-8, sIL-6Rα, IL-10, sCD14), B-cell activation (defined as elevated levels of BAFF, IL-10, IL-4, IL-6, sCD27, CXCL13), and T-cell activation (defined as elevated levels of IL-2, sIL-2Rα, IFNγ, IL4, IL6). For each pathway, the distribution (and median) of the number of elevated immune markers was determined based on the presence of each marker defined above. Each pathway was dichotomized based on the median number of elevated immune markers; those above the median number of markers present were defined as exerting the specific pathway versus not having characteristics of that pathway (e.g., below median). Specific associations between host characteristics and these immune pathways were calculated.
Based on univariate results, multivariate models were subsequently constructed, with inclusion as covariates, all host characteristics that were statistically significantly associated with immune markers in the univariate analyses. Stratified analyses by age (<65 and 65+ years old) were also conducted. All statistical tests were 2-sided and conducted using SAS 9.4 (SAS Institute Inc., Cary, NC).
Results
Compared to the eligible cohort for whom blood was collected (n=13,930), the subset of participants in this sub-study were younger, less likely to be non-Hispanic White, engaged in less physical activity, and had higher prevalence of diabetes (Supplemental Table 1). However, compared to the entire cohort population, this population subset had a similar distribution of physical activity.
In univariate analyses, a subset of immune markers appeared to track together with multiple host characteristics. Specifically, sTNFR2, TNFα, sCD27, sIL-2Rα, BAFF, and IL-6 levels were elevated among those with higher BMI, had diabetes, and used statins; decreased levels of the same immune markers were associated with higher levels of physical activity (Supplemental Table 4). As shown in Figure 1, magnitudes of risk from highest to lowest were: sTNFR2, sCD27, sIL-2Rα, TNFα, and IL-6. No associations with any immune marker were observed with hormone therapy and it was thus not included in subsequent multivariate models. In multivariate analyses, these associations were largely consistent in their direction, but not all associations remained statistically significant. Compared to women of a normal BMI, those that were obese (>30 kg/m2) were positively associated with levels above the median for the following immune markers: sTNF-R2 (OR=2.90, 95% CI=1.82–4.63), CD27 (OR=1.56, 95% CI=1.00–2.44), IL-6 (OR=6.48, 95% CI=3.86–10.8), sIL-2Rα (OR=2.6, 95% CI=1.64–4.12), and IL-6Rα (OR=1.54, 95% CI=1.00–2.39) (Table 1). Having diabetes was positively associated with sTNF-R2, TNFα and sCD27 levels above the median with odds ratios ≥2. Physical activity was inversely associated with TNFα (OR=0.58, 95% CI=0.40–0.85), CXCL13 (OR=0.55, 95% CI=0.38–0.81), IL-6 (OR=0.45, 95% CI=0.30–0.66), IL10 (OR=1.54, 95% CI=1.00–2.39), and IFN-γ (OR=0.32, 95% CI=0.11–0.92), for the highest category of activity (5.88+ hours/week). Notably, contrary to initial univariate analyses, no associations with statins were observed with any of the immune markers in multivariate analyses; no associations between any of the host characteristics and BAFF were also observed in multivariate analyses.
TABLE 1.
Association between host characteristics and immune markers. Multivariate logistic regression models are adjusted for age, race and all covariates: statins use, NSAID use, BMI, diabetes, physical activity.
| BAFF | TNF-R2 | TNF-α | CD14 | sCD27 | CXCL13 | IFN-γ | ||||||||
|---|---|---|---|---|---|---|---|---|---|---|---|---|---|---|
| OR | (95% CI) | OR | (95% CI) | OR | (95% CI) | OR | (95% CI) | OR | (95% CI) | OR | (95% CI) | OR | (95% CI) | |
| Race | ||||||||||||||
| non-Hispanic White | 1.00 | reference | 1.00 | reference | 1.00 | reference | 1.00 | reference | 1.00 | reference | 1.00 | reference | 1.00 | reference |
| Other | 1.25 | (0.87–1.81) | 0.59 | (0.40–0.88) | 1.09 | (0.75–1.58) | 0.73 | (0.50–1.05) | 0.76 | (0.52–1.10) | 0.77 | (0.53–1.11) | 1.12 | (0.46–2.71) |
| NSAID use | ||||||||||||||
| None or 1/week | 1.00 | Reference | 1.00 | Reference | 1.00 | Reference | 1.00 | Reference | 1.00 | Reference | 1.00 | Reference | 1.00 | Reference |
| > 1/week | 1.33 | (0.98–1.80) | 0.98 | (0.71–1.34) | 1.36 | (1.02–1.86) | 1.13 | (0.83–1.53) | 0.74 | (0.54–1.01) | 0.91 | (0.67–1.25) | 0.61 | (0.28–1.31) |
| Statin use | ||||||||||||||
| None | 1.00 | Reference | 1.00 | Reference | 1.00 | reference | 1.00 | Reference | 1.00 | Reference | 1.00 | Reference | 1.00 | Reference |
| >1/week | 1.06 | (0.72–1.57) | 0.87 | (0.57–1.31) | 1.11 | (0.74–1.65) | 1.09 | (0.74–1.61) | 0.88 | (0.59–1.31) | 1.16 | (0.78–1.73) | 1.81 | (0.71–4.57) |
| BMI | ||||||||||||||
| 15–24 | 1.00 | reference | 1.00 | reference | 1.00 | reference | 1.00 | reference | 1.00 | reference | 1.00 | reference | 1.00 | reference |
| 25–29 | 0.77 | (0.54–1.10) | 1.20 | (0.83–1.72) | 1.40 | (0.98–1.99) | 0.85 | (0.60–1.20) | 1.47 | (1.03–2.09) | 1.90 | (1.33–2.73) | 0.89 | (0.36–2.15) |
| 30–54.8 | 1.11 | (0.71–1.72) | 2.90 | (1.82–4.63) | 1.03 | (0.66–1.61) | 0.55 | (0.39–0.86) | 1.56 | (1.00–2.44) | 1.37 | (0.88–2.14) | 0.74 | (0.25–2.16) |
| Physical Activity (hr/week) | ||||||||||||||
| 0–2.38 | 1.00 | Reference | 1.00 | Reference | 1.00 | Reference | 1.00 | Reference | 1.00 | Reference | 1.00 | Reference | 1.00 | Reference |
| 2.38–5.88 | 0.77 | (0.53–1.12) | 0.64 | (0.43–0.95) | 0.71 | (0.49–1.03) | 1.04 | (0.72–1.51) | 0.92 | (0.63–1.33) | 0.66 | (0.45–0.96) | 0.74 | (0.32–1.72) |
| 5.88–24 | 0.75 | (0.51–1.09) | 0.78 | (0.52–1.15) | 0.58 | (0.40–0.85) | 1.24 | (0.85–1.80) | 0.70 | (0.48–1.03) | 0.55 | (0.38–0.81) | 0.32 | (0.11–0.92) |
| Diabetes | ||||||||||||||
| No | 1.00 | Reference | 1.00 | Reference | 1.00 | reference | 1.00 | Reference | 1.00 | Reference | 1.00 | reference | 1.00 | Reference |
| Yes | 1.81 | (0.98–3.35) | 2.00 | (1.02–3.90) | 2.35 | (1.24–4.47) | 0.89 | (0.49–1.61) | 2.22 | (1.18–4.17) | 0.85 | (0.47–1.54) | 0.60 | (0.12–2.97) |
| IL2 | IL4 | IL6 | IL8 | IL10 | IL-1B | IL2R α | ||||||||
|---|---|---|---|---|---|---|---|---|---|---|---|---|---|---|
| OR | (95% CI) | OR | (95% CI) | OR | (95% CI) | OR | (95% CI) | OR | (95% CI) | OR | (95% CI) | OR | (95% CI) | |
| Race | ||||||||||||||
| non-Hispanic White | 1.00 | reference | 1.00 | reference | 1.00 | reference | 1.00 | reference | 1.00 | reference | 1.00 | reference | 1.00 | reference |
| Other | 1.06 | (0.73–1.52) | 0.99 | (0.46–2.13) | 1.00 | (0.68–1.48) | 0.97 | (0.66–1.41) | 0.87 | (0.60–1.25) | 1.09 | (0.76–1.57) | 0.44 | (0.30–0.64) |
| NSAID use | ||||||||||||||
| None or 1/week | 1.00 | Reference | 1.00 | reference | 1.00 | Reference | 1.00 | reference | 1.00 | reference | 1.00 | reference | 1.00 | reference |
| > 1/week | 1.27 | (0.93–1.71) | 1.18 | (0.63–2.22) | 1.10 | (0.79–1.52) | 0.90 | (0.66–1.23) | 1.07 | (0.79–1.45) | 1.25 | (0.93–1.69) | 1.10 | (0.80–1.50) |
| Statin use | ||||||||||||||
| None | 1.00 | Reference | 1.00 | reference | 1.00 | Reference | 1.00 | reference | 1.00 | reference | 1.00 | reference | 1.00 | reference |
| >1/week | 1.07 | (0.72–1.58) | 0.75 | (0.34–1.65) | 1.29 | (0.85–1.97) | 1.44 | (0.97–2.14) | 1.18 | (0.80–1.74) | 0.96 | (0.65–1.41) | 1.06 | (0.71–1.59) |
| BMI | ||||||||||||||
| 15–24 | 1.00 | reference | 1.00 | reference | 1.00 | reference | 1.00 | reference | 1.00 | reference | 1.00 | reference | 1.00 | reference |
| 25–29 | 1.03 | (0.73–1.46) | 0.84 | (0.39–1.80) | 1.41 | (0.98–2.02) | 1.03 | (0.72–1.47) | 1.04 | (0.73–1.47) | 1.38 | (0.98–1.96) | 1.17 | (0.82–1.67) |
| 30–54.8 | 0.69 | (0.44–1.08) | 1.28 | (0.54–3.01) | 6.48 | (3.86–10.87) | 0.75 | (0.48–1.18) | 0.83 | (0.53–1.28) | 1.27 | (0.82–1.96) | 2.60 | (1.64–4.12) |
| Physical Activity (hr/week) | ||||||||||||||
| 0–2.38 | 1.00 | Reference | 1.00 | Reference | 1.00 | Reference | 1.00 | reference | 1.00 | reference | 1.00 | reference | 1.00 | reference |
| 2.38–5.88 | 0.96 | (0.66–1.39) | 0.76 | (0.35–1.64) | 0.68 | (0.46–1.00) | 0.85 | (0.58–1.25) | 0.72 | (0.50–1.05) | 0.84 | (0.58–1.21) | 0.82 | (0.56–1.20) |
| 5.88–24 | 0.99 | (0.68–1.44) | 0.89 | (0.41–1.90) | 0.45 | (0.3–0.663) | 0.83 | (0.56–1.22) | 0.69 | (0.47–1.00) | 0.90 | (0.62–1.30) | 0.88 | (0.60–1.28) |
| Diabetes | ||||||||||||||
| No | 1.00 | Reference | 1.00 | reference | 1.00 | reference | 1.00 | reference | 1.00 | reference | 1.00 | reference | 1.00 | reference |
| Yes | 1.58 | (0.88–2.85) | 1.43 | (0.49–4.14) | 0.97 | (0.49–1.95) | 1.80 | (0.97–3.34) | 1.08 | (0.60–1.94) | 1.48 | (0.82–2.68) | 0.86 | (0.47–1.59) |
| IL6Rα | GP130 | |||
|---|---|---|---|---|
| OR | (95% CI) | OR | (95% CI) | |
| Race | ||||
| non-Hispanic White | 1.00 | reference | 1.00 | reference |
| Other | 0.73 | (0.50–1.05) | 0.65 | (0.45–0.94) |
| NSAID use | ||||
| None or 1/week | 1.00 | Reference | 1.00 | reference |
| > 1/week | 0.91 | (0.67–1.23) | 1.07 | (0.79–1.46) |
| Statin use | ||||
| None | 1.00 | reference | 1.00 | reference |
| >1/week | 1.13 | (0.76–1.66) | 1.08 | (0.73–1.59) |
| BMI | ||||
| 15–24 | 1.00 | reference | 1.00 | reference |
| 25–29 | 1.43 | (1.01–2.02) | 0.96 | (0.67–1.36) |
| 30–54.8 | 1.54 | (1.00–2.39) | 0.84 | (0.54–1.30) |
| Physical Activity (hr/week) | ||||
| 0–2.38 | 1.00 | reference | 1.00 | reference |
| 2.38–5.88 | 0.97 | (0.67–1.41) | 0.89 | (0.61–1.29) |
| 5.88–24 | 1.02 | (0.71–1.49) | 1.13 | (0.77–1.65) |
| Diabetes | ||||
| No | 1.00 | reference | 1.00 | Reference |
| Yes | 0.94 | (0.52–1.69) | 1.51 | (0.83–2.74) |
In age-stratified analyses, we note that although associations among diabetes were largely consistent in the two age strata (<65 and 65+ years old), the magnitude of risk among the <65 year old strata was more pronounced (e.g., TNF-α OR=4.37) than those 65+ years old (TNF-α OR=1.98). We further note that statins use follows the same pattern whereby associations were only apparent among the <65 years old age strata (data not shown). The lack of an association between statins and immune markers in the multivariate analyses could potentially be explained by its close link to diabetes and obesity. Among the 77 diabetics in our population subset, 76% reported being on statins and 66% had a BMI considered obese.
Evaluation by a priori defined immune pathways showed that pro-inflammatory/macrophage activation, B-cell activation, and T-cell activation markers were positively associated with higher BMI and inversely associated with higher physical activity (Table 2). In multivariate analyses of pathway-based analyses, obesity was positively associated with pro-inflammatory/macrophage activation (OR=1.66, 95% CI=1.05–2.61), B-cell activation (OR=2.08, 95% CI=1.32–3.25), and T-cell activation (OR=2.85, 95% CI=1.79–4.55) pathways. On the contrary, physical activity was inversely associated with pro-inflammatory/macrophage, B-, and T-cell activation markers with ORs of 0.66, 0.52, and 0.57 for the highest category of physical activity. Notably, the Th1 pathway which includes decreased levels of IL10 was associated with an OR of 1.5 for increased physical activity for both higher strata of moderate/strenuous activity. Only the pro-inflammatory/macrophage activation pathway was positive associated with diabetes (OR=2.12, 95% CI=1.14–3.95). Associations across each of the implicated pathways are largely explained by their composition of immune markers which have individually been implicated in risk associations (e.g., TNFα, sTNFR2, and IL-6 in pro-inflammatory/macrophage activation; IL-6 and sCD27 in B-cell activation, and sIL-2Rα and IL-6 in T-cell activation).
TABLE 2.
Association between host characteristics and immune markers defining specific pathways: (i) Th1 pathway; (ii) Pro-inflammatory/aacrophage activation; (iii) B-cell activation; (iv) T-cell activation. Multivariate logistic regression models are adjusted for age, race and all covariates: statins use, NSAID use, BMI, diabetes, physical activity.
| Th1 | Pro-inflammatory/Macrophage activation | B cell activation | T cell activation | |||||
|---|---|---|---|---|---|---|---|---|
| OR | 95% CI | OR | 95% CI | OR | 95% CI | OR | 95% CI | |
| Race | ||||||||
| non-Hispanic White | 1.00 | reference | 1.00 | reference | 1.00 | Reference | 1.00 | reference |
| Other | 1.08 | (0.75–1.56) | 0.59 | (0.40–0.88) | 0.97 | (0.67–1.40) | 0.79 | (0.54–1.15) |
| NSAID use | ||||||||
| None or 1/week | 1.00 | Reference | 1.00 | Reference | 1.00 | Reference | 1.00 | Reference |
| > 1/week | 0.83 | (0.61–1.12) | 1.13 | (0.82–1.55) | 1.05 | (0.77–1.43) | 1.30 | (0.95–1.77) |
| Statin use | ||||||||
| None | 1.00 | Reference | 1.00 | Reference | 1.00 | reference | 1.00 | reference |
| >1/week | 0.99 | (0.671–1.46) | 1.14 | (0.77–1.71) | 1.07 | (0.72–1.60) | 1.30 | (0.86–1.96) |
| BMI | ||||||||
| 15–24 | 1.00 | Reference | 1.00 | Reference | 1.00 | Reference | 1.00 | reference |
| 25–29 | 0.94 | (0.664–1.34) | 1.43 | (0.99–2.06) | 1.43 | (1.00–2.03) | 1.31 | (0.92–1.88) |
| 30–54.8 | 1.20 | (0.771–1.85) | 1.66 | (1.05–2.61) | 2.08 | (1.32–3.25) | 2.85 | (1.79–4.55) |
| Physical Activity (hr/week) | ||||||||
| 0–2.38 | 1.00 | Reference | 1.00 | Reference | 1.00 | reference | 1.00 | reference |
| 2.38–5.88 | 1.52 | (1.05–2.21) | 0.60 | (0.41–0.89) | 0.66 | (0.45–0.96) | 0.76 | (0.52–1.11) |
| 5.88–24 | 1.50 | (1.03–2.18) | 0.66 | (0.44–0.97) | 0.53 | (0.36–0.78) | 0.57 | (0.39–0.84) |
| Diabetes | ||||||||
| No | 1.00 | Reference | 1.00 | reference | 1.00 | Reference | 1.00 | reference |
| Yes | 0.85 | (0.47–1.54) | 2.12 | (1.14–3.95) | 1.43 | (0.76–2.67) | 1.07 | (0.56–2.03) |
Discussion
Our results support the existing body of literature that has implicated the elevation of inflammatory cytokines in obese and diabetic individuals. Within a cohort of women, we further expand these observations to other immune markers and related health conditions, thereby providing a generalizable context for our results. Specifically, we observed a subset of immune markers (IL-6, sTNFR2, sCD27, sIL-2Rα), including pro-inflammatory cytokines (e.g., IL-6), to have elevated serum levels among study participants who reported higher BMI and specifically were obese. We also observed a smaller subset of markers (TNF-R2, TNF-α, sCD27) that were statistically significantly associated with diabetes in multivariate analyses. For obesity, magnitudes of risk were highest (>2.5) for IL-6, sTNFR2 and sIL-2Rα. Associations with diabetes were all ~2-fold. Inverse associations with the same subset of immune markers was observed among those reporting higher levels of physical activity at the time of blood draw.
Our results for the pro-inflammatory cytokine IL-6 associated with obesity is consistent with the current literature; although we observed an association between elevated IL-6 and diabetes in univariate analyses, the risk was no longer significant in our multivariate analyses. It is well established that adipose tissues produce large quantities of inflammatory markers, such as IL-6 (24). The link between IL-6 and obesity and diabetes has been extensively studied and plays a central role in inflammation (25). Levels of IL-6 and TNFα have also been shown to be elevated in circulating serum in a number of populations among obese population subsets (21, 22, 26–31), including in both men and women and among young adults. In particular, our results for IL-6 are consistent with Dossus (32), where among nearly 800 European women, IL-6 and TNFα were associated with higher BMI. Although the univariate association between TNF-α and BMI in our data was no longer significant in multivariate analyses, we note that the TNF-R2 association with obesity remained robust. Because sTNFR2 serves as a surrogate (a more readily detectable marker for TNFα expression), our observed association between sTNFR2 and obesity thus can be considered consistent with the published literature. Our reported positive association between diabetes and TNFα is also consistent with the current literature (13, 33–35) where associations have also been reported in both men and women, and in a recent meta-analysis (36). In the EPIC-Potsdam study of type 2 diabetes (29), TNFα levels were elevated among study participants with incident type 2 diabetes. However, the same study also reported elevated levels of IL-6 and diabetes, which we did initially observe in univariate but not in subsequent multivariate analyses. The associations with IL6, TNF, and sTNFR2 likely drive the pathway-based associations observed with pro-inflammatory/macrophage activation, of which inflammatory macrophage is notedly associated with diabetes (12). We also observed significant positive associations between obesity and broader pathways, including the B-cell and T-cell activation pathways. In addition to being driven by IL6, the observed association between sIL-2Rα and obesity potentially further expands the role beyond inflammation to T-cell activation; in addition to being a measure of T-cell activation, sIL-2Rα is also a marker of memory B cells (1). Our data are consistent with the notion posited by Spranger and colleagues, who stated that inflammatory reactions resulting in disease may depend on a cluster of cytokines rather than single cytokines (37).
It is worth noting that among these associations, we observed prominent associations with three members of the TNF or TNF-receptor superfamily: TNFα, TNFR2, and CD27. TNFα is a pro-inflammatory cytokine produced by activated macrophages, and TNFR2 is one of two primary receptors for TNFα. Serum levels of sTNFR2 are correlated with TNFα levels and activity. Less has been published on CD27, but as a member of the TNF-receptor superfamily and a key protein for maintaining T cell immunity and regulating B-cell activation, further investigation on the role of the TNF and TNF-receptor superfamilies may be warranted in understanding its role in chronic inflammation in common disease endpoints.
A number of studies evaluating the influence of physical activity on inflammatory markers has focused on intense physical activity and the immediate effects of elevated inflammatory immune cytokines, particularly IL-6 (38, 39). Our results thus add to the current literature demonstrating biological benefits of moderate and strenuous physical activity whereby inverse associations were observed between inflammatory immune markers and physical activity reported over the last three years. In fact, physical activity was associated inversely with IL-6 levels with the largest magnitude. Our results are somewhat consistent with those reported by Radom-Aizik (40) where suppression of serum levels for TNFα in both human and mouse models was observed with elevated physical activity levels. While Radom-Aizik also observed suppression of IL2 levels, we did not observe significant reduction in IL2 with elevated physical activity levels in our population subset. Our results do extend the immediate effects observed by El Kader (41) of decreased mean values of IL-6 among obese and type 2 diabetic patients after receiving aerobic exercise training and that of Cottam (42) where TNFα and IL-6 levels were also significantly decreased among patients undergoing weight loss surgery. Our results, however, did not show decreased IL-2 or IL-4 levels with physical activity as shown in El Kader (41) or with weight loss for IL-2 in Cottam (42). We also note that in our study, sCD14 levels were reduced with higher reported physical activity, consistent with by Markofski (43). The decreased levels of IL-10 was contrary to our hypothesis. IL-10 is an anti-inflammatory cytokine and multiple studies have demonstrated elevated IL-10 levels corresponding to a variety of physical activities including acute exercise and among marathon runners (47). In pathway analyses, the corresponding Th1 pathway which was defined as elevated IFNγ and decreased levels of IL-4 and IL-10 was associated with increasing levels of physical activity. It is not readily apparent why our results for IL-10 were opposite than expected. It is possible that our results may differ due to our population of only women or perhaps due to the long-term and more moderate activity captured in our population compared to the intensity of activity where immune correlates have more traditionally been captured. We also cannot exclude the possibility of insufficient power or that our result is due to chance.
Our results reflecting associations between statins and elevated immune markers was initially surprising when we had hypothesized that the reported regular use of statins and NSAIDs would potentially yield an inverse association. As described in the results, those associations were no longer statistically significant in multivariate models, likely due to the major overlap between participants who reported having diabetes, using statins, and those who were obese. Among our diabetic population, three-quarters use statins and two-thirds are obese. Statins use thus likely reflects the associations between obesity and diabetes, making our results consistent with the null associations reported by Cimato and Palka (45, 46) who found no difference in cytokines with statin use and posited the relationship was confounded by the characteristics of those who takes statins for the underlying CVD and hypercholesterolemia (44, 45). NSAIDs are recognized to suppress cytokine production but as in Terink (39), we also observed no associations between NSAID use and any of our immune markers. It is possible that other associations such as physical activity may outweigh the impact of anti-inflammatory medication on cytokine levels in our population
Study strengths include the relatively broad number of host characteristics that were collected at the time of blood draw and account for the characteristics simultaneously in multivariate models. In addition to obesity and diabetes, we were able to account for medication use, particularly NSAID and statins, and physical activity. We further excluded potential confounding by acute illnesses at the time of blood draw. Our population subset is a relatively large group for assessing healthy individuals and our broad scope of immune markers permitted us to construct distinct immune pathways from which to evaluate. This analytic approach enabled us to combine individual immune markers into singular measurements to implicate specific immune pathways with enhanced power. Finally, the study utilized standardized specimen collection, processing and storage protocols to ensure uniform measurements downstream. Specimens were thus unthawed and treated uniformly by being sent directly to and analyzed by a single laboratory to minimize assay variability.
Study limitations include the inclusion of women only, though we note several of our associations reported were consistent with previously reported studies among different populations, including men. We also cannot exclude the possibility that some of the associations reported are explained by chance.
In summary, our study results add to the growing literature on host characteristics and their effect on immune markers and cytokines, particularly regarding the hypothesis that conditions such as obesity and diabetes result in chronic low-grade systemic inflammation. While our results appear to support this hypothesis, we do note that in our a priori classification of immune markers, not all proinflammatory markers (including sIL-6Rα) were elevated with higher BMI or diabetes, or decreased with physical activity. Continued research in understanding the interplay between individual immune markers and between pathways should increase our understanding of biological processes that underlie these host characteristics and disease entities.
Supplementary Material
Supplemental Table 1. Distribution of select host characteristics among subset of cohort participants who: (i) completed the follow-up questionnaire in 2012–2015 (Q5), (ii) donated blood between 2013–2016, and (iii) had immune markers evaluated from their serum.
Supplemental Table 2. Inter-plate Coefficient of Variance (CV) for each immune marker
Supplemental Table 3. Proportion detectable and median (IQR) of detectable biomarker concentrations among the 16 immune markers measured in 822 participants whose blood were collected concurrent to their response to questions regarding their sleep characteristics, and who were not diagnosed with breast cancer at the time of their blood draw (California Teachers Study).
Supplemental Table 4. Univariate association between host characteristics and immune markers. Logistic regression models are adjusted for age only.
Supplemental Table 5. Univariate association between host characteristics and immune markers defining specific pathways: (i) Th1 pathway; (ii) Pro-inflammatory/macrophage activation; (iii) B-cell activation; (iv) T-cell activation. Logistic regression models are adjusted for age only.
Highlights.
Obesity was positively associated with elevated levels of pro-inflammatory cytokines, including IL6, sCD27 and sTNFR2.
Having diabetes was positively associated with the pro-inflammatory/macrophage activation pathway.
Strenuous/moderate physical activity was inversely associated with detectable levels of immune markers, including sTNF-R2, TNFα and IL6.
Acknowledgements
SSW, PR, JCD, OM conceived of the study; CZ, SH, DG, NC, OM, ME, JVL, and LM conducted data collection and data analysis; all contributed to data interpretation and manuscript preparation. All authors read and approved the final manuscript.
We are grateful to the women of the California Teachers Study for their continued participation and enthusiasm for the study and to the California Teachers Study Steering Committee for their scientific guidance and insight.
The California Teachers Study and the research reported in this publication were supported by the National Cancer Institute of the National Institutes of Health under award number U01-CA199277; P30-CA033572; P30-CA023100; UM1-CA164917; R01-CA077398; R01-CA207020. The content is solely the responsibility of the authors and does not necessarily represent the official views of the National Cancer Institute or the National Institutes of Health. The opinions, findings, and conclusions expressed herein are those of the author(s) and do not necessarily reflect the official views of the State of California, Department of Public Health, the National Cancer Institute, the National Institutes of Health, or their Contractors and Subcontractors, or the Regents of the University of California, or any of its programs.
Footnotes
Publisher's Disclaimer: This is a PDF file of an unedited manuscript that has been accepted for publication. As a service to our customers we are providing this early version of the manuscript. The manuscript will undergo copyediting, typesetting, and review of the resulting proof before it is published in its final form. Please note that during the production process errors may be discovered which could affect the content, and all legal disclaimers that apply to the journal pertain.
The authors declare no potential conflicts of interest
Statement of Ethics
The CTS is approved by Institutional Review Boards of the City of Hope, the University of Southern California, the University of California (UC) at San Francisco, and UC Irvine, and by the Committee for the Protection of Human Subjects of the California Health and Human Services Agency. Informed consent was obtained at study entry.
Declaration of interests
The authors declare that they have no known competing financial interests or personal relationships that could have appeared to influence the work reported in this paper.
REFERENCES
- 1.Martínez-Maza O, Moreno AD, Cozen W (2010) Epidemiological Evidence: IgE, Allergies, and Hematopoietic Malignancies. In: Penichet M, Jensen-Jarolim E (eds) Cancer and IgE. Humana Press. http://doi-org-443.webvpn.fjmu.edu.cn/10.1007/978-1-60761-451-7_5 [Google Scholar]
- 2.Hanahan D, Weinberg RA. Hallmarks of cancer: the next generation. Cell. 2011;144(5):646–674. [DOI] [PubMed] [Google Scholar]
- 3.Balkwill F, Coussens LM. Cancer: an inflammatory link. Nature. 2004;431:405–406. [DOI] [PubMed] [Google Scholar]
- 4.Balkwill F, Mantovani A. Inflammation and cancer: Back to Virchow? Lancet. 2001;357:539–545. [DOI] [PubMed] [Google Scholar]
- 5.Coussens LM, Werb Z. Inflammation and cancer. Nature. 2002;420(6917):860–867. [DOI] [PMC free article] [PubMed] [Google Scholar]
- 6.Grivennikov SI, Greten FR, Karin M. Immunity, Inflammation, and Cancer. Cell. 2010;140:883–899. [DOI] [PMC free article] [PubMed] [Google Scholar]
- 7.Vendrame E, Hussain SK, Breen EC, et al. Serum levels of cytokines and biomarkers for inflammation and immune activation, and HIV-associated non-Hodgkin B-cell lymphoma risk. Cancer Epidemiol Biomarkers Prev. 2014;23(2):343–349. [DOI] [PMC free article] [PubMed] [Google Scholar]
- 8.Epeldegui M, Martínez-Maza O. Immune Activation: Contribution to AIDS-Associated Non-Hodgkin Lymphoma. For Immunopathol Dis Therap. 2015;6(1–2):79–90. [DOI] [PMC free article] [PubMed] [Google Scholar]
- 9.Epeldegui M, Lee JY, Martinez AC, Widney DP, Magpantay LI, Regidor D, Mitsuyasu R, Sparano JA, Ambinder RF, Martinez-Maza O. Predictive Value of Cytokines and Immune Activation Biomarkers in AIDS-Related Non-Hodgkin Lymphoma Treated with Rituximab plus Infusional EPOCH (AMC-034 trial). Clin Cancer Res. 2016. 22(2):328–336. [DOI] [PMC free article] [PubMed] [Google Scholar]
- 10.DeRoos AJ, Mirick DK, Edlefsen KL, et a. Markers of B-cell activation in relation to risk of non-Hodgkin lymphoma. Cancer Res. 2012;72(18):4733–4743. [DOI] [PMC free article] [PubMed] [Google Scholar]
- 11.Gu Y, et al. Circulating cytokines and risk of B-cell non-Hodgkin lymphoma: A prospective study. Cancer Causes Control. 2010;21:1323–1333. [DOI] [PMC free article] [PubMed] [Google Scholar]
- 12.Zeyda M, Stulnig TM. Obesity, inflammation, and insulin resistance–a mini-review. Gerontology. 2009;55:379–86. [DOI] [PubMed] [Google Scholar]
- 13.Duncan BB, et al. Low-Grade Systemic Inflammation and the Development of Type 2 Diabetes: The Atherosclerosis Risk in Communities Study. Diabetes. 2003;52:1799–1805. [DOI] [PubMed] [Google Scholar]
- 14.Bowker N, Shah RL, Sharp SJ, et al. Meta-analysis investigating the role of interleukin-6 mediated inflammation in type 2 diabetes. EBioMedicine. 2020;61:103062. [DOI] [PMC free article] [PubMed] [Google Scholar]
- 15.Folsom AR, Heiss G; Atherosclerosis Risk in Communities Study. Low-grade systemic inflammation and the development of type 2 diabetes: the atherosclerosis risk in communities study. Diabetes. 2003;52(7):1799–805. [DOI] [PubMed] [Google Scholar]
- 16.Visser M, Bouter LM, McQuillan GM, Wener MH, Harris TB. Elevated C-reactive protein levels in overweight and obese adults. JAMA. 1999;282:2131–2135. [DOI] [PubMed] [Google Scholar]
- 17.Libby P, Ridker PM, Hansson GK. Inflammation in Atherosclerosis. From Pathophysiology to Practice. Journal of the American College of Cardiology. 2009;54:2129–2138. [DOI] [PMC free article] [PubMed] [Google Scholar]
- 18.Ridker PM, Rifai N, Stampfer MJ, Hennekens CH. Plasma Concentration of Interleukin-6 and the Risk of Future Myocardial Infarction Among Apparently Healthy Men. Circulation. 2000;101:1767–1772. [DOI] [PubMed] [Google Scholar]
- 19.Stoner L, et al. Inflammatory biomarkers for predicting cardiovascular disease. Clinical Biochemistry. 2013;46:1353–1371. [DOI] [PubMed] [Google Scholar]
- 20.Baune BT, Rothermundt M, Ladwig KH, Meisinger C, Berger K. Systemic inflammation (Interleukin 6) predicts all-cause mortality in men: results from a 9-year follow-up of the MEMO Study. Age (Dordr). 2011;33(2):209–217. [DOI] [PMC free article] [PubMed] [Google Scholar]
- 21.Clendenen TV, Lundin E, Zeleniuch-Jacquotte A, Koenig KL, Berrino F, Lukanova A, Lokshin AE, Idahl A, Ohlson N, Hallmans G, Krogh V, Sieri S, Muti P, Marrangoni A, Nolen BM, Liu M, Shore RE, Arslan AA. Circulating inflammation markers and risk of epithelial ovarian cancer. Cancer Epidemiol Biomarkers Prev. 2011;20(5):799–810. [DOI] [PMC free article] [PubMed] [Google Scholar]
- 22.McKay HS, Bream JH, Margolick JB, et al. Host factors associated with serologic inflammatory markers assessed using multiplex assays. Cytokine. 2016;85:71–79. [DOI] [PMC free article] [PubMed] [Google Scholar]
- 23.Bernstein L, Allen M, Anton-Culver H, et al. High breast cancer incidence rates among California teachers: results from the California Teachers Study (United States). Cancer Causes Control. 2002;13(7):625–35. [DOI] [PubMed] [Google Scholar]
- 24.Clendenen TV, et al. Factors associated with inflammation markers, a cross-sectional analysis. Cytokine. 2011;56:769–78. [DOI] [PMC free article] [PubMed] [Google Scholar]
- 25.Ghosh S, Ashcraft K. An IL-6 link between obesity and cancer. Front Biosci (Elite Ed). 2013;5:461–78. [DOI] [PubMed] [Google Scholar]
- 26.Gregor MF, Hotamisligil GS. Inflammatory mechanisms in obesity. Annu Rev Immunol. 2011;29:415–445. [DOI] [PubMed] [Google Scholar]
- 27.Kacel EL, Kirsch JL, Sannes TS, et al. Interleukin-6 and body mass index, tobacco use, and sleep in gynecologic cancers. Health Psychol. 2019;38(10):866–877. [DOI] [PMC free article] [PubMed] [Google Scholar]
- 28.Borges MD, Franca EL, Fujimori M, Silva SMC, de Marchi PGF, Deluque AL, Honorio-Franca AC, de Abreu LC. Relationship between Proinflammatory Cytokines/Chemokines and Adipokines in Serum of Young Adults with Obesity. Endocr Metab Immune Disord Drug Targets. 2018;18(3):260–267. [DOI] [PubMed] [Google Scholar]
- 29.Spranger J, Kroke A, Möhlig M, Hoffmann K, Bergmann MM, Ristow M, Boeing H, Pfeiffer AF. Inflammatory cytokines and the risk to develop type 2 diabetes: results of the prospective population-based European Prospective Investigation into Cancer and Nutrition (EPIC)-Potsdam Study. Diabetes. 2003. March;52(3):812–7. [DOI] [PubMed] [Google Scholar]
- 30.Dossus L, Lukanova A, Rinaldi S, EPIC co-authors including Allen N. Hormonal, metabolic, and inflammatory profiles and endometrial cancer risk within the EPIC cohort—a factor analysis. Am J Epidemiol 2013; 177: 787–99. [DOI] [PubMed] [Google Scholar]
- 31.Dossus L, Rinaldi S, Becker S, et al. Obesity, inflammatory markers, and endometrial cancer risk: a prospective case-control study. Endocr Relat Cancer. 2010;17(4):1007–1019. [DOI] [PMC free article] [PubMed] [Google Scholar]
- 32.Dossus L, Franceschi S, Biessy C, EPIC co-authors including Schmidt JA, Travis RC. Adipokines and inflammation markers and risk of differentiated thyroid carcinoma: The EPIC study. Int J Cancer 2018;142:1332–1342. [DOI] [PubMed] [Google Scholar]
- 33.Marques-Vidal P, Bastardot F, von Känel R, Paccaud F, Preisig M, Waeber G, Vollenweider P. Association between circulating cytokine levels, diabetes and insulin resistance in a population-based sample (CoLaus study) Clin Endocrinol (Oxf) 2013;78:232–41. [DOI] [PubMed] [Google Scholar]
- 34.Mirza S, Hossain M, Mathews C, Martinez P, Pino P, Gay JL, Rentfro A, McCormick JB, Fisher-Hoch SP. Type 2-diabetes is associated with elevated levels of TNF-alpha, IL-6 and adiponectin and low levels of leptin in a population of Mexican Americans: a cross-sectional study. Cytokine. 2012;57:136–42. [DOI] [PMC free article] [PubMed] [Google Scholar]
- 35.Alzamil H. Elevated Serum TNF-α Is Related to Obesity in Type 2 Diabetes Mellitus and Is Associated with Glycemic Control and Insulin Resistance. J Obes. 2020:5076858. [DOI] [PMC free article] [PubMed] [Google Scholar]
- 36.Liu C, Feng X, Li Q, Wang Y, Li Q, Hua M. Adiponectin, TNF-α and inflammatory cytokines and risk of type 2 diabetes: A systematic review and meta-analysis. Cytokine. 2016;86:100–109. [DOI] [PubMed] [Google Scholar]
- 37.Zatterale F, Longo M, Naderi J, et al. Chronic Adipose Tissue Inflammation Linking Obesity to Insulin Resistance and Type 2 Diabetes. Front Physiol. 2020;10:1607. [DOI] [PMC free article] [PubMed] [Google Scholar]
- 38.Suzuki K. Cytokine Response to Exercise and Its Modulation. Antioxidants (Basel). 2018;7(1):17. [Google Scholar]
- 39.Terink R, Bongers CCWG, Witkamp RF, et al. Changes in cytokine levels after prolonged and repeated moderate intensity exercise in middle-aged men and women. Transl Sports Med. 2018;1:110–119. [Google Scholar]
- 40.Radom-Aizik S, Leu SY, Cooper DM, Zaldivar F Jr. Serum from exercising humans suppresses t-cell cytokine production. Cytokine. 2007;40(2):75–81. [DOI] [PMC free article] [PubMed] [Google Scholar]
- 41.El-Kader S, Gari A, Salah El-Den A. Impact of moderate versus mild aerobic exercise training on inflammatory cytokines in obese type 2 diabetic patients: a randomized clinical trial. Afr Health Sci. 2013;13(4):857–863. doi: 10.4314/ahs.v13i4.1 [DOI] [PMC free article] [PubMed] [Google Scholar]
- 42.Cottam D, Fisher B, Ziemba A, Atkinson J, Grace B, Ward DC, Pizzorno G. Tumor growth factor expression in obesity and changes in expression with weight loss: another cause of increased virulence and incidence of cancer in obesity, Surgery for Obesity and Related Diseases,Volume 6, Issue 5, 2010, Pages 538–541, [DOI] [PubMed] [Google Scholar]
- 43.Markofski MM, Flynn MG, Carrillo AE, Armstrong CL, Campbell WW, Sedlock DA. Resistance percentage without weight loss in older adults. Eur J Appl Physiol. 2014. August;114(8):1737–48. [DOI] [PubMed] [Google Scholar]
- 44.Cimato TR, Palka BA, Lang JK, Young RF. LDL cholesterol modulates human CD34+ HSPCs through effects on proliferation and the IL-17 G-CSF axis. PLoS ONE. 2013;26:e764. [DOI] [PMC free article] [PubMed] [Google Scholar]
- 45.Cimato TR, Palka BA. Fractalkine (CX3CL1), GM-CSF and VEGF-a levels are reduced by statins in adult patients. Clinical and Translational Medicine. 2014;3:14. doi: 10.1186/2001-1326-3-14. [DOI] [PMC free article] [PubMed] [Google Scholar]
- 46.Cimato TR, Palka BA. Effects of statins on TH1 modulating cytokines in human subjects. PeerJ. 2015;3:e764. [DOI] [PMC free article] [PubMed] [Google Scholar]
- 47.Schmidt FM, Weschenfelder J, Sander C, Minkwitz J, Thormann J, Chittka T, et al. (2015) Inflammatory Cytokines in General and Central Obesity and Modulating Effects of Physical Activity. PLoS ONE 10(3): e0121971. [DOI] [PMC free article] [PubMed] [Google Scholar]
Associated Data
This section collects any data citations, data availability statements, or supplementary materials included in this article.
Supplementary Materials
Supplemental Table 1. Distribution of select host characteristics among subset of cohort participants who: (i) completed the follow-up questionnaire in 2012–2015 (Q5), (ii) donated blood between 2013–2016, and (iii) had immune markers evaluated from their serum.
Supplemental Table 2. Inter-plate Coefficient of Variance (CV) for each immune marker
Supplemental Table 3. Proportion detectable and median (IQR) of detectable biomarker concentrations among the 16 immune markers measured in 822 participants whose blood were collected concurrent to their response to questions regarding their sleep characteristics, and who were not diagnosed with breast cancer at the time of their blood draw (California Teachers Study).
Supplemental Table 4. Univariate association between host characteristics and immune markers. Logistic regression models are adjusted for age only.
Supplemental Table 5. Univariate association between host characteristics and immune markers defining specific pathways: (i) Th1 pathway; (ii) Pro-inflammatory/macrophage activation; (iii) B-cell activation; (iv) T-cell activation. Logistic regression models are adjusted for age only.