

Abstract
The quantitative accuracy and precision of brain positron emission tomography (PET) studies can be considerably improved using dedicated brain PET scanners with a uniform high resolution and a high sensitivity across the brain volume. One approach to building such a system is to construct the PET scanner using depth-of-interaction (DOI) encoding detectors with finely segmented and thick crystal arrays. In this paper, the performance of a DOI PET detector based on two 16 × 16 arrays of 2 × 2 mm2 SiPMs coupled to both ends of a 44 × 44 array of 0.69 × 0.69 × 30 mm3 polished LYSO crystals was evaluated at different temperatures (−9°C, 0°C, 10°C, and 20°C) for brain PET applications. The pitch size of the LYSO array is 0.75 mm. The flood histograms show that all the crystal elements in the LYSO array can be resolved except some edge crystals, due to the limited light sharing. The average energy resolution, average DOI resolution, and average timing resolution across crystal elements are 21.1 ± 3.0%, 3.47 ± 0.17 mm, and 1.38 ± 0.09 ns, respectively, which were obtained at a bias voltage of 56.5 V and a temperature of 0°C.
Keywords: Detector design and construction technologies and materials; Gamma camera; SPECT; PET PET/CT; coronary CT angiography (CTA); Gamma detectors (scintillators, CZT, HPGe, HgI etc)
1. Introduction
Brain positron emission tomography (PET) is a powerful in vivo functional molecular imaging tool for research studies and potentially for clinical diagnostics [1–3]. The quantitative accuracy and precision of brain PET studies can be improved using higher spatial resolution and higher detection sensitivity brain PET systems [4–6]. To obtain high spatial resolution, scanner geometries with a smaller ring diameter are preferred to reduce the annihilation photon acolinearity effect. Also, scintillator arrays with smaller pitch size are required to obtain higher intrinsic resolution [7] and detectors with good depth-of-interaction (DOI) information are required to reduce the parallax effect and obtain uniform resolution across the brain [4, 7]. To improve the detection sensitivity, different approaches can be applied, such as using detectors with thicker scintillators, improving the solid angle coverage [5], and reducing the deadspace between detector modules [8].
Because the performance of the PET system is dominated by the detector, different DOI encoding detectors have been proposed to simultaneously obtain high resolution and high detection efficiency, such as detectors with multi-layer crystals [4, 9], detectors based on monolithic crystals [10, 11], and detectors based on photodetectors coupled to both ends of scintillator arrays [8, 12]. Compared to other methods, dual-ended readout detectors based on scintillator arrays can provide an excellent combination of high spatial resolution and high detection efficiency, and have been used in several pre-clinical PET scanners [13–17].
In this paper, the performance in terms of flood histogram quality, energy resolution, DOI resolution, and timing resolution of a DOI PET detector based on two custom 16 × 16 arrays of 2 × 2 mm2 silicon photomultipliers (SiPMs) coupled to both ends of a 44 × 44 array of 0.69 × 0.69 × 30.0 mm3 LYSO crystals was evaluated for future application in a dedicated brain PET system. SiPMs with an active area of 2 × 2 mm2 were used to improve the packing fraction of the detector (the ratio of the LYSO array area to the SiPM array area) and to reduce the edge effects of the detector.
2. Materials and methods
2.1. DOI detector
The DOI encoding detector module consists of two custom 16 × 16 SiPM arrays coupled to both ends of a 44 × 44 LYSO array (figures 1 and 2). Each custom 16 × 16 SiPM array was fabricated by tiling four Hamamatsu S13361-2050NE-08 SiPM arrays (Hamamatsu Photonics K.K. Japan), arranged in a 2 × 2 configuration, on a printed circuit board (PCB) (figure 1 (left)). Each S13360 SiPM consists of 1584 microcells with a microcell size of 50 μm and has an active area of 2 × 2 mm2. The S13361-2050NE-08 SiPM array consists of an 8 × 8 array of S13360 SiPMs, with a surface area of 17.8 × 17.8 mm2. The pitch of the S13361-2050NE-08 SiPM array is 2.2 mm, leaving a 0.2 mm dead space between SiPMs. The dimensions of the entire 16 × 16 SiPM array are 35.7 × 35.7 mm2 (figure 1), and the gap between S13361-2050NE-08 SiPM arrays is 0.1 mm. The deadspace between adjacent SiPMs belonging to different S13361-2050NE-08 SiPM arrays is 0.5 mm (figure 1 (right)).
Figure 1.
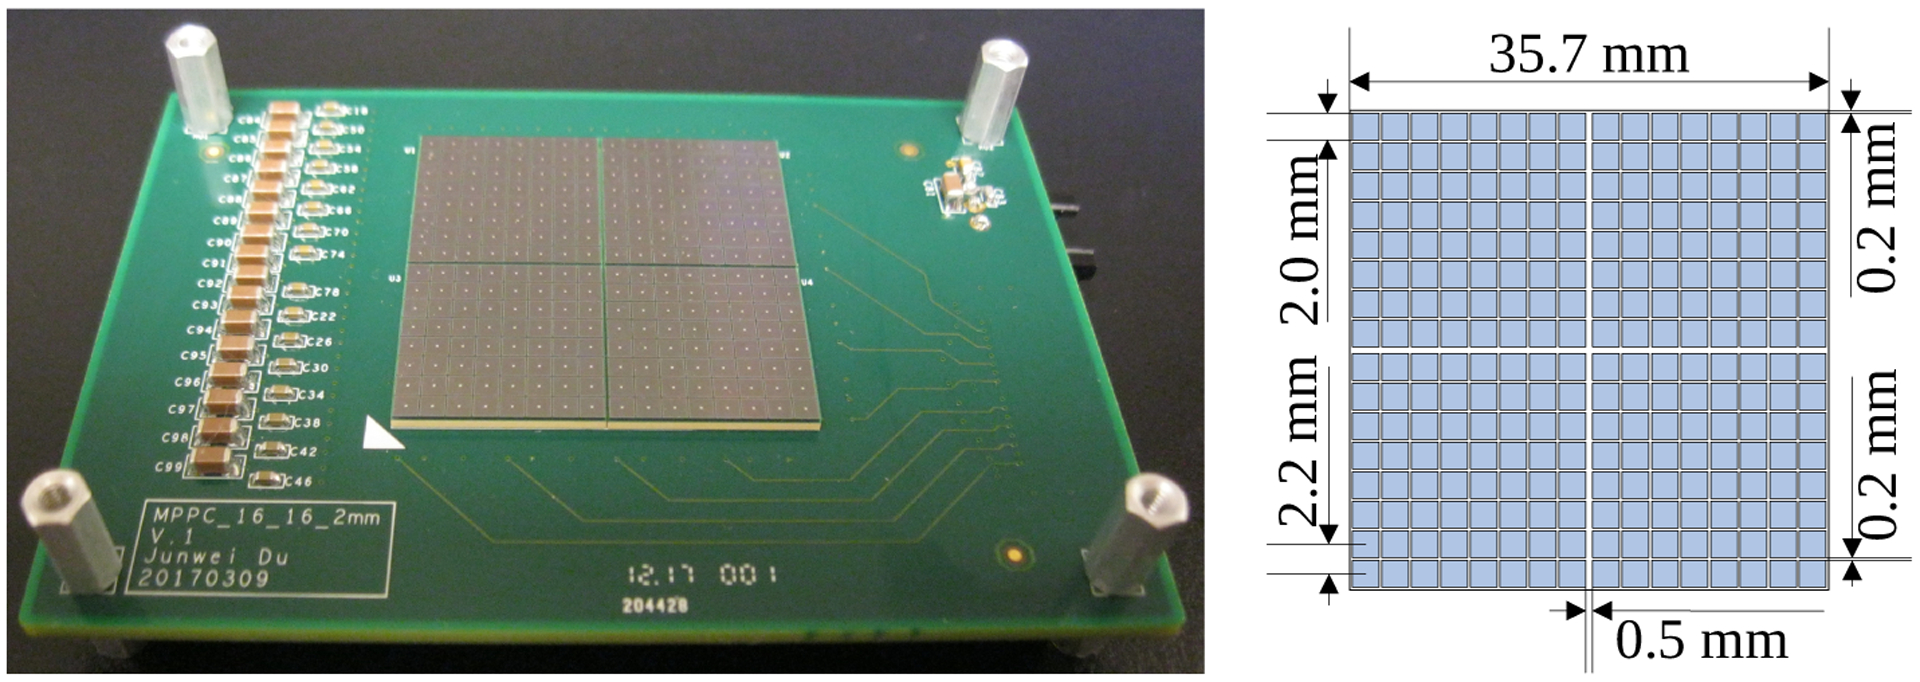
(left) photograph of a 16 × 16 SiPM array, composed of four individual 8 × 8 SiPM arrays, and mounted to PCB and (right) schematic of the SiPM array.
Figure 2.
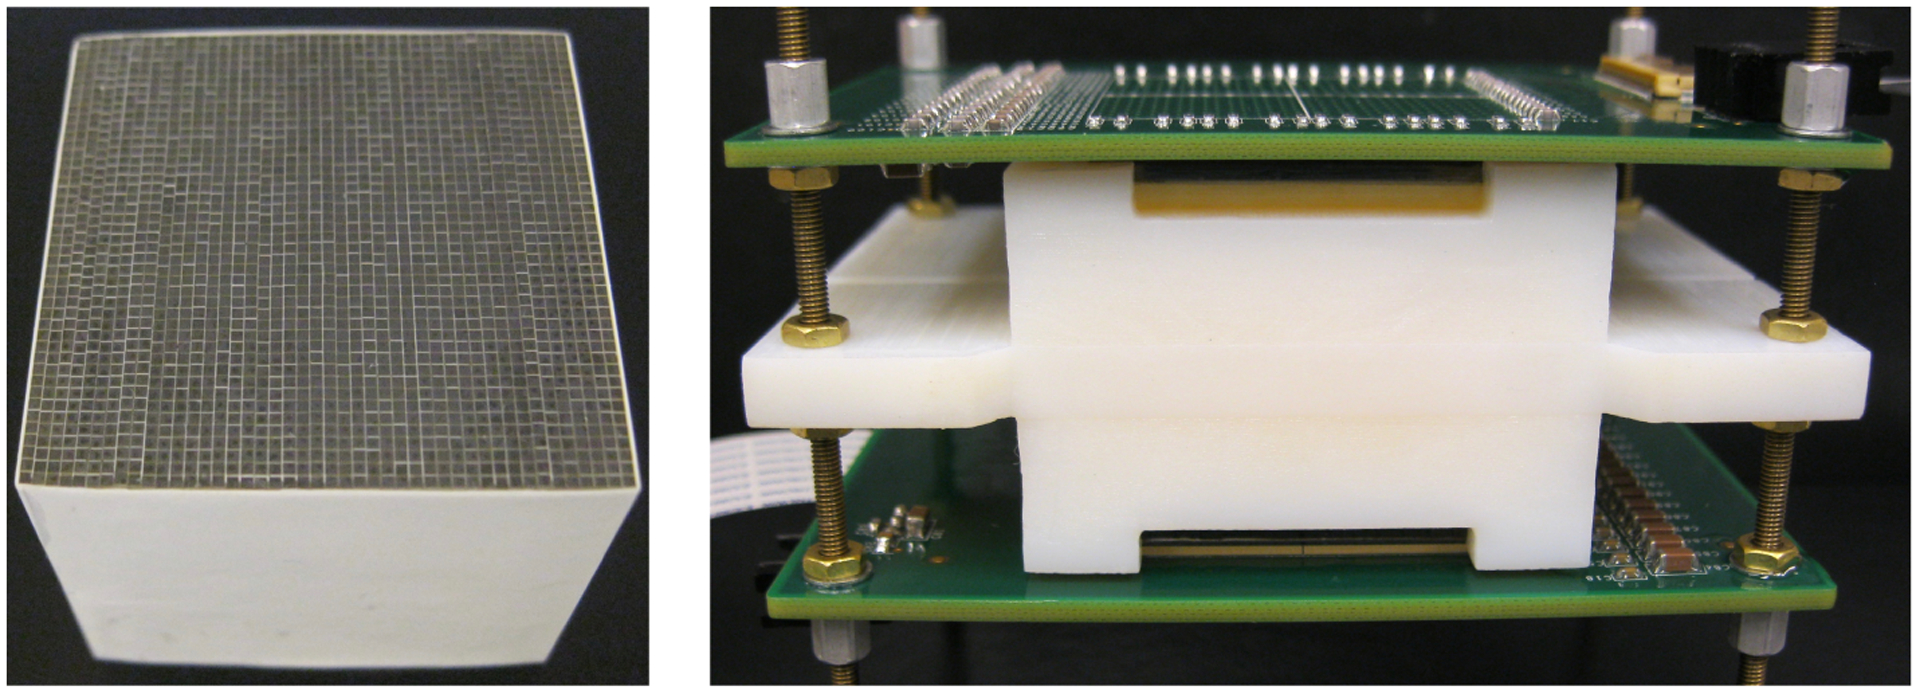
Photographs of (left) the 44 × 44 LYSO crystal array and (right) the assembled detector module with readout from both sides of the array.
To simplify the readout electronics and to obtain high performance, the SiPMs used to fabricate the two SiPM arrays were selected to have a similar breakdown voltage, as shown in figure 3. To obtain a gain of 1.7 × 10⁶ at a temperature of 25°C, the maximum difference of the bias voltages of the 512 SiPMs used in the detector module is 0.13 V and the standard deviation values is 0.0297 V. Hence, a common bias voltage was applied to all the SiPMs in our readout electronics.
Figure 3.
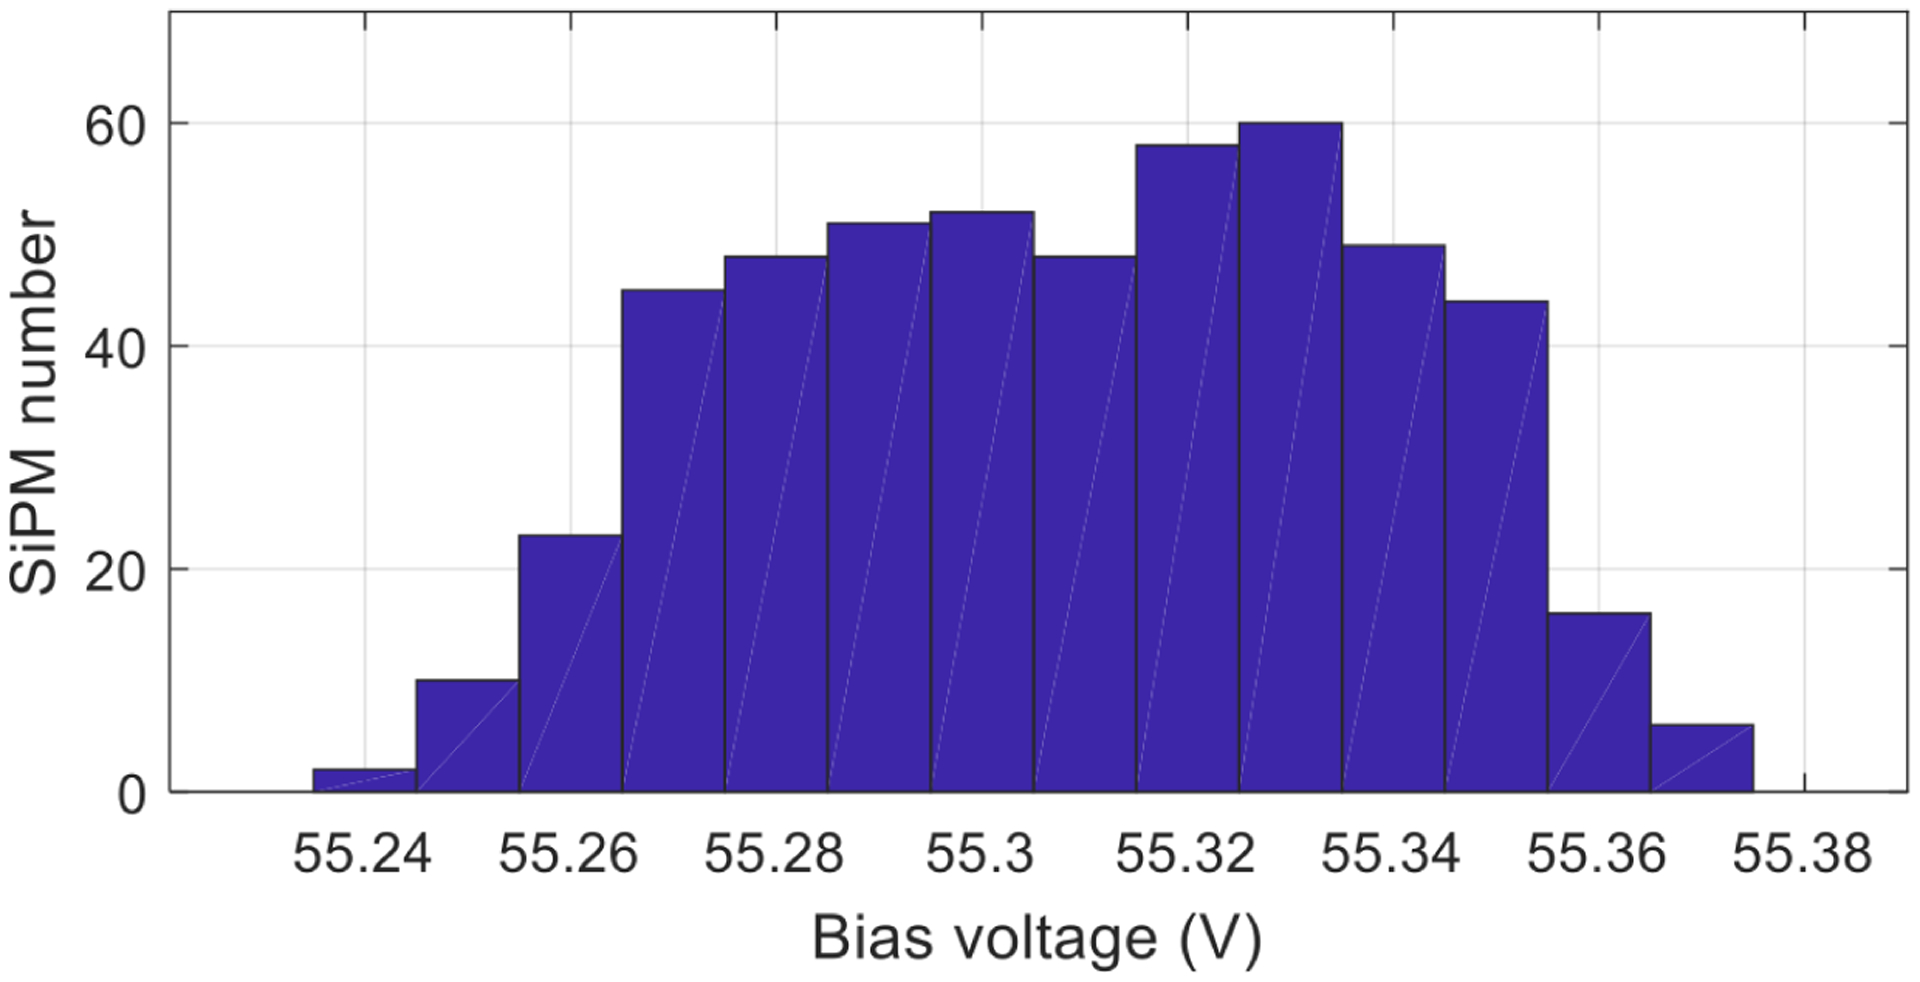
Distribution of the bias voltages of all the 512 SiPMs needed to obtain a gain of 1.7 × 10⁶ at a temperature of 25° C. The maximum difference of the bias voltages is only 0.13 V and the standard deviation is 0.0297 V. Data was provided by Hamamatsu.
The 44 × 44 array of 0.69 × 0.69 × 30.0 mm3 polished LYSOs has a pitch size of 0.75 mm (figure 2 (left)) (Crystal Photonics, Inc., FL, U.S.A.). Toray E60, with a thickness of 50 μm, was used as an inter-crystal reflector (Toray Industries, Inc, Japan), and optical glue with a thickness of 5 μm was used to glue the reflector to the crystals. Clear acrylic sheets with a thickness of 1.0 mm were used as light guides to spread the scintillation photons among different SiPMs. Optical grease BC-630 (Saint-Gobain S.A., U.S.A.) was used as coupling material between the LYSO array and the clear acrylic sheets and between the acrylic sheets and the SiPM arrays. 3D printed holders were used to maintain the position of the SiPM arrays, the LYSO array, and the acrylic sheets during all experiments (figure 2 (right)).
The DOI detector has a packing fraction of 85.5%, and the 30 mm thick LYSO crystals provides a 91.8% detection efficiency for the 511 keV gamma photon interactions, hence, the detector has a high detection efficiency.
2.2. Readout electronics
The DOI detector has two 16 × 16 SiPM arrays with 512 SiPMs, and each SiPM has one anode and one cathode output. To simplify the readout electronics, a signal multiplexing readout we previously developed was used [18]. In this readout method, for each 16 × 16 SiPM array, the anodes of the SiPMs in the same row were connected together to form 16 row signals, and the cathodes in the same column were connected together to form 16 column signals [18, 19]. The 16 row and 16 column signals were amplified individually and then sent to position encoding circuits, which reduced the 32 row/column signals of one SiPM array to four position signals (X+, X− and Y+, Y−) by applying weighted gains to each row and column signal proportional to its location along each axis (figures 4 and 5) [20]. The dual-ended DOI detector with two 16 × 16 SiPM arrays has 8 position signals and 1 timing signal for further processing. The timing signal was obtained from the sum of all the 32 row signals and the 32 column signals of the two SiPM arrays.
Figure 4.
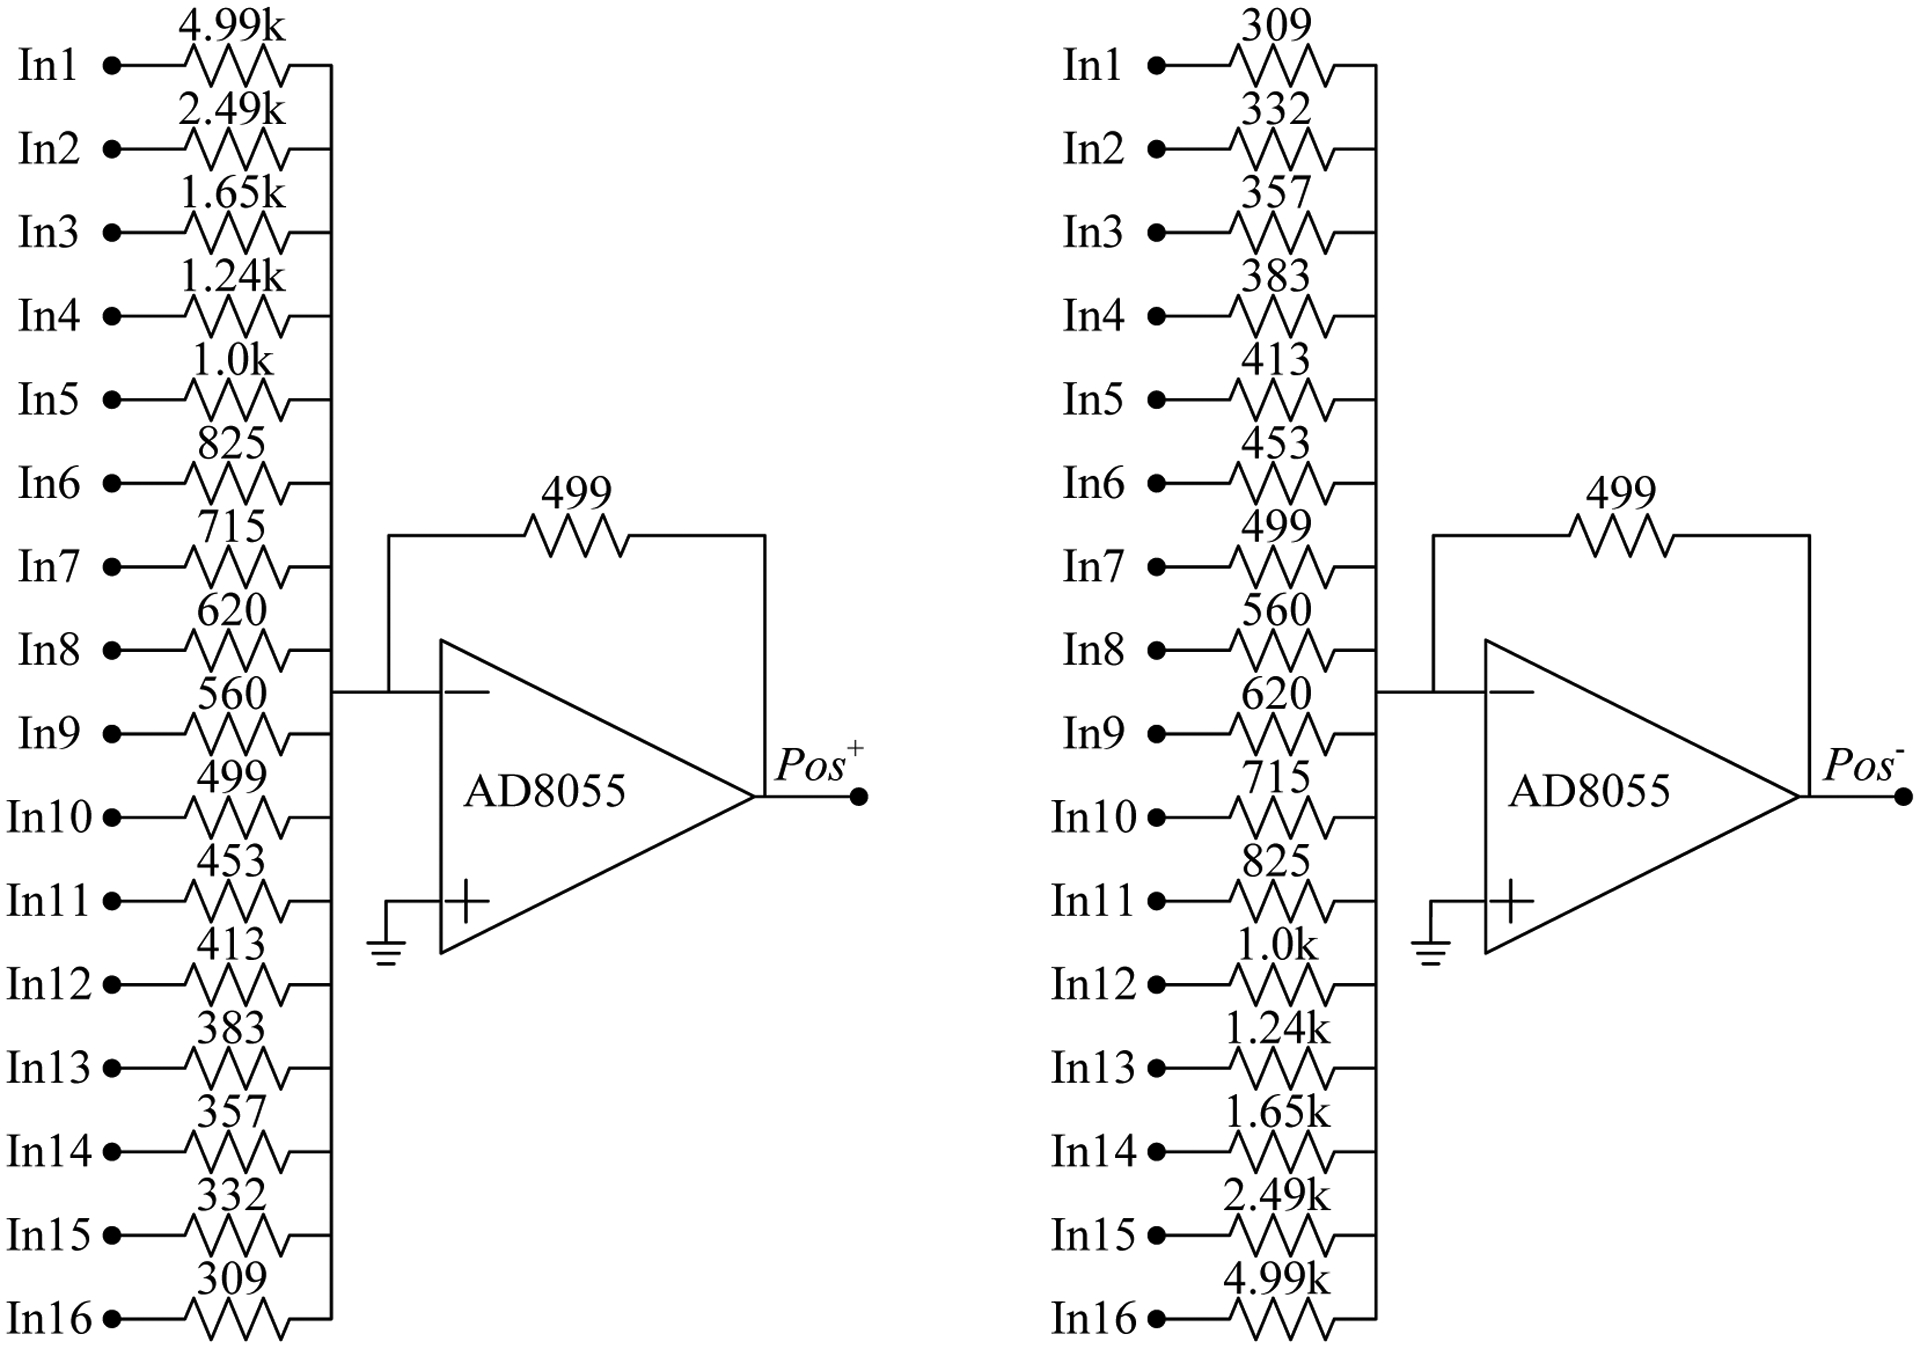
Schematics of the position encoding circuit. The 16 inputs (In1-16) are the 16 amplified row signals or the 16 amplified column signals. The two outputs (Pos+ and Pos−) are X+ and X−, or Y+ and Y−. All the values of the resistors are in Ohms.
Figure 5.
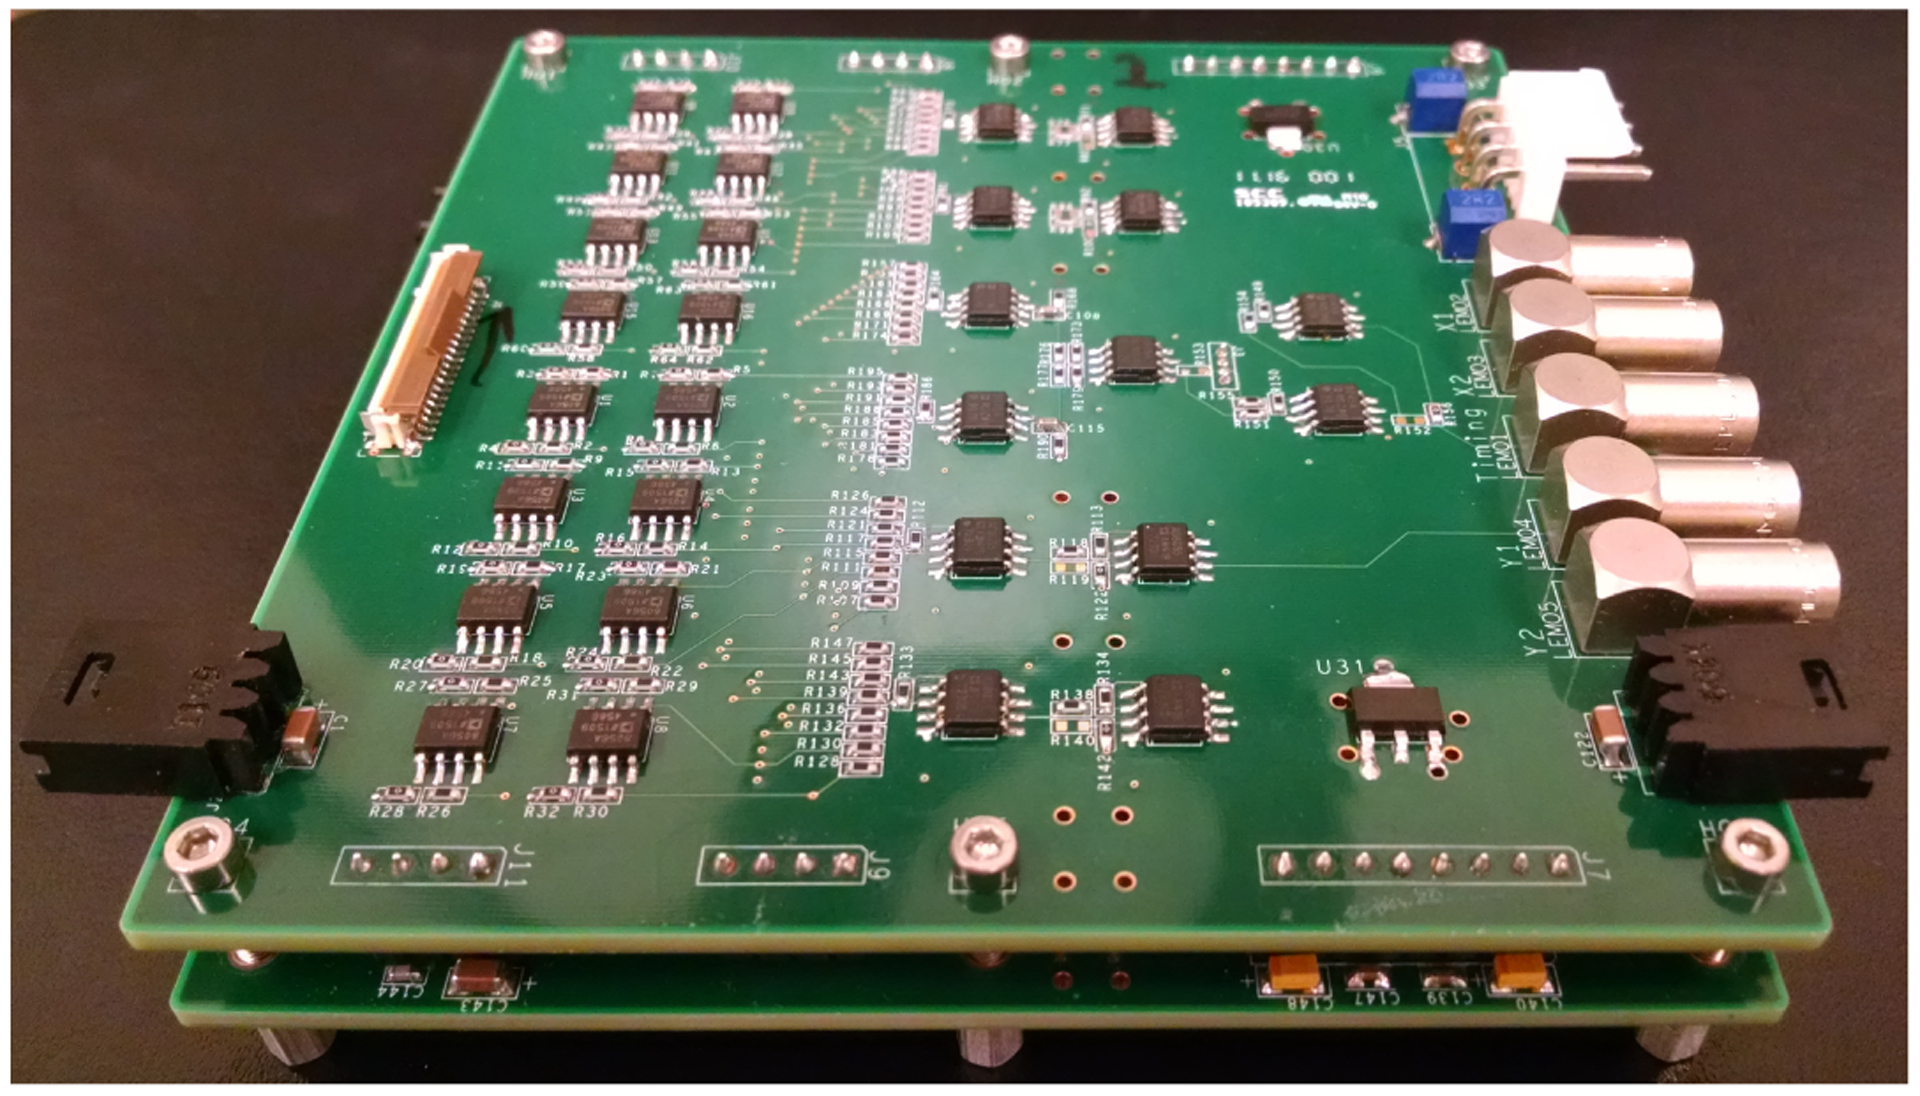
Photograph of the signal conditioning boards, which were used to amplify the row/column signals and to implement the position encoding circuit shown in figure 4. Two identical boards were stacked together to handle the 64 row/column signals from the DOI detector, and each board can process the 32 row/column signals from one 16 × 16 SiPM array.
The signal multiplexing readout circuit was implemented on the bottom side of the SiPM arrays boards (figure 1 (left) and figure 2 (right)). The amplification and the position encoding circuits were implemented using custom-made signal conditioning boards (figure 5) [18]. The SiPM array boards were connected to the signal conditioning boards through flat flexible cables (FFCs) (model FH12-40S-0.5SH, Hirose Electric Co., Ltd., Japan). The eight signals for position information were further shaped by a CAEN N586B spectroscopy amplifier (CAEN S.p.A., Italy) and digitized by a PD2MFS PowerDAQ board (United Electronic Industries, Inc., U.S.A.). The timing signal was sent to a constant fraction discriminator (CFD) (model 584, ORTEC, TN, U.S.A.) for timing pick-off.
The gamma photon interaction position (x, y), deposited energy (E) and DOI information were calculate using the digitized 8 position signals and equations (2.1)–(2.4) as follows [13]:
| (2.1) |
| (2.2) |
| (2.3) |
| (2.4) |
where , , and , (i = 1, 2) are the 8 digitized position signals of the two SiPM arrays, and E1 and E2 are the total energies detected by the two SiPM arrays.
2.3. Experimental methods
To find the optimal bias voltage for flood histograms at different temperatures, the flood histograms of the detector were obtained at different bias voltages (from 54.5 V to 57. 5 V, in 0.5 V intervals) and different temperatures (−9°C, 0°C, 10°C and 20°C). The flood histograms were compared using a flood histogram quality metric, which was calculated using the distances and widths of the crystal spots in the flood histogram [21]. The DOI resolution and timing resolution were measured at the optimal bias voltage determined by the flood histogram and at different temperatures (table 1).
Table 1.
The optimal bias voltage determined by flood histogram at different temperatures and the corresponding flood histogram quality.
| Temperature/°C | −9 | 0 | 10 | 20 |
|---|---|---|---|---|
| Bias voltage/V | 56.0 | 56.5 | 56.5 | 51.0 |
| Flood histogram quality | 1.40 ± 0.31 | 1.39 ± 0.30 | 1.35 ± 0.29 | 1.30 ± 0.25 |
A 30 μCi 22Na point source with an active diameter of 0.25 mm was used to irradiate the LYSO array and a 350–750 keV energy window was applied to each crystal to select events in all experiments.
The DOI detector, the reference detector, and the signal conditioning boards were placed in a light-tight black box and cooled using cold, dry air. The detector’s temperature was monitored by a thermocouple attached to the backside of one SiPM array.
2.3.1. Flood histograms
The flood histogram data were acquired using a reference detector consisting of a Hamamatsu R13394-10 PMT (Hamamatsu Photonics K.K. Japan) and a polished LYSO cylinder, which has a diameter of 25 mm and length of 30 mm (figure 6). The LYSO cylinder was wrapped with six layers of Teflon and coupled to the PMT using optical grease (BC-630, (Saint-Gobain S.A., U.S.A.). The distance between the source and the DOI detector was 10 cm, and the distance between the source and the reference detector was 5 cm. A 10 ns timing window was used to select coincidence events on-line. For each condition (the combination of bias voltage and temperature), a crystal lookup table (LUT) was firstly built using the flood histogram generated from all the events collected for this condition, and then the LUT was applied to all the events again to assign events to each crystal. After applying the 350–750 keV energy window to each crystal to select events, a new flood histogram used to measure the crystal identification ability of the detector was generated.
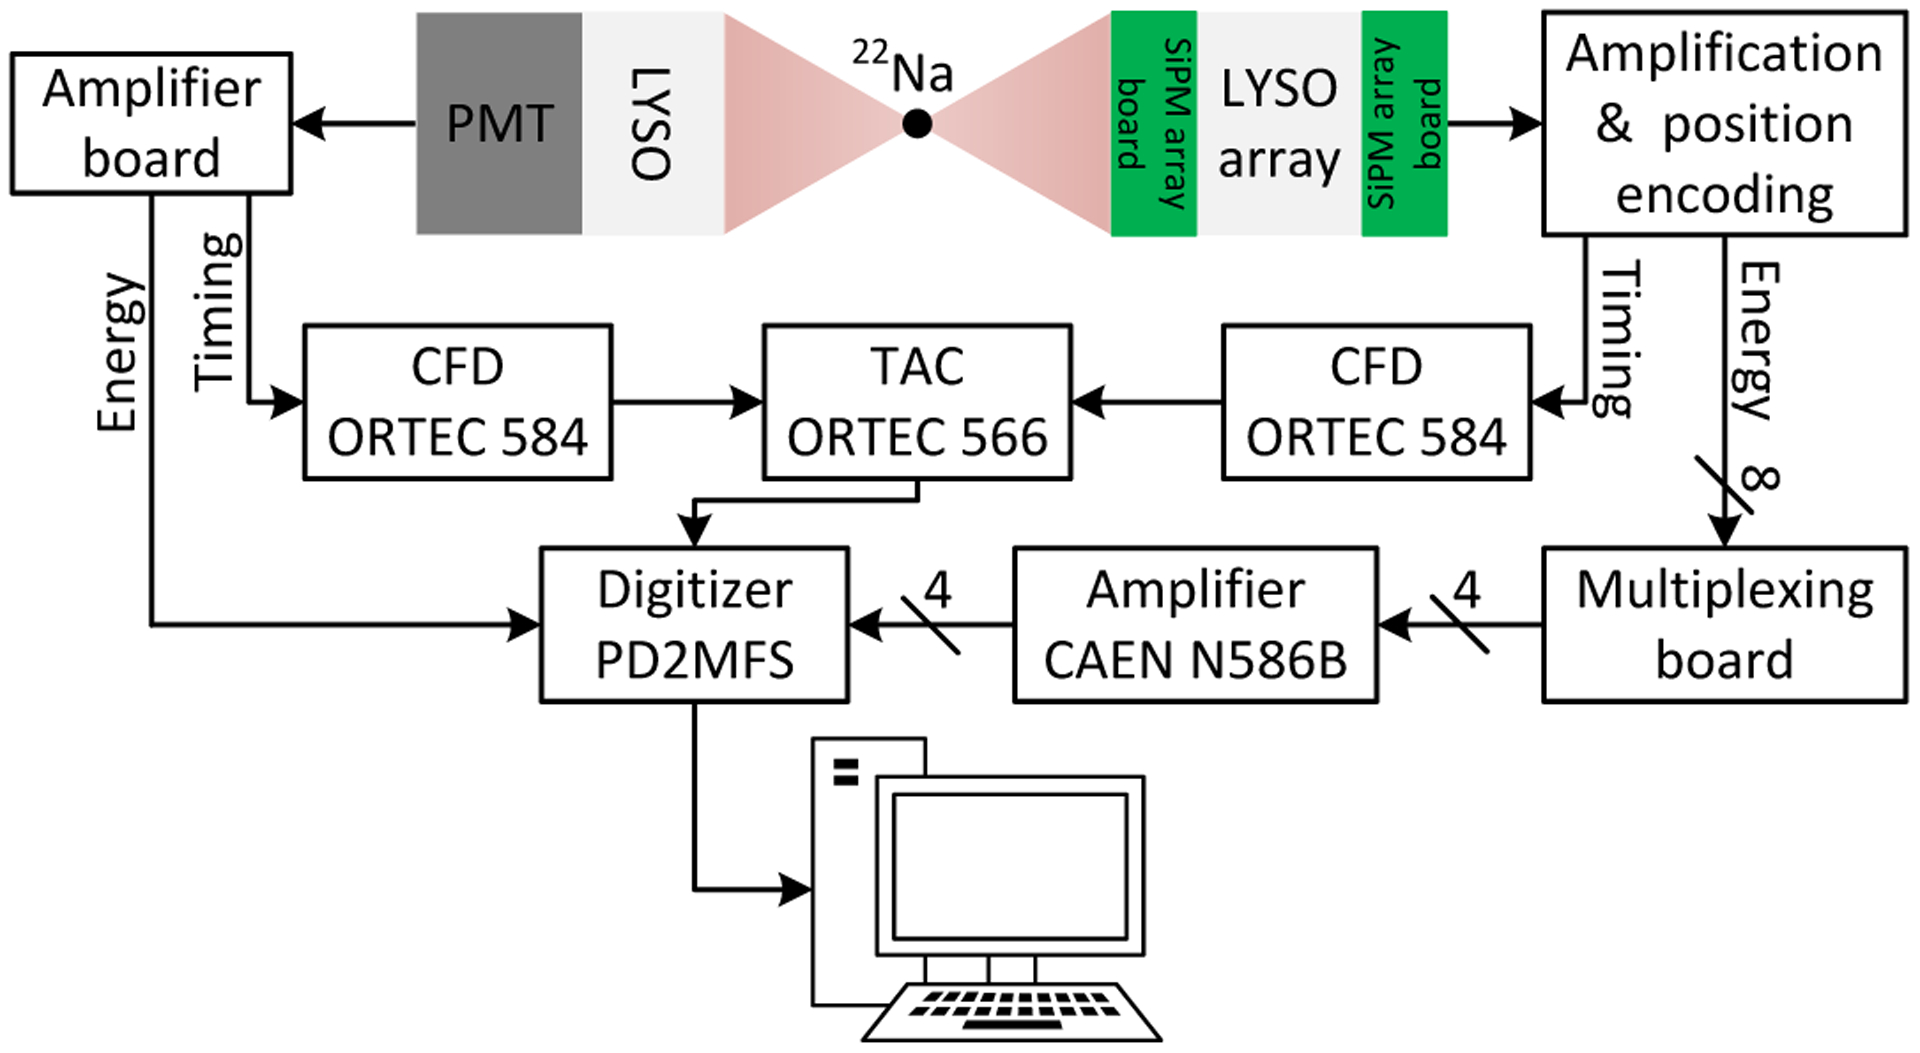
Figure 6.
Schematic diagram of the experimental setup for flood histogram measurements. During the DOI resolution measurements, the dual-ended readout detector was irradiated from one side of the DOI detector (section 2.3.3).
2.3.2. Energy resolution
Energy spectra were extracted for each crystal using the same data obtained for the flood histogram. The energy resolution, defined as the ratio of the FWHM to the photopeak position in percent, was obtained by applying a Gaussian fit to the 511 keV photopeak and calculated for each crystal. The average value and standard deviation of the energy resolution of all the crystals in the LYSO array were used as a measure of the energy resolution of the DOI detector.
2.3.3. DOI measurements
The DOI resolution was measured using a reference detector consisting of a 0.5 × 20 × 20 mm3 polished LYSO slab coupled to a Hamamatsu R13394-10 PMT. The LYSO slab was wrapped with six layers of Teflon to maximize the number of scintillation photons reaching the PMT. The reference detector and the radiation source were mounted on a linear stage [8, 19]. Data was collected at 5 depths (from 2 mm to 18 mm, in 4 mm steps) by irradiating the DOI detector from one side. The distance between the reference detector and the 22Na source, and the distance between the 22Na source and the DOI detector, were both 10 cm. Due to the configuration of the experimental setup [8, 19], only some of the LYSO elements in the LYSO array could be irradiated effectively (figure 7). The 15 × 15 LYSO elements shown in the white rectangle in figure 7 were selected as representative for measuring the DOI resolution of the detector. The DOI resolution, which was the FWHM of a Gaussian fit applied to the DOI distribution, was calculated for each crystal within the selected 225 LYSO crystals. The average value and standard deviation value of the DOI resolution across all the 225 crystals were used as a measure of the DOI resolution of the detector.
Figure 7.
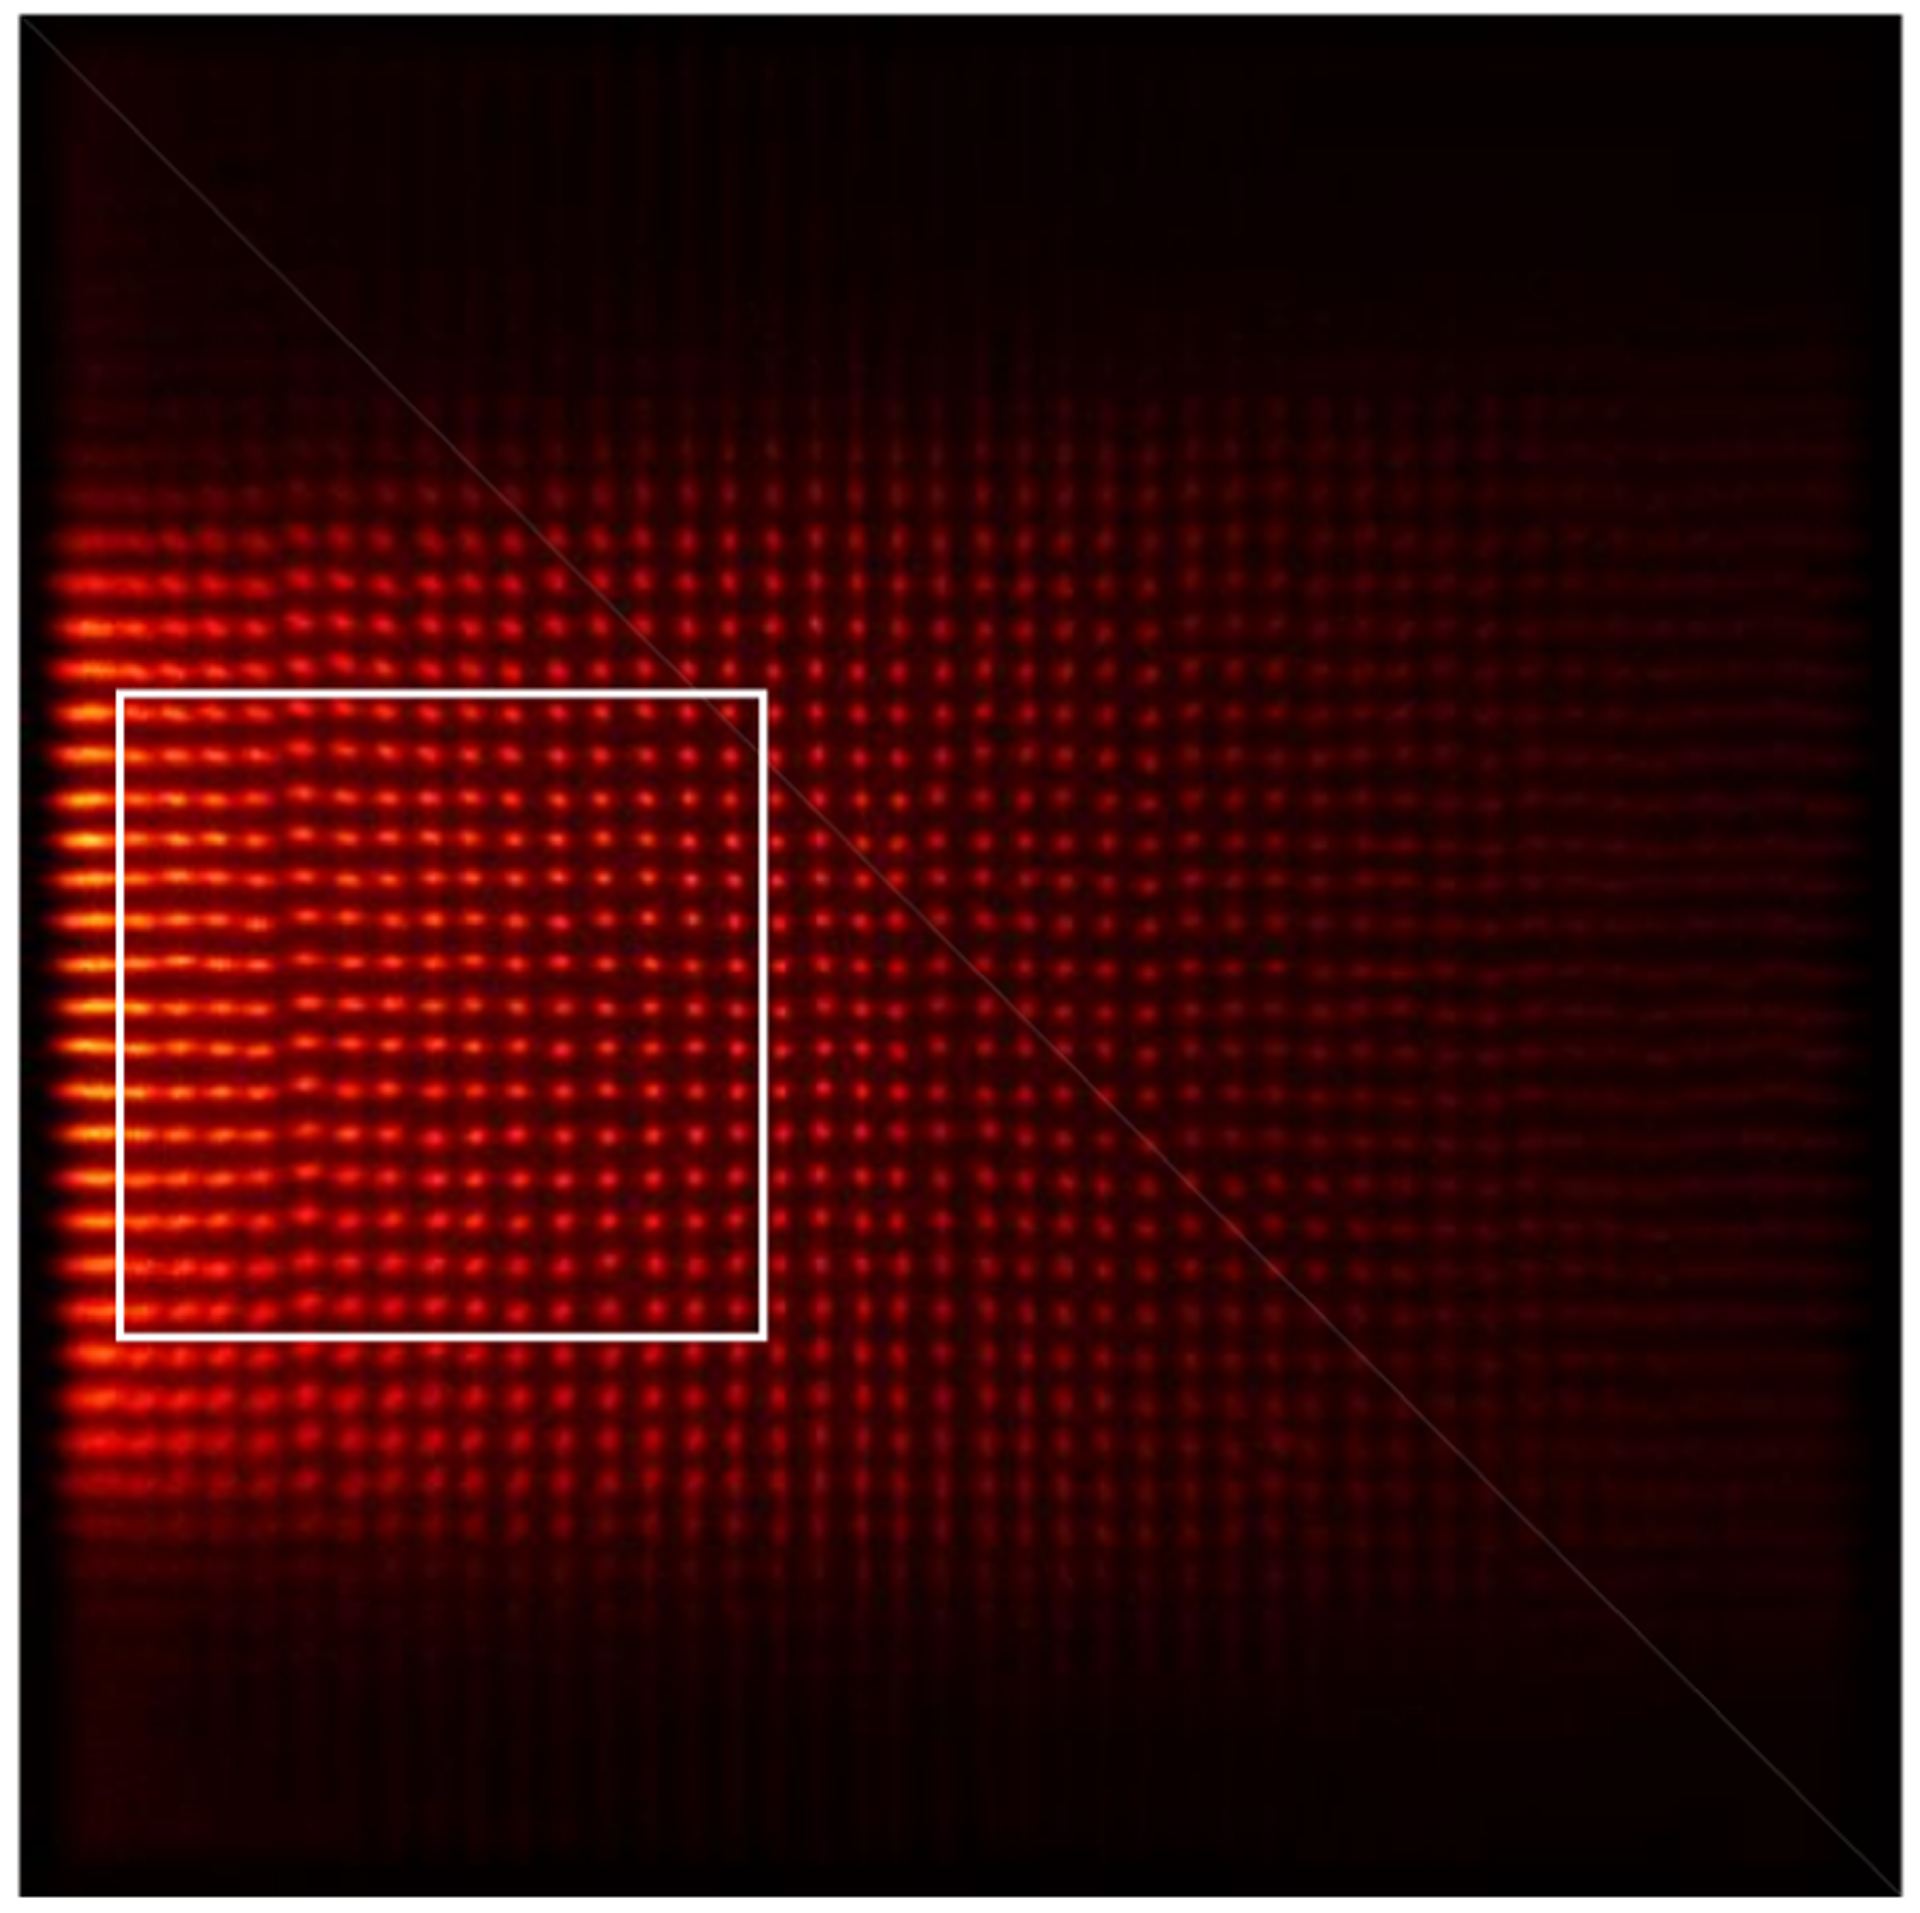
Flood histogram obtained using the data for the DOI resolution measurement.
2.3.4. Timing measurements
The timing resolution was measured using a reference detector consisting of a 16 × 16 × 16 mm3 polished LYSO coupled to a Hamamatsu R13394-10 PMT (figure 8). The LYSO cube was wrapped with six layers of Teflon to maximize the scintillation photons reaching the PMT. The distance between the source and the DOI detector was 10 cm, and the distance between the source and the reference detector was 5 cm. The PMT output signal was amplified firstly using transimpedence amplifier based on amplifier AD8045 (Analog Devices, Inc., MA, U.S.A.) and then sent to a CFD (model 584, ORTEC, TN, U.S.A.) for timing pick-off. The outputs of the CFDs used for the DOI detector and the reference detector were sent to a time-amplitude converter (TAC, model 566, ORTEC, TN, U.S.A.) and used as a start and stop signal, respectively. The TAC output was digitized by the PowerDAQ board together with position signals [8].
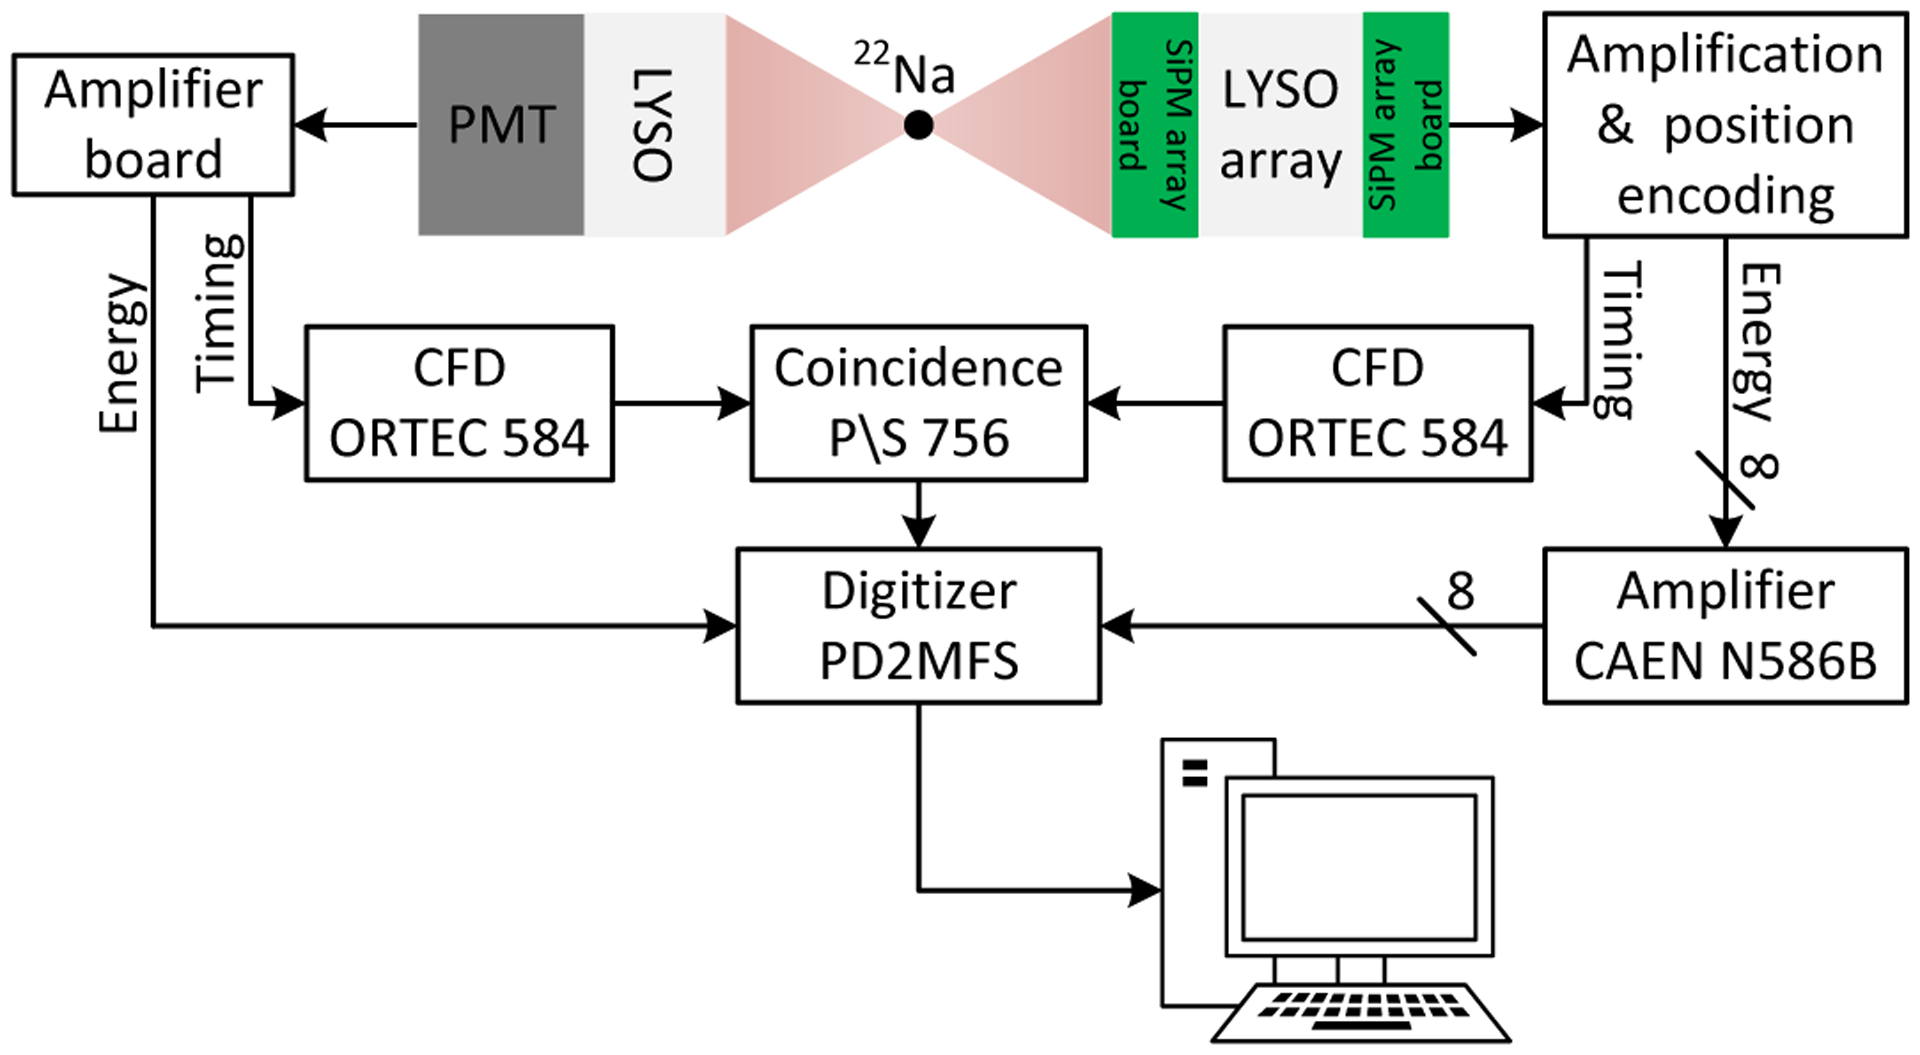
Figure 8.
Schematic diagram of the experimental setup for timing resolution measurements.
Timing spectra were extracted for each crystal in the LYSO array. The FWHM of a Gaussian fit to the timing spectrum was treated as the timing resolution of that crystal. The average value and standard deviation value of the timing resolution across all crystals were used as a measure of the timing resolution of the detector. The coincidence timing resolution (CTR) of two identical DOI detector was estimated using equation (2.5), following [13]:
| (2.5) |
The coincidence timing resolution of two identical reference detectors (CTRreference_detector) was 608 ± 8 ps.
3. Results
3.1. Flood histograms
Figure 9 shows the flood histograms obtained at the optimal bias voltage determined by flood histogram quality and at different temperatures (table 1). The corresponding flood histogram quality values are shown in table 1. All the crystals in the LYSO array can be resolved except the crystals in the two outmost rows/columns, which was due to the limited light sharing among SiPMs, a well-known edge effect of scintillator array based PET detectors [22, 23].
Figure 9.
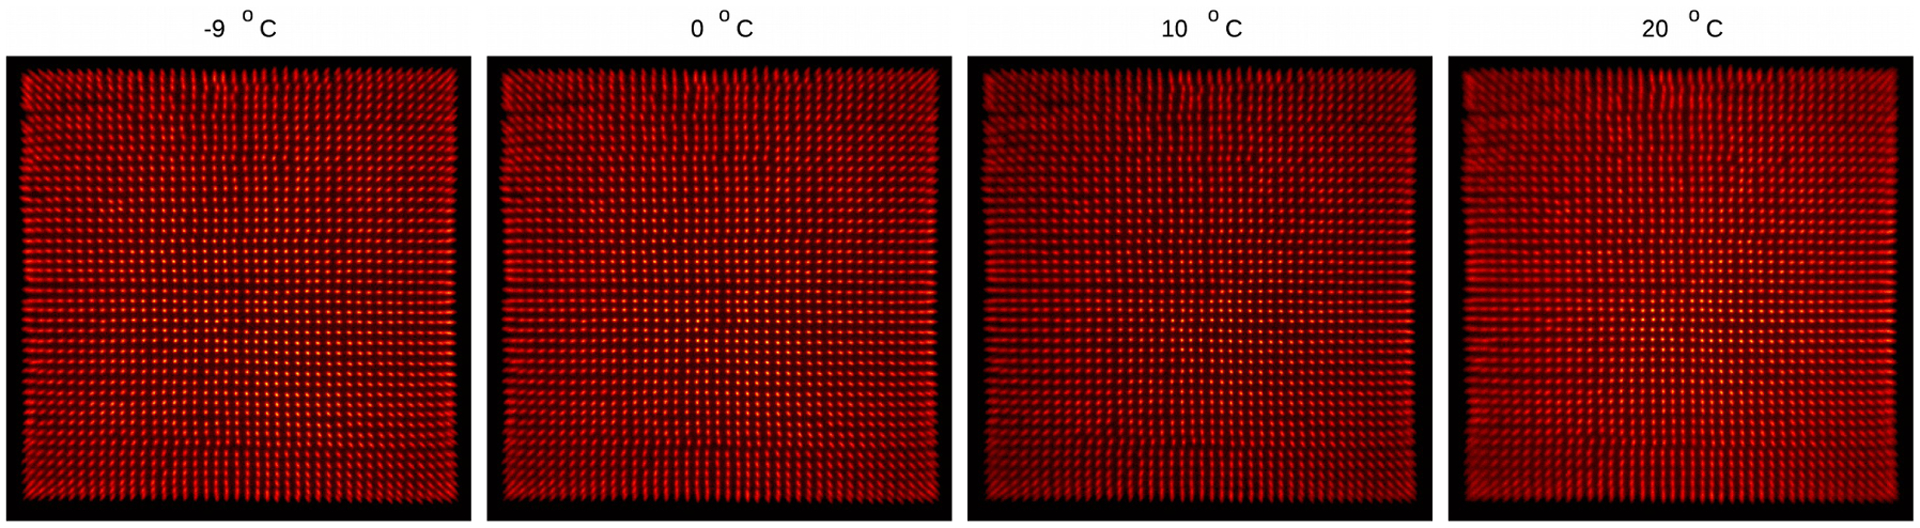
Flood histogram obtained at temperatures of (from left to right) −9, 0, 10 and 20°C.
The position profiles of the 22nd row of crystals of the LYSO array obtained at temperatures of −9°C and 20°C are shown in figure 10 (top), and the flood histogram quality obtained at different bias voltages and different temperatures are shown in figure 10 (bottom). The flood histogram quality firstly increases and then decreases with increasing bias voltages, due to the competition of the noise and the photon detection efficiency (PDE) of the SiPMs [21, 24]. Better position profiles and better flood histograms were obtained at lower temperatures, as the noise of SiPMs are reduced at lower temperature [21]. However, the best flood histograms obtained at different temperatures were comparable (figure 9 and table 1), which means the quality of the flood histogram was dominated by the statistics of the detected scintillation photons, instead of the noise of the SiPMs.
Figure 10.
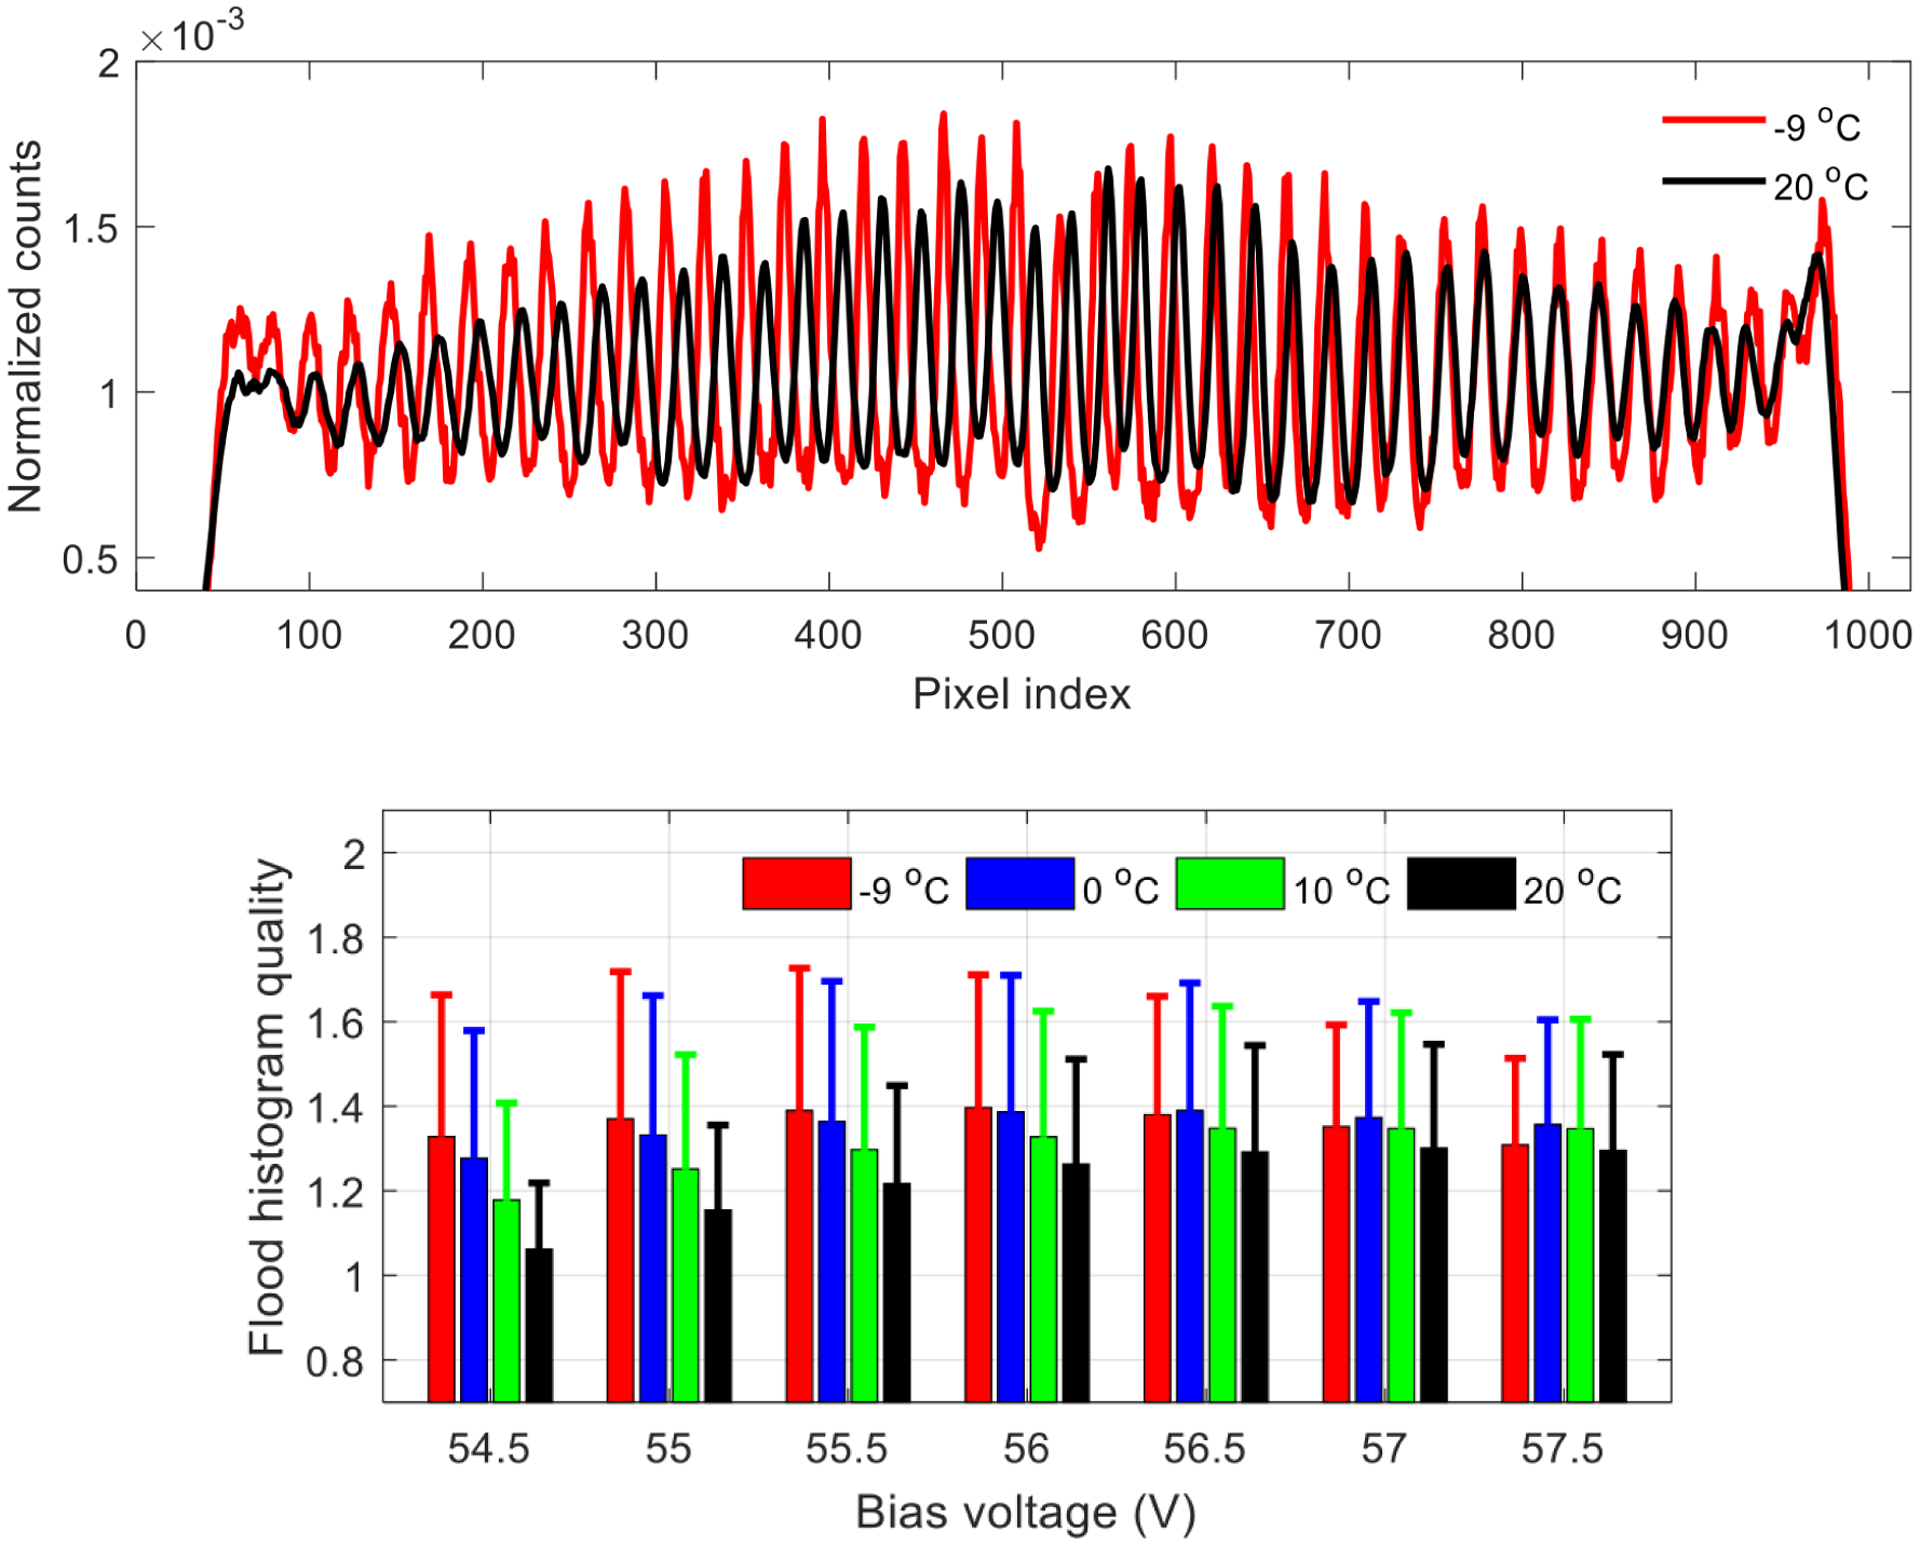
(top) position profiles of the 22nd crystal row obtained at temperatures of −9 and 20°C. (bottom) flood histogram quality versus bias voltage and temperature. The error bars in the bottom figure are the standard deviation of the flood histogram qualities over all crystals [21].
3.2. Energy resolution
Figure 11 shows the energy resolution and the 511 keV photopeak position for each LYSO element in the array obtained at a bias voltage of 56.5 V and a temperature of 0°C. An obvious cross structure pattern can be seen in figure 11, due to the lower light collection in the 0.5 mm dead space between the S13361-2050NE-08 SiPM arrays (figure 1). The worse energy resolutions of the edge crystals were also due to the light loss as these crystals were coupled to the edge of the SiPM array, and some fraction of the scintillation photons escaped from the LYSO array and the light guides before reaching the SiPMs.
Figure 11.
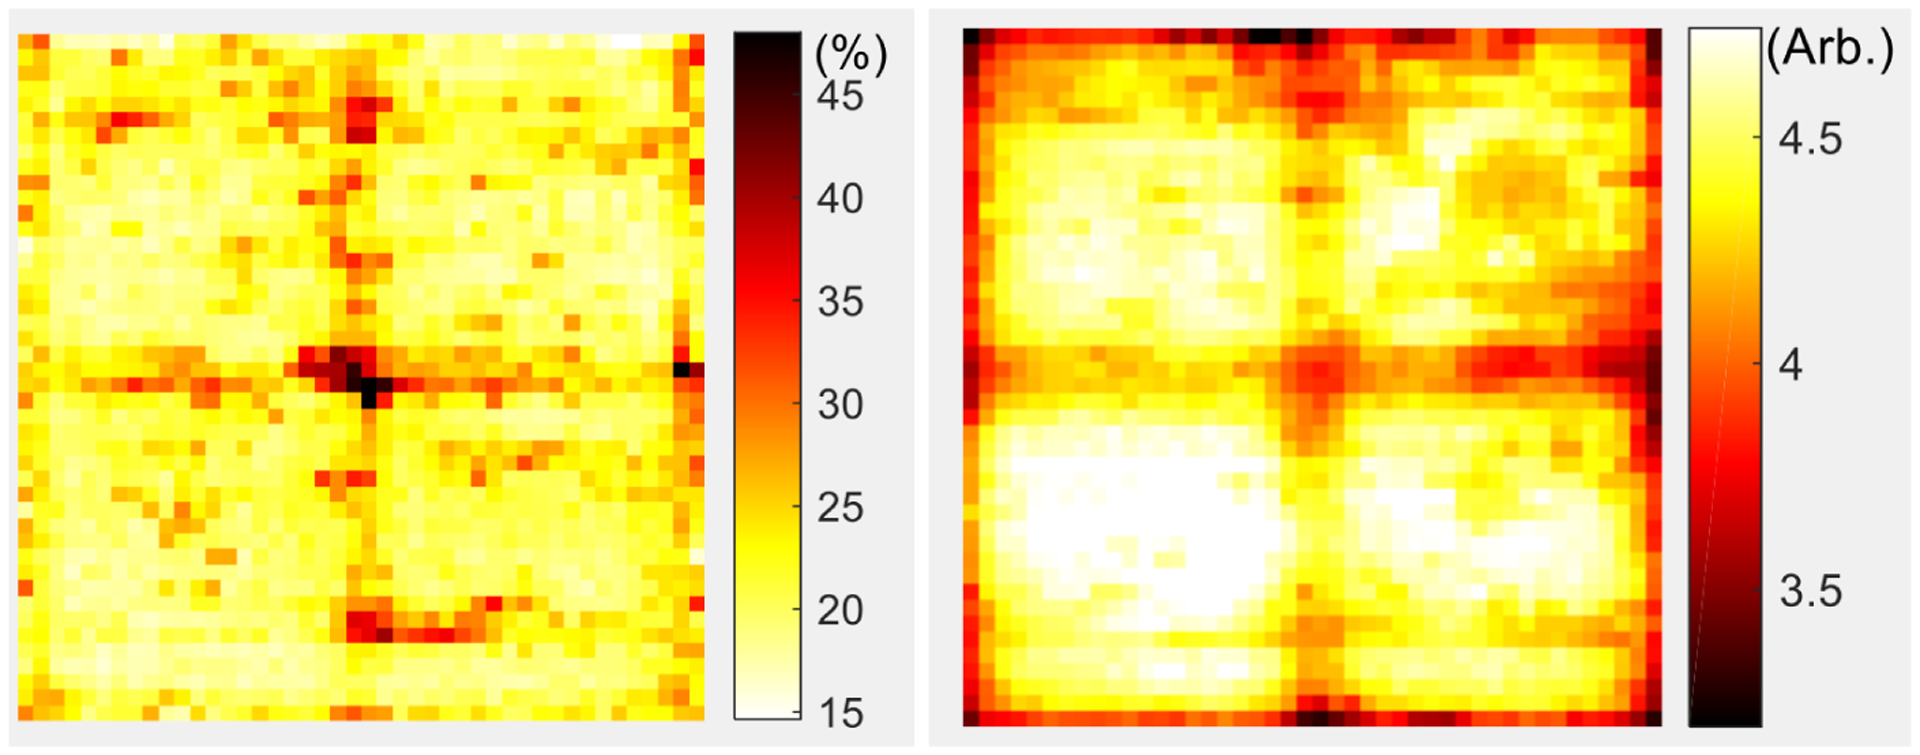
(left) energy resolution and (right) 511 keV photopeak position for each LYSO crystal in the LYSO array, which were obtained at a bias voltage of 56.5 V and a temperature of 0°C.
Figure 12 shows the average energy resolution across all crystals obtained at the optimal bias voltage for the flood histogram (table 1) and different temperatures. As expected, better energy resolution was obtained at lower temperatures, as the noise of SiPMs was reduced at lower temperature. However, the variation of energy resolution obtained at different temperatures was quite small, as the statistics of the number of scintillation photons collected, instead of the noise of the SiPMs, dominated the energy resolution.
Figure 12.
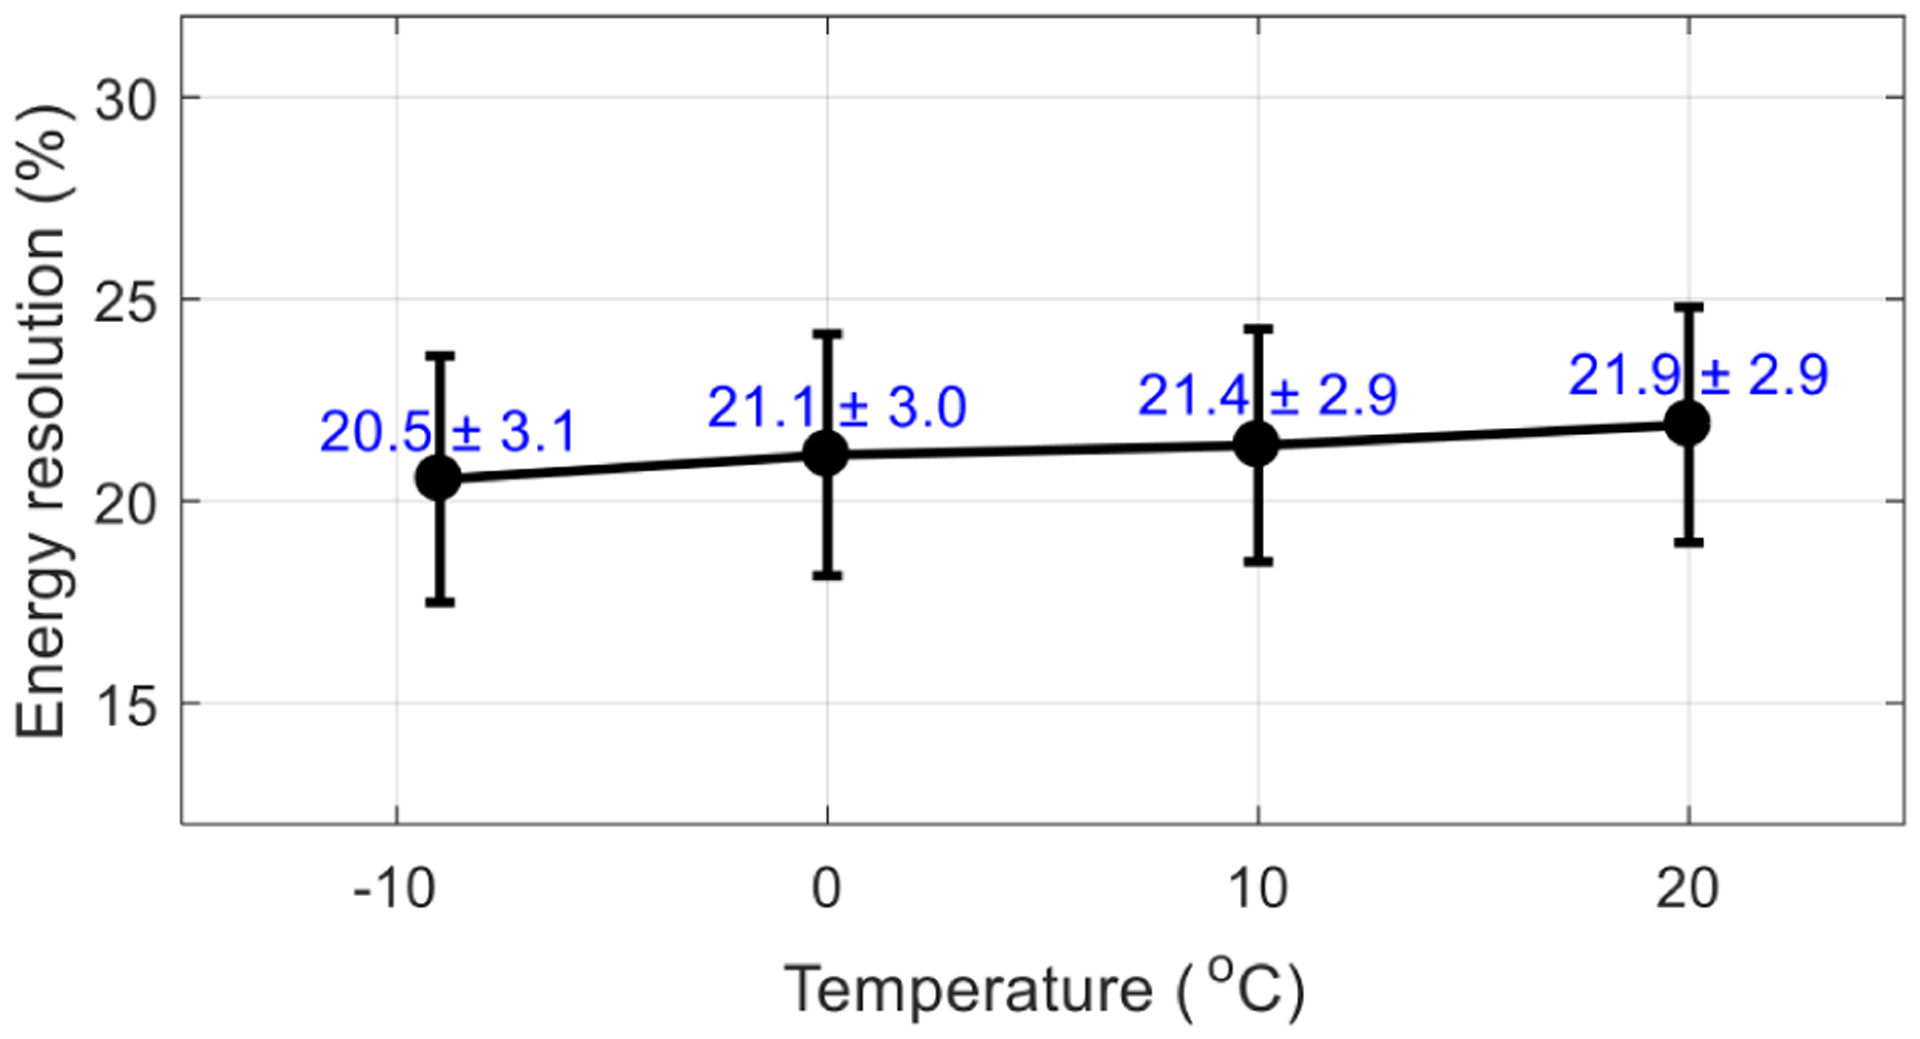
Average energy resolution (in %) versus temperature. The energy resolutions were obtained at the optimal bias voltage determined by the flood histogram (table 1). The error bars are the standard deviation of the energy resolutions of all crystals.
3.3. DOI resolution
Figure 13 shows the average DOI resolution across all the 15 × 15 selected crystals and all 5 depths obtained at the optimal bias voltage for flood histogram (table 1) and different temperatures. The average DOI resolutions obtained at different temperatures are similar, whilst slightly better DOI resolution was obtained at lower temperature.
Figure 13.
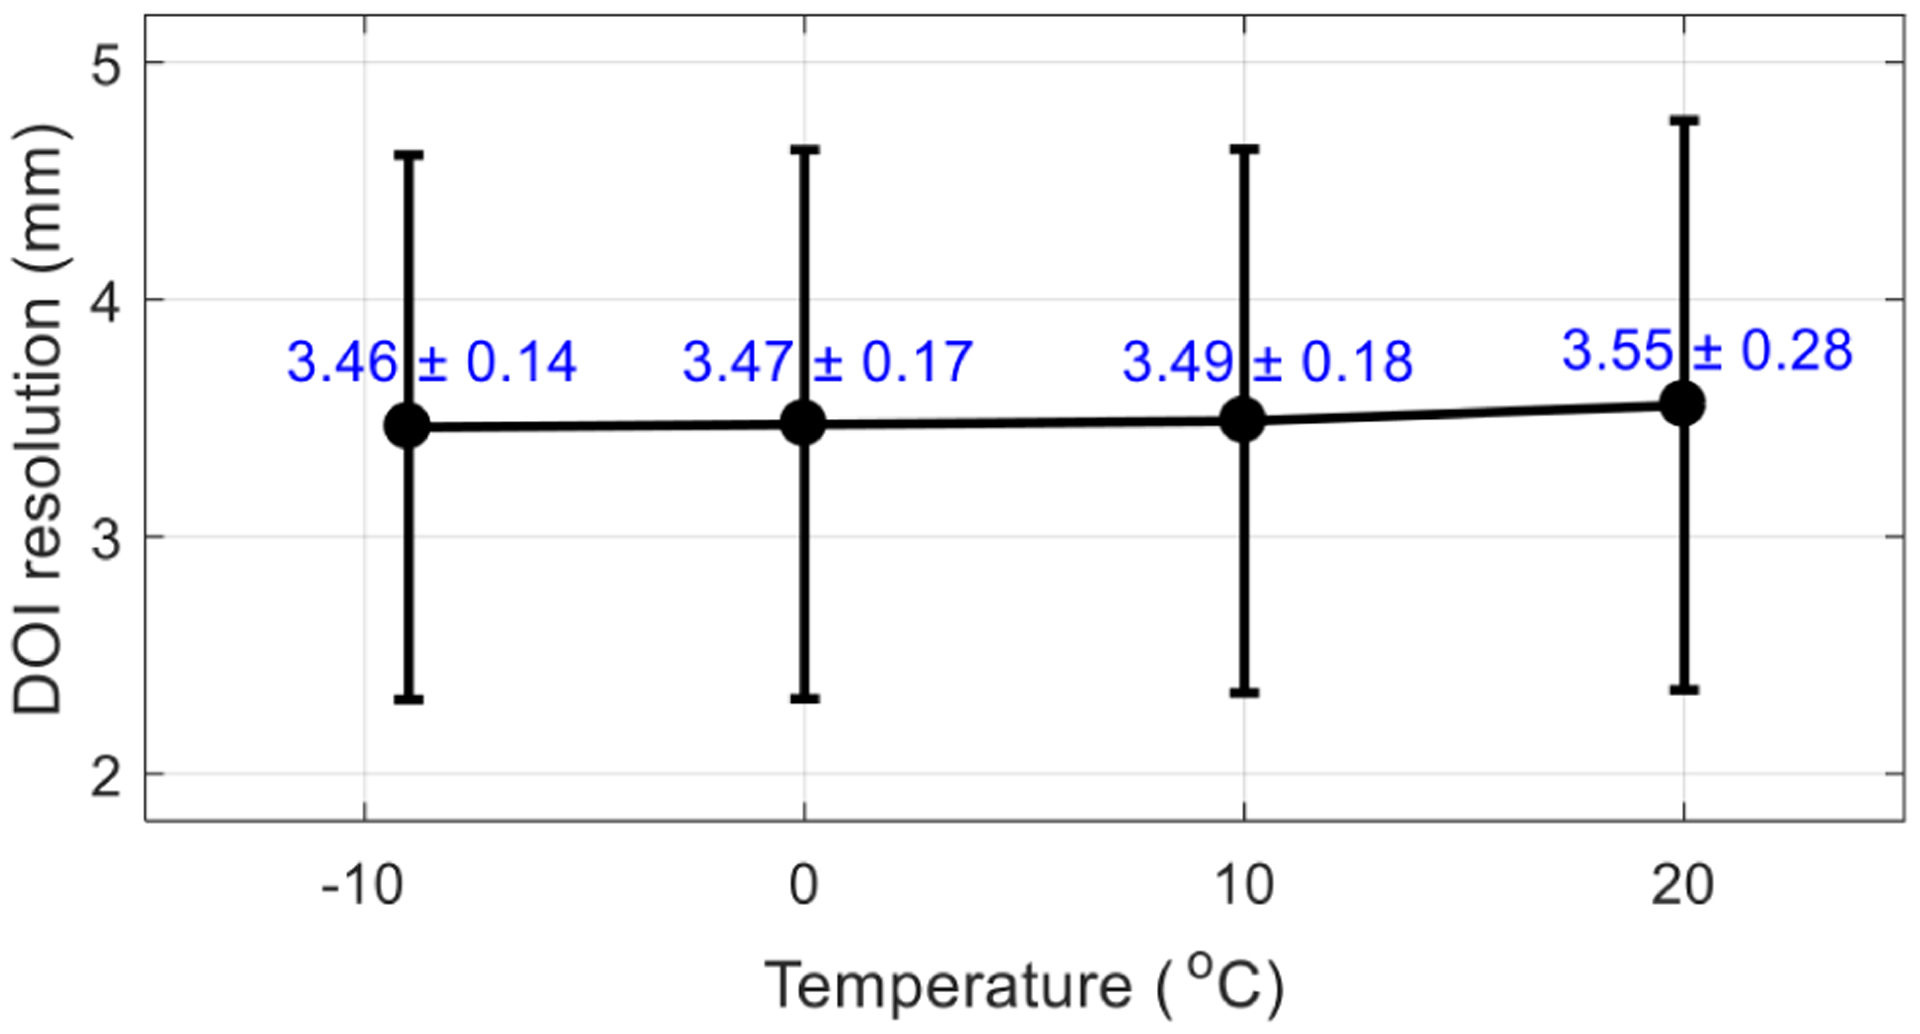
Average DOI resolution (in mm) versus temperature. The DOI resolutions were obtained at the optimal bias voltage determined by the flood histogram (table 1). The error bars are the standard deviation of the DOI resolution over the 15 × 15 crystals selected.
3.4. Timing resolution
Figure 14 shows the average CTR obtained at the optimal bias voltage for the flood histogram (table 1), and for different temperatures, across all crystals in the LYSO array. Better timing resolution was obtained at lower temperatures.
Figure 14.
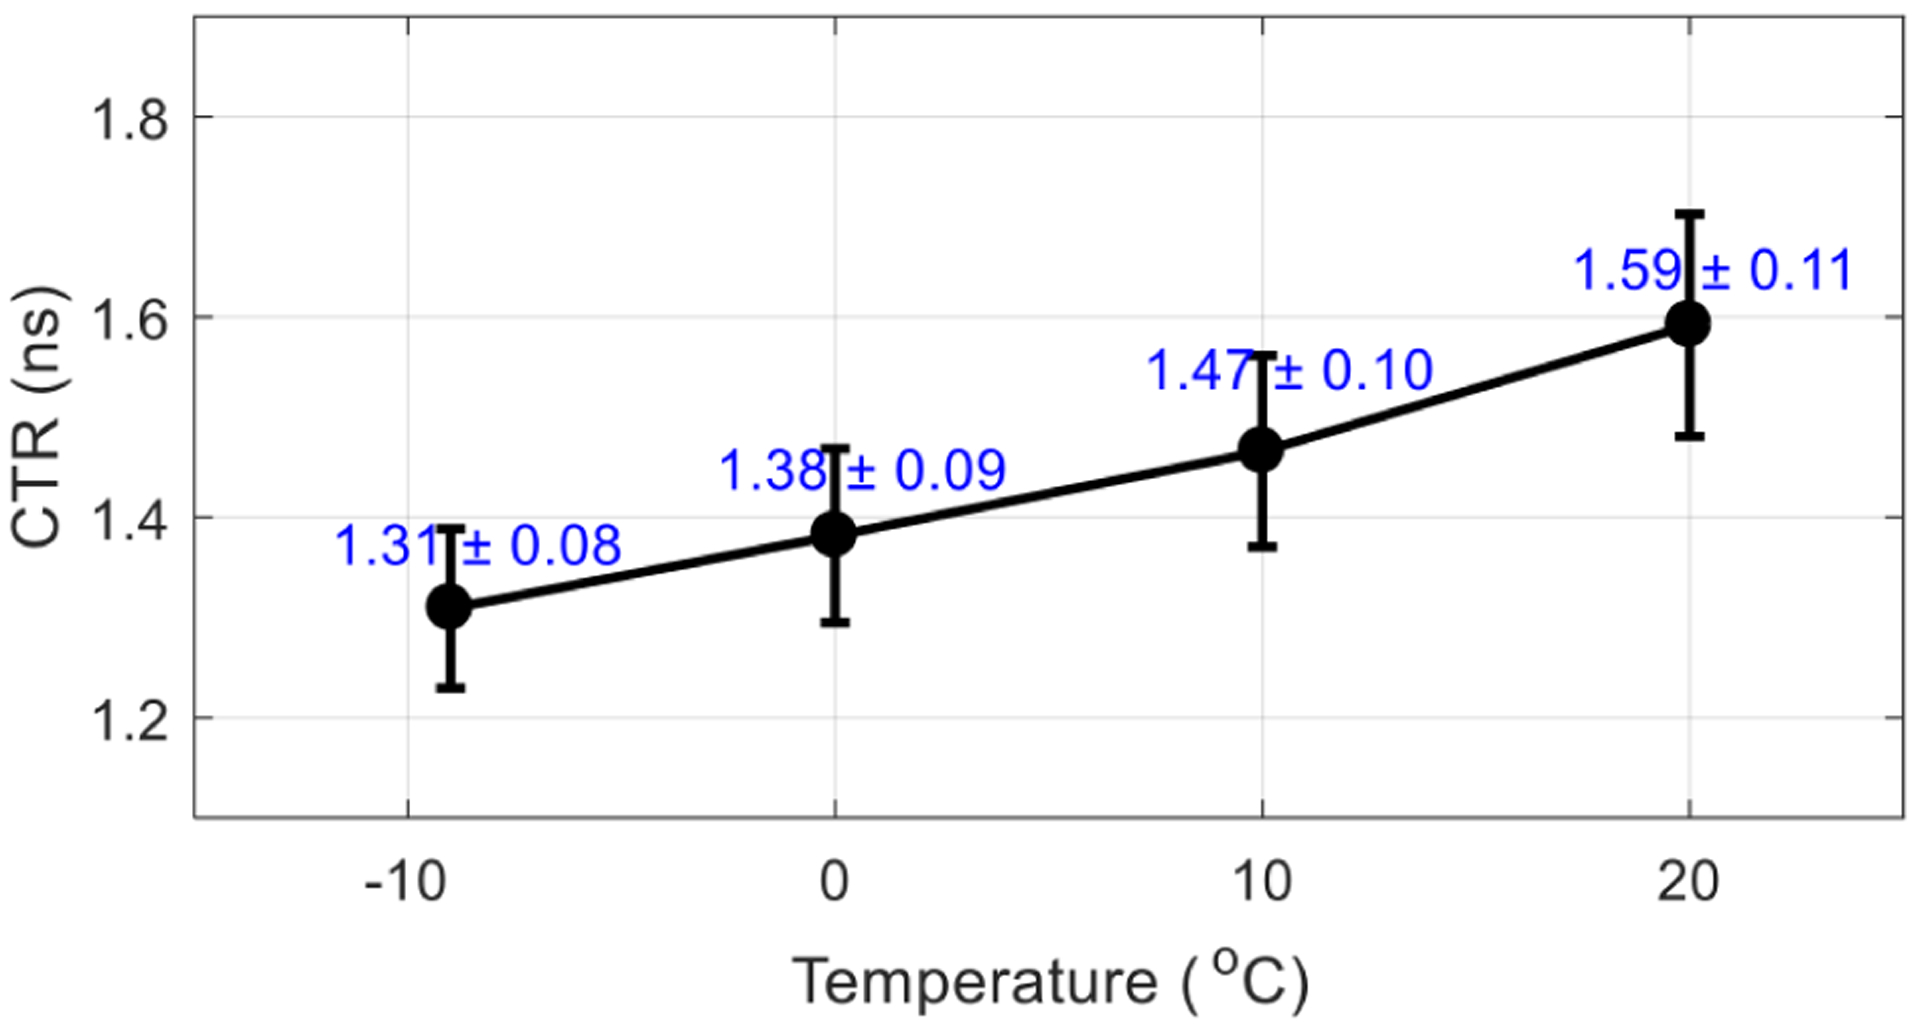
Average CTR (ns) versus temperature. The CTRs were obtained at the optimal bias voltage determined by the flood histogram (table 1). The error bars are the standard deviation of the CTRs of all crystals.
4. Discussion
A DOI detector based on two custom 16 × 16 arrays of 2 × 2 mm2 SiPMs coupled to both ends of a 44 × 44 array of 0.69 × 0.69 × 30 mm3 LYSO was evaluated in detail for brain PET applications. This DOI-encoding detector has a packing fraction of 85.5%, which is much higher than typical PET detectors based on LYSO arrays with similar pitch size or SiPMs with larger active area [23, 25, 26]. In addition, The 30 mm thick LYSO provides a 91.8% detection ability for the 511 keV gamma photons, hence, this detector has a high detection efficiency, and can be used to build high resolution and high sensitivity brain PET systems.
Overall, better results were obtained at lower temperatures, due to the reduction in the noise of the SiPM and the higher signal-to-noise-ratio at lower temperature [27, 28]. However, the results obtained at different temperatures and the optimal bias voltage determined by the flood histogram are similar, which means the DOI detector can be operated at room temperature without significantly deteriorated performance, which is easier for maintaining temperature at the system level.
The flood histograms (figure 9) show all the crystals in the LYSO array can be resolved except some outermost crystals (less than 10% of crystals can not be resolved), due to the edge effect of PET detectors based on crystal arrays with a pitch size smaller than the pitch size of the photodetector arrays [23, 26]. However, the mispositioning introduced by this effect in a sub-mm crystal array is not anticipated to have a large impact on reconstructed image resolution, although that would need to be studied and quantified using Monte Carlo simulations of a full system.
The energy resolutions, and timing resolution obtained at different temperatures are ~ 21% and 1.3–1.6 ns, respectively. The energy resolutions and timing resolution are worse than other state-of-the-art PET detectors [29–31], which was caused by the extremely high aspect ratio (43.5) of the LYSO crystals and the selected reflector. Toray, a diffuse reflector, was used to improve the DOI resolution, but reduced the light collection efficiency [32]. The energy resolution can be improved using BaSO4 reflectors with a thickness of 80 μm, however, the detector efficiency will be lower due to the larger gaps between crystals [33, 34]. The timing resolution obtained is not currently useful for time-of-flight (TOF) PET. The timing resolution can be greatly improved in the future by extracting timing information from each SiPM individually using dedicated application-specific integrated circuits (ASICs) [35, 36], however, the cost and complexity of the readout electronics will need to be addressed. The DOI resolution is ~ 3.5 mm, which is similar to other DOI detectors based on 30 mm thick LYSO or LSO arrays and Toray reflectors [8, 37].
Other approaches also are being investigated for high performance brain scanners. Monolithic crystals have been used to build PET detectors [38–40] and avoid the need for finely segmenting the crystal into an array. Detectors based on monolithic crystals have been successfully used in small animal PET scanners [41]. However, a trade-off between sensitivity and resolution always needs to be made, which is more difficult for human brain imaging compared to preclinical applications. To obtain high resolution, relatively thin crystals are required (sensitivity is low); to obtain higher sensitivity, thicker crystals are required (spatial resolution is reduced). Monolithic crystal based PET detectors cannot use the simple center-of-gravity method to calculate the gamma photons’ interaction position so a positioning algorithm with more computational complexity such as neural networks or maximum likelihood are generally required [38–40, 42, 43].
5. Conclusions
The performance of a high sensitivity and high detection efficiency depth-encoding detector based on 16 × 16 arrays of 2 × 2 mm2 SiPMs coupled to an LYSO array with a pitch size of 0.75 mm and a thickness of 30 mm was evaluated for high resolution and high sensitivity brain PET applications. A multiplexed readout method was applied to reduce the 512 SiPM signals of the DOI detectors to 9 signals (8 signals for position information and 1 signal for timing information) to reduce the complexity and cost of the readout electronics. The DOI detector shows promising performance. A high resolution and high sensitivity brain PET system can be developed based upon these detectors, although reducing the degree of multiplexing and using ASICs to improve timing resolution and enable TOF would be valuable. Although the DOI detector was evaluated for high resolution and high sensitivity brain PET applications, other dedicated PET scanners such as breast PET and small animal PET also can be built based on these DOI-encoding detectors.
Acknowledgments
This work was funded by NIH grant R01 EB019439.
References
- [1].Jones T and Rabiner EA, The Development, Past Achievements, and Future Directions of Brain PET, J. Cereb. Blood Flow Metab 32 (2012) 1426. [DOI] [PMC free article] [PubMed] [Google Scholar]
- [2].Marcus C, Mena E and Subramaniam RM, Brain PET in the Diagnosis of Alzheimer’s Disease, Clin. Nucl. Med 39 (2014) e413. [DOI] [PMC free article] [PubMed] [Google Scholar]
- [3].Sehlin D et al. , Engineered antibodies: new possibilities for brain PET?, Eur. J. Nucl. Med. Mol. Imaging 46 (2019) 2848. [DOI] [PMC free article] [PubMed] [Google Scholar]
- [4].Watanabe M et al. , Performance evaluation of a high-resolution brain PET scanner using four-layer MPPC DOI detectors, Phys. Med. Biol 62 (2017) 7148. [DOI] [PubMed] [Google Scholar]
- [5].Lv Y et al. , Mini EXPLORER II: a prototype high-sensitivity PET/CT scanner for companion animal whole body and human brain scanning, Phys. Med. Biol 64 (2019) 075004. [DOI] [PMC free article] [PubMed] [Google Scholar]
- [6].Gaudin É, Toussaint M, Thibaudeau C, Paillé M, Fontaine R and Lecomte R, Performance Simulation of an Ultrahigh Resolution Brain PET Scanner Using 1.2-mm Pixel Detectors, IEEE Trans. Radiat. Plasma Med. Sci 3 (2019) 334. [DOI] [PMC free article] [PubMed] [Google Scholar]
- [7].Cherry SR, Sorenson JA and Phelps ME, Physics in Nuclear Medicine E-Book, Elsevier Health Sciences; (2012). [Google Scholar]
- [8].Du J, Bai X, Liu C-C, Qi J and Cherry SR, Design and evaluation of gapless curved scintillator arrays for simultaneous high-resolution and high-sensitivity brain PET, Phys. Med. Biol 64 (2019) 235004. [DOI] [PMC free article] [PubMed] [Google Scholar]
- [9].Akamatsu G et al. , Performance evaluation of a whole-body prototype PET scanner with four-layer DOI detectors, Phys. Med. Biol 64 (2019) 095014. [DOI] [PubMed] [Google Scholar]
- [10].González AJ et al. , The MINDView brain PET detector, feasibility study based on SiPM arrays, Nucl. Instrum. Meth. A 818 (2016) 82. [Google Scholar]
- [11].Gonzalez AJ et al. , Feasibility study of a small animal PET insert based on a single LYSO monolithic tube, Front. Med 5 (2018) 328. [DOI] [PMC free article] [PubMed] [Google Scholar]
- [12].James SS, Yang Y, Bowen SL, Qi J and Cherry SR, Simulation study of spatial resolution and sensitivity for the tapered depth of interaction PET detectors for small animal imaging, Phys. Med. Biol 55 (2009) N63. [DOI] [PMC free article] [PubMed] [Google Scholar]
- [13].Du J et al. , Performance of a high-resolution depth-encoding PET detector module using linearly-graded SiPM arrays, Phys. Med. Biol 63 (2018) 035035. [DOI] [PMC free article] [PubMed] [Google Scholar]
- [14].Ito M, Hong SJ and Lee JS, Positron emission tomography (PET) detectors with depth-of-interaction (DOI) capability, Biomed. Eng. Lett 1 (2011) 70. [Google Scholar]
- [15].Shao Y, Sun X, Lan KA, Bircher C, Lou K and Deng Z, Development of a prototype PET scanner with depth-of-interaction measurement using solid-state photomultiplier arrays and parallel readout electronics, Phys. Med. Biol 59 (2014) 1223. [DOI] [PMC free article] [PubMed] [Google Scholar]
- [16].Mohammadi I, Castro IFC, Correia PMM, Silva ALM and Veloso JFCA, Minimization of parallax error in positron emission tomography using depth of interaction capable detectors: methods and apparatus, Biomed. Phys. Eng. Express 5 (2019) 062001. [Google Scholar]
- [17].Kuang Z et al. , Design and performance of SIAT aPET: a uniform high-resolution small animal PET scanner using dual-ended readout detectors, Phys. Med. Biol 65 (2020) 235013. [DOI] [PubMed] [Google Scholar]
- [18].Du J, Bai X and Cherry SR, A depth-encoding PET detector for high resolution PET using 1 mm SiPMs, Phys. Med. Biol 65 (2020) 165011. [DOI] [PMC free article] [PubMed] [Google Scholar]
- [19].Yang Q, Kuang Z, Sang Z, Yang Y and Du J, Performance comparison of two signal multiplexing readouts for SiPM-based pet detector, Phys. Med. Biol 64 (2019) 23NT02. [DOI] [PubMed] [Google Scholar]
- [20].Popov V, Majewski S and Weisenberger AG, Readout Electronics for Multianode Photomultiplier Tubes with Pad Matrix Anode Layout, IEEE Nucl. Sci. Symp. Conf. Rec 3 (2003) 2156. [Google Scholar]
- [21].Du J et al. , Characterization of Large-Area SiPM Array for PET Applications, IEEE Trans. Nucl. Sci 63 (2016) 8. [DOI] [PMC free article] [PubMed] [Google Scholar]
- [22].Yamamoto S et al. , Development of a high-resolution Si-PM-based gamma camera system, Phys. Med. Biol 56 (2011)7555. [DOI] [PubMed] [Google Scholar]
- [23].Kyme AZ et al. , Open-field mouse brain PET: design optimisation and detector characterisation, Phys. Med. Biol 62 (2017) 6207. [DOI] [PubMed] [Google Scholar]
- [24].Gola A et al. , NUV-Sensitive Silicon Photomultiplier Technologies Developed at Fondazione Bruno Kessler, Sensors 19 (2019) 308. [DOI] [PMC free article] [PubMed] [Google Scholar]
- [25].Song TY, Wu H, Komarov S, Siegel SB and Tai Y-C, A sub-millimeter resolution PET detector module using a multi-pixel photon counter array, Phys. Med. Biol 55 (2010) 2573. [DOI] [PMC free article] [PubMed] [Google Scholar]
- [26].Yamamoto S, Watabe H, Kanai Y, Watabe T, Kato K and Hatazawa J, Development of an ultrahigh resolution Si-PM based PET system for small animals, Phys. Med. Biol 58 (2013) 7875. [DOI] [PubMed] [Google Scholar]
- [27].Du J et al. , Evaluation of Matrix9 silicon photomultiplier array for small-animal PET, Med. Phys 42 (2015) 585. [DOI] [PMC free article] [PubMed] [Google Scholar]
- [28].Du J et al. , Evaluation of linearly-graded SiPMs for high resolution small-animal PET, Biomed. Phys. Eng. Express 1 (2015) 045008. [Google Scholar]
- [29].Pizzichemi M et al. , On light sharing TOF-PET modules with depth of interaction and 157 ps FWHM coincidence time resolution, Phys. Med. Biol 64 (2019) 155008. [DOI] [PubMed] [Google Scholar]
- [30].Yoshida E, Obata F, Kamada K and Yamaya T, A crosshair light sharing PET detector with DOI and TOF capabilities using four-to-one coupling and single-ended readout, IEEE Trans. Radiat. Plasma Med. Sci (2020) 1. [Google Scholar]
- [31].Kang HG et al. , Crystal surface and reflector optimization for the SiPM-based dual-ended readout TOF-DOI PET detector, Biomed. Phys. Eng. Express 6 (2020) 065028. [DOI] [PubMed] [Google Scholar]
- [32].Ren S, Yang Y and Cherry SR, Effects of reflector and crystal surface on the performance of a depth-encoding PET detector with dual-ended readout, Med. Phys 41 (2014) 072503. [DOI] [PMC free article] [PubMed] [Google Scholar]
- [33].Kuang Z et al. , Dual-ended readout small animal PET detector by using 0.5 mm pixelated LYSO crystal arrays and SiPMs, Nucl. Instrum. Meth. A 917 (2019) 1. [Google Scholar]
- [34].Yang Q, Sang Z, Zhang C and Du J, Performance of two depth-encoding dual-ended readout PET detectors based on SiPM arrays with the same pitch size and different active areas, 2020. JINST 15 T11003. [Google Scholar]
- [35].Schug D, Nadig V, Weissler B, Gebhardt P and Schulz V, Initial Measurements with the PETsys TOFPET2 ASIC Evaluation Kit and a Characterization of the ASIC TDC, IEEE Trans. Radiat. Plasma Med. Sci 3 (2019) 444. [Google Scholar]
- [36].Li M, Wang Y and Abbaszadeh S, Development and initial characterization of a high-resolution PET detector module with DOI, Biomed. Phys. Eng. Express 6 (2020) 065020. [DOI] [PMC free article] [PubMed] [Google Scholar]
- [37].Du J, Ariño-Estrada G, Bai X and Cherry SR, Performance comparison of dual-ended readout depth-encoding PET detectors based on BGO and LYSO crystals, Phys. Med. Biol 65 (2020) 235030. [DOI] [PMC free article] [PubMed] [Google Scholar]
- [38].Sanaat A and Zaidi H, Depth of Interaction Estimation in a Preclinical PET Scanner Equipped with Monolithic Crystals Coupled to SiPMs Using a Deep Neural Network, Appl. Sci 10 (2020) 4753. [Google Scholar]
- [39].Tao L, Li X, Furenlid LR and Levin CS, Deep learning based methods for gamma ray interaction location estimation in monolithic scintillation crystal detectors, Phys. Med. Biol 65 (2020) 115007. [DOI] [PubMed] [Google Scholar]
- [40].España S, Marcinkowski R, Keereman V, Vandenberghe S and Holen RV, DigiPET: sub-millimeter spatial resolution small-animal PET imaging using thin monolithic scintillators, Phys. Med. Biol 59 (2014) 3405. [DOI] [PubMed] [Google Scholar]
- [41].Krishnamoorthy S, Blankemeyer E, Mollet P, Surti S, Holen RV and Karp JS, Performance evaluation of the MOLECUBES β-CUBE — a high spatial resolution and high sensitivity small animal PET scanner utilizing monolithic LYSO scintillation detectors, Phys. Med. Biol 63 (2018) 155013. [DOI] [PMC free article] [PubMed] [Google Scholar]
- [42].Gong K, Berg E, Cherry SR and Qi J, Machine Learning in PET: From Photon Detection to Quantitative Image Reconstruction, Proc. IEEE 108 (2020) 51. [DOI] [PMC free article] [PubMed] [Google Scholar]
- [43].Llosá G et al. , Characterization of a PET detector head based on continuous LYSO crystals and monolithic, 64-pixel silicon photomultiplier matrices, Phys. Med. Biol 55 (2010) 7299. [DOI] [PubMed] [Google Scholar]