


Abstract
Genome segregation is a vital process in all organisms. Chromosome partitioning remains obscure in Archaea, the third domain of life. Here, we investigated the SegAB system from Sulfolobus solfataricus. SegA is a ParA Walker-type ATPase and SegB is a site-specific DNA-binding protein. We determined the structures of both proteins and those of SegA–DNA and SegB–DNA complexes. The SegA structure revealed an atypical, novel non-sandwich dimer that binds DNA either in the presence or in the absence of ATP. The SegB structure disclosed a ribbon–helix–helix motif through which the protein binds DNA site specifically. The association of multiple interacting SegB dimers with the DNA results in a higher order chromatin-like structure. The unstructured SegB N-terminus plays an essential catalytic role in stimulating SegA ATPase activity and an architectural regulatory role in segrosome (SegA–SegB–DNA) formation. Electron microscopy results also provide a compact ring-like segrosome structure related to chromosome organization. These findings contribute a novel mechanistic perspective on archaeal chromosome segregation.
INTRODUCTION
Newly replicated DNA requires accurate segregation to ensure that the genetic material is maintained. Many nucleoprotein complexes play a crucial role in this process (1). In eukaryotic cells, the segregation of chromatids is well defined as the centromere is pulled by the mitotic spindle and motor proteins (2). In bacteria, DNA partitioning systems contain three components: an NTPase, a centromere-binding protein (CBP) and centromere-like DNA site. Segregation systems are classified into different types based on the features of the NTPase (3,4). Several DNA segregation mechanisms have been proposed in bacteria. Earlier studies proposed a pulling mechanism mediated by ParABS systems (5–8) and a pushing mechanism effected by the ParMRC complex (9–11). More recently, two diffusion-ratchet mechanisms (DNA relay and hitchhiking) were proposed, according to which the ParB–DNA cargo moves on the nucleoid in a ParA concentration-dependent manner (12–14). Moreover, a Venus flytrap mechanism was proposed. According to this model, ParG dimers bind to the partition site and the ParG–cargo complex is engulfed into a three-dimensional meshwork formed by ParF (ParA family) associated with the nucleoid. The chromosome provides a scaffold within which ParF shuttles to drive sister plasmids apart (15).
Archaea are the third domain of life and, based on the recent discovery of new phyla, have been proposed to be the ancestors of eukaryotes (16,17). An understanding of how newly replicated genomes are separated in members of this domain is still lacking (18,19). Recently, the archaea AspA–ParBA segregation system from plasmid pNOB8 (20–22) was characterized. This plasmid partition cassette harbors three genes encoding for the proteins ParA, ParB and AspA (20). Briefly, pNOB8 ParA is a Walker-type ATPase homologous to bacterial ParAs; ParB is an adaptor protein, whose C-terminus has a fold similar to eukaryotic CENP-A and the N-terminus shares similarity with bacterial ParBs; and AspA is an archaea-specific CBP (20).
Although the segregation of this archaeal plasmid has provided a wealth of information, the factors that mediate chromosome segregation in archaea need to be further explored. Although archaea are prokaryotes, the cell cycle is closer to that of eukaryotes. Previous studies on Sulfolobus spp. showed that chromosome replication is followed by a prolonged G2 phase and is temporally separate from segregation, which occurs very rapidly in M phase (23). However, in bacteria the replication and partitioning processes occur simultaneously (24,25). These results point to substantial regulatory differences between bacterial and archaeal DNA segregation systems. Interestingly, chromosome pairing is also observed in Sulfolobus spp. cells during the protracted G2 phase prior to segregation (23,26). These phenomena were first discovered more than two decades ago in Sulfolobus spp., but the details remain obscure.
A system involved in Sulfolobus solfataricus genome segregation has been elucidated (27,28). Two proteins, SegA and SegB, participate in archaeal chromosome segregation (27,28). SegA shows homology to bacterial chromosome-encoded ParA Walker-type ATPases. SegB, an archaea-specific DNA-binding protein, recognizes specifically palindromic centromere-like sites, site 1 (S1) upstream of segA start codon and site 2 (S2) centered at position −59 upstream of the same start codon (27). The overexpression of either segA or segAB genes increases the percentage of anucleate cells, which indicates that SegAB act as major mediators of chromosome segregation in S. solfataricus (27). The segAB cassette has a centromere-like site upstream of segA and segB, showing a close relationship with bacterial parABS (28,29) partition cassettes.
Sulfolobus solfataricus exhibits a unique archaeal chromosome processing machine. However, very little is known about the structure–function relationship of the SegAB system’s components. In this study, we determined five crystal structures of SegA and SegB, in both apo- and DNA-bound states. These structures revealed that SegA forms a novel non-sandwich dimer and exhibits two DNA binding sites. Moreover, our studies showed that SegB in complex with S1 DNA can form a higher order partition complex. We found that SegB significantly stimulates SegA ATPase activity through its N-terminal domain. In addition, negative-stain electron microscopy (EM) images of the SegAB–DNA ensemble showed unique segrosome complexes. These findings advance our understanding and provide novel mechanistic insights into chromosome segregation in archaea.
MATERIALS AND METHODS
Protein expression and purification
The segA and segB genes and their mutants were cloned into pET22b(+) (Novagen) vector with a C-terminal His6 tag for protein expression in Escherichia coli BL21 (DE3) Codon Plus (ChlR) (27). Transformed E. coli cells were grown on LB agar plate containing 100 μg/ml ampicillin and 34 μg/ml chloramphenicol at 37°C for 16 h. Then, few colonies were scraped and transferred into 20 ml LB medium to proliferate at 37°C for 2 h. The 20 ml culture containing segA or segB expressing plasmids was transferred into 1 l LB medium at 37°C. When the OD600nm reached 0.8, 1 mM isopropyl-β-d-1-thiogalactopyranoside was added. The culture overproducing SegA was then incubated at 30°C for 3 h, and the one overproducing SegB was grown at 37°C for 3 h. Cells were harvested by centrifugation at 4500 × g for 30 min at 4°C for the following purification steps.
SegA-overproducing cell pellets were resuspended in lysis buffer A (20 mM HEPES, pH 7.5) and disrupted by a homogenizer, and then heated at 65°C for 15 min. After debris removal, SegA was purified on HiTrap™ Heparin (Cytiva) column with elution buffer A (20 mM HEPES, pH 7.5, and 1.8 M NaCl). The SegA protein was further purified on a HiLoad 16/600 Superdex 75 pg (Cytiva) with elution buffer A. SegA mutations (G10V, K14Q, Q131A and Q131A/F158A) were constructed by the site-directed mutagenesis method and verified by sequencing. SegA-Q131A and SegA-Q131A/F158A mutant proteins cannot bind with HiTrap™ Heparin (Cytiva) column; we therefore reconstructed His-tag fusion proteins and purified through the Ni column. The SegA-Q131A and SegA-Q131A/F158A mutants were further dialyzed against 20 mM Tris–HCl, pH 7.5, 100 mM NaCl, 200 mM imidazole and 2 mM MgCl2. SegB-overproducing cells were resuspended in lysis buffer B (20 mM Tris–HCl, pH 7.5, and 1 M NaCl), disrupted by a microfluidizer and then heated at 80°C for 30 min. The cell lysate was centrifuged at 35 000 × g at 4°C for 30 min to remove the debris. The supernatant was loaded onto a HisTrap™ HP column equilibrated with lysis buffer B. After step washes with lysis buffer B containing 105 and 165 mM imidazole, the target protein was eluted with the elution buffer (20 mM HEPES, pH 7.5, 1 M NaCl and 300 mM imidazole). Fractions containing SegB were pooled and the protein was treated with 1 M ammonium sulfate. The protein was loaded onto a 5-ml HiTrap Phenyl HP column equilibrated in 20 mM Tris–HCl, pH 8.0, and SegB came off in the flow through. The SegB protein was dialyzed against 20 mM Tris–HCl, pH 7.5, 100 mM NaCl and 2 mM MgCl2, and then purified on a Superdex 200 gel filtration column equilibrated with the same buffer. All purified proteins were subjected to SDS-PAGE analysis and the purity was >95%.
DNA substrate preparation
The 24-bp nsDNA (F: AGGGTGTTCCACGTGAAACAGGGA; R: TCCCTGTTTCACGTGGAACACCCT) contains a scrambled DNA sequence, and the site-specific 21-bp DNA (F: ACGTAGAAGAGTCTAGACTGA; R: CAGTCTAGACTCTTCTACGTA) and 23-bp DNA (F: TACGTAGAAGAGTCTAGACTGAC; R: TCAGTCTAGACTCTTCTACGTAG) contain S1 sequence (27). Oligonucleotides were suspended at a 1:1 molar ratio of complementary DNA sequences in buffer containing 20 mM Tris–HCl, pH 7.5, 100 mM NaCl and 2 mM MgCl2. After incubation at 95°C for 5 min, the solution was slowly cooled to room temperature, and the DNA substrate was stored at −20°C.
Fluorescence polarization binding isotherms
The equilibrium DNA binding assays with SegA and SegB were done by fluorescence polarization (FP) binding isotherms. The DNA substrates were fluorescently labeled on the 5′ end, which allows to measure the increase in FP of the protein–DNA complex relative to the value obtained for the unbound DNA. Twenty micromolar protein with a 2-fold serial dilution was made in storage buffer (20 mM Tris–HCl, pH 7.5, 100 mM NaCl and 2 mM MgCl2) and pre-incubated with 5 nM cyanine 3 (Cy3)-labeled DNA at room temperature. The effect of nucleotides on SegA–DNA binding was investigated in the presence of 1 mM nucleotides (ATP or ADP) under the standard experimental conditions. The unbound state is represented by the FP of the Cy3-labeled DNA in the presence of buffer alone. The ATP titration assay used 10 μM SegA and 5 nM S1 DNA and followed the same reaction conditions. ATP concentration was started from 1 mM with serial dilution. We used 10 μM SegA and 5 nM S1 DNA without ATP as a blank. DNA binding by the protein was determined by measuring the changes in FP using a Paradigm plate reader (Molecular Devices). The FP signal was read at 595 nm at an excitation of 535 nm and calculated by determining the concentration of protein required to bind 50% of the Cy3-labeled DNA. The average of three independent experiments is shown, with error bars representing standard deviations. Fluorescence anisotropy experiments to test the binding of wild-type (WT) SegA and mutants to the fluorescent ATP analogue 2′(3′)-O-(N-methylanthraniloyl)-adenosine 5′-triphosphate (MANT-ATP) were performed as previously reported (27).
Chemical cross-linking
Bis(sulfosuccinimidyl)suberate (BS3) cross-linker was dissolved in coupling buffer (50 mM HEPES–KOH, pH 7.5, 50 mM KCl and 50 mM MgCl2) (20 mM). Both SegA and SegB used for the experiments were subjected to buffer exchange into coupling buffer using Thermo Scientific Zeba Spin Desalting Columns, 7K MWCO. Cross-linking reactions included SegA (10 μg), SegB (10 μg), 0.2 mM BS3, 1.5 mM ATP and 80 ng of S. solfataricus P2 genomic DNA. The reactions were incubated at 37°C for 30 min, and then quenched by addition of ammonium bicarbonate, pH 8.5 (250 mM), with a further 15-min incubation at 37°C. SDS loading buffer was added to the reactions and the samples were heated at 95°C for 10 min and then spun down for 3 min at 13 000 rpm. An aliquot of 25 μl of the reaction was run on Invitrogen NuPAGE 4–12% Bis–Tris protein gels. NuPAGE MES SDS running buffer was used for the electrophoresis. The gel was stained with Invitrogen™ SimplyBlue™ SafeStain and destained in Milli-Q water. The band corresponding to the cross-linked SegA–SegB complex was cut from the gel and subjected to mass spectrometry.
Liquid chromatography–tandem mass spectrometry and data analysis
Excised gel band samples were washed twice with 25 mM ammonium bicarbonate in 50% acetonitrile (v/v) followed by a 100% acetonitrile wash and drying under vacuum. Reduction was carried out with 10 mM dithioerythritol in 100 mM ammonium bicarbonate at 56°C for 1 h. Gel pieces were then allowed to return to room temperature and subjected to alkylation with 50 mM iodoacetamide in the dark at room temperature for 30 min. Samples were then washed with 100 mM ammonium bicarbonate, followed by 25 mM ammonium bicarbonate in 50% acetonitrile/50% water (v/v) and finally pure acetonitrile. Digestion was carried out overnight at 37°C using 200 ng of sequencing grade trypsin (Promega). Digested peptides were resuspended in 0.1% trifluoroacetic acid (v/v) and then loaded onto an mClass nanoflow UPLC system (Waters) equipped with a nanoEaze M/Z Symmetry 100 Å C18, 5 μm trap column (180 μm × 20 mm, Waters) and a PepMap, 2 μm, 100 Å, C18 EasyNano nanocapillary column (75 μm × 500 mm, Thermo). The trap wash solvent was aqueous 0.05% (v/v) trifluoroacetic acid and the trapping flow rate was 15 μl/min. The trap was washed for 5 min before switching flow to the capillary column. Separation used gradient elution of two solvents: solvent A, aqueous 0.1% (v/v) formic acid; solvent B, acetonitrile containing 0.1% (v/v) formic acid. The flow rate for the capillary column was 300 nl/min and the column temperature was 40°C. The linear multistep gradient profile was as follows: 3–10% B over 7 min, 10–35% B over 30 min, 35–99% B over 5 min and then proceeded to wash with 99% solvent B for 4 min. The nanoLC system was interfaced with an Orbitrap Fusion hybrid mass spectrometer (Thermo) with an EasyNano ionization source (Thermo). Precursor scans were acquired at a resolution of 120 000 and AGC target of 1e6; peptides with a charge state ≥3 were selected for fragmentation. MS2 level fragmentation was by a hybrid method wherein each peptide was subjected to CID followed by EThcD with fragments measured in the Orbitrap at a resolution of 30 000. CID utilized a normalized collision energy of 35 and the overall duty cycle was restricted to 5 s. Label-free quantification, run alignment and peak picking were carried out in Progenesis QI (Waters/Nonlinear dynamics). Generated Mascot generic files (.mgf) were then passed to the Byonic search engine for cross-linked peptide identification. Byonic default settings for BS3 cross-link analysis were selected with a precursor and fragment mass tolerance of 3 ppm. Results were filtered for a posterior error probability of <0.05. Multiple test corrected ANOVA values from Progenesis QI were then combined with the Byonic output using an in-house Python script.
Electrophoretic mobility shift assay
Band-shift assays were carried out using a 289-bp biotinylated DNA fragment containing the 219-bp region upstream of the segA start codon and 70 bp of the segA gene. Proteins were incubated with the biotinylated DNA fragment (5 nM) in binding buffer (20 mM Tris–HCl, pH 7.5, 50 mM KCl, 1 mM DTT, 5 mM MgCl2, 2.5% glycerol and 0.05% NP-40) in a final volume of 20 μl at 37°C for 20 min. The reactions were then loaded onto a 5% acrylamide gel and run for 2 h at 100 V in 0.5× TBE. The DNA fragments were subsequently transferred onto a positively charged Nylon membrane and the detection was performed by using the LightShift chemiluminescence kit (Thermo Fisher).
DNase I footprint
The binding reactions (20 μl) were assembled as for electrophoretic mobility shift assays (EMSAs) and incubated for 20 min at 37°C. DNase I (0.1 U) was then added and after further 90 s incubation at 37°C 200 μl DNase stop solution (10 mM EDTA, pH 8.0, and 0.3 M sodium acetate) was added to stop the digestion. The reactions were subjected to phenol–chloroform extraction followed by ethanol precipitation. Pellets were resuspended in 12 μl of loading solution (95% formamide, 20 mM EDTA, 0.05% Bromophenol Blue and 0.05% Xylene Cyanol) out of which 5–12 μl was loaded onto a prewarmed denaturing 4.5–6% 19:1 polyacrylamide gel containing urea. The gel was run in 1× TBE at 60 W for ∼2 h. DNA fragments were then transferred from the gel to a positively charged Nylon membrane and covalently cross-linked to it by UV exposure. The LightShift chemiluminescence kit (Pierce) was used to detect DNA fragments.
Crystallization
All the crystallization trials in this study were performed by the vapor diffusion method. SegA (3 mg/ml) crystals were grown in 100 mM MES sodium salt (pH 6.5), 15% (w/v) PEG 8000 and 100 mM calcium acetate with 1 mM ATPγS. For the SegA–DNA complex, 200 μM SegA (∼5 mg/ml) and 40 μM 24-bp nsDNA were incubated at a molar ratio of 5:1 (protein:DNA). The SegA–DNA crystal was obtained with extra 10 mM ATPγS and a reservoir solution containing 100 mM MES sodium salt (pH 6.5), 15% (w/v) PEG 8000 and 100 mM calcium acetate. Both crystals were grown within 2 days following incubation at 20°C. For the SegB crystallization trials, SegBΔ33 protein samples (10 mg/ml) were mixed and equilibrated against precipitant solution containing 200 mM ammonium sulfate and 30% PEG 4000 at 20°C for 4 days. The SegB heavy-atom derivative crystal was soaked with 2 mM K2Pt(NO2)4 under identical precipitant solution for 16 h at 20°C. To produce the SegBΔ33–DNA complex, SegBΔ33 (5 mg/ml) in 100 mM phosphate/citrate (pH 4.0) buffer was mixed with the 21-bp S1 DNA at a molar ratio of 1:1 (protein:DNA) and the crystals were grown by precipitant solution [200 mM magnesium chloride hexahydrate, 100 mM sodium citrate tribasic dihydrate (pH 5.0) and 10% (w/v) PEG 20 000] for 1 month.
Data collection and structure determination
X-ray diffraction data for all the crystals used in this study were collected from beamlines TLS 15A1 and TPS 05A, National Synchrotron Radiation Research Center, Taiwan. All datasets were processed using the HKL-2000 software (30). The crystal parameters and refinement statistics of SegA– and SegA–DNA complexes are shown in Supplementary Table S1. The structural phases of SegA were solved by molecular replacement (MR) with Phaser (31), using HpSoj (PDB ID: 6IUB) as a searching model (32). The structural phases of SegA–DNA were determined by MR using SegA as the searching model. The ADP, adenosine 5′-(β,γ-imido)triphosphate (AMPPNP) and DNA molecule were determined from the Fo–Fc omit map. The structure of SegBΔ33 was determined by the multiwavelength anomalous dispersion from Pt heavy-atom derivative. The Pt–SegBΔ33 crystal phase was determined by two Pt sites with three molecules per asymmetric unit by PHENIX AutoSol (33). The auto-build of preliminary Pt–SegBΔ33 crystal model was calculated by PHENIX AutoBuild (34). Structural phases of SegBΔ33–S1 DNA complexes were solved by MR with Phaser using preliminary SegBΔ33 as the search model (31). All structural refinements were performed in PHENIX, and structural model adjustments were carried out in COOT (35). Detailed X-ray diffraction data and structural refinement statistics of all SegB crystals are summarized in Supplementary Table S1.
Electron microscopy
All negative-stain EM experiments were performed in 20 mM Tris–HCl, pH 7.5, 100 mM NaCl and 5 mM MgCl2 at 37°C for 30 min. Two micromolar S1 DNA alone was prepared as a control (Supplementary Figure S1). Twenty micromolar SegA or SegB proteins were prepared for the control images, respectively. To produce the SegA–nucleotide complex, SegA (20 μM) was mixed with 2 mM nucleotides (ATP or ADP). Twenty-three base pair S1 DNA was used in all protein–DNA complex studies, and the molar ratio was 10:1 (protein:DNA). For SegB–S1 DNA or SegBΔ33–S1 DNA complex, we used 20 μM SegB or SegBΔ33 and mixed with 2 μM S1 DNA. For the SegAB–S1 DNA complex, 20 μM SegA, 20 μM SegB or SegBΔ33, 1 μM S1 DNA and 2 mM ATP or ADP were mixed. The 600-bp DNA (S1S2S3-600) samples were amplified by PCR from S. solfataricus, which consists of two specific centromere-like DNA binding sites, S1, S2 and S3 in the middle of DNA based on previous report (27). For the SegA–ATP–SegB–S1S2S3-600 DNA complex, we use 400 nM SegA, 200 nM SegB and 2 nM S1S2-600 with 2 mM ATP. The samples were put on a clean parafilm surface and were picked up on a carbon-coated grid before being negatively stained with 1.5% uranyl acetate. After the grid had been air-dried for 1 day, images were captured by a Tecnai G2 Spirit TWIN (Thermo) electron microscope at a magnification of 26 000× at 120 kV. Protein–DNA complex length and width were measured using ImageJ. Image frames were randomly selected from different grids.
ATPase assay
The ATPase assays were performed using the malachite green method with some modification (36). Ten micromolar SegA was incubated with ATP (at the indicated concentration) in 20 mM Tris–HCl, pH 7.5, 100 mM NaCl and 2 mM MgCl2. The assay was carried out in a final reaction volume of 200 μl at 37°C for 1 h. Two hundred microliters of 10% SDS was added to terminate the reaction, followed by 200 μl of 1.25% ammonium molybdate in 6.5% H2SO4 and 200 μl of 9% ascorbic acid to detect the hydrolyzed phosphate product. Molybdic acid and hydrolyzed free phosphate form a complex that can be reduced and produces a deep blue color by ascorbic acid and is monitored at 660 nm. The stimulation of SegA (10 μM) ATPase activity was observed in the presence of SegB (10 μM) and DNA (1 μM). ATPase activity was determined under standard assay conditions. Three independent repeats for SegA ATPase activity were conducted with error bars representing standard deviations.
RESULTS
SegA binds nonspecific DNA either in the absence or in the presence of ATP
SegA from the archaeon S. solfataricus is a segregation protein consisting of 220 amino acids with a molecular weight of 24.3 kDa, characterized by a deviant Walker A motif. The protein belongs to the ParA family (27). Multiple sequence alignments showed that the sequence identity between SegA and chromosome-encoded ParA proteins, such as HpSoj and TtSoj, is 32% and 28%, respectively, while the identity shared with plasmid-encoded ParA is only 18–22% (Supplementary Figure S2A). SegA contains three conserved motifs, Walker A (9KGGVGKT15), Walker A′ (31TGGLLDLD37) and Walker B (101FLVID105) (Supplementary Figure S2A). These motifs are essential for ATP binding and hydrolysis in the ParA superfamily (37). From size exclusion chromatography studies, we observed that SegA forms dimer either in the presence or in the absence of ADP (Supplementary Figure S3A). However, SegA eluted as a higher molecular mass protein resulting in a broad peak upon addition of ATP (Supplementary Figure S3A). This phenomenon is consistent with a previous report that ATP would promote the assembly of SegA into oligomeric clusters (27).
To test the ability of SegA to bind DNA either in the presence or in the absence of nucleotides, we performed FP binding isotherms assays. The FP results showed that the dissociation constant (Kd) between SegA and a 24-bp nonspecific DNA (nsDNA) is 0.71 μM in the absence of nucleotide, and is 0.24 and 0.45 μM in the presence of ATP and ADP, respectively (Figure 1A; individual data are shown in Supplementary Figure S4A). Although SegA showed no sequence preference when binding DNA, we investigated its binding affinity for S1 recognized by SegB and located upstream of segA start codon. To this end, we performed the same FP experiment with the 23-bp S1 DNA. The result showed that the binding affinity of SegA for the 23-bp S1 DNA is 1.3 μM in the absence of nucleotide, and is 0.21 and 0.47 μM in the presence of ATP and ADP, respectively (Figure 1A; individual data are shown in Supplementary Figure S4A). The binding affinities for the two DNA sequences did not show a significant difference. Interestingly, previous reports indicate that members of the ParA superfamily require ATP for DNA binding (12,32,38). To our surprise, although the DNA binding affinity of SegA is higher in the presence of nucleotides, they are not essential for SegA to bind DNA. To investigate the effects of ATP, we also performed an ATP titration assay. The result showed that the SegA–DNA binding became more pronounced with increasing concentrations of ATP (Supplementary Figure S5). Our findings suggest that ATP may not be essential for DNA binding by SegA, but ATP enhances the DNA binding affinity. This phenomenon might be due to some conformational changes that are triggered by ATP binding within SegA.
Figure 1.

Characterization of SegA and SegB. (A) DNA binding by SegA to a 24-bp nsDNA and 23-bp S1 DNA was measured by FP binding isotherms. SegA binds to the 24-bp nsDNA in the absence of nucleotide (closed up-pointing triangle; colored in yellow) and with ATP (closed square; colored in blue) or ADP (closed square; colored in magenta). SegA binding to the 23-bp S1 DNA without nucleotide (closed circle; colored in black) and in the presence of ATP (closed circle; colored in red) or ADP (closed down-pointing triangle; colored in green) is shown. (B) Fluorescence anisotropy ATP binding assay for WT SegA (closed circle), SegA-G10V (closed square) and SegA-K14Q (closed up-pointing triangle) to 1 μM MANT-ATP. (C) SegA ATPase activity assays. SegA (10 μM) ATPase activity was observed in the absence or presence of SegB (10 μM) and DNA (1 μM). The data were plotted as SegA (closed circle), SegA + S1 DNA (open circle), SegA + SegB (closed down-pointing triangle), SegA + SegB + S1 DNA (open up-pointing triangle), SegA + SegBΔ33 (closed square), SegA + SegBΔ33 + S1 DNA (open square) and SegA + SegBΔ21 + S1 DNA (open diamond). (D) Binding of SegB (open circle) and SegBΔ33 (closed circle; colored in cyan) to the 23-bp S1 DNA. DNA binding was measured by FP and plotted against protein concentration (0–20 μM). All measurements are reported in triplicate and error bars represent the standard deviation of the mean; the solid lines represent fitting curves to the Michaelis–Menten equation.
To further confirm the DNA binding ability of SegA, we constructed two mutant proteins, SegA-G10V and SegA-K14Q, by replacing Walker A motif highly conserved residues whose corresponding amino acids in other ParA proteins are known to be crucial for ATP binding and hydrolysis (39,40). ATP binding was tested by fluorescence anisotropy in the presence of MANT-ATP. SegA-G10V bound MANT-ATP with an affinity (Kd ∼ 516 nM) similar to that of WT SegA (Kd ∼ 400 nM). In contrast, SegA-K14Q ATP binding was virtually ablated (Figure 1B). We also used FP to evaluate the DNA binding ability of the mutant SegA proteins. Both mutants exhibited DNA binding activities even in the absence of nucleotides (Supplementary Figure S6). Notably, SegA-K14Q is impaired in ATP binding, but still able to bind DNA, further supporting the finding that SegA does not need ATP to associate with DNA. Different from the bacterial ParA orthologues, the ATP is not essential for SegA to bind DNA. Since SegA is a Walker-type ATPase, we performed ATPase assays. As shown in Figure 1C, SegA showed a faint ATPase activity (∼10 μM ATP hydrolyzed/h) that is consistent with a previous study (27).
SegA forms a unique dimeric structure
The crystal of the SegA–ADP complex was grown in a solution containing ATPγS. However, we noted that ATPγS was hydrolyzed to ADP during crystallization, since only ADP density was observed (Supplementary Figure S7A). This phenomenon was also observed for the TtSoj–ADP structure (38). The monomer structure of the SegA–ADP complex shows the typical deviant Walker A ATPase structure (Figure 2A and Supplementary Table S1). Briefly, SegA comprises an eight-stranded β-sheet (β1–β8) that forms the central core flanked by five helices (α1, α2 and α7–α9) on one side and four helices (α3–α6) on the other side. The monomer structure is similar to that observed for members of the ParA superfamily. We then superimposed the monomer of SegA, HpSoj and pNOB8 ParA. The root mean square deviation (r.m.s.d.) between SegA and HpSoj is 1.4 Å (in Cα), between SegA and pNOB8 ParA is 1.6 Å (in Cα), and between HpSoj and pNOB8 ParA is 5.3 Å (in Cα) (Supplementary Figure S8A and B).
Figure 2.
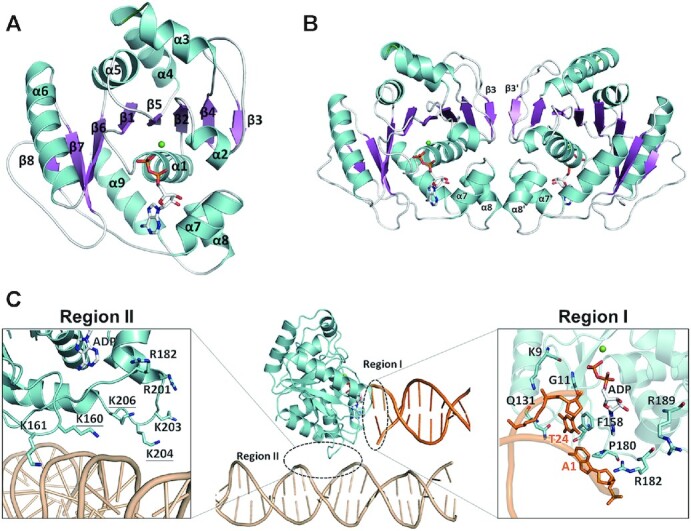
Crystal structures of SegA–ADP and SegA–ADP–DNA complexes. (A) SegA monomer structure is shown in ribbon, and nine α-helices (α1–α9) and eight β-sheets (β1–β8) are labeled and colored in cyan and magenta, respectively. ADP is displayed as bond and stick, and magnesium ion is displayed as a green sphere. (B) SegA dimer structure is shown in ribbon, and α-helices and β-sheets are colored as cyan and magenta, respectively. (C) The DNA binding regions of the SegA–ADP–DNA complex. Regions I and II are labeled with dotted circles. The DNA molecules associated with the two regions are shown in orange and wheat for regions I and II, respectively. On the right and left sides are close-up looks of the interaction details for regions I and II. The residues interacting with DNA are shown as sticks and labeled.
In the ParA superfamily, the sandwich dimer is critical for DNA binding (38,41), as the sandwich dimer can provide sufficient DNA binding regions in the presence of ATP (32,38). Surprisingly, instead of a sandwich dimer, SegA adopts a different conformation assembling into a ‘forward–backward’ dimer (Figure 2B). In this dimer, each monomer is arranged side by side through the β3 strands in parallel orientation and forms a large β-sheet consisting of 16 consecutive β-strands (Figure 2B). In addition to β3, the dimer interface is also formed by the α2β3 loop, the β3β4 loop, α7 and α8. The monomer–monomer interactions mainly comprise hydrophobic interactions and hydrogen bonds (Supplementary Figure S9A). The buried surface area of dimer interface is 850.5 Å2 as calculated by PISA server (42). Interestingly, the residues involved in the dimer interface interaction in SegA are highly conserved in Crenarchaea (Supplementary Figure S9B), but they are not conserved in the bacterial ParA superfamily (Supplementary Figure S2A).
The nucleotide ADP is determined by Fo–Fc omit map (Supplementary Figure S7A) and it forms H-bond between the α/β-phosphate and residues 11–16 (Walker A motif). SegA residues N157/P179/S181/F184 form H-bonds with ADP, and F158 forms π–π stacking with the base of ADP. The cofactor magnesium ion maintains six coordinations through Thr15, ADP O3B and four water molecules (Supplementary Figure S7A).
The formation of a ParA sandwich dimer is typically induced by ATP (38). However, our SegA dimer is in ADP state. To further confirm the forward–backward dimer in the ATP state, we crystallized SegA with AMPPNP, which contains triphosphate to mimic the ATP binding state. We observed AMPPNP inside the nucleotide binding pocket (Supplementary Figure S7B and Supplementary Table S2). The SegA–AMPPNP complex structure still forms a forward–backward dimer that is different from its bacterial ParA orthologues. This result indicates that the SegA forward–backward dimer is not regulated by nucleotides. To simplify, we will only use SegA–ADP in the following experiments.
The structure of SegA–DNA complex reveals a novel DNA binding site
To further understand how this unique SegA dimer recognizes DNA, we crystallized and determined the structure of SegA in complex with DNA (Supplementary Table S1). We observed the ADP molecule again, although ATPγS was added to the crystallization samples. The conformation of SegA with and without DNA is similar. Surprisingly, we observed two DNA binding sites, regions I and II, in each monomer (Figure 2C and Supplementary Figure S9C). In DNA binding region I, the terminal end of DNA faces the SegA nucleotide binding site with more extensive protein–DNA interactions than those observed in DNA binding region II (Figure 2C). In DNA binding region I, Gln131 interacts with the phosphate group of T24 through a hydrogen bond, Phe158 interacts with the base of T24 through π–π stacking, Pro180 interacts with A1 base through alkyl–π interaction, Gly11 forms a H-bond with T24 and Lys9 interacts with the phosphate group of T24 thorough electrostatic interaction (Figure 2C). We noticed that Lys9 and Gly11 are two highly conserved nucleotide-binding residues in the deviant Walker A superfamily. Based on our SegA–DNA complex structure (Figure 2C), three key residues (Gln131, Phe158 and Pro180) are involved in the DNA binding. We constructed and purified Q131A, Q131A/F158A and Q131A/F158A/P180A mutants to further investigate the nsDNA binding ability in DNA binding region I. Meanwhile, their DNA binding was measured by the FP DNA binding assays and is shown in Supplementary Figure S10. The results revealed that single and double mutants lost their DNA binding ability. This phenomenon indicated that DNA binding region I plays an important role in the DNA binding of SegA. However, the triple mutant (Q131A/F158A/P180A) precipitated immediately after purification. To address as to whether the SegA mutant proteins are folded, we performed ATP hydrolysis assays with WT SegA and its mutant proteins in a buffer containing 200 mM imidazole. The ATPase activities of SegA-Q131A and SegA-Q131A/F158A resulted in 11.8 and 13.5 μM ATP hydrolyzed/h, respectively. The ATP hydrolysis rate is 20–30% lower than that of WT protein in the presence of 200 mM imidazole. This suggests that those mutant proteins may still maintain proper folding (Supplementary Figure S11). However, the purification of SegA-Q131A and SegA-Q131A/F158A mutant proteins proved challenging, as the proteins appeared not to be stable in solution. Given the observed absence of DNA binding and the precarious stability of the mutants, we cannot exclude that the proteins may not be correctly folded. In addition, we compared the ATP hydrolysis rate of WT SegA protein containing the His tag (∼16 μM ATP hydrolyzed/h) and without His tag (∼17.6 μM ATP hydrolyzed/h). The result reveals that both proteins have comparable ATPase activity and indicates that His-tag fusion did not affect protein function (Supplementary Figure S11). In DNA binding region II, SegA residues Lys160, Lys161, Arg182, Arg201, Lys203, Lys204 and Lys206 form a basic patch for DNA binding. This positively charged environment of region II provides the electrostatic interactions for DNA phosphate groups and H-bond interactions (Figure 2C). This basic DNA binding patch is also found in bacterial ParA orthologues (32).
Characterization of SegB DNA binding properties
SegB is an archaea-specific protein consisting of 109 residues and binds to site-specific S1 DNA motif (27). A previous report also indicated that SegB lacks homology to either eukaryotic or bacterial proteins, but shares high sequence identity with uncharacterized hypothetical proteins from both Crenarchaea and Euryarchaea (Supplementary Figure S2B) (27). We also performed a BLAST search of the S1 site sequence (GAAGAGTCTAG) in archaea genomes, which contains the segB gene, and the result showed that S1 site is highly conserved among these archaea members (Supplementary Figure S12). In addition, size exclusion chromatography measurement indicates that SegB (13.0 kDa) is a dimeric protein in solution, which is in agreement with previous results (27) (Supplementary Figure S3B). Upon addition of the 23-bp S1 DNA, we observed a high molecular weight peak (395.3 kDa) corresponding to the SegB–S1 DNA complex (Supplementary Figure S3B). We performed FP binding isotherm assays to further investigate the binding of SegB to S1 DNA. The result showed that SegB binds to the S1 DNA with high affinity (Kd = 0.18 μM) (Figure 1D; individual data are shown in Supplementary Figure S4B). This result is in agreement with the affinity that was previously observed (27). Unfortunately, during the crystallization trials, the full-length SegB protein lost its N-terminal region due to degradation. Therefore, we generated an N-terminal deletion construct, SegBΔ33 (residues 34–109), and examined the behavior of this truncated SegB protein in S1 DNA binding assays. As shown in Figure 1D, this N-terminal deletion construct can still bind to the S1 DNA (Kd = 0.28 μM). These results indicate that the N-terminal region (residues 1–33) of SegB may not directly participate in DNA binding, although the in vivo situation might be more complex. Since the DNA binding affinity of SegBΔ33 is only slightly lower than that of the full-length protein, it is plausible to speculate that the region downstream of residue 33 contains the DNA-binding domain of the protein.
SegB structure shows an RHH DNA-binding motif
SegB structure was determined using the multiwavelength anomalous dispersion method from Pt derivative (Supplementary Table S2). As previously stated, the full-length SegB protein undergoes degradation in the N-terminal region, and we observed only the protein structure spanning from residue 35 to the C-terminal end. As shown in Figure 3A, the SegB monomer folds into an elongated structure consisting of an N-terminal α-helix (α1) followed by one β-strand (β1) and three α-helices (α2, α3 and α4), with the longest dimension being 51 Å. The SegB molecule was observed as a dimer in the crystal structure (Figure 3B), which is consistent with the result obtained by size exclusion chromatography. The structure of these two monomers is almost the same with the r.m.s.d. of 0.4 Å (Cα positions). The monomer–monomer interaction in SegB is fairly strong with a buried surface area of 2463.9 Å2 calculated by PISA (42). As shown in Figure 3B, the intermolecular contact mainly involves the β1 strand of each monomer, which together build up an antiparallel β-sheet (β1 and β1′). In addition, α1–α4 helices from each monomer are all involved in dimer interactions. Based on the sequence alignment of the SegB Crenarchaea family, most of the residues involved in dimerization are conserved, except for Tyr46, Lys49 and Arg106 (Supplementary Figure S2B).
Figure 3.

Crystal structure of SegB and SegB–S1 DNA complex. (A) The SegB monomer molecule contains four α-helices (α1–α4) and one β-strand (β1). (B) SegB dimer structure in which individual monomers are colored in green and orange. (C) SegB–DNA complex. The DNA is colored in wheat, and the individual monomers are colored in green and orange. (D) Schematic diagram of SegB–S1 DNA interactions is displayed according to panel (C). Interacting residues are colored as green and orange for the two different monomers. The residues from the bottom dimer in panel (C) are labeled with an apostrophe. The interactions between SegB and the DNA are shown as solid arrows (H-bond), dash line arrows (electrostatic) and dash lines (hydrophobic).
To further investigate the structure–function relationship of SegB, we performed a structural homology search using the Dali server (43). Our results showed that the SegB protein folds into a ribbon–helix–helix (RHH) DNA-binding motif, which is similar to that found in plasmid-encoded partition protein ParG, omega repressor and the type II par system CBP ParR (44–47). Although the structures of these RHH proteins are similar (Supplementary Figure S13), the amino acid sequence alignment of these RHH motifs shows low level of identity. The r.m.s.d. values between SegB and ParG, omega or ParR are 0.7, 3.0 or 3.8 Å (in Cα), respectively. These r.m.s.d. values are calculated only based on the RHH motif regions.
The SegB–S1 DNA complex forms a chromatin-like superhelical structure
It has been shown that bacterial CBPs can use either helix–turn–helix (HTH) or RHH motifs for DNA binding (48). Prior to this study, AspA was the only reported CBP encoded from the archaeal Sulfolobus pNOB8 plasmid, which uses an HTH motif to recognize DNA (20). In contrast to AspA, SegB encoded by the chromosome of S. solfataricus harbors an RHH motif.
To explore the DNA binding difference between SegB and AspA, we determined the crystal structure of SegBΔ33–S1 DNA complex (Figure 3C and Supplementary Table S1). The S1 DNA site harbors a 23-bp imperfect palindromic motif (27). The structure exhibits a complex in which two SegBΔ33 dimers are bound to one S1 DNA site. Each dimer interacts with one half site of the S1 DNA and the two dimers are positioned on opposite sides of the DNA (Figure 3C). The SegBΔ33 dimer mainly uses the β-strand (β1 and β1′) in the RHH motif of each monomer to bind to the major groove of the S1 DNA (Figure 3C). In addition to the β1 strand, residues from helices α1, α2 and α3 also participate in S1 DNA binding. The detailed interactions between SegBΔ33 and the S1 DNA site are shown in Figure 3D.
Briefly, residues Lys52, Trp56 and Lys75 directly interact with S1 DNA bases through hydrogen bonds, whereas residues Trp56, Lys75, Ser77, Arg78, Lys81 and Arg106 interact with the phosphate backbone of S1 DNA. Interestingly, both Lys52 of the SegB dimer are inserted into the S1 site and have the strongest interaction with the S1 DNA site (Figure 3D). Residue Lys52 of SegB may play a pivotal role in site-specific DNA recognition. To further test this hypothesis, we constructed a SegB-K52A mutant and performed EMSA experiments. The data showed that the SegB-K52A mutant was entirely impaired in DNA binding (Supplementary Figure S14). The residue Lys52 is entirely conserved across the Crenarchaea family and is replaced by an arginine in euryarchaeal genera.
Surprisingly, we observed a corkscrew structure for the SegB–S1 DNA complex in the crystal packing (Figure 4A). In this higher order chromatin-like structure, SegB assembles into a left-handed protein matrix wrapping around the twisted right-handed S1 DNA. A previous study on ParR, a CBP from plasmid pSK41, has shown that the ParR dimer uses an RHH motif to bind to the centromere DNA and also forms a superhelical structure in the crystal packing (Figure 4B) (46). These multiple ParR dimers are located on the same side of the DNA to form a solenoid shape with a positively charged surface on one side and negatively charged surface on the other side, thus forming a superhelical structure (Figure 4B). However, this opposite charge surface distribution is not observed in the SegB superstructure. This divergent quaternary structure may be due to the different dimer–dimer interactions occurring in SegB and ParR. The interaction between dimers is mainly through loop α2–α3 (69HTVPGFKM76) in SegB and loop α1–α2 (25ENVPRGTK32) in ParR (Supplementary Figure S15). In addition, the Streptococcus pyogenes pSM19035-encoded omega model suggests that the protein forms a nucleoprotein complex by wrapping around DNA (Figure 4C) (45,49). Nevertheless, SegB wraps around DNA to form a corkscrew nucleoprotein complex (Figure 4A). Both SegB and omega wrap around DNA as a left-handed helix. The SegB dimer–dimer interaction is through the α2–α3 loop, whereas this interaction in omega is via helix α1.
Figure 4.

Higher order structure of SegB–S1 DNA and ParR–parC DNA complex. (A) Left: adjacent SegB dimers are shown as alternate green and orange molecules. The DNA molecule is in space filling and colored in gray. Right: SegB electrostatic surface charge and DNA (yellow). (B) The structure of ParR–parC DNA complex from PDB ID 2Q2K. Left: each ParR dimer is colored as blue or purple, alternatively. Right: ParR electrostatic potential surface and DNA (yellow). (C) The model of omega–parS DNA complex from PDB ID 2NBZ. Left: each omega dimer is colored as deep teal or limon, alternatively. Right: omega electrostatic potential surface and DNA (yellow).
It has been established that a phenomenon known as ‘DNA spreading’ plays an important role in DNA segregation mediated by HTH CBP (50–54). These CBPs bind to the specific cognate sites and then spread for several kilobases along the DNA through nonspecific interactions (45,46). No extensive spreading beyond the cognate DNA site has been observed for RHH CBPs (49). SegB binds to the palindromic S1 site and then is able to spread laterally onto the DNA region immediately next to the site, forming an extended complex. Additionally, DNase I footprint data have suggested that SegB might extend along nsDNA from its two specific binding sites (S1 and S2) in S. solfataricus (27). Based on the crystal packing and the wrapping feature observed for other RHH CBPs, SegB may wrap around the DNA region from S1 to S2 forming an extended complex.
Our result showed that the dimer–dimer contact at the α2–α3 loop interface in the SegB–DNA complex is mediated by several interactions, including two hydrogen bonds (Tyr68–Gly73 and Tyr68–Lys75), and hydrophobic interaction between Pro72 residues from each dimer. This indicates that the loop may play a role in enabling the formation of an extended complex on the DNA. Although the sequence similarity of this loop in SegB and ParR is low, the proline residue (Pro72 in SegB and Pro28 in ParR) is conserved in both loops.
The Pro72 residues are positioned in a face-to-face fashion to establish hydrophobic interactions (4.4 Å) between two adjacent SegB dimers, thereby allowing the formation of a SegB–S1 superhelical structure that may represent the extended nucleoprotein complex. This observation is consistent with the data of a previous report (27). However, the conserved proline Pro28 residues in ParR are positioned further apart (13.6 Å) and do not allow proline stacking. These observations indicate that the different dimer–dimer interactions would cause divergence in their protein–DNA complexes. Therefore, despite the conservation of the RHH DNA-binding motif in CBPs across bacteria and archaea, SegB and ParR may implement different mechanisms in assembling the partition complex in the two domains of life, and the hydrophobic α2–α3 SegB loop may be a crucial player in enabling the assembly of an extended complex on the DNA prior to chromosome segregation. To test this hypothesis, Pro72 was changed to glycine and a DNase I footprint experiment was performed with the mutant SegB-P72G protein to assess the extent of DNA binding. The results showed that the protection pattern corresponded to that observed in previous studies for WT SegB (27) that binds to the S1 and S2 sites and a third site S3 located at the start of the sso0033 gene. At higher SegB concentrations (1000–1500 nM), the regions of protection merged into a continuous window, indicating expanded binding of the protein over adjacent intervening DNA sequences (Supplementary Figure S16). In contrast, the mutant SegB-P72G was able to bind to the high-affinity S1 site, but no extended protection of the adjacent DNA region containing the other cognate sites and intervening sequences was observed even at the highest protein concentrations. This result validates the structural prediction that Pro72 in the α2–α3 SegB loop is a key residue to enable dimer–dimer interactions along the DNA and to facilitate continuous binding of extended DNA regions by SegB.
SegA promotes SegABS segrosome formation
To investigate the conformation of the whole segrosome (SegA–SegB–S1 DNA complex) in S. solfataricus, we used negative-stain EM to capture the structures of SegA–ATP, SegB–S1 DNA and the entire segrosome. No SegA and SegB proteins were observed in the absence of nucleotide (Figure 5A and I). This may be due to the small size of SegA and SegB molecules. However, in the presence of either ATP or ADP, we detected short SegA oligomers (Figure 5B and C). This phenomenon is consistent with that observed in a previous report indicating that nucleotides can mediate the assembly of SegA into oligomers (27). Interestingly, we observed a corkscrew shape conformation for the SegB–S1 DNA complex (Figure 5D), whose average width and length were 5 and 60–70 nm, respectively. Since the length of the S1 DNA fragment is ∼8 nm, the SegB–S1 DNA complex forms a superhelical structure composed of eight to nine repeating DNA fragments. These corkscrew-shaped complexes are also consistent with the SegB–S1 DNA complex structure observed in the crystal packing (Figure 4A) and the continuous extended DNA binding shown by the DNase I footprint (Supplementary Figure S16). These EM particles show an apparent periodicity (Figure 5D). SegB appears to wrap around the DNA, packaging it into chromatin-like solenoid fibers. Surprisingly, when we co-incubated SegA–ATP with SegB–S1 DNA, we observed compact rod-like (width 8–9 nm and length 30–40 nm) and arc-shaped particles (width 8–9 nm and diameter 30–35 nm) (Figure 5E). This indicates that in the presence of ATP SegA can promote interactions leading to segrosome formation (Figure 5E). These unique arc-shaped structures might be essential to accomplish DNA compaction prior to segregation. However, rod- or arc-shaped conformations disappeared when ADP was added instead of ATP (Figure 5F). This suggests that the role of the two nucleotides is not interchangeable.
Figure 5.

SegABS segrosome visualized by EM. (A) SegA only. (B) The SegA–ATP stumpy polymers. (C) The SegA–ADP. (D) SegB–S1 DNA. (E) The SegA–ATP–SegB–S1 DNA complex. Examples of SegAB–S1 DNA complexes forming rod-like and arc-shaped particles are highlighted in frame. (F) The SegA–ADP–SegB–S1 DNA complex. (G) The SegBΔ33–S1 DNA complex. (H) The SegA–ATP–SegBΔ33–S1 DNA complex. (I) SegB only. (J) The SegA–ATP–SegB–S1S2S3-600 DNA. (K) The SegA–ATP–S1S2S3-600 DNA. (L) The SegB–S1S2S3-600 DNA. Scale bar = 50 nm.
In addition, we used a 600-bp DNA fragment containing the three specific S1, S2 and S3 sites (S1S2S3-600) to further confirm the formation of arc-shaped segrosomes observed with the short S1 DNA (Figure 5E). As expected, we observed arc- and ring-like structures with the long DNA fragment, when all the components are added (Figure 5J). However, these structures were not detected when either SegA or SegB alone binds to the S1S2S3-600 DNA fragment (Figure 5K and L). In contrast to that observed with the short S1 DNA, we also observed the phenomenon of multiple entangled DNA fragments, when using the longer DNA fragment. This phenomenon may relate to further chromosome organization (Figure 5J).
The N-terminus of SegB participates in the interaction with SegA
To further investigate which region of SegB interacts with SegA to form a segrosome complex, we purified the SegBΔ33 protein that lacks the N-terminal residues 1–33. As shown in Figure 5G, EM image revealed that the SegBΔ33–S1 DNA complex is similar to the full-length SegB–S1 DNA complex (Figure 5D). The result implies that SegBΔ33 can still wrap around the S1 DNA to form a stable corkscrew structure. Furthermore, we incubated SegA–ATP and SegBΔ33–S1 DNA together. Unsurprisingly, we did not see rod or arc-like particles, but only corkscrew structures (Figure 5H). This closely mirrors what was observed for the full-length SegB–S1 DNA complex (Figure 5D), and suggests that SegB N-terminal region (residues 1–33) participates in the SegB–SegA interaction. Additionally, we performed cross-linking experiments coupled with mass spectrometry. The result showed that there are multiple interactions between SegA and SegB, and the most significant interaction is between SegA Lys9 and SegB Lys9 (Supplementary Table S3). Moreover, the arc-shaped molecules might represent a conformation of the segrosome, and ATP is essential to mediate the formation of this complex.
SegB is a key player in stimulating SegA ATPase activity
SegA has a low level of intrinsic ATPase activity (Figure 1C) (27). The ATPase activity of bacterial ParA is stimulated by its centromere-binding partner (1,4). Several examples illustrate this phenomenon. First, in ParABS systems, the ATP hydrolysis of ParA is enhanced by ParB (12,55,56). Second, the ATP hydrolysis of plasmid TP288 ParF (ParA family) is promoted by the N-terminal region of ParG (57). Similarly, the ATPase activity of the pSM19035-encoded delta (ParA family) is stimulated by the omega partner (58). Third, Helicobacter pylori Spo0J (ParB) can stimulate the ATPase activity of Soj (ParA) and regulates its dimerization (32). Therefore, other components of the SegAB system might be required to stimulate the ATPase activity of SegA to fulfill the process of chromosome segregation. To this end, we examined the ATPase activity of SegA in the presence of either SegB or S1 DNA, and when incubated with both. As shown in Figure 1C, SegB or S1 DNA stimulates the ATPase activity of SegA only slightly. Upon addition of both SegB and S1 DNA, the SegA ATPase activity dramatically increased 1000-fold, up to 1230 μM ATP hydrolyzed/h (Figure 1C). However, this enhancement is abolished when the WT SegB is replaced by SegBΔ33 deletion mutant (Figure 1C). To narrow down the interaction region of SegB, we also constructed a SegBΔ21 deletion mutant, and established that this mutant does not stimulate the ATPase activity of SegA either (Figure 1C). This finding suggests that the residues 1–21 of SegB may serve as a SegA ATPase activating domain. Moreover, our EM data showed that the interaction between SegA and SegB was altered when the N-terminal of SegB was deleted (Figure 5H).
DISCUSSION
Multiple DNA binding regions in SegA may mediate DNA organization
To date, most studies on genome segregation have focused on bacterial systems such as ParABS. Members of the ParA superfamily exhibit a sandwich dimer, when bound to ATP. The sandwich dimers of HpSoj and pNOB8 ParA are characterized by single and double DNA binding modes in their DNA complexes, respectively (Supplementary Figure S8C–F) (32,59). HpSoj–DNA complex reveals that ParA binds to one DNA molecule through a furrow-shaped structure formed by the sandwich dimer (Supplementary Figure S8C and D). In contrast, pNOB8 ParA uses multiple faces to bind two DNA molecules (Supplementary Figure S8E and F). Although both HpSoj and pNOB8 ParA form sandwich dimers, the two proteins use different regions for DNA binding and require the presence of ATP. In contrast to sandwich dimer ParA proteins, SegA forms a unique forward–backward dimer in which ATP is not essential for DNA binding, but it can enhance it. In addition, the SegA dimer binds four DNA molecules, and each monomer associates with two DNA sites/fragments through regions I and II in a parallel orientation (Figure 2C and Supplementary Figure S8G and H). Surprisingly, the SegA forward–backward dimer binds multiple DNA molecules, bringing them in close proximity (Supplementary Figure S8H). Our crystal structure showed that DNA binding region I binds to the end of DNA; this is an unusual binding mode in physiological conditions. To rationalize this finding, the natural Sulfolobus habitat should be considered. Sulfolobus solfataricus is a hyperthermoacidophilic archaeon, which is often exposed to harsh environments such as extreme temperature and pH. These extreme conditions raise the probabilities for DNA damaging events like double-strand break (60). In fact, Sulfolobus spp. cells have been found to have delayed G2/M transition in order to respond to DNA damage or incomplete replication of chromosomes (23,26). Therefore, the SegA protein may play a protective role by binding to broken ends of the DNA before the DNA is repaired. In addition, if SegA region I is not involved in DNA binding, a possible function of region I might be to participate in protein–protein interactions, such as interaction with SegB. Region I is close to the ATP binding pocket in SegA. When SegB is added, the ATPase activity is dramatically increased in the presence of DNA (Figure 1C), which also means that region I may be an interaction site for SegB. However, no SegB molecules were added, when growing the SegA crystals, so DNA molecules had a chance to occupy region I. This unique DNA binding feature revealed by the structure of the SegA–DNA complex suggests a role of SegA in chromosome DNA organization or compaction in S. solfataricus cells. Harboring multiple DNA binding regions involved in chromosome organization might correlate with the needs imposed by a life at high temperature, which might require a higher number of protein–DNA interactions as compared to the mesophilic bacterial counterparts.
SegB plays a role as activating factor for SegA
The typical ParA sandwich dimer harbors an important residue called ‘signature lysine’ located in the highly conserved Walker A box GKGGhGK[S/T] (61). The side chain of this ‘signature lysine’ from one monomer is inserted into the ATP binding pocket of the other monomer, thereby stimulating the hydrolysis of ATP. Although this ‘signature lysine’ is conserved in the SegA protein, it does not play the same role in SegA ‘forward–backward’ dimer. In contrast, the conserved lysine residue (Lys9) in SegA faces the phosphate backbone of the DNA. This may explain why ATP is not essential for SegA–DNA binding. Given that SegA and ParA have different DNA binding features, SegA may be classified as a novel Walker-type ATPase for DNA segregation. A previous study (27) and our data showed that SegA is characterized by a rather low ATPase activity only above background level (Figure 1C). These results suggested that SegA may need some other components to enhance its ATPase activity during the segregation process.
In our study, the ATPase activity of SegA is dramatically increased by adding both SegB and S1 DNA (Figure 1C), which may help SegA to successfully accomplish its function. The observation that SegBΔ21 fails to enhance ATP hydrolysis by SegA indicates that the unfolded 21-amino acid N-terminus of SegB harbors the residue or residues responsible for stimulation of SegA enzymatic activity. The flexible N-terminal tail of the RHH structural homologue ParG has been shown to enhance ParF ATP hydrolysis through an arginine finger motif: the R19 residue is provided in trans to complement the catalytic pocket and stabilize the transition state (57). It remains to be elucidated whether a residue (or more amino acids) in the N-terminal tip of SegB might work as the arginine finger present in ParG or whether the stimulation might operate through a different mechanism, for example through the action of an in trans ‘signature’ lysine residue. Overall, our results suggest that SegB may need to bind to the S1 DNA first. The binding might induce a conformational change, thereby forcing the N-terminal tip of SegB to become exposed and interact with SegA stimulating its ATPase activity.
The SegABS segrosome might bring about chromosome organization
During the eukaryotic cell cycle phase spanning from G2 to M, chromosomes are condensed, organized for separation and then undergo segregation. The steps of chromosome organization and compaction precede sister chromatid segregation (2,62). In bacteria, chromosome-encoded ParB proteins adopt an HTH motif to associate with multiple parS sites, bridging nonadjacent DNA regions into a higher order partition complex and further recruiting structural maintenance of chromosome proteins for chromosome compaction (50,63,64). CBPs of type Ib and type II bacterial partition systems instead display an RHH motif to bind to the repeats of the partition site (44–47,49,58,65). The discovery that the archaeal segregation protein SegB harbors an RHH fold to bind its cognate DNA site S1 points to an evolutionary conservation of the RHH motif in CBPs across bacteria and archaea. The nature of centromeres recognized by RHH segregation proteins is such that multiple dimers bind site specifically to adjacent repeats, displaying a high level of cooperativity (44–46,66).
In this study, we have found that the S. solfataricus SegB protein binds to the centromere site S1 leading to the assembly of characteristic corkscrew-shaped complexes (SegB–DNA complexes) (Figures 4A and 5D). These assemblies are likely to consist of multiple S1 centromere sites, residing on different DNA fragments, that become anchored to one another by the wrapping action of SegB. The DNA wrapping and organizing actions mediated by SegB lead to packaging of the DNA into a chromatin-like fiber. In addition, SegB binding to the S1S2S3-600 DNA suggests that these two actions may first bind in a specific region (Figure 5L). Upon addition of SegA, this protein establishes interactions with both components of the SegB–DNA complexes, inducing DNA bending and forming arc-shaped segrosomes (SegABS complexes) (Figure 5E and J). The arc-shaped segrosome conformation entails chromosome compaction and, overall, it exhibits a shape reminiscent of that of the ParR–parC ring-like segregation complex of plasmid pSK41 (46,47). Moreover, when the longer S1S2S3-600 DNA is used, SegABS segrosomes assemble into one or two ring-like complexes, suggesting a histone-like compaction feature. The SegABS arc-shaped segrosomes have a diameter of 30–35 nm, whose size is close to the looping size of 40 nm fibers of bacterial histone-like proteins (67). This result suggests that the SegABS segrosome might have a role in chromosome organization. However, the establishment of the solenoid-shaped structure of the ParR–parC complex or histone-like proteins does not require the contribution of the NTPase protein, whereas the assembly of the arc-shaped SegABS segrosome necessitates all the three components to bring about DNA compaction. These observations suggest that DNA compaction by the SegABS complex is regulated by multiple DNA wrapping, bending and looping events. DNA compaction by the SegABS complex might take place prior to chromosome segregation. Our cross-linking data show a number of interactions between SegA and SegB, with interacting residues scattered across the full length of SegB (Supplementary Table S3). However, the SegA ATPase stimulation effect and the assembly of the arc-shaped particles were abolished, when the SegB N-terminus was deleted (Figures 1C and 5H). These findings imply that the flexible SegB N-terminal region not only has a catalytic function in enhancing SegA ATPase activity, but also plays a structural regulatory role in enabling SegA to mediate DNA bending and looping.
Based on these results, we propose a possible speculative model for how SegABS segrosome assembly might contribute to chromosome organization before segregation (Figure 6). First, the SegB dimer associates with the specific sites, S1, S2 and S3, and then SegB dimers extend on and wrap the nearby nsDNA sequences. The region spanning from S1 to S3 and nearby DNA form a corkscrew-shaped partition complex as a consequence of SegB binding. Upon addition of SegA, the DNA is bent and looped into arc- or ring-like SegABS complexes, which could consist of one, two or multiple looping circles. This arc- or ring-like segrosome is regulated by the ATP state of SegA (Figure 5E and J). Interestingly, high chromosome organization and compaction were observed in G2 phase in Sulfolobus ssp. cells (23), which suggests that chromosome organization is an essential process prior to chromosome segregation. Therefore, SegABS segrosome formation could play a key role in chromosome organization at centromere sites, although more evidence will be needed to verify this hypothesis.
Figure 6.
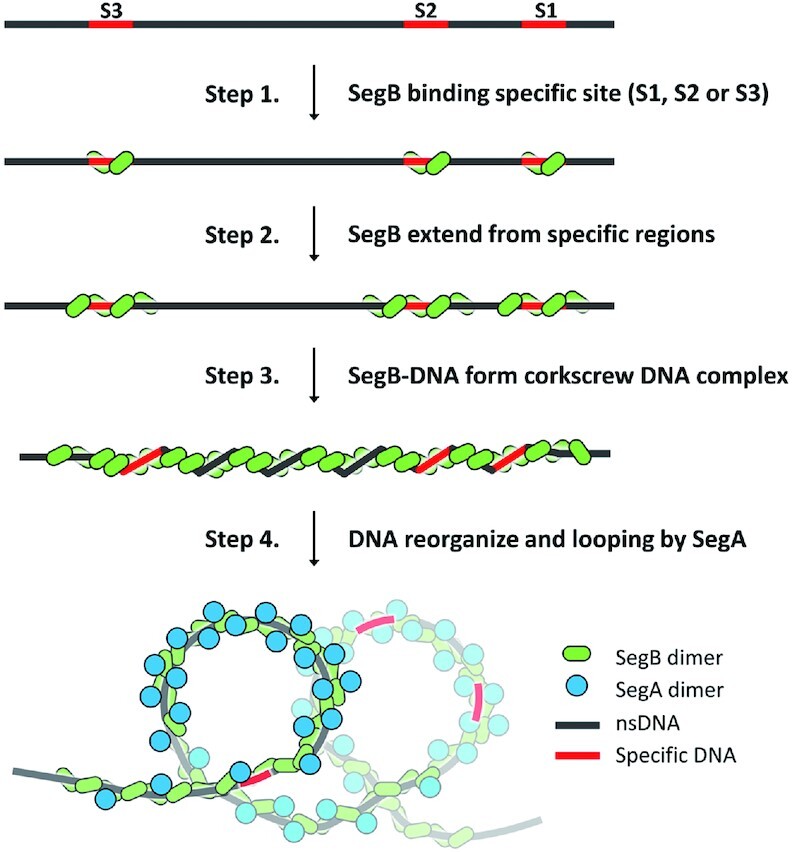
A speculative model for SegA-dependent SegABS segrosome formation. The proposed mechanism includes four functional steps: (1) initial SegB binding to cognate sites; (2) SegB binding to adjacent DNA regions; (3) SegB prompting DNA organization; and (4) segrosome formation induced by SegA in the ATP-bound state.
Although the usage of a ParA-based segregation machinery is evolutionarily conserved across bacteria and archaea, the mechanics and timing of chromosome segregation exhibit substantial differences in the two domains. SegA displays a novel forward–backward dimer configuration that relieves the need of ATP to bind DNA and highlights a divergence from bacterial Walker A ParA orthologues. The unstructured N-terminal tail of SegB stimulates ATP hydrolysis by SegA similarly to bacterial RHH CBPs. However, the architectural role performed by this region in assembly of the segrosome adds a new feature to the properties of CBPs. Taken together, our findings unlock mechanistic details underpinning segrosome formation in archaea and contribute novel insights into chromosome organization and segregation in the third domain of life.
DATA AVAILABILITY
The atomic coordinates and structure factors have been deposited in the Protein Data Bank (https://www.rcsb.org/pdb) with PDB ID codes 7DUT (SegA–ADP), 7DV3 (SegA–AMPPNP), 7DWR (SegA–ADP–DNA), 7DUV (SegB) and 7DV2 (SegBΔ33–DNA).
Supplementary Material
ACKNOWLEDGEMENTS
We are grateful for the access to the synchrotron radiation beamlines TPS05A and TLS15A at the National Synchrotron Radiation Research Center in Taiwan. We also acknowledge the use of EM in the image core facility, biophysics core facility and bioinformatics core at the Institute of Molecular Biology, Academia Sinica, and the Macromolecular X-ray Crystallographic Center of National Tsing Hua University. We thank Chris Taylor and Adam Dowle from the Department of Biology Metabolomics & Proteomics Facility (University of York) for help and advice.
Contributor Information
Cheng-Yi Yen, Institute of Bioinformatics and Structural Biology, National Tsing Hua University, Hsinchu 300, Taiwan.
Min-Guan Lin, Institute of Molecular Biology, Academia Sinica, Taipei 115, Taiwan.
Bo-Wei Chen, Institute of Molecular Biology, Academia Sinica, Taipei 115, Taiwan.
Irene W Ng, Department of Biology, University of York, Wentworth Way, York YO10 5DD, UK.
Nicholas Read, Department of Biology, University of York, Wentworth Way, York YO10 5DD, UK.
Azhar F Kabli, Department of Biology, University of York, Wentworth Way, York YO10 5DD, UK.
Che-Ting Wu, Institute of Bioinformatics and Structural Biology, National Tsing Hua University, Hsinchu 300, Taiwan.
Yo-You Shen, Institute of Molecular Biology, Academia Sinica, Taipei 115, Taiwan.
Chen-Hao Chen, Institute of Bioinformatics and Structural Biology, National Tsing Hua University, Hsinchu 300, Taiwan.
Daniela Barillà, Department of Biology, University of York, Wentworth Way, York YO10 5DD, UK.
Yuh-Ju Sun, Institute of Bioinformatics and Structural Biology, National Tsing Hua University, Hsinchu 300, Taiwan.
Chwan-Deng Hsiao, Institute of Molecular Biology, Academia Sinica, Taipei 115, Taiwan.
SUPPLEMENTARY DATA
Supplementary Data are available at NAR Online.
FUNDING
Academia Sinica; Ministry of Science and Technology, Taiwan [107-2311-B-001-032-MY3 and 107-2311-B-001-033-MY3 to C.-D.H., 106-2311-B-007-007-MY3, 107-2321-B-007-004, 108-2321-B-007-002 and 109-2321-B-007-001 to Y.-J.S.]; Biotechnology and Biological Sciences Research Council [BB/M007839/1 and BB/R006369/1 to D.B.]. Funding for open access charge: Ministry of Science and Technology, Taiwan [110-2311-B-001-008].
Conflict of interest statement. None declared.
REFERENCES
- 1. Hayes F., Barilla D.. The bacterial segrosome: a dynamic nucleoprotein machine for DNA trafficking and segregation. Nat. Rev. Microbiol. 2006; 4:133–143. [DOI] [PubMed] [Google Scholar]
- 2. Prosser S.L., Pelletier L.. Mitotic spindle assembly in animal cells: a fine balancing act. Nat. Rev. Mol. Cell Biol. 2017; 18:187–201. [DOI] [PubMed] [Google Scholar]
- 3. Hurtgen D., Murray S.M., Mascarenhas J., Sourjik V.. DNA segregation in natural and synthetic minimal systems. Adv. Biosyst. 2019; 3:e1800316. [DOI] [PubMed] [Google Scholar]
- 4. Baxter J.C., Funnell B.E.. Plasmid partition mechanisms. Microbiol. Spectr. 2014; 2:6. [DOI] [PubMed] [Google Scholar]
- 5. Gerdes K., Howard M., Szardenings F.. Pushing and pulling in prokaryotic DNA segregation. Cell. 2010; 141:927–942. [DOI] [PubMed] [Google Scholar]
- 6. Yamaichi Y., Niki H.. Active segregation by the Bacillus subtilis partitioning system in Escherichia coli. Proc. Natl Acad. Sci. U.S.A. 2000; 97:14656–14661. [DOI] [PMC free article] [PubMed] [Google Scholar]
- 7. Livny J., Yamaichi Y., Waldor M.K.. Distribution of centromere-like parS sites in bacteria: insights from comparative genomics. J. Bacteriol. 2007; 189:8693–8703. [DOI] [PMC free article] [PubMed] [Google Scholar]
- 8. Szardenings F., Guymer D., Gerdes K.. ParA ATPases can move and position DNA and subcellular structures. Curr. Opin. Microbiol. 2011; 14:712–718. [DOI] [PubMed] [Google Scholar]
- 9. Jensen R.B., Gerdes K.. Partitioning of plasmid R1. The ParM protein exhibits ATPase activity and interacts with the centromere-like ParR–parC complex. J. Mol. Biol. 1997; 269:505–513. [DOI] [PubMed] [Google Scholar]
- 10. Garner E.C., Campbell C.S., Mullins R.D.. Dynamic instability in a DNA-segregating prokaryotic actin homolog. Science. 2004; 306:1021–1025. [DOI] [PubMed] [Google Scholar]
- 11. Orlova A., Garner E.C., Galkin V.E., Heuser J., Mullins R.D., Egelman E.H.. The structure of bacterial ParM filaments. Nat. Struct. Mol. Biol. 2007; 14:921–926. [DOI] [PMC free article] [PubMed] [Google Scholar]
- 12. Lim H.C., Surovtsev I.V., Beltran B.G., Huang F., Bewersdorf J., Jacobs-Wagner C.. Evidence for a DNA-relay mechanism in ParABS-mediated chromosome segregation. eLife. 2014; 3:e02758. [DOI] [PMC free article] [PubMed] [Google Scholar]
- 13. Surovtsev I.V., Campos M., Jacobs-Wagner C.. DNA-relay mechanism is sufficient to explain ParA-dependent intracellular transport and patterning of single and multiple cargos. Proc. Natl Acad. Sci. U.S.A. 2016; 113:E7268–E7276. [DOI] [PMC free article] [PubMed] [Google Scholar]
- 14. Le Gall A., Cattoni D.I., Guilhas B., Mathieu-Demaziere C., Oudjedi L., Fiche J.B., Rech J., Abrahamsson S., Murray H., Bouet J.Y.et al.. Bacterial partition complexes segregate within the volume of the nucleoid. Nat. Commun. 2016; 7:12107. [DOI] [PMC free article] [PubMed] [Google Scholar]
- 15. McLeod B.N., Allison-Gamble G.E., Barge M.T., Tonthat N.K., Schumacher M.A., Hayes F., Barilla D.. A three-dimensional ParF meshwork assembles through the nucleoid to mediate plasmid segregation. Nucleic Acids Res. 2017; 45:3158–3171. [DOI] [PMC free article] [PubMed] [Google Scholar]
- 16. Spang A., Saw J.H., Jorgensen S.L., Zaremba-Niedzwiedzka K., Martijn J., Lind A.E., van Eijk R., Schleper C., Guy L., Ettema T.J.G.. Complex archaea that bridge the gap between prokaryotes and eukaryotes. Nature. 2015; 521:173–179. [DOI] [PMC free article] [PubMed] [Google Scholar]
- 17. Eme L., Spang A., Lombard J., Stairs C.W., Ettema T.J.G.. Archaea and the origin of eukaryotes. Nat. Rev. Microbiol. 2017; 15:711–723. [DOI] [PubMed] [Google Scholar]
- 18. Brueckner J., Martin W.F.. Bacterial genes outnumber archaeal genes in eukaryotic genomes. Genome Biol. Evol. 2020; 12:282–292. [DOI] [PMC free article] [PubMed] [Google Scholar]
- 19. Barilla D. Driving apart and segregating genomes in Archaea. Trends Microbiol. 2016; 24:957–967. [DOI] [PMC free article] [PubMed] [Google Scholar]
- 20. Schumacher M.A., Tonthat N.K., Lee J., Rodriguez-Castaneda F.A., Chinnam N.B., Kalliomaa-Sanford A.K., Ng I.W., Barge M.T., Shaw P.L., Barilla D.. Structures of archaeal DNA segregation machinery reveal bacterial and eukaryotic linkages. Science. 2015; 349:1120–1124. [DOI] [PMC free article] [PubMed] [Google Scholar]
- 21. Schleper C., Holz I., Janekovic D., Murphy J., Zillig W.. A multicopy plasmid of the extremely thermophilic archaeon Sulfolobus effects its transfer to recipients by mating. J. Bacteriol. 1995; 177:4417–4426. [DOI] [PMC free article] [PubMed] [Google Scholar]
- 22. She Q., Phan H., Garrett R.A., Albers S.V., Stedman K.M., Zillig W.. Genetic profile of pNOB8 from Sulfolobus: the first conjugative plasmid from an archaeon. Extremophiles. 1998; 2:417–425. [DOI] [PubMed] [Google Scholar]
- 23. Poplawski A., Bernander R.. Nucleoid structure and distribution in thermophilic Archaea. J. Bacteriol. 1997; 179:7625–7630. [DOI] [PMC free article] [PubMed] [Google Scholar]
- 24. Ptacin J.L., Lee S.F., Garner E.C., Toro E., Eckart M., Comolli L.R., Moerner W.E., Shapiro L.. A spindle-like apparatus guides bacterial chromosome segregation. Nat. Cell Biol. 2010; 12:791–798. [DOI] [PMC free article] [PubMed] [Google Scholar]
- 25. Wang X., Montero Llopis P., Rudner D.Z.. Organization and segregation of bacterial chromosomes. Nat. Rev. Genet. 2013; 14:191–203. [DOI] [PMC free article] [PubMed] [Google Scholar]
- 26. Robinson N.P., Blood K.A., McCallum S.A., Edwards P.A., Bell S.D.. Sister chromatid junctions in the hyperthermophilic archaeon Sulfolobus solfataricus. EMBO J. 2007; 26:816–824. [DOI] [PMC free article] [PubMed] [Google Scholar]
- 27. Kalliomaa-Sanford A.K., Rodriguez-Castaneda F.A., McLeod B.N., Latorre-Rosello V., Smith J.H., Reimann J., Albers S.V., Barilla D.. Chromosome segregation in Archaea mediated by a hybrid DNA partition machine. Proc. Natl Acad. Sci. U.S.A. 2012; 109:3754–3759. [DOI] [PMC free article] [PubMed] [Google Scholar]
- 28. She Q., Singh R.K., Confalonieri F., Zivanovic Y., Allard G., Awayez M.J., Chan-Weiher C.C., Clausen I.G., Curtis B.A., De Moors A.et al.. The complete genome of the crenarchaeon Sulfolobus solfataricus P2. Proc. Natl Acad. Sci. U.S.A. 2001; 98:7835–7840. [DOI] [PMC free article] [PubMed] [Google Scholar]
- 29. Lindas A.C., Bernander R.. The cell cycle of Archaea. Nat. Rev. Microbiol. 2013; 11:627–638. [DOI] [PubMed] [Google Scholar]
- 30. Otwinowski Z., Minor W.. Processing of X-ray diffraction data collected in oscillation mode. Methods Enzymol. 1997; 276:307–326. [DOI] [PubMed] [Google Scholar]
- 31. Mccoy A.J., Grosse-Kunstleve R.W., Adams P.D., Winn M.D., Storoni L.C., Read R.J.. Phaser crystallographic software. J. Appl. Crystallogr. 2007; 40:658–674. [DOI] [PMC free article] [PubMed] [Google Scholar]
- 32. Chu C.H., Yen C.Y., Chen B.W., Lin M.G., Wang L.H., Tang K.Z., Hsiao C.D., Sun Y.J.. Crystal structures of HpSoj–DNA complexes and the nucleoid–adaptor complex formation in chromosome segregation. Nucleic Acids Res. 2019; 47:2113–2129. [DOI] [PMC free article] [PubMed] [Google Scholar]
- 33. Terwilliger T.C., Adams P.D., Read R.J., McCoy A.J., Moriarty N.W., Grosse-Kunstleve R.W., Afonine P.V., Zwart P.H., Hung L.W.. Decision-making in structure solution using Bayesian estimates of map quality: the PHENIX AutoSol wizard. Acta Crystallogr. D: Biol. Crystallogr. 2009; 65:582–601. [DOI] [PMC free article] [PubMed] [Google Scholar]
- 34. Terwilliger T.C., Grosse-Kunstleve R.W., Afonine P.V., Moriarty N.W., Zwart P.H., Hung L.W., Read R.J., Adams P.D.. Iterative model building, structure refinement and density modification with the PHENIX AutoBuild wizard. Acta Crystallogr. D: Biol. Crystallogr. 2008; 64:61–69. [DOI] [PMC free article] [PubMed] [Google Scholar]
- 35. Emsley P., Cowtan K.. Coot: model-building tools for molecular graphics. Acta Crystallogr. D: Biol. Crystallogr. 2004; 60:2126–2132. [DOI] [PubMed] [Google Scholar]
- 36. Kirchgesser M., Dahlmann N.. A colorimetric assay for the determination of acid nucleoside triphosphatase activity. J. Clin. Chem. Clin. Biochem. 1990; 28:407–411. [DOI] [PubMed] [Google Scholar]
- 37. Motallebi-Veshareh M., Rouch D.A., Thomas C.M.. A family of ATPases involved in active partitioning of diverse bacterial plasmids. Mol. Microbiol. 1990; 4:1455–1463. [DOI] [PubMed] [Google Scholar]
- 38. Leonard T.A., Butler P.J., Lowe J.. Bacterial chromosome segregation: structure and DNA binding of the Soj dimer: a conserved biological switch. EMBO J. 2005; 24:270–282. [DOI] [PMC free article] [PubMed] [Google Scholar]
- 39. Quisel J.D., Lin D.C., Grossman A.D.. Control of development by altered localization of a transcription factor in B. subtilis. Mol. Cell. 1999; 4:665–672. [DOI] [PubMed] [Google Scholar]
- 40. Barilla D., Rosenberg M.F., Nobbmann U., Hayes F.. Bacterial DNA segregation dynamics mediated by the polymerizing protein ParF. EMBO J. 2005; 24:1453–1464. [DOI] [PMC free article] [PubMed] [Google Scholar]
- 41. Dunham T.D., Xu W., Funnell B.E., Schumacher M.A.. Structural basis for ADP-mediated transcriptional regulation by P1 and P7 ParA. EMBO J. 2009; 28:1792–1802. [DOI] [PMC free article] [PubMed] [Google Scholar]
- 42. Krissinel E., Henrick K.. Inference of macromolecular assemblies from crystalline state. J. Mol. Biol. 2007; 372:774–797. [DOI] [PubMed] [Google Scholar]
- 43. Holm L., Laakso L.M.. Dali server update. Nucleic Acids Res. 2016; 44:W351–W355. [DOI] [PMC free article] [PubMed] [Google Scholar]
- 44. Golovanov A.P., Barilla D., Golovanova M., Hayes F., Lian L.Y.. ParG, a protein required for active partition of bacterial plasmids, has a dimeric ribbon–helix–helix structure. Mol. Microbiol. 2003; 50:1141–1153. [DOI] [PubMed] [Google Scholar]
- 45. Weihofen W.A., Cicek A., Pratto F., Alonso J.C., Saenger W.. Structures of omega repressors bound to direct and inverted DNA repeats explain modulation of transcription. Nucleic Acids Res. 2006; 34:1450–1458. [DOI] [PMC free article] [PubMed] [Google Scholar]
- 46. Schumacher M.A., Glover T.C., Brzoska A.J., Jensen S.O., Dunham T.D., Skurray R.A., Firth N.. Segrosome structure revealed by a complex of ParR with centromere DNA. Nature. 2007; 450:1268–1271. [DOI] [PubMed] [Google Scholar]
- 47. Moller-Jensen J., Ringgaard S., Mercogliano C.P., Gerdes K., Lowe J.. Structural analysis of the ParR/parC plasmid partition complex. EMBO J. 2007; 26:4413–4422. [DOI] [PMC free article] [PubMed] [Google Scholar]
- 48. Schumacher M.A. Structural biology of plasmid partition: uncovering the molecular mechanisms of DNA segregation. Biochem. J. 2008; 412:1–18. [DOI] [PubMed] [Google Scholar]
- 49. Soberon N.E., Lioy V.S., Pratto F., Volante A., Alonso J.C.. Molecular anatomy of the Streptococcus pyogenes pSM19035 partition and segrosome complexes. Nucleic Acids Res. 2011; 39:2624–2637. [DOI] [PMC free article] [PubMed] [Google Scholar]
- 50. Graham T.G., Wang X., Song D., Etson C.M., van Oijen A.M., Rudner D.Z., Loparo J.J.. ParB spreading requires DNA bridging. Genes Dev. 2014; 28:1228–1238. [DOI] [PMC free article] [PubMed] [Google Scholar]
- 51. Chen B.W., Lin M.H., Chu C.H., Hsu C.E., Sun Y.J.. Insights into ParB spreading from the complex structure of Spo0J and parS. Proc. Natl Acad. Sci. U.S.A. 2015; 112:6613–6618. [DOI] [PMC free article] [PubMed] [Google Scholar]
- 52. Rodionov O., Lobocka M., Yarmolinsky M.. Silencing of genes flanking the P1 plasmid centromere. Science. 1999; 283:546–549. [DOI] [PubMed] [Google Scholar]
- 53. Murray H., Ferreira H., Errington J.. The bacterial chromosome segregation protein Spo0J spreads along DNA from parS nucleation sites. Mol. Microbiol. 2006; 61:1352–1361. [DOI] [PubMed] [Google Scholar]
- 54. Breier A.M., Grossman A.D.. Whole-genome analysis of the chromosome partitioning and sporulation protein Spo0J (ParB) reveals spreading and origin-distal sites on the Bacillus subtilis chromosome. Mol. Microbiol. 2007; 64:703–718. [DOI] [PubMed] [Google Scholar]
- 55. Davis M.A., Martin K.A., Austin S.J.. Biochemical activities of the parA partition protein of the P1 plasmid. Mol. Microbiol. 1992; 6:1141–1147. [DOI] [PubMed] [Google Scholar]
- 56. Ah-Seng Y., Lopez F., Pasta F., Lane D., Bouet J.Y.. Dual role of DNA in regulating ATP hydrolysis by the SopA partition protein. J. Biol. Chem. 2009; 284:30067–30075. [DOI] [PMC free article] [PubMed] [Google Scholar]
- 57. Barilla D., Carmelo E., Hayes F.. The tail of the ParG DNA segregation protein remodels ParF polymers and enhances ATP hydrolysis via an arginine finger-like motif. Proc. Natl Acad. Sci U.S.A. 2007; 104:1811–1816. [DOI] [PMC free article] [PubMed] [Google Scholar]
- 58. Pratto F., Cicek A., Weihofen W.A., Lurz R., Saenger W., Alonso J.C.. Streptococcus pyogenes pSM19035 requires dynamic assembly of ATP-bound ParA and ParB on parS DNA during plasmid segregation. Nucleic Acids Res. 2008; 36:3676–3689. [DOI] [PMC free article] [PubMed] [Google Scholar]
- 59. Zhang H., Schumacher M.A.. Structures of partition protein ParA with nonspecific DNA and ParB effector reveal molecular insights into principles governing Walker-box DNA segregation. Genes Dev. 2017; 31:481–492. [DOI] [PMC free article] [PubMed] [Google Scholar]
- 60. White M.F., Allers T.. DNA repair in the archaea: an emerging picture. FEMS Microbiol. Rev. 2018; 42:514–526. [DOI] [PubMed] [Google Scholar]
- 61. Leipe D.D., Wolf Y.I., Koonin E.V., Aravind L.. Classification and evolution of P-loop GTPases and related ATPases. J. Mol. Biol. 2002; 317:41–72. [DOI] [PubMed] [Google Scholar]
- 62. Skibbens R.V. Condensins and cohesins: one of these things is not like the other!. J. Cell Sci. 2019; 132:s220491. [DOI] [PMC free article] [PubMed] [Google Scholar]
- 63. Kawalek A., Wawrzyniak P., Bartosik A.A., Jagura-Burdzy G.. Rules and exceptions: the role of chromosomal ParB in DNA segregation and other cellular processes. Microorganisms. 2020; 8:105. [DOI] [PMC free article] [PubMed] [Google Scholar]
- 64. Burmann F., Gruber S.. SMC condensin: promoting cohesion of replicon arms. Nat. Struct. Mol. Biol. 2015; 22:653–655. [DOI] [PubMed] [Google Scholar]
- 65. Huang L., Yin P., Zhu X., Zhang Y., Ye K.. Crystal structure and centromere binding of the plasmid segregation protein ParB from pCXC100. Nucleic Acids Res. 2011; 39:2954–2968. [DOI] [PMC free article] [PubMed] [Google Scholar]
- 66. Schreiter E.R., Drennan C.L.. Ribbon–helix–helix transcription factors: variations on a theme. Nat. Rev. Microbiol. 2007; 5:710–720. [DOI] [PubMed] [Google Scholar]
- 67. Kim J., Yoshimura S.H., Hizume K., Ohniwa R.L., Ishihama A., Takeyasu K.. Fundamental structural units of the Escherichia coli nucleoid revealed by atomic force microscopy. Nucleic Acids Res. 2004; 32:1982–1992. [DOI] [PMC free article] [PubMed] [Google Scholar]
Associated Data
This section collects any data citations, data availability statements, or supplementary materials included in this article.
Supplementary Materials
Data Availability Statement
The atomic coordinates and structure factors have been deposited in the Protein Data Bank (https://www.rcsb.org/pdb) with PDB ID codes 7DUT (SegA–ADP), 7DV3 (SegA–AMPPNP), 7DWR (SegA–ADP–DNA), 7DUV (SegB) and 7DV2 (SegBΔ33–DNA).